observations in numerical weather prediction harald …€“ profile – radiosonde and aircraft...
TRANSCRIPT

Meteorologisk institutt met.no
Observations in Numerical Weather
Prediction
Harald Schyberg

Meteorologisk institutt met.no
Observations for assimilation in NWP
What we have learned so far:
• We need to be able to model or estimate the observation from thestate vector (observation operator), H(x)
• We need to specify an observation error covariance matrixR=<εoεo
T> (usually assumed diagonal)
What we will get back to:
• Quality control (some observations have ”gross errors”, whensomething has ”gone wrong”)
• Some considerations on impact of wind observations vs ”mass field” (pressure, temperature) observations
What are the observations actually used in NWP assimilation?
(Observation techniques could have been a course in itself)

Meteorologisk institutt met.no
The observing system
• Conventional observations– Surface
– Profile – radiosonde and aircraft
– WMO – coordinates observation routines and data exchange globally, EUCOS in Europe
• Remote sensing observations– Satellite
– Agencies: EUMETSAT, ESA, NOAA/NASA
– Ground based radars, “wind profilers”
• ECMWF model now: 30 mill. obs. available for assimilation per day. (State vector dimension ~108)

Meteorologisk institutt met.no
Conventional observation types used in
data assimilation
Surface
• Synop (manual and automated) and ship(over land mainly pressure is assimilated)
• Buoys on ocean
Profile and upper air
• Radiosondes (TEMPs and PILOTs)
• Aircraft (AIREP and AMDAR)
Not all observation types are easy or evenpossible to assimilate in NWP (like clouds, visibility, …)

Meteorologisk institutt met.no
Conventional observations: surface
Example: Weather station Longyearbyen

Meteorologisk institutt met.no
SYNOP and ship
(example termin: 18 feb 2008 00 utc)

Meteorologisk institutt met.no
Buoys

Meteorologisk institutt met.no
Conventional observations: Radiosonde
Bodø: automatic radiosonde

Meteorologisk institutt met.no
Radiosondes (TEMP)

Meteorologisk institutt met.no
PILOT /”Wind profiler”

Meteorologisk institutt met.no
Aircraft observations

Meteorologisk institutt met.no
Dramatical change in the observing system
since ca 50 years ago – more satellite data,
but we have also lost something
Weather ships 1948
Last ship ended 2009

Meteorologisk institutt met.no
Increase in assimilated satellitte data
(number of sensors) at ECMWF

Meteorologisk institutt met.no
Satellite observations –
divided into several groups
Passive (Top of Atmosphere radiances emitted from a surface-atmosphere column):
• Microwave– Profiling instruments: AMSU
– Imaging instruments: SSM/I
• Infrared– Profiling instruments: HIRS, AIRS, IASI, CrIS
– Imaging instruments: AVHRR, MODIS,• Atmospheric Motion Vectors
Active (RADAR, LIDAR, radio-signals):• Scatterometer (ocean surface winds from radar)
• GPS (ground based from geodetic stations, radio occultation)
Meteorologisk institutt met.no
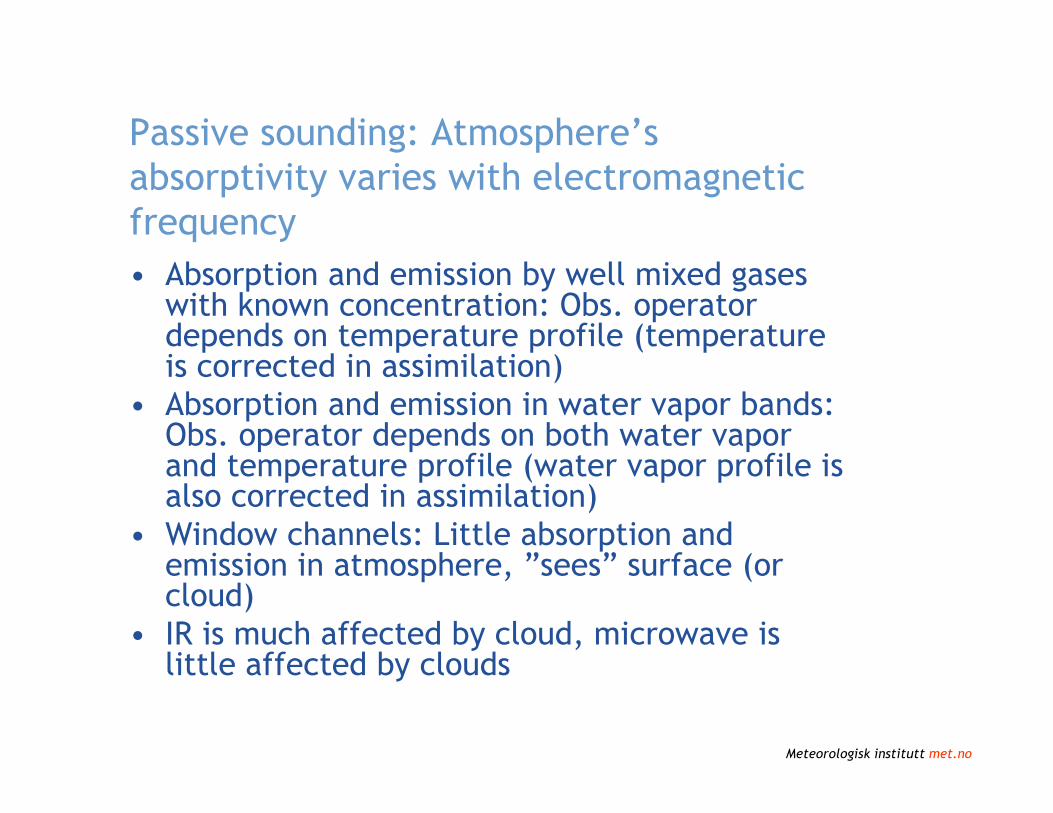
Passive sounding: Atmosphere’s
absorptivity varies with electromagnetic
frequency
• Absorption and emission by well mixed gases with known concentration: Obs. operator depends on temperature profile (temperatureis corrected in assimilation)
• Absorption and emission in water vapor bands: Obs. operator depends on both water vaporand temperature profile (water vapor profile is also corrected in assimilation)
• Window channels: Little absorption and emission in atmosphere, ”sees” surface (or cloud)
• IR is much affected by cloud, microwave is little affected by clouds
Meteorologisk institutt met.no
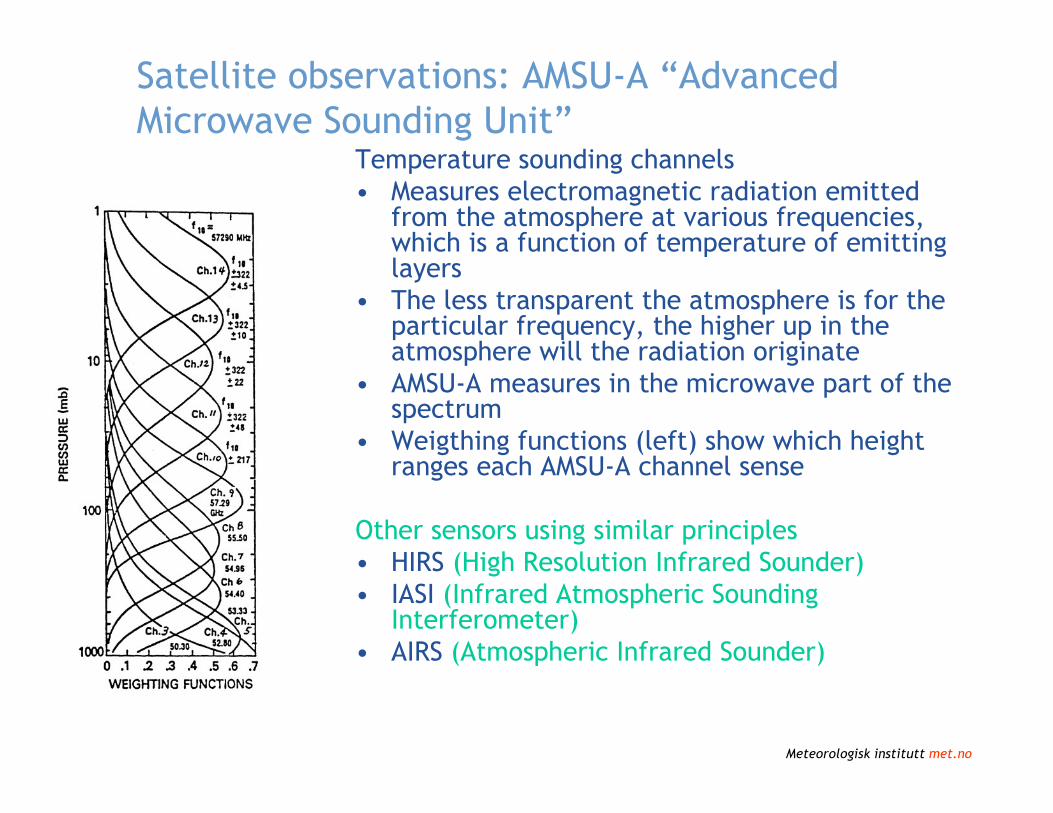
Satellite observations: AMSU-A “Advanced
Microwave Sounding Unit”Temperature sounding channels
• Measures electromagnetic radiation emitted from the atmosphere at various frequencies, which is a function of temperature of emitting layers
• The less transparent the atmosphere is for the particular frequency, the higher up in the atmosphere will the radiation originate
• AMSU-A measures in the microwave part of the spectrum
• Weigthing functions (left) show which height ranges each AMSU-A channel sense
Other sensors using similar principles
• HIRS (High Resolution Infrared Sounder)
• IASI (Infrared Atmospheric Sounding Interferometer)
• AIRS (Atmospheric Infrared Sounder)

Meteorologisk institutt met.no
“Advanced Microwave Sounding Unit” (AMSU-A)

Meteorologisk institutt met.no
IASI
Meteorologisk institutt met.no
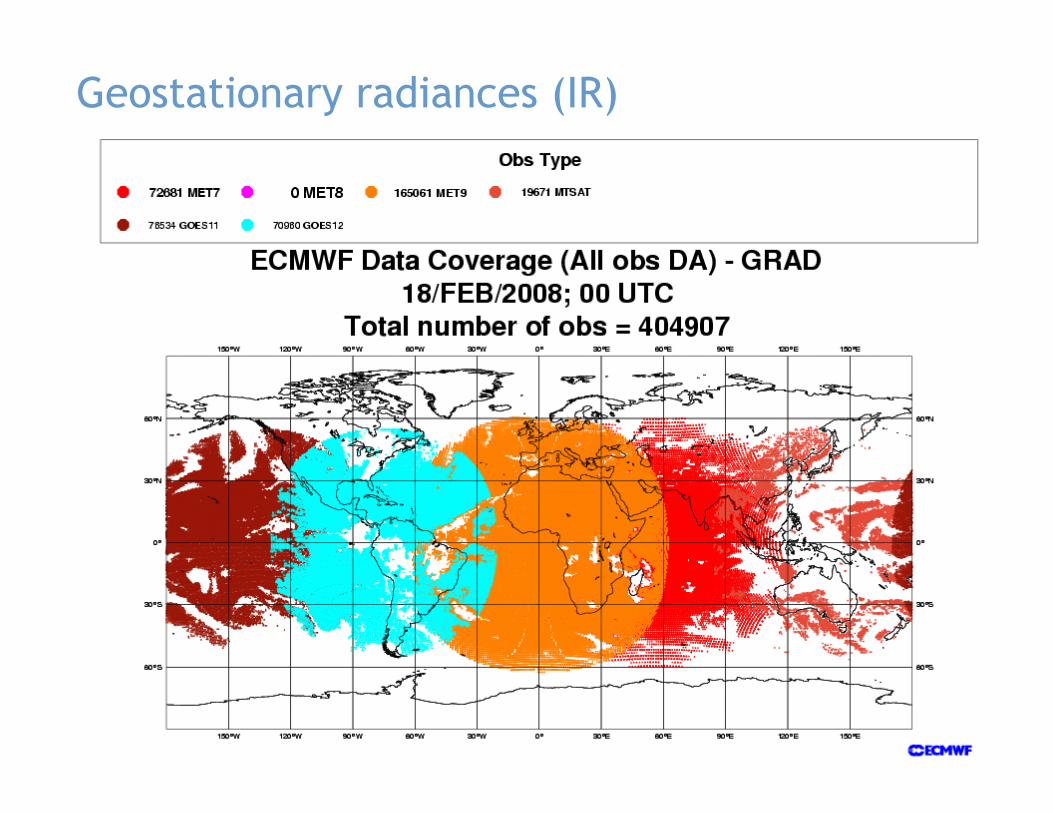
Geostationary radiances (IR)

Meteorologisk institutt met.no
Atmospheric motion vectors
• Some satellites give timeseries of images:
Geostationary or polar orbiting with frequent revisits
• Clouds or water vaporfeatures can be tracked with automatic algorithms to derive displacement from one image to the next
• Height assignment problem

Meteorologisk institutt met.no
“Atmospheric Motion Vectors”

Meteorologisk institutt met.no
“Special Sensor Microwave Imager” (ocean surface
windspeed and vertically integrated water vapour)

Meteorologisk institutt met.no
Remote sensing: Scatterometers
• Sense ocean surface
wind vector
• Radar return
dependent on ocean
surface roughness
• 2 different satellites
(sensors):
Oceansat Scatt. and
ASCAT (left)

Meteorologisk institutt met.no
Scatterometer (ocean surface wind from satellite)

Meteorologisk institutt met.no
Method for measuring the impact of the
observing system components
• OSEs (“Observing System Experiments”)
– Take the full observing system as a reference and
remove a set of observations. Measure the reduction
in forecast quality
– Variant: Take a minimum, reduced observing system
and add a set of observations. Measure the
improvement in forecast quality
– OSEs has a drawback: Can only assess the effect of
already existing observations
(cf OSSE – “Observing System Simulation
Experiments”)

Meteorologisk institutt met.no
Example of some OSE’s (ECMWF)
“Baseline”: All conventional
observations
“AMSU-A”: “Baseline” with
added AMSU-A
“Control”: All conventional
and all satellitte

Meteorologisk institutt met.no
Some conclusions from OSE’s performed:
• Surface information insufficient, profile information needed
• Radiosondes still a key factor for forecast quality for the met.no HIRLAM forecasts (even if some satellite observations are being used)
• Aircraft observations supplement radiosondes and give a significant positive effect
• The total effect of satellite observations is now larger than total effect of conventional observations
• Redundance: Best effect of satellite data in areas of sparse coverage of conventional observations (for example Southern hemisphere, Arctic areas)

Meteorologisk institutt met.no
An ”information content” tool
(C. Cardinali, ECMWF)
• Less accurate results than OSE’s, but easier to produce
• Assumes the B and R matrices are perfectly correct
estimated (which is not possible in practise), uses adjoint
sensitivity assuming linear model
• Measures forecast sensitivity to each observation in the
analysis (theory and method not shown here)
• Can consider any grouping of observations or single ones

Meteorologisk institutt met.no
Recent data from ECMWF (C. Cardinali):
Total impact (% contribution to forecast
error reduction)

Meteorologisk institutt met.no
Data from ECMWF: Impact per observation

Meteorologisk institutt met.no
Example of spatial variability: Error reduction
averaged over a 2 ½ month period, one
satellite channelBlue is positive effect, yellow negative (for AMSU-A channel 8)

Meteorologisk institutt met.no
Some remarks
• Large variations of ”impact” in space
and time. But on average it tips to the
positive side for each obs type
• For the ECMWF model satellite data
gives much larger impact than
conventional data in total
• But conventional observations give
larger impact per observation