observed 20th century desert dust variability: impact on ... · century, drawing down an additional...
TRANSCRIPT
Atmos. Chem. Phys., 10, 10875–10893, 2010www.atmos-chem-phys.net/10/10875/2010/doi:10.5194/acp-10-10875-2010© Author(s) 2010. CC Attribution 3.0 License.
AtmosphericChemistry
and Physics
Observed 20th century desert dust variability: impact on climateand biogeochemistry
N. M. Mahowald1, S. Kloster1, S. Engelstaedter1, J. K. Moore2, S. Mukhopadhyay3, J. R. McConnell4, S. Albani1,5,S. C. Doney6, A. Bhattacharya3, M. A. J. Curran 7,8, M. G. Flanner9, F. M. Hoffman10, D. M. Lawrence11,K. Lindsay11, P. A. Mayewski12, J. Neff13, D. Rothenberg1, E. Thomas14, P. E. Thornton9, and C. S. Zender2
1Department of Earth and Atmospheric Sciences, Cornell University, Ithaca NY, 14853, USA2Department of Earth System Science, University of California, Irvine, Irvine, CA, 92697, USA3Department of Earth and Planetary Sciences, Harvard University, Cambridge, MA, 02138, USA4Division of Hydrologic Sciences, Desert Research Institute, Reno, NV 89512, USA5Department of Environmental Sciences, University of Milano-Bicocca, Milano, 20126, Italy6Marine Chemistry and Geochemistry, Woods Hole Oceanographic Institution, Woods Hole, MA, 02543, USA7Australian Antarctic Division, Kingston, Tasmania, 7050, Australia8Antarctic Climate and Ecosystems Cooperative Research Centre, Hobart, Tasmania, 7001, Australia9Department of Atmospheric, Oceanic and Space Sciences, University of Michigan, Ann Arbor, MI, 48109, USA10Computational Earth Sciences Group, Oak Ridge National Laboratory, Oak Ridge, TN, 37831, USA11Climate and Global Dynamics Division, National Center for Atmospheric Research, Boulder, CO 80307, USA12Climate Change Institute, University of Maine, Orono, ME, 04469, USA13Geosciences Department and Environmental Studies Program, University of Colorado, Boulder, CO, 80301, USA14British Antarctic Survey, Cambridge, CB3 0ET, UK
Received: 12 April 2010 – Published in Atmos. Chem. Phys. Discuss.: 17 May 2010Revised: 19 October 2010 – Accepted: 8 November 2010 – Published: 19 November 2010
Abstract. Desert dust perturbs climate by directly and in-directly interacting with incoming solar and outgoing longwave radiation, thereby changing precipitation and tempera-ture, in addition to modifying ocean and land biogeochem-istry. While we know that desert dust is sensitive to pertur-bations in climate and human land use, previous studies havebeen unable to determine whether humans were increasingor decreasing desert dust in the global average. Here wepresent observational estimates of desert dust based on pa-leodata proxies showing a doubling of desert dust duringthe 20th century over much, but not all the globe. Largeuncertainties remain in estimates of desert dust variabilityover 20th century due to limited data. Using these ob-servational estimates of desert dust change in combinationwith ocean, atmosphere and land models, we calculate thenet radiative effect of these observed changes (top of at-mosphere) over the 20th century to be−0.14± 0.11 W/m2
(1990–1999 vs. 1905–1914). The estimated radiative change
Correspondence to:N. M. Mahowald([email protected])
due to dust is especially strong between the heavily loaded1980–1989 and the less heavily loaded 1955–1964 time peri-ods (−0.57± 0.46 W/m2), which model simulations suggestmay have reduced the rate of temperature increase betweenthese time periods by 0.11◦C. Model simulations also indi-cate strong regional shifts in precipitation and temperaturefrom desert dust changes, causing 6 ppm (12 PgC) reductionin model carbon uptake by the terrestrial biosphere over the20th century. Desert dust carries iron, an important micronu-trient for ocean biogeochemistry that can modulate oceancarbon storage; here we show that dust deposition trends in-crease ocean productivity by an estimated 6% over the 20thcentury, drawing down an additional 4 ppm (8 PgC) of car-bon dioxide into the oceans. Thus, perturbations to desertdust over the 20th century inferred from observations are po-tentially important for climate and biogeochemistry, and ourunderstanding of these changes and their impacts should con-tinue to be refined.
Published by Copernicus Publications on behalf of the European Geosciences Union.

10876 N. M. Mahowald et al.: Observed 20th century desert dust variability
1 Introduction
Desert dust or mineral aerosols are soil particles suspended inthe atmosphere, and are considered a “natural” aerosol con-stituent. There is strong evidence that desert dust is verysensitive to climate, globally changing by a factor of 3–4between glacial and interglacial time periods (Kohfeld andHarrison, 2001), and by a factor of four regionally over thelatter part of the 20th century (Prospero and Lamb, 2003).However, how humans are perturbing desert dust is not wellknown. It is unclear whether humans are increasing or de-creasing the size of deserts through climate change and ele-vated carbon dioxide effects (Mahowald, 2007). In additionhumans could be changing desert dust aerosols directly byremoving surface vegetation for agriculture (Gillette et al.,1997) or pasture usage (Neff et al., 2005), or through alteredwater usage (Reheis, 1997). Globally, the net effect of hu-mans on desert dust emissions remains uncertain, but couldbe between−20% to +60% (Tegen and Fung, 1995; Pros-pero et al., 2002; Mahowald and Luo, 2003; Tegen et al.,2004; Mahowald et al., 2004; Moullin and Chiapello, 2006;Mahowald et al., 2009).
Variability in desert dust is likely to be climatically im-portant, as desert dust interferes with both incoming shortwave and outgoing long wave radiation (Miller and Tegen,1998). In addition, desert dust can interact with liquid clouds(Rosenfeld and Nirel, 1996) and frozen ice clouds (Sassen,2002; DeMott et al., 2003), and thereby perturb the opti-cal properties of clouds and change precipitation patterns(Rosenfeld et al., 2001; Mahowald and Kiehl, 2003; Hooseet al., 2008). Desert dust also contains small amounts of ironand is thought to be the dominant source of new iron to someregions of the open ocean (Fung et al., 2000). Iron is animportant micronutrient in the oceans (Martin et al., 1991;Boyd and Law, 2001), and iron deposition has been linked tonitrogen fixation in the oceans (Falkowski et al., 1998). Thuschanges in dust fluxes to the ocean have the potential to mod-ify ocean biogeochemistry (e.g., Parekh et al., 2006; Mooreet al., 2006; Aumont et al., 2008).
In this study, we use a set of paleodata observations for the20th century to reconstruct the temporal evolution of desertdust for different source areas for the first time. We combinethe observations with a dust emissions/atmospheric transportmodel to estimate global changes in dust sources, distribu-tions and deposition over the 20th century. We then simulatethe impact of these changes on climate and biogeochemistryusing existing models. We also estimate the uncertainties inour approach.
2 Methodology
2.1 Dust variability reconstruction over 20th centuryfrom data
Ice, lake core and coral record data provide valuable infor-mation about the variability in dustiness in the past, and herewe use the data presented in Table 1 to reconstruct desertdust distributions over the period from 1870 to 2000. We usea combination of model provenance studies with geochemi-cal provenance studies, when available, to estimate the dom-inant source deposited at each site. We divide the world into7 different source areas (North Africa, Middle East/CentralAsia, East Asia, North America, Australia, South America,South Africa), and use the observations to infer a time vary-ing source strength for each source area. This approach as-sumes that the variability in deposition at the sites is domi-nated by variability in source strength, not transport variabil-ity; the model results support this assumption for the sitesused here to constrain the source variability (see Sect. 3).The exceptions are the Greenland and high Andes sites asdiscussed below.
We estimate the deposition variability at every grid box:
TD(x,y,t) =
∑i
SDi(x,y) ·Si(t)/∑
i
SDi(x,y) (1)
Where TD(x,y,t) is the relative deposition at a particularlocation and time period (relative to 1980–2000), SDi(x,y)
is the climatologically annual average deposition at locationx,y for each source (i), andSi(t) is the derived time vari-ability for each source region (i), derived in the followingparagraphs. The SDi(x,y) comes from model simulationsdescribed in (Mahowald, 2007), where one source region isturned on for each model simulation. The strength of eachsource, aerosol optical depth and deposition to oceans foreach source is indicated in Table 2. The derivation of the timetendency of each source region (Si(t)) is described next.
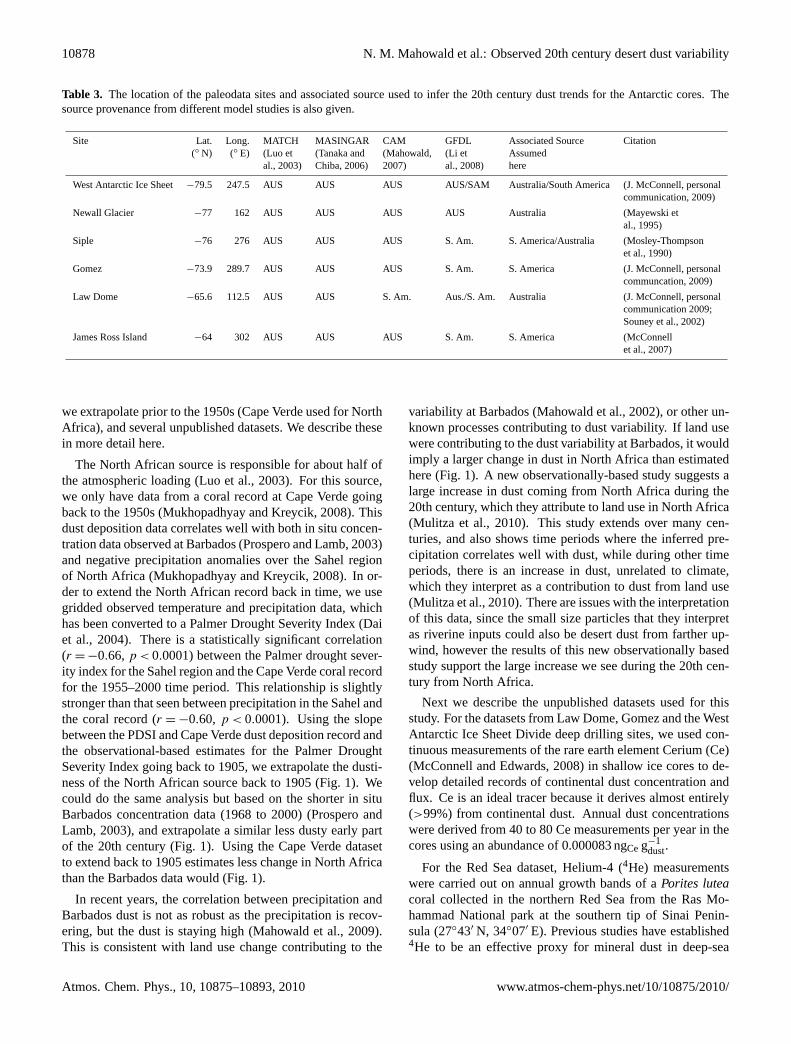
For the Southern Hemisphere sources, we rely to a largeextent on the results of a recent modeling study (Li et al.,2008), since other studies are characterized by too large ofan Australian source (Luo et al., 2003; Mahowald, 2007).While geochemical provenance studies can be valuable fordeducing the sources for different dust deposition sites, thereis limited data (Grousset and Biscaye, 2005). For thepresent climate, information on long-range dust provenancefor Antarctica is so far limited to the central East Antarc-tic Plateau, the main source being Argentina (Delmonte etal., 2007), with significant contribution from a secondarysource which could be either the Puna-Altiplano (Delmonteet al., 2008; Gaiero, 2008) or Australia (Marino et al., 2008).For the Antarctic cores, we chose our sources to be consis-tent with these model and observational studies (Table 3).Some paleorecords (e.g. West Antarctic Ice Sheet and Siple,Table 1) are associated with two different sources, and so
Atmos. Chem. Phys., 10, 10875–10893, 2010 www.atmos-chem-phys.net/10/10875/2010/

N. M. Mahowald et al.: Observed 20th century desert dust variability 10877
Table 1. The location of the paleodata sites and associated source used to infer the 20th century dust trends.
Type Latitude Longitude AssociatedPaleodata site of data (◦ N) (◦ E) Source Citation
West Antarctic Ice Sheet Ice core −79.5 247.5 Australia/South America (J. McConnell, personal communication, 2009)Newall Glacier Ice core −77 162 Australia (Mayewski and al., 1995)Siple Ice core −76 276 S. America/Australia (Mosley-Thompson et al., 1990)Gomez Ice core −73.9 289.7 S. America (J. McConnell, personal communication, 2009)Law Dome Ice core −65.6 112.5 Australia (Souney et al., 2002)
(J. McConnell, personal communication, 2009)James Ross Island Ice core −64 302 S. America (McConnell et al., 2007)Cape Verde Coral core 16 336 N. Africa (Mukhopadhyay and Kreycik, 2008)Dasuopu Ice core 28 85 Middle East/Central Asia (Thompson et al., 2000)Red Sea Coral core 29.5 35 Middle East/Central Asia (S. Mukhopadhyay, personal communication, 2009)San Juan Mountain Lakes Lake core 38 252 N. America (Neff et al., 2008)Everest Ice core 28 86.9 Middle East/Central Asia (Kaspari et al., 2007)
Table 2. Source Apportionment: the relative strength of the different sources in the source apportionment simulations. The values representthe total contribution of the source area to the globally averaged aerosol optical depth and deposition to oceans.
Source Source Aerosol Deposition toarea Strength (Tg/year) optical depth oceans (Tg/year)
North Africa 1367 0.0146 276Middle East/Central Asia 760 0.0067 97.6Australia 120.3 0.0010 25North America 121.9 0.00098 35East Asia 100.6 0.00062 7.7South America 98.5 0.00086 31South Africa 6.25 0.00016 4.8
influence both source areas in their time series, but at halfthe weight of the other records.
We do not include several cores because we do not thinktheir variability over the last 100 years represents dustinessover a large region that can be associated with a particu-lar source. For GISP (Donarummo et al., 2002) and Penny(Zdanowicz et al., 1998), the variability over the 20th cen-tury appears to be governed by transport and deposition tothe ice cores (Meeker and Mayewski, 2002), not necessar-ily broad scale source or dustiness changes. Several trop-ical cores (Quelccaya, Thompson et al., 1984; Huascaran,Thompson et al., 1995; and Kilamanjaro, Thompson et al.,2002) are far downwind from the dust source areas, and athigh elevations, and seem to represent the variability in dusti-ness in remote regions (Mahowald et al., 2010), while herewe want to characterize the source changes for regions dom-inating large parts of the globe. We have no paleodata toconstrain the South African or East Asian sources, so we letthem remain constant over the time period considered here.
The dust data we use are from downwind of the source re-gions, which means that we are deriving the long range trans-ported dust variability from different source regions. This isalso the fraction that will impact climate and biogeochem-
istry the most because it is the fraction transported away fromthe source regions. We recognize that the assumptions madehere will impact the results of our study and that more datawill determine whether these assumptions are valid or not.We evaluate the uncertainties in our approach in Sect. 4.
Once we assign each paleorecord to be representative of asource region, we average the relative dust deposition timeseries for the paleodust records within one source region, toproduce one time series of variation for each source region(S(i)).
Paleodata description
We include here mostly published data (Table 1), of whichwe do not include a detailed description. Ice core data fromAntarctica and the Tibetan plateau are used (J. McConnell,personal communication, 2009; Mayewski and al., 1995;Mosley-Thompson et al., 1990; Souney et al., 2002; Mc-Connell et al., 2007; Kaspari et al., 2007). Lake sedimentdata from the San Juan Mountains in Colorado (Neff et al.,2008), and coral data from Cape Verde and the Red Sea areused (Mukhopadhyay and Kreycik, 2008; S. Mukhopadhyay,personal communication, 2009). There is one data set that
www.atmos-chem-phys.net/10/10875/2010/ Atmos. Chem. Phys., 10, 10875–10893, 2010
10878 N. M. Mahowald et al.: Observed 20th century desert dust variability
Table 3. The location of the paleodata sites and associated source used to infer the 20th century dust trends for the Antarctic cores. Thesource provenance from different model studies is also given.
Site Lat. Long. MATCH MASINGAR CAM GFDL Associated Source Citation(◦ N) (◦ E) (Luo et (Tanaka and (Mahowald, (Li et Assumed
al., 2003) Chiba, 2006) 2007) al., 2008) here
West Antarctic Ice Sheet −79.5 247.5 AUS AUS AUS AUS/SAM Australia/South America (J. McConnell, personalcommunication, 2009)
Newall Glacier −77 162 AUS AUS AUS AUS Australia (Mayewski etal., 1995)
Siple −76 276 AUS AUS AUS S. Am. S. America/Australia (Mosley-Thompsonet al., 1990)
Gomez −73.9 289.7 AUS AUS AUS S. Am. S. America (J. McConnell, personalcommuncation, 2009)
Law Dome −65.6 112.5 AUS AUS S. Am. Aus./S. Am. Australia (J. McConnell, personalcommunication 2009;Souney et al., 2002)
James Ross Island −64 302 AUS AUS AUS S. Am. S. America (McConnellet al., 2007)
we extrapolate prior to the 1950s (Cape Verde used for NorthAfrica), and several unpublished datasets. We describe thesein more detail here.
The North African source is responsible for about half ofthe atmospheric loading (Luo et al., 2003). For this source,we only have data from a coral record at Cape Verde goingback to the 1950s (Mukhopadhyay and Kreycik, 2008). Thisdust deposition data correlates well with both in situ concen-tration data observed at Barbados (Prospero and Lamb, 2003)and negative precipitation anomalies over the Sahel regionof North Africa (Mukhopadhyay and Kreycik, 2008). In or-der to extend the North African record back in time, we usegridded observed temperature and precipitation data, whichhas been converted to a Palmer Drought Severity Index (Daiet al., 2004). There is a statistically significant correlation(r = −0.66,p < 0.0001) between the Palmer drought sever-ity index for the Sahel region and the Cape Verde coral recordfor the 1955–2000 time period. This relationship is slightlystronger than that seen between precipitation in the Sahel andthe coral record (r = −0.60, p < 0.0001). Using the slopebetween the PDSI and Cape Verde dust deposition record andthe observational-based estimates for the Palmer DroughtSeverity Index going back to 1905, we extrapolate the dusti-ness of the North African source back to 1905 (Fig. 1). Wecould do the same analysis but based on the shorter in situBarbados concentration data (1968 to 2000) (Prospero andLamb, 2003), and extrapolate a similar less dusty early partof the 20th century (Fig. 1). Using the Cape Verde datasetto extend back to 1905 estimates less change in North Africathan the Barbados data would (Fig. 1).
In recent years, the correlation between precipitation andBarbados dust is not as robust as the precipitation is recov-ering, but the dust is staying high (Mahowald et al., 2009).This is consistent with land use change contributing to the
variability at Barbados (Mahowald et al., 2002), or other un-known processes contributing to dust variability. If land usewere contributing to the dust variability at Barbados, it wouldimply a larger change in dust in North Africa than estimatedhere (Fig. 1). A new observationally-based study suggests alarge increase in dust coming from North Africa during the20th century, which they attribute to land use in North Africa(Mulitza et al., 2010). This study extends over many cen-turies, and also shows time periods where the inferred pre-cipitation correlates well with dust, while during other timeperiods, there is an increase in dust, unrelated to climate,which they interpret as a contribution to dust from land use(Mulitza et al., 2010). There are issues with the interpretationof this data, since the small size particles that they interpretas riverine inputs could also be desert dust from farther up-wind, however the results of this new observationally basedstudy support the large increase we see during the 20th cen-tury from North Africa.
Next we describe the unpublished datasets used for thisstudy. For the datasets from Law Dome, Gomez and the WestAntarctic Ice Sheet Divide deep drilling sites, we used con-tinuous measurements of the rare earth element Cerium (Ce)(McConnell and Edwards, 2008) in shallow ice cores to de-velop detailed records of continental dust concentration andflux. Ce is an ideal tracer because it derives almost entirely(>99%) from continental dust. Annual dust concentrationswere derived from 40 to 80 Ce measurements per year in thecores using an abundance of 0.000083 ngCeg−1
dust.
For the Red Sea dataset, Helium-4 (4He) measurementswere carried out on annual growth bands of aPorites luteacoral collected in the northern Red Sea from the Ras Mo-hammad National park at the southern tip of Sinai Penin-sula (27◦43′ N, 34◦07′ E). Previous studies have established4He to be an effective proxy for mineral dust in deep-sea
Atmos. Chem. Phys., 10, 10875–10893, 2010 www.atmos-chem-phys.net/10/10875/2010/

N. M. Mahowald et al.: Observed 20th century desert dust variability 10879
Fig. 1. Estimated relative dustiness for North Africa and North Atlantic. Cape Verde relative dustiness is shown in Black, while theextrapolated change in North African dustiness (using the Palmer Drought Severity Index-PDSI) is shown in dark blue. In situ concentrationdata from Barbados is shown in red (Prospero and Lamb, 2003), while extrapolated dustiness from the Barbados record and the PDSI isshown in light blue.
sediments and corals (Mukhopadhyay and Kreycik, 2008;Patterson et al., 1999; Winckler et al., 2005). The4He recordtherefore, provides a near-annual proxy record of dust de-position in the Northern Red Sea during the 20th century.Large fluctuations are observed in the depositional dust fluxas measured in the Red SeaPoritescoral. In general, dustfluxes in the first half of the 20th century are low comparedto dust fluxes in the 2nd half of the 20th century, with thelowest dust fluxes occurring during the 1950’s. Dust fluxesincrease during the late 1960’s with pronounced peaks in the1970’s and early 1980’s.
2.2 Model descriptions
The models used to estimate the impact of the changes indesert dust are components of the Community Climate Sys-tem Model (Collins et al., 2006a). There are three sets ofmodel simulations conducted: those with the dust model (acombined atmosphere/land model), the ocean model and theland model. We drive each of these model separately, insteadof in a coupled mode, so that we can better understand theindividual responses from different model components.
2.2.1 Dust model
For dust modeling, we use the Community AtmosphereModel/Community Land Model (Collins et al., 2006b)(CAM/CLM3.1), which includes sources, transport anddeposition of desert dust; dust simulations have been com-pared to available observations (Mahowald et al., 2006a).The dust module used here was described previously (Zenderet al., 2003a; Mahowald et al., 2006a). The model assumesthat dust is generated over unvegetated, dry soils, with strongwinds in regions where soil is easily erodible (Zender et al.,2003a). The easily erodible soils, or preferential source ar-eas (Ginoux et al., 2001), are assumed here to be in regionswhere infrequent rains supply new sediment for entrainmentinto the atmosphere (Zender et al., 2003b). One small changeto the simulations from previous simulations is that the veg-
etation threshold is changed so that the leaf area index (LAI:surface area of leaves over surface area of land) is averagedover all vegetation types within a grid box, and if the vege-tation is below 0.3 LAI, the source strength grows linearly.Previously the vegetation threshold was at 0.1 LAI and cal-culated for each plant functional type. Since the vegetationtypes are assumed to overlap, the new approach is more con-sistent with the way vegetation is considered in the model.
The dust model simulations include increasing greenhousegases and time varying anthropogenic aerosols over the his-torical time period (1870–2000), using the same historicalforcing as Flanner et al. (2009). The model simulations areconducted using a slab ocean model, and are simulated atT42 (roughly 2.8◦ × 2.8◦ resolution).
By default the dust model allows changes in soil drynessand winds to vary the strength of the source with time. Be-cause the model includes fixed monthly average satellite de-rived vegetation (Bonan et al., 2002), the impact of changesin vegetation on dust source area is not included in this ver-sion of the model (Dynamic vegetation versions of this modelsimulate surface albedo poorly (Sealy et al., 2010), so that thedynamic vegetation version of the model was not used). Sim-ulations conducted over the 130 year historical time periodwith no tuning of the dust sources were unable to capture theobserved variability in deposition (shown in Sect. 3.1). Thisis despite the fact that the model captures observed meanglobal surface temperature changes (as shown in the Sect. 3).
Normally in this model, the entrainment of the dust intothe atmosphere(E(x,y,t) is a function of soil moisture(SM), leaf area index (LAI), snow cover (SNOW), frictionvelocity (FV), and soil erodibility (SE) (see Zender et al.,2003a for a more detailed description). All but the last vari-able are time and spatially varying variables used or derivedin the land model. The last variable (soil erodibility) is a spa-tially constant variable indicating the relative effectivenessof each grid box for causing dust generation (Zender et al.,2003b).
www.atmos-chem-phys.net/10/10875/2010/ Atmos. Chem. Phys., 10, 10875–10893, 2010

10880 N. M. Mahowald et al.: Observed 20th century desert dust variability
E(x,y,y) = function(SM(x,y,t), LAI (x,y,t),
SNOW(x,y,t), FV(x,y,t), SE(x,y)) (2)
In order to force our model to reproduce the observedchanges in deposition we add in a term proportional to ourdeposition changes at each gridbox (derived above from thepaleodata):
Enew(x,y,t) = TD(x,y,t) ·E(x,y,t) (3)
This means we use our estimated deposition variability as ameasure of source strength variability, a reasonable assump-tion since deposition in source regions is dominated by thelocal source and one that allows us to make one map of timeevolution at each point. On top of this, the model is still al-lowed to vary the source strength with stronger winds or driersoils. We had planned to iterate to get the correct deposi-tion variability, but the deposition matched the observationswithin the large uncertainty, so no iteration was conducted(as shown in results Sect. 3).
We calculate the climate impact of the direct forcing ofdust using the CAM/CLM3.1, with a simple slab oceanmodel, which should include most of the effects of the oceanresponse to warming without the expense of a fully coupledocean model. However, there will be errors associated withour simplification of the ocean, especially with regards todecadal time scale forcing of climate from oceans. Sincewe use these simulations to interpret the difference betweensimulations with and without dust, which is a smaller forc-ing than anthropogenic forcing, these biases are unlikely tobe large. We conduct four ensemble members for the controlcase with no dust direct radiative forcing, and three ensemblemembers with dust direct radiative forcing. All the modelcases are forced with increasing greenhouse gas concentra-tions in the atmosphere, changes in sulfate, black carbon andorganic carbon aerosols, and volcanoes, similar to previousstudies (Flanner et al., 2009).
The climate impacts of desert dust on direct radiative forc-ing have been shown to reproduce the few available radia-tive forcing estimated based on observations (Yoshioka etal., 2007; Flanner and Zender, 2006; Flanner et al., 2007).Dust in the atmosphere absorbs and scatters both long andshort wave radiation, and in the global net, tends to coolthe atmosphere in the dust model (Yoshioka et al., 2007).The model simulation is similar to Yoshioka et al. (2007),but small changes to the dust optical properties were madeto better match observations (Flanner et al., 2009). Snowalbedo reduction from dust is treated in a similar manner asblack carbon, but with appropriate global-mean dust opticalproperties (Flanner et al., 2007). The impact of includingdust in this model has been compared to observations andanalyzed previously, although we did not have informationabout the time series of variability in the 20th century (Ma-howald et al., 2006b; Yoshioka et al., 2007). The response to
dust in the atmosphere is a function of both the single scatter-ing albedo of dust (e.g. Perlwitz et al., 2001) and the surfacealbedo of the underlying surface (Bonfils et al., 2001; Sealyet al., 2010). For our dust model simulations we are care-ful to match available aerosol optical properties and radiativeforcing observations as closely as possible (see Yoshioka etal., 2007).
2.2.2 Biogeochemistry models
The CCSM incorporates an ocean biogeochemistry mod-ule with three types of phytoplankton, zooplankton grazers,and major nutrient and iron cycling (Moore et al., 2006).This model has been compared against available observa-tions (e.g. Doney et al., 2009). The simulations are run inthe ocean-only mode (Krishnamurty et al., 2009), and arespun up with the new preindustrial dust levels, estimatedhere from observations at 1870–1890. The historical sim-ulations (1870–2000) are integrated with a repeated annualcycle of atmospheric physics and are forced with dust de-position computed from the monthly mean dust fluxes fromLuo et al. (2003) combined with the variability derived fromEq. (1) for each grid point and year. Two simulations areconducted, one with constant dust and constant solubility,and one with increasing dust (estimated here) and increas-ing solubility of iron due to air pollution (Mahowald et al.,2009). Results of the impact on ocean biogeochemistry fromincreases in the solubility of iron have previously been pub-lished (Krishnamurty et al., 2009). For the ocean biogeo-chemistry experiments, we ignore the physical forcing ofaerosols for this study, and focus on the biogeochemistry ofiron addition, because it is thought that is an important mech-anism (e.g. Martin et al., 1991).
The land biogeochemistry response is computed using theprototype version of the Community Land Model (CLM4)that incorporates several updates relative to CLM3.5 (Olesonet al., 2008) including a land biogeochemistry model (Thorn-ton et al., 2007; Thornton et al., 2009). The biogeochemistrymodel includes N-colimitation, which will reduce the carbonuptake under higher CO2 conditions (Thornton et al., 2007),and a 2-leaf model for plant photosynthesis, which allowsfor the inclusion of direct versus diffuse radiation effects onphotosynthesis (Thornton et al., 2007). The model is rela-tively insensitive to climate, with a small negative feedbackof climate onto the carbon cycle (Thornton et al., 2009). Themodel is run offline using the hourly CAM generated climatedata (e.g. temperature, precipitation and insolation) based ona control and a simulation including the dust radiative forc-ing (from the above described simulations). The change incarbon uptake and land productivity are estimated based onthe difference between simulations including dust radiativefeedbacks and excluding them.
For the land biogeochemistry experiments we focus on thephysical climate forcings, and ignore any biogeochemistryimpacts from direct aerosol deposition. The most important
Atmos. Chem. Phys., 10, 10875–10893, 2010 www.atmos-chem-phys.net/10/10875/2010/

N. M. Mahowald et al.: Observed 20th century desert dust variability 10881
nutrient coming in with the dust deposition for the terres-trial biosphere is thought to be phosphorus, a limiting nutri-ent for tropical forests (Swap et al., 1992; Vitousek, 2003).However, the phosphorus cycle changes because of increas-ing phosphorus deposition are likely to be important on thou-sand year or longer time scales, not the hundred year timescale considered here (Okin et al., 2004).
2.3 Radiative forcing calculation
We conduct a set of simulations to calculate the direct ra-diative forcing from the dust, which requires calculating theradiation twice for each time step: once with dust includedand once without, the difference yielding the instantaneouschange in radiative forcing. For the climate simulations, weinclude several ensemble members to assess the uncertaintydue to variability in the simulations or interannual variability,which tends to be smaller than the uncertainty in the opticalproperties (e.g. Miller and Tegen, 1998).
We also calculate the radiative forcing of the indirectaerosol effect. Because of the large uncertainties in the in-teraction between aerosols and cloud properties (Forster etal., 2007), our model does not explicitly include indirect ef-fects. However, we can estimate the importance of theselarge changes in aerosol amount on the clouds based on es-timates from the last Intergovernmental Panel on ClimateChange assessment report (IPCC) (Forster et al., 2007) andassuming that aerosols act as cloud condensation nuclei inproportion to their aerosol optical depth (Rosenfeld et al.,2008). Observations suggest that aerosol optical depth is agood proxy for cloud condensation nuclei, independent oftheir chemistry (Rosenfeld et al., 2008), because the num-ber and size of particles is important (but not their mass).While desert dust particles are largely insoluble, they are hy-drophilic (Koretsky et al., 1997), readily attracting condens-ing water, and thus likely to be heavily involved in cloudformation (Rosenfeld and Nirel, 1996). In addition, desertdust particles could interact with ice nuclei (Sassen, 2002).We do not have a model that includes these impacts. There-fore, to roughly estimate the indirect forcing from dust vari-ability we: (1) divide the total aerosol indirect effect radia-tive forcing estimated in the last IPCC by the total change inaerosol optical depth assumed in the IPCC, and (2) multiplythe result from (1) by the observed global average change inaerosol optical depth estimated here. This can only be con-sidered a rough estimate of the indirect effect of desert dustchanges on climate.
The radiative forcing of the biogeochemistry impacts ofdesert dust onto the land and ocean are calculated based onthe changes in atmospheric CO2 estimated from the biogeo-chemical models (Sect. 2.2) times the radiative forcing ofCO2, based on Forster et al. (2007).
3 Results
3.1 Dust variability over 20th century
Our estimates from the available paleorecords suggest signif-icant fluctuations in desert dust source strength from the dif-ferent source areas over the 20th century (Fig. 2). There aredifferences in the deposition variability at the different corelocations that sample each source (Fig. 2), which implies sig-nificant uncertainties in our estimated trends (discussed inmore detail in Sect. 4). In our methodology, the differences indeposition variability at different sites are assumed to comefrom variations due to transport-deposition relationships atthe individual sites. These results suggest that many of themain desert dust sources were relatively less active duringthe early part of the 20th century (all except North America,Fig. 1a), and many increased with time, reaching a maximumin the 1980’s, during the North African/Sahel drought.
The reason for these changes in dustiness is not clear. Datasuggests that desert dust responds strongly to climate, ei-ther regional variability such as due to the North Africandrought (Prospero and Lamb, 2003) or global variability dur-ing glacial/interglacial cycles (Petit et al., 1999). While theland surface or inundated lakes are likely to be drying due tohotter temperatures and precipitation pattern shifts (Dai et al.,2004), carbon dioxide increases may make arid plants moreable to deal with water stress (Smith et al., 2000). Because ofthese potentially offsetting effects of humans, climate modelbased estimates are inconclusive, suggesting that deserts mayhave either expanded or contracted since the late 1800’s (Ma-howald, 2007). Desert dust also responds locally to agricul-ture and pasture land use, since both remove the vegetationthat protects the soil against wind erosion (Gillette, 1988;Neff et al., 2005), but the global importance of land use is notknown (Tegen and Fung, 1995; Prospero et al., 2002; Tegenet al., 2004; Mahowald et al., 2004; Yoshioka et al., 2005;Moullin and Chiapello, 2006; Mahowald et al., 2009). Wa-ter use by humans could impact desert dust (Reheis, 1997),but there is no evidence of large scale impacts from wateruse (Mahowald et al., 2009). The results here suggest thatthe net effect of climate drying, carbon dioxide fertilizationand land use change by humans result in an increase in desertdust over the 20th century. This model was not able to sim-ulate this variability without the source being forced to varywith time (dotted line in Fig. 2). Note that we were unable toextrapolate our North African source farther back than 1905,so we do not estimate the desert dust amounts in the 19thcentury, required for a preindustrial to current climate con-trast.
As discussed in the methodology section, the model wasunable to capture the observed variability in dust deposi-tion without modification to the source strength. Once thesource strength is tuned using the relative deposition timeseries derived in Eq. (1), the model deposition at the paleo-record sites capture the variability that we derived from the
www.atmos-chem-phys.net/10/10875/2010/ Atmos. Chem. Phys., 10, 10875–10893, 2010

10882 N. M. Mahowald et al.: Observed 20th century desert dust variability
Rela
tive
Chan
geRe
lativ
e Ch
ange
Rela
tive
Chan
ge
Rela
tive
Chan
geRe
lativ
e Ch
ange
Year
Year
a. b.
c. d.
e.
Fig. 2. Observational derived fluctuations in relative source strength and relative deposition for each paleorecord (colors) and the meanestimated source variation for each source area (black) for Australia(a), North Africa (b), N. America(c), South America(d), and MiddleEast/Central Asia(e). For Australia (a) the sites are WAIS (dark blue), Siple (cyan), Newall (green) and Law Dome (yellow). For NorthAfrica (b) the site is Cape Verde (Fig. S1) (dark blue). For North America (c), the San Juan Lakes are averaged in blue. For South America(d), the sites are James Ross Island (dark blue), WAIS (cyan), Siple (green), and Gomez (yellow). For the Middle East/Central Asian source,the sites are Dasuopu (dark blue), Red Sea (cyan) and Everest (green). Also shown in grey are the ensemble model simulated dust depositionas sampled at each paleodatarecord and averaged exactly as done with the data. All values are 10-year running means.
observations (Fig. 2; grey lines compared to black lines). Forthis comparison, we average the model output at the samelocations as the data. For this model, changes in dust trans-port are not important for the variability seen in the cores (atthe cores we include: see Sect. 2.1 for cores not included inthe data forcing the model, because transport/deposition vari-ability is thought to be important), even though large scalechanges in precipitation and temperature are simulated. Thisis consistent also with previous model studies (Tegen andMiller, 1998; Mahowald et al., 2003). This is even consistentwith the model studies of the last glacial maximum, whereto get large changes (>25%) in dust deposition, changes tosource areas need to be included in some models (Mahowaldet al., 1999, 2006a). Some models obtain larger changes indust source strength without changes in source area for thelast glacial maximum because of stronger winds and/or dry-ness (Andersen et al., 1998; Werner et al., 2002). Note that
Mahowald et al. (1999) and Werner et al. (2002) use differentversions of the same climate model (ECHAM).
The model estimated aerosol optical depth, a measure ofthe interference of the aerosols with incoming solar radia-tion, follows the variability in the source strength (Fig. 3b).The relative contribution of each source area to the totalsource, aerosol optical depth, and deposition to oceans forthe source provenance studies conducted with this modelshow the dominance of the North African source for con-trolling much of the climate impact of desert dust (Table 2).The radiative forcing of the desert dust follows closely theaerosol optical depth (Fig. 3b). The average direct radiativeforcing of desert dust at the top of the atmosphere over the20th century is−0.5 W/m2, and varies strongly with time(Fig. 3b). The net change between the relatively less dustyearly 20th century (1905–1914) and the dusty 1990–1999 re-sults in a direct radiative forcing of−0.07 W/m2. The largest
Atmos. Chem. Phys., 10, 10875–10893, 2010 www.atmos-chem-phys.net/10/10875/2010/

N. M. Mahowald et al.: Observed 20th century desert dust variability 10883
changes in radiative forcing occur between the dusty 1980’s(1980–1989) and less dusty late 1950’s (1955–1964), result-ing in globally averaged differences in radiative forcing of−0.28 W/m2 (Fig. 4a). For reference the current net anthro-pogenic radiative forcing (from greenhouse gases and anthro-pogenic aerosols, etc.) is estimated to be +1.6 W/m2 (Forsteret al., 2007), signifying that the 20th century changes in di-rect radiative forcing due to fluctuations in desert dust areclimatically important (Fig. 4a).
As discussed in the methods, we are not able to includeindirect effects of dust aerosols explicitly in this model, butinstead estimate the impact of dust onto clouds. We roughlyestimate the impact of changes in desert dust on the radiativebudget through the indirect effect (described in Sect. 2.3),but cannot include these impacts in the atmospheric mod-eling study. A first order estimate of the radiative forcingfrom aerosol indirect effects from changing dust (Fig. 4a) is−0.36 W/m2 for 1980–1989 vs. 1955–1964. The indirect ef-fect of dust changes is about the same size (and sign) as thedirect effect, so that including this response doubles our esti-mate of the 20th century “cooling” radiative forcing of desertdust.
3.2 Climate and biogeochemical response
The climate impact of the dust is simulated using ensemblemembers including and excluding the direct radiative forcingof desert dust. The globally averaged net impact of includ-ing desert dust direct radiative forcing on model climate isa mean cooling of−0.12◦C. For comparison, when histor-ical 20th century greenhouse gases trends and aerosols areused to force the model, the simulated temperature increaseis +0.73◦C between the 1870s and 1990s (Fig. 3c). Althoughthe mean change between the early 1900s (1905–1914) andthe 1990s (1990–1999) just due to dust changes is not sta-tistically significant, there are larger impacts for some timeperiods. The inclusion of desert dust changes in the modelreduces the temperature rise between the relatively low dust1955–1964 time period and the high dust 1980–1989 timeperiod by approximately 0.11◦C; this is about 1/3 of the to-tal change between these two time periods simulated in themodel (Fig. 3c), and this reduction in the rise in temperaturesmakes the model more consistent with the observational data(Brohan et al., 2006) (Fig. 3c). If we focus on just the landsurface temperatures in the model (which the data representsbetter), the change in surface temperature between 1980–1990 and 1955–1965 is 0.34 and 0.48◦C with and withoutdust, respectively, while the observations show a change of0.21◦C (Fig. 4b); again the model including the effects ofdust changes matches the data better than without the effectsof dust changes. Note that after this time period, the dustis reduced and the temperature rises again. In addition, thedust cools the atmosphere over desert regions, causes subsi-dence locally and moves precipitation away from desert dustregions (Yoshioka et al., 2007). Because most of the desert
dust is in the Northern Hemisphere, this causes a decreasein Northern Hemisphere land precipitation in the tropics be-tween 1980–1989 compared to 1955–1964 (Fig. 4c), allow-ing the model to better match observational estimates of thechange in precipitation (Dai et al., 2004) (Figs. 4c and 5).
Regional changes in surface temperature, precipitation andsea level pressure, as simulated in the model for the 1980–1989 dusty period compared to the 1955–1965 non-dustyperiod (Figs. 5, 6 and 7), suggest that the changes in re-gional climate from changes in dust are of the same orderas from the changes due to other forcings (including CO2)
for this time period, especially for the case of precipitation.For precipitation, we compare to available observations (Daiet al., 2004) and demonstrate that with dust included in themodel, even without forcing the ocean, we can capture muchof the large-scale shifts in precipitation between the dustyperiod (1980–1989) to the non-dusty period (1955–1965).This suggests that desert dust itself contributes to droughtin the Sahel, for example, as argued previously (Yoshiokaet al., 2007). The response of precipitation to dust is sen-sitive to single scattering albedo (Perlwitz et al., 2001), andour model has been carefully compared to available obser-vations to show that it matches observed single scatteringalbedo (Yoshioka et al., 2007). In order to compare the modelsimulation to observations over oceans, we are restricted toa few datasets. Comparisons to the mean sea level pressureestimates based on observations (Allan and Ansell, 2006),suggest that including dust variability improves the compar-ison with increased sea level pressure over North Africa andSouth Atlantic, but degrades the simulation over the SouthIndian Ocean.
In addition to these impacts of desert dust on climate,desert dust can interact with biogeochemistry, and therebyimpact atmospheric CO2 and other greenhouse gas emis-sions. For this study we include the impact of increasingdust solubility from air pollution (Mahowald et al., 2009) aswell as changes in desert dust deposition, in a 3-dimensionalmodel simulation of ocean biogeochemistry (Krishnamurtyet al., 2009) and obtain changes in net air-sea CO2 fluxes(Fig. 3d). Changes in dust deposition result in a 6% increasein ocean productivity and a significant perturbation to thenitrogen budget, through the reduction in iron limitation ofthe nitrogen fixing organisms (Fig. 8). This results in an in-crease in the uptake of carbon dioxide by the ocean of 8 Pg C(equivalent to 4 ppm in atmospheric CO2) over the 130 yearsof the simulation (Figs. 3 and 8). This approximately dou-bles the impact of human perturbations on iron deposition tothe oceans simulated from changes in combustion processesonly (Krishnamurty et al., 2009). Notice that for this oceanecosystem model, anthropogenic increases in the iron depo-sition to the ocean are more important than anthropogenicincreases in nitrogen deposition to the ocean (Krishnamurtyet al., 2009). The net effect of these changes in CO2 ontothe radiative balance for different time periods is shown inFig. 4.
www.atmos-chem-phys.net/10/10875/2010/ Atmos. Chem. Phys., 10, 10875–10893, 2010

10884 N. M. Mahowald et al.: Observed 20th century desert dust variability
0.0
0.5
1.0
1.5
2.0 N.Af.Mid.E.AsiaAus
S.Am.N.Am.S.Af.
0.00
0.01
0.02
0.03
0.04
-0.7
-0.6
-0.5
-0.4
-0.3
-0.2
RF (W
/m )
-0.5
0.0
0.5Ocean �uxesLand �uxesFire �uxes
Glo
bal T
s (K
)D
ust A
OD
Rela
tive
dust
-3-2
-1
0
1
23
CO
2 Fl
ux (G
tC/y
ear)
1900 1920 1940 1960 1980 2000
0.2
-0.2
CO2
Flux
(ppm
/yea
r)
CO
2 Fl
ux (G
tC/y
ear)
a.
b.
c.
d.
e.
Year
CO2
Flux
(ppm
/yea
r)1
0
-1
2
Fig. 3. The relative strength the dust source regions (normalized to 1 for each region for 1980–2000) as estimated from the observations(a) for North Africa (black), Middle East/Central Asia (dark blue), Asia (blue), Australia (cyan), South America (green), North America(yellow), and South Africa (red). The model estimated aerosol optical depth (AOD) (black) and change in instantaneous radiative forcing inW/m2 (red)(b). Globally averaged surface temperature change (relative to 1960–2000) for the mean of the atmospheric general circulationmodel simulations without dust (blue) and with dust (red) compared against the observed changes (black triangles)(c). The variability inthe ensemble simulations are shown as shaded areas for the no dust (cyan) and dust (gold) simulations. Net release of carbon dioxide inGtC/year deduced from the change in dust deposited to oceans (blue), land areas (green) and the fire portion of the land flux (red)(d): notethat positive means a flux into the atmosphere. The net CO2 flux anomalies into the atmosphere from the land and ocean model simulationscomputed here including dust variability (blue line) compared to the residual CO2 flux (black) and uncertainty (cyan shading) computed fromsimulations not including dust variations from a recent synthesis (LeQuere et al., 2009). The shaded blue region represents the uncertaintiesin the residual CO2 flux (LeQuere et al., 2009). The background green and yellow boxes represent the least dusty time period (green:1955–1964) and the most dusty time period (1980–1990) during the 20th century.
Atmos. Chem. Phys., 10, 10875–10893, 2010 www.atmos-chem-phys.net/10/10875/2010/

N. M. Mahowald et al.: Observed 20th century desert dust variability 10885
Radiative Forcing
-2
-1
0
1
2
W/m
CO AerosolDirect
AerosolIndirect
Anthropogenic Forcing
From dust changes (1980-1989 compared to 1955-1964)
Global land surface temperature change
Obs.Model w/ Dust
Northern Tropical Land Precipitation Change (1980-1989 vs 1955-1964)
-0.3
-0.2
-0.1
-0.0
0.1
delt
a Pr
ecip
itat
ion
(mm
/day
)
Obs.
Total
(1980-1989 compared to 1955-1964)
AerosolDirect
AerosolIndirect
Ocean COUptake
Land COUptake
a.
b.
c.
del
ta T
(K)
0.0
0.2
0.4
0.6
0.8
Model w/out dust
Model w/ Dust
Model w/out dust
2 2
2
2
Fig. 4. Change in radiative forcing (W/m2) from changes in anthropogenic forcing (a, left panel) as estimated from the IPCC for carbondioxide (red) (Forster, 2007), aerosol direct forcing (blue) and indirect forcing (cyan), and for (a, right panel) dust changes as estimated herefor the period 1980–1989 (dusty) compared to 1955–1964 (non dusty). Dark blue indicates direct radiative forcing from dust changes, cyanindicates indirect radiative forcing from dust changes, red indicates changes in radiative forcing from ocean uptake of carbon dioxide due tochanges in dust, and green indicates changes in radiative forcing from land uptake of carbon (which is opposite in sign to the other forcings).The total radiative forcing from dust changes between 1980–1989 and 1955–1964 is shown in black. The uncertainty estimates are calculatedin Sect. 4. Change in globally averaged surface temperature between the dusty time period (1980–1989) compared to the non-dusty timeperiod (1955–1964) for the model simulations (over land) without dust (blue) with dust (red) and observations (black) (Brohan et al., 2006)(b). Change in Northern Hemisphere Tropical precipitation over land (0–20◦ N) between the dusty and non-dusty time period in the modelwithout dust (blue), the model with dust (red) and observations (black) (Dai et al., 2004)(c). The uncertainty envelope in radiative forcing (a)comes from the uncertainty analysis in the Sect. 4, while in the uncertainty envelopes in the temperature and precipitation (b and c) representinterannual variability (and ensemble members for the model).
The 20th century changes in desert dust can impact theability of the land biosphere to take up carbon dioxide byaltering precipitation and temperature patterns (Jones et al.,2009), as well as by changing the amount and characteristicsof the incoming solar radiation (Mercado et al., 2009). Us-ing a land biogeochemistry model to simulate the impact ofchanging dust on the land carbon cycle, we estimate a de-crease in the land uptake of carbon over the 20th century,
during the transition from wetter to drier conditions due tothe increase of dust (Fig. 3d). Integrated over the 20th cen-tury, this results in 6 ppm (12 Pg C) more CO2 in the atmo-sphere in the 1990’s, much of it coming out through a higherincidence of fires in a climate with changing dust (Fig. 3d).The increased carbon dioxide concentrations will result in awarming (more than offsetting the ocean uptake of carbon)(Figs. 3 and 4). The net result of the land and ocean carbon
www.atmos-chem-phys.net/10/10875/2010/ Atmos. Chem. Phys., 10, 10875–10893, 2010

10886 N. M. Mahowald et al.: Observed 20th century desert dust variability
a. no DUST (1980-1989 vs 1955-1964) b. DUST (1980-1989 vs 1955-1964)
c. DUST vs. no DUST (1980-1989 vs. 1955-1964) d. Obs. T (1980-1989 vs. 1955-1964)
90N
0N
90S180W 0E 180E
90N
0N
90S
90N
0N
90S
90N
0N
90S
180W 0E 180E
180W 0E 180E 180W 0E 180E
Surface Temperature Change (K)
Fig. 5. Model estimated surface temperature change for 1980–1989 vs. 1955–1965 with no dust radiative forcing(a), with dust radiativeforcing (b), and the difference in the surface temperature change (1980–1989 minus 1955–1965) between simulations with and without dustradiative forcing(c). The change in temperature between 1980–1989 vs. 1955–1965 from observations (only over land)(d). For (a–c) onlystatistically significant results at the 95% confidence level are shown, including all the ensemble members. For (d) the grey color indicateswhere observations are available, but did not show a statistically significant result (grey is below the statistically significant level for themodeled results).
flux response to dust is surprisingly similar to the residualunexplained carbon fluxes deduced from atmospheric con-centrations, land and ocean biogeochemistry models in a re-cent synthesis (LeQuere et al., 2009) (Fig. 3e). This temporalcovariance between the residual carbon flux and the flux as-sociated with desert dust suggests that much of residual car-bon flux may be associated with desert dust fluctuations. Themodel results suggest that as the land system moves from therelatively less dusty 1955–1964 period into the more dusty1980–1989, there is a positive carbon flux from the land tothe atmosphere. However, caution should be used in inter-preting this comparison, since the precipitation shifts asso-ciated with the desert dust should already be included in thedata used to drive the land biogeochemistry models used toderive the residual carbon flux.
Much of the change in terrestrial carbon occurs in theNorthern Tropics (0–20◦ N) in the model (Fig. 8a). Thespatial distribution of the land carbon anomalies suggests
that dust direct radiative forcing reduces productivity overlarge regions of the globe (Fig. 9a). Most of this reductionappears to be associated with changes in moisture availability(Fig. 9b), consistent with the shifts in precipitation predictedby the model (Fig. 6). This suggests that the shifts in precipi-tation are most important to these changes in land carbon up-take, not changes in insolation (direct vs. diffuse) (Mercadoet al., 2009), but the sensitivity of the carbon uptake in thismodel to different forcings has not been tested rigorously.
4 Uncertainty analysis
We estimate the uncertainty from each part of the analysis inthis paper. We use a simple approach in this first estimateof dust variability and impacts on the 20th century and addthe uncertainty from each step in the process. First, to de-duce the uncertainty associated with the estimated temporal
Atmos. Chem. Phys., 10, 10875–10893, 2010 www.atmos-chem-phys.net/10/10875/2010/

N. M. Mahowald et al.: Observed 20th century desert dust variability 10887
a. no DUST (1980-1989 vs 1955-1964) b. DUST (1980-1989 vs 1955-1964)
c. DUST vs. no DUST (1980-1989 vs. 1955-1964) d. Obs. T (1980-1989 vs. 1955-1964)
180W 0E 180E 180W 0E 180E
90N
0N
90S
90N
0N
90S
90N
0N
90S
90N
0N
90S180W 0E 180E 180W 0E 180E
Precipitation (mm/day)
Fig. 6. Model estimated change in precipitation for 1980–1989 vs. 1955–1965 with no dust radiative forcing(a), with dust radiative forcing(b), and the difference in the precipitation change (1980–1989 minus 1955–1965) between simulations with and without dust radiative forcing(c). The change in precipitation between 1980–1989 vs. 1955–1965 from observations (only over land)(d). For (a–c) only statisticallysignificant results at the 95% confidence level are shown, including all the ensemble members. For (d) the grey color indicates whereobservations are available, but did not show a statistically significant result (grey is below the statistically significant level for the modeledresults).
variability in dustiness, we look at the variability in relativedeposition across the deposition sites that we assume repre-sent the same source. This uncertainty is estimated for thesources with the most paleodata records (Australia, SouthAmerica and the Middle East/Central Asia) by calculatingthe standard deviation in relative deposition at each time, andthen averaging this value over all times. This results in stan-dard deviations in relative deposition of 41%, 28% and 33%for Australia, South America and the Middle East/CentralAsia, respectively. We assume that the true uncertainty inour time series of source variability (due to the lack of suffi-cient paleodatasets) is the highest of these (40%) for all oursource regions for all time.
For the radiative forcing calculation and the climate re-sponse estimates in the model, there is additional uncertaintyassociated with the uncertainties in the optical properties ofmineral aerosols. Based on the modeling studies included inthe Intergovernmental Panel on Climate Change (IPCC), fo-
cusing on those studies using single scattering albedos thatmatch recent observations (Forster et al., 2007), we estimateapproximately 20% uncertainty in the direct radiative forcingof dust. The climate response of the system to this radiativeforcing appears to be to move precipitation away from thedust layer and cool surface temperatures in several modelstudies using observed single scattering albedo (Yoshiokaet al., 2007). We thus assume that direct radiative forcingand climate responses to dust have an uncertainty of 40%(from source strength) plus 20% (from mineral aerosol opti-cal property uncertainties), totaling 60%.
The uncertainties in the indirect radiative forcing of themineral aerosols are assumed to be the uncertainties asso-ciated with the dust variability, as well as the uncertain-ties associated with the indirect effect itself (+100%/−50%)(Forster et al., 2007). In addition, we have not directly cal-culated the indirect effect, but rather estimated it based onanthropogenic aerosol results. We assume that the sign of
www.atmos-chem-phys.net/10/10875/2010/ Atmos. Chem. Phys., 10, 10875–10893, 2010

10888 N. M. Mahowald et al.: Observed 20th century desert dust variability
b. DUST (1980-1989 vs 1955-1964)a. no DUST (1980-1989 vs 1955-1964)
c. DUST vs. no DUST (1980-1989 vs. 1955-1964) d. Obs. Sea Level Pressure (1980-1989 vs. 1955-1964)
90N
0N
90S
90N
0N
90S
90N
0N
90S
90N
0N
90S
180W 0E 180E
180W 0E 180E 180W 0E 180E
180W 0E 180E
Sea level pressure (Pa)
Fig. 7. Model estimated change in sea level pressure for 1980–1989 vs. 1955–1965 with no dust radiative forcing(a), with dust radiativeforcing (b), and the difference in the sea level pressure change (1980–1989 minus 1955–1965) between simulations with and without dustradiative forcing(c). The change in sea level pressure between 1980–1989 vs. 1955–1965 from observationally based estimates(d). For(a–c) only statistically significant results at the 95% confidence level are shown, including all the ensemble members. For (d) the grey colorindicates where observations are available, but did not show a statistically significant result (grey is below the statistically significant levelfor the modeled results).
the indirect effect is known (negative) so that we assume ouruncertainties are (±100%).
Uncertainties in the response to dust in the ocean uptakeof carbon dioxide are estimated using the ocean carbon re-sponse for several models included in a recent intercompari-son (LeQuere et al., 2009), using the same dust forcing (Mal-trud et al., 2010). The modeled response to iron was highlyvariable with uncertainties between 50–100%. We assumehere an uncertainty of 60%, so that our total uncertainty inocean response is 100% (40% +60%). The ocean model-ing does not include any physical climate impacts of aerosolsonto the ocean biogeochemistry, and thus the uncertainty es-timate may be an underestimate.
For the land uptake of carbon, the uncertainties come fromthe dust variability (40%), the radiative forcing and climateresponse (20%), and uncertainties in different land model re-sponses to the same forcing. We use a study that looked at theclimate response for several carbon cycle models over 1958to 2002. Over these five models (all of which were carbon-
only models), the mean uptake is 83.2 PgC, with a standarddeviation of 16.6 PgC, or 20% different (Sitch et al., 2008).We thus assume our uncertainty in land model uptake of car-bon from dust is 80% (40% + 20% + 20%).
Notice that our uncertainties are large, and that much ofthe uncertainties are associated with the change in dustinessdeduced from a relatively few paleodata sets. We includethese uncertainty estimates into our radiative forcing calcu-lations in Fig. 2.
5 Summary and conclusions
This study represents a first attempt to reconstruct desert dustvariability over the 20th century based on observational andmodel synthesis. Our results have large uncertainties: muchof the uncertainties are due to the sparse data available forthis time period, thus suggesting that more paleodata recordscovering the recent past would improve our understanding
Atmos. Chem. Phys., 10, 10875–10893, 2010 www.atmos-chem-phys.net/10/10875/2010/

N. M. Mahowald et al.: Observed 20th century desert dust variability 10889
1870 2000 1870 2000 1870 2000
1870 2000 1870 2000 1870 2000
1870 1870 20001870 2000
a. b. c.
d. e. f.
g. h. i.
Fig. 8. Modeled ocean biogeochemical responses to desert dustchanges for denitrification(a), nitrogen (N) fixation(b), reactivenitrogen imbalance(c), primary production(d), particulate organicexport (POC)(e), calcium carbonate export (CaCO3) (f), sea-aircarbon dioxide fluxes (f), atmospheric CO2 (g), and sea-air oxygenfluxes(h).
of desert dust variability since the preindustrial time pe-riod. The North African, East Asian and Middle East/CentralAsian sources are the most important, and least constrained,and thus should be the high priority for future observations.Using established models, we estimate the climate and bio-geochemical response from these changes in 20th centurydust. There remain large uncertainties in the response todesert dust in the models, due to uncertainties in desert dustdistributions, optical parameters, and indirect effects in theatmosphere, as well as uncertainties in the ocean and landbiogeochemistry models and their responses to desert dust.
We do not consider important interactions such as the im-pact of desert dust aerosols on air quality and health (Pros-pero, 1999), and atmospheric chemistry (Dentener et al.,1996). We deal with the potential for indirect effect ofaerosols on climate with a simple, back of the envelope ap-proach, and do not consider the complete effects of indi-rect forcing as in a full, interactive model. In addition, thechanges in desert dust reconstructed here will impact the in-direct effects of anthropogenic aerosols by providing addi-tional surfaces for condensation to occur on.
Our results suggest that desert dust roughly doubled overthe 20th century over much, but not all the globe (Fig. 3a andb). The largest estimated differences were between the dusty1980–1989 period compared to the relatively dust-free 1955–
Total Column Carbon (gC/m2)
Moisture availability (fraction)
a.
b.
Fig. 9. The change in total land column carbon inventory because ofdust variations and their impact on radiative (averaged over 1979–1998)(a), and the change in moisture availability for growth (aver-aged over 1870–1998) due to dust (simulations including dust radia-tive forcing minus simulations not including dust radiative forcing.An increase in the latter value indicates that the plants have moremoisture available to them for growth.
1964 period. The net radiative forcing due to dust betweenthe dusty (1980–1989) and non-dusty (1955–1964) time pe-riods is−0.57 W/m2
± 0.46 (Fig. 4a). A smaller net radia-tive forcing for the change in dust of−0.14± 0.11 W/m2 isobtained for the time period of 1990–1999 compared with1905–1914 from the direct radiative forcing, indirect radia-tive forcing of the aerosols, as well as the impact of car-bon uptake and release by the ocean and land ecosystems.Including desert dust fluctuations in climate model simula-tions improves our ability to simulate decadal scale variabil-ity in global surface temperature (Fig. 3c), regional changesin temperature and precipitation (Fig. 4b and c), and possiblyexplains the residual global carbon flux unexplained by othermechanisms (LeQuere et al., 2009) (Fig. 3e). Thus, con-tinued work to refine the variability and impact of “natural”desert dust fluctuations over the 20th century is important.
www.atmos-chem-phys.net/10/10875/2010/ Atmos. Chem. Phys., 10, 10875–10893, 2010

10890 N. M. Mahowald et al.: Observed 20th century desert dust variability
Acknowledgements.We would like to acknowledge NASA grantsNNG06G127G and NNX07AL80G, NSF grants NSF-0832782,0932946, 0745961 and OPP-0538427, and the UK Natural Envi-ronment Research Council. These simulations were conducted atthe National Center for Atmospheric Research, a National ScienceFoundation funded facility. Comments by Ron Miller improved themanuscript. We would like to thank three anonymous reviewers fortheir helpful comments.
Edited by: C. McNeil
References
Allan, R. J. and Ansell, T. J.: A new globally complete monthlyhistorical mean sea level pressure data set (HadSLP2): 1850–2004, J. Climate, 19, 5816–5842, 2006.
Andersen, K. K., Armengaud, A., and Genthon, C.: Atmosphericdust under glacial and interglacial conditions, Geophys. Res.Lett., 25, 2281–2284, 1998.
Aumont, O., Bopp, L., and Schulz, M.: What does temporal vari-ability in aeolian dust deposition contribute to sea-surface ironand chlorophyll distributions?, Geophys. Res. Lett., 35, L07607,doi:10.1029/2007GL031131, 2008.
Bonan, G., Levis, S., Kergoat, L., and Oleson, K.: Landscapes aspatches of plant functional types: An integrating concept for cli-mate and ecosystem models, Global Biogeochem. Cy., 16, 5.1–5.23, 2002.
Bonfils, C., Noblet-ducoudre, N. D., Braconnot, P., and Joussaume,S.: Hot desert albedo and climate change: mid-holocene mon-soon in North Africa, J. Climate, 14, 3724–3737, 2001.
Boyd, P. W. and Law, C. S.: The Southern Ocean Iron Release Ex-periment (SOIREE) introduction and summary, Deep-Sea Res.II, 48, 2425–2438, 2001.
Brohan, P., Kennedy, J., Harris, I., Tett, S., and Jones, P.: Un-certainty estimates in regional and global observed tempera-ture changes: a new dataset from 1850, J. Geophys. Res., 111,D12106, doi:10.1029/2005JD006548, 2006.
Collins, W., Bitz, C., Blackmon, M., Bonan, G., Bretherton, C.,Carton, J., Chang, P., Doney, S., Hack, J., Henderson, T., Kiehl,J., Large, W., McKenna, D., Santer, B., and Smith, R.: The com-munity climate system model: CCSM3, J. Climate, 19, 2122–2143, 2006a.
Collins, W. D., Rasch, P. J., Boville, B. A., Hack, J. J., McCaa, J.R., L.Williamson, D., Briegleb, B. P., Bitz, C. M., Lin, S.-J., andZhang, M.: The formulation and atmospheric simulation of theCommunity Atmosphere Model, CAM3, J. Climate, 19, 2144–2161, 2006b.
Dai, A., Trenberth, K., and Qian, T.: A global dataset of PalmerDrought Severity Index for 1870–2002: Relationship with soilmoisture and the effects of surface warming, J. Hydrometeorol.,5, 1117–1130, 2004.
Delmonte, B., Petit, J. R., Basile-Doelsch, I., Jagoutz, E., andMaggi, V.: Late Quaternary Interglacials in East Antarctica FromIce-Core Dust Records, The Climate of Past Interglacials, editedby: Sirocko, F., Litt, T., and Clausen, M., Elsevier, Amsterdam,53–73, 2007.
Delmonte, B., Delmas, R. J., and Petit, J.-R.: Comment on “Dustprovenance in Antarctic ice during glacial periods: from where
in southern South America?”, Geophys. Res. Lett., 35, L08707,doi:10.1029/2007GL032075(032008), 2008.
DeMott, P., Sassen, K., Poellot, M., Baumgardner, D., Rogers,D., Brooks, S., Prenni, A., and Kreidenweis, S.: African dustaerosols as atmospheric ice nuclei, Geophys. Res. Lett., 30,1732, doi:1710.1029/2003GL017410, 2003.
Dentener, F. J., Carmichael, G. R., Zhang, Y., Lelieveld, J., andCrutzen, P. J.: Role of mineral aerosol as a reactive surface in theglobal troposphere, J. Geophys. Res., 101, 22869–22889, 1996.
Donarummo, J., Ram, M., and Stolz, M. R.: Sun/dust correla-tions and volcanic interference, Geophys. Res. Lett., 29(9), 1361,doi:10.1029/2002gl014858, 2002.
Doney, S., Lima, I., Moore, J. K., Behrenfeld, M., mahowald, N.,Maltrud, M., Glober, D., McGillicuddy, D., and Takahashi, T.:Skill metrics for confronting global upper ocean ecosystem bio-geochemistry models against field and remote sensing data, J.Mar. Sci., 76, 95–112, 2009.
Falkowski, P. G., Barber, R. T., and Smetacek, V.: BiogeochemicalControls and Feedbacks on Ocean Primary Production, Science,281, 200–206, 1998.
Flanner, M. and Zender, C.: Linking snowpack microphysicsand albedo evolution, J. Geophys. Res., 111, D12208,doi:10.1029/.2005JD006834, 2006.
Flanner, M. G., Zender, C. S., Randerson, J. T., and Rasch,P. J.: Present-Day Climate Forcing and Response fromBlack Carbon in Snow, J. Geophys. Res., 112(D11), D11202,doi:10.1029/2006JD008003, 2007.
Flanner, M. G., Zender, C. S., Hess, P. G., Mahowald, N. M.,Painter, T. H., Ramanathan, V., and Rasch, P. J.: Springtimewarming and reduced snow cover from carbonaceous particles,Atmos. Chem. Phys., 9, 2481–2497, doi:10.5194/acp-9-2481-2009, 2009.
Forster, P., Ramaswamy, V., Artaxo, P., Berntsen, T., Betts, R., Fa-hey, D. W., Haywood, J., Lean, J., Lowe, D. C., Myhre, G.,Nganga, J., Prinn, R., Raga, G., Schulz, M., and Van Dorland,R.: Changes in Atmospheric Constituents and in Radiative Forc-ing, in: Climate Change 2007: The Physical Science Basis. Con-tribution of Working Group I to the Fourth Assessment Reportof the Intergovernmental Panel on Climate Change, edited by:Solomon, S., Qin, D., Manning, M., Chen, Z., Marquis, M., Av-eryt, K. B., Tignor, M., and Miller, H. L., Cambridge UniversityPress, Cambridge, United Kingdom and New York, NY, USA,130–234, 2007.
Fung, I., Meyn, S. K., Tegen, I., Doney, S., John, J., and Bishop, J.:Iron supply and demand in the upper ocean, Global Biogeochem.Cy., 14, 281–295, 2000.
Gaiero, D. M.: Reply to comment by B. Delmonte et al. on “Dustprovenance in Antarctic ice during glacial periods: From wherein southern South America?”, Geophys. Res. Lett., 35, L08708,doi:10.1029/2007GL032477(032008), 2008.
Gillette, D. A.: Threshold friction velocities for dust production foragricultural soils, J. Geophys. Res., 93, 12645–12662, 1988.
Gillette, D., Hardebeck, E., and Parker, J.: Large-scale variability ofwind erosion mass flux rates at Owens Lake2. Role of roughnesschange, particle limitation, change of threshold friction velocity,ant the Owen effect, J. Geophys. Res., 102, 25989–25998, 1997.
Ginoux, P., Chin, M., Tegen, I., Prospero, J. M., Holben, B.N., Dubovik, O., and Lin, S.-J.: Sources and distribution ofdust aerosols with the GOCART model, J. Geophys. Res., 106,
Atmos. Chem. Phys., 10, 10875–10893, 2010 www.atmos-chem-phys.net/10/10875/2010/

N. M. Mahowald et al.: Observed 20th century desert dust variability 10891
20255–20273, 2001.Grousset, F. and Biscaye, P.: Tracing dust sources and transport
patterns using Sr, Nd and Pb isotopes, Chem. Geol., 222, 149–167, 2005.
Hoose, C., Lohmann, U., Erdin, R., and Tegen, I.: Global Influenceof Dust Mineralogical Composition on Heterogeneous Ice Nu-cleation in Mixed-Phase Clouds, Environ. Res. Lett., 3, 025003,doi:10.1088/1748-9326/3/2/025003, 2008.
Jones, C., Lowe, J., Liddicoat, S., and Betts, R.: Committed terres-trial ecosystem changes due to climate change, Nature Geosci.,2(7), doi:10.1038/ngeo1555, 2009.
Kaspari, S., Mayewski, P., Kang, S., Sneed, S., Hou, S., Hooke, R.,Kreutz, K., Introne, D., Handley, M., Maasch, K., Qin, D., andRen, J.: Reduction in northward incursions of the South Asianmonsson since∼1400 AD inferred from a Mt. Everest ice core,Geophys. Res. Lett., 34, L16701, doi:10.1029/2007GL030440,2007.
Kohfeld, K. E. and Harrison, S. P.: DIRTMAP: the geologicalrecord of dust, Earth Sci. Rev., 54, 81–114, 2001.
Koretsky, C., Sverjensky, D., Salisbury, J., and D’Aria, D.: De-tection of surface hydroxyl speies on quart, gamma-aluminaand feldspars using diffuse reflectance infrared spectroscopy,Geochim. Cosmochim. Acta, 61, 2193–2210, 1997.
Krishnamurty, A., Moore, J. K., Mahowald, N., Luo, C.,Doney, S., Lindsay, K., and Zender, C.: Impacts of increas-ing anthropogenic soluble iron and nitrogen deposition onocean biogeochemistry, Global Biogeochem. Cy., 23, BG3016,doi:10.1029/2008/GB003440, 2009.
LeQuere, C., Raupach, M., Canadell, J., Marland, G., Bopp, L.,Ciasa, P., Conway, T., Doney, S., Feely, R., Foster, P., Friedling-stein, P., Gurney, K., Hougton, R., House, J., Hungtingford, C.,Levy, P., Lomas, M., Majkut, J., Metzl, N., Ometto, J., Peters,G., Prentice, I. C., Randerson, J., Running, S., Sarmiento, J.,Schuter, U., Sitch, S., Takahashi, T., Viovy, N., Werf, G. v. d.,and Woodward, F.: Trends in the sources and sinks of carbondioxide, Nature Geosci., 2, 1831–1836, doi:10.1038/ngeo1689,2009.
Li, F., Ginoux, P., and Ramaswamy, V.: Distribution, transport anddepositoin of mineral dust in the Southern Ocean and Antarctica:Contributions of major sources, J. Geophys. Res., 113, D10207,doi:10.1029/2007JD009190, 2008.
Luo, C., Mahowald, N., and Corral, J.: Sensitivity studyof meteorological parameters on mineral aerosol mobiliza-tion, transport and idstribution, J. Geophys. Res., 108, 4447,4410.1029/2003JD0003483, 2003.
Mahowald, N.: Anthropocence changes in desert are: sensitivityto climate model predictions, Geophys. Res. Lett., 34, 1475,doi:10.1029/2007GL030472, 2007.
Mahowald, N. and Kiehl, L.: Mineral aerosol and cloud interacti-ocns, Geophys. Res. Lett., 30, 1475, doi:10.109/2002GL016762,2003.
Mahowald, N. M. and Luo, C.: A less dusty future?, Geophys. Res.Lett., 30, 1903, doi:1910.1029/2003GRL017880, 2003.
Mahowald, N., Kohfeld, K., Hansson, M., Balkanski, Y., Harrison,S. P., Prentice, I. C., Shulz, M., and Rodhe, H.: Dust sources anddeposition during the last glacial maximum and current climate:A comparison of model results with paleodata from ice cores andmarine sediments, J. Geophys. Res., 104, 15895–15916, 1999.
Mahowald, N., Zender, C., Luo, C., Corral, J., Savoie, D., and Tor-
res, O.: Understanding the 30-year Barbados desert dust record,J. Geophys. Res., 107, 4561, doi:10.129/2002JD002097, 2002.
Mahowald, N., Luo, C., Corral, J. d., and Zender, C.: Interannualvariability in atmospheric mineral aerosols from a 22-year modelsimulation and observational data, J. Geophys. Res., 108, 4352,doi:4310.1029/2002JD002821, 2003.
Mahowald, N., Rivera, G., and Luo, C.: Comment on “Relative im-portance of climate and land use in determining present and fu-ture global soil dust emission”, Geophys. Res. Lett., 31, L24105,doi:24110.21029/22004GL021272, 2004.
Mahowald, N., D. Muhs, Levis, S., Rasch, P., Yoshioka, M.,and Zender, C.: Change in atmospheric mineral aerosols in re-sponse to climate: last glacial period, pre-industrial, modernand doubled-carbon dioxide climates, J. Geophys. Res., 111,D10202, doi:10210.11029/12005JD006653, 2006a.
Mahowald, N., Yoshioka, M., Collins, W., Conley, A., Fillmore, D.,and Coleman, D.: Climate response and radiative forcing frommineral aerosols during the last glacial maximum, pre-industrialand doubled-carbon dioxide climates, Geophys. Res. Lett., 33,D10202, doi:10.1029/2006GL026126, 2006b.
Mahowald, N., Engelstaedter, S., Luo, C., Sealy, A., Artaxo, P.,Benitez-Nelson, C., Bonnet, S., Chen, Y., Chuang, P. Y., Co-hen, D. D., Dulac, F., Herut, B., Johansen, A. M., Kubilay, N.,Losno, R., Maenhaut, W., Paytan, A., Prospero, J. M., Shank, L.M., and Siefert, R. L.: Atmospheric Iron deposition: Global dis-tribution, variability and human perturbations, Annu. Rev. Mar.Sci., 1, 245–278, doi:210.1146/annurev/marine.010908.163727,2009.
Mahowald, N., Albani, S., Engelstaedter, S., Winckler, G., and Go-man, M.: Model insight into paleodust records, Quarternary Sci.Rev., accepted, 2010.
Maltrud, M., Chavez, F. P., Dutkiewicz, S., Gruber, N., Jin, X.,Sarmiento, J. L., Tagliabue, A., Doney, S., and Lima, I.: Atmo-spheric cabon dioxide reduction from ocean iron fertilization: amodel intercomparison study, in preparation, 2010.
Marino, F., Castellano, E., Ceccato, D., Deckker, P. D., Del-monte, B., Ghermandi, G., Maggi, V., Petit, J. R., Revel-Rolland, M., and Udisti, R.: Defining the geochemical com-position of the EPICA Dome C ice core during the lastglacial-interglacial cycle, Geochem. Geophy. Geosy., 9, 002008,doi:10.1029/2008GC002023(002008), 2008.
Martin, J., Gordon, R. M., and Fitzwater, S. E.: The case for iron,Limnol. Oceanogr., 36, 1793–1802, 1991.
Mayewski, P. A., Lyons, W. B., Zielinski, G., Twickler, M., Whit-low, S., Dibb, J., Grootes, P., Tay- lor, K., Whung, P. Y., Fosberry,L., Wake, C., and Welch, K.: An ice-core based late Holocenehistory for the Transantarctic mountains, Antarctica, Contribu-tions to Antarctic Research IV, Antarctic Res. Series, 67, 33–45,1995.
McConnell, J. and Edwards, R.: Coal burning leaves toxicmetal legacy in the Arctic, P. Natl. Acad. Sci., 105(34),doi:10.1073/pnas.083564105, 2008.
McConnell, J. R., Aristarain, A., Banta, J., Edwards, P., and Simoes,J.: 20th Century doubling in dust archived in an AntarcticPenisula ice core parallels climate change and desertification inSouth America, P. Natl. Acad. Sci., 104, 5743–5748, 2007.
Meeker, L. and Mayewski, P.: 1400-year high resolution record ofatmospheric circulation over the North Atlantic and Asia, TheHolocene, 12, 257–266, 2002.
www.atmos-chem-phys.net/10/10875/2010/ Atmos. Chem. Phys., 10, 10875–10893, 2010

10892 N. M. Mahowald et al.: Observed 20th century desert dust variability
Mercado, L., Bellouin, N., Stich, S., Boucher, O., Huntingford, C.,Wild, M., and Wild, P.: Impacts of changes in diffuse radia-tion on the global land carbon sink, Nature, 458, 01014–01018,doi:10.1028/nature07949, 2009.
Miller, R. and Tegen, I.: Climate Response to Soil Dust Aerosols,American Meteorlogical Society, 11, 3247–3267, 1998.
Moore, C. M., Mills, M., Milnes, A., Langois, R., Achterberg, E.,Lochte, K., Geider, R., and LaRoche, J.: iron limits primary pro-ductivity during spring blooms development in the central NorthAtlantic, Glob. Change Biol., 12, 626–634, 2006.
Mosley-Thompson, E., Thompson, L. G., Grootes, P., and Gunde-strup, N.: Little ice age (neoglacial) paleoenvironmental condi-tions at siple station, Antarctica, J. Glaciol., 14, 199–204, 1990.
Moullin, C. and Chiapello, I.: Impact of human-induced deserti-fication on the intensification of the Sahel dust emission andexport over the last decades, Geophys. Res. Lett., 33, L18808,doi:10.1029/2006GL025923, 2006.
Mukhopadhyay, S. and Kreycik, P.: Dust generation and droughtpatterns in Africa from helium-4 in a modern Cape Verde coral,Geophys. Res. Lett., 35, L20820, doi:10.1029/2008GL035722,2008.
Mulitza, S., Heslop, D., Pittauerova, D., Fischer, H., Meyer, I.,Stuut, J.-B., Zabel, M., Mollenhauer, G., Collins, J., Kuhnert,H., and Schulz, M.: Increase in African dust flux at the onset ofcommercial agriculture in the Sahel region, Nature, 466, 09226–09228, doi:10.1038/nature09213, 2010.
Neff, J., Reynolds, R., Belnap, J., and Lamothe, P.: Multi-decadalimpacts of grazing on soil physical and biogeochemical proper-ties in southeast Utah, Ecol. Appl., 15, 87–95, 2005.
Neff, J. C., Ballantyne, A. P., Farmer, G. L., Mahowald, N., Conroy,J. L., Landry, C. C., Overpeck, J. T., Painter, T. H., Lawrence, C.R., and Reynolds, R. L.: Increasing eolian dust deposition in thewestern United States linked to human activity, Nature Geosci.,1(3), doi:10.1038/ngeo, 2008.
Okin, G., Mahowald, N., Chadwick, O., and Artaxo, P.: The im-pact of desert dust on the biogeochemistry of phosphorus interrestrial ecosystems, Global Biogeochem. Cy., 18, GB2005,doi:2010.1029/2003GB002145, 2004.
Oleson, K. W., Niu, G.-Y., Yang, Z.-L., Lawrence, D. M., Thornton,P. E., Lawrence, P. J., Stockli, R., Dickinson, R. E., Bonan, G.B., Levis, S., Dai, A., and Qian, T.: Improvements to the Com-munity Land Model and their impact on the hydrological cycle, J.Geophys. Res., 113, G01021, doi:10.1029/2007JG000563, 2008.
Parekh, P., Dutkiewicz, S., Follows, M., and Ito, T.: Atmosphericcarbon dioxide in a less dusty world, Geophys. Res. Lett., 33,L03610, doi:10.1029/2005GL025098, 2006.
Patterson, D., Farley, K., and Norman, M.: He-4 as a tracer of conti-nental dust: A 1.9 million year record of aeolian flux to the westequatorial Pacific Ocean, Geochem. Geophy. Geosy., 63, 615–625, 1999.
Perlwitz, J., Tegen, I., and Miller, R.: Interactive soil dust aerosolmodel in the GISS GCM 1. Sensitivity of the soil dust cycle toradiative properties of soil dust aerosols, J. Geophys. Res., 106,18167–18192, 2001.
Petit, J. R., Jouzel, J., Raynaud, D., Barkov, N. I., Barnola, J.-M.,Basile, I., Bender, M., Chappellaz, J., Davis, M., Delaygue, G.,Delmotte, M., Kotlyakov, V. M., Legrand, M., Lipenkov, V. Y.,Lorius, C., Pepin, L., Ritz, C., Saltzman, E., and Stievenard, M.:Climate and atmospheric history of hte past 420000 years from
the Vostok Ice core, Antarctica, Nature, 399, 429–436, 1999.Prospero, J. M.: Long-range transport of mineral dust in the global
atmosphere: Impact of African dust on the environment of thesoutheastern United States, P. Natl. Acad. Sci., 96, 3396–3403,1999.
Prospero, J. and Lamb, P.: African droughts and dust transport tothe Caribbean: climate change implications, Science, 302, 1024–1027, 2003.
Prospero, J., Ginoux, P., Torres, O., Nicholson, S., andGill, T.: Environmental Characterization of Global sourcesof atmospheric soil dust derived from the NIMBUS-7TOMS absorbing aerosol product, Rev. Geophys., 40, 1002,doi:1010.1029/2000RG000095, 2002.
Reheis, M. C.: Dust deposition downwind of Owens (dry) Lake,1991-1994: Preliminary findings, J. Geophys. Res., 102, 25999–26008, 1997.
Rosenfeld, D. and Nirel, R.: Seeding effectiveness-the interactionof desert dust and the southern margins of rain cloud systems inIsrael, J. Appl. Meteorol., 35, 1502–1509, 1996.
Rosenfeld, D., Rudich, Y., and Lahav, R.: Desert dust suppressingprecipitation: a possible desertification feedback loop, P. Natl.Acad. Sci. USA, 98, 5975–5980, 2001.
Rosenfeld, D., Lohmann, U., Raga, G., O’Dowd, C., Kulmala,M., Fuzzi, S., Reissell, A., and Andreae, M.: Flood or drought:how do aerosols affect precipitation?, Science, 321, 1309–1312,doi:1310.1126/science.1160606, 2008.
Sassen, K.: Indirect climate forcing over the western USfrom Asian dust storms, Geophys. Res. Lett., 29, 012002,doi:10.1029/2001GL014051, 2002.
Sitch, S., Huntingford, C., Gedney, N., Levy, P., Lomas, M.,Piao, S. L., Betts, R., Cias, P., Cox, P., Friedlingstein, P.,Jones, C. D., Prentice, I. C., and Woodward, F. I.: Evalu-ation of terrestrial carbon cycle, future plant geography andclimate-carbon cycle feedbacks using five dynamic global veg-etation models (DGVMs), Glob. Change Biol., 14, 2015–2039,doi:2010.1111/j.1365-2486.2008.01626.x, 2008.
Smith, S., Huxman, T., Zitzer, S., Charlet, T., Housman, D., Cole-man, J., Fenstermaker, L., Seemann, J., and Nowak, R.: ElevatedCO2 increases productivity and invasive species success in anarid ecosystem, Nature, 408, 79–82, 2000.
Souney, J. M., Mayewski, P. A., Godwin, I., Morgan, V., Curran, M.A. J., van Ommen, T. D., and Palmer, A. S.: A late Holocene cli-mate record from Law Dome, East Antarctica, J. Geophys. Res.,107, 1–9, 2002.
Swap, R., Garstang, M., Greco, S., Talbot, R., and Kallberg, P.:Saharan dust in the Amazon Basin, Tellus, 44B, 133–149, 1992.
Tegen, I. and Fung, I.: Contribution to the atmospheric mineralaerosol load from land surface modification, J. Geophys. Res.,100, 18707–18726, 1995.
Tegen, I. and Miller, R.: A general circulation model study on theinterannual variability of soil dust aerosol, J. Geophys. Res., 103,25975–25,995, 1998.
Tegen, I., Werner, M., Harrison, S. P., and Kohfeld, K. E.: Rela-tive importance of climate and land use in determining presentand future global soil dust emission, Geophys. Res. Lett., 31,L05105, doi:05110.01029/02003GL019216, 2004.
Thompson, L. G., Mosley-Thompson, E., Grootes, P., and Pourchet,M.: Tropical glaciers: potential for paleoclimatic reconstruction,J. Geophys. Res., 89, 4638–4646, 1984.
Atmos. Chem. Phys., 10, 10875–10893, 2010 www.atmos-chem-phys.net/10/10875/2010/

N. M. Mahowald et al.: Observed 20th century desert dust variability 10893
Thompson, L. G., Mosley-Thompson, E., Davis, M. E., Lin, P.-N., Henderson, K. A., Cole-Dai, J., Bolzan, J. F., and Liu, K.-B.:Late Glacial Stage and Holocene Tropical Ice Core Records fromHuascaran, Peru, Science, 269, 46–50, 1995.
Thompson, L. G., Yao, T., Mosley-Thomspon, E., Davis, M. E.,Henderson, K. A., and Lin, P. N.: A High-Resolution MillennialRecord of the South Asian Monsson from Himalayan Ice Cores,Science, 289, p. 5486, 2000.
Thompson, L. G., Mosley-Thompson, E., Davis, M., Henderson,K., Brecher, H. H., Zagaorodnov, V. S., Mashiotta, T. A., Lin, P.-N., Mikhalenko, V. N., Hardy, D. R., and Beer, J.: Kilimanjaroice core records: evidence of Holocene climate change in tropicalafrica, Science, 298, 589–593, 2002.
Thornton, P., Lamarque, J. F., Rosenbloom, N. A., and Mahowald,N.: Influence of carbon-nitrogen cycle couplng on land modelresponse to CO2 fertilization and climate variability, Global Bio-geochem. Cy., 21, GB4018, doi:10.1029/2006GB002868, 2007.
Thornton, P. E., Doney, S. C., Lindsay, K., Moore, J. K., Ma-howald, N., Randerson, J. T., Fung, I., Lamarque, J.-F., Fed-dema, J. J., and Lee, Y.-H.: Carbon-nitrogen interactions regu-late climate-carbon cycle feedbacks: results from an atmosphere-ocean general circulation model, Biogeosciences, 6, 2099–2120,doi:10.5194/bg-6-2099-2009, 2009.
Vitousek, P.: Stoichiometry and flexibility in the Hawaiian modelsystem, in: Interactions of the Major Biogeochemical cycles:Global Change and Human Impacts, edited by: Melillo, J., Field,C., and Moldan, B., Island Press, Washington, DC, 177–192,2003.
Werner, M., Tegen, I., Harrison, S., Kohfeld, K., Prentice, I. C.,Balkanski, Y., Rodhe, H., and Roelandt, C.: Seasonal and in-terannual variability of the mineral dust cycle under presentand glacial climate conditions, J. Geophys. Res., 107, 4744,doi:4710.1029/2002JD002365, 2002.
Winckler, G., Anderson, R. F., and Schlosster, P.: Equa-torial Pacific productivity and dust flux during the mid-Pleistocene climate transition, Paleoceanography, 20, PA4025,doi:10.1029/2005PA001177, 2005.
Yoshioka, M., Mahowald, N., Dufresne, J.-L., and Luo, C.: Simu-lation of absorbing aerosol indices for African dust, J. Geophys.Res., 110, D18S17, doi:10.1029/2004JD005276, 2005.
Yoshioka, M., Mahowald, N., Conley, A., Collins, W., Fillmore, D.,and Coleman, D.: Impact of desert dust radiative forcing on Sa-hel precipitation: relative importance of dust compared to seasurface temperature variations, vegetation changes and green-house gas warming, J. Climate, 20, 1445–1467, 2007.
Zdanowicz, C. M., Zielinski, G. A., and Wake, C. P.: Characteristicsof modern atmospheric dust deposition in snow on the Penny icecap, Baffin Island, Arctic Canada, Tellus, 50B, 506–520, 1998.
Zender, C., Bian, H., and Newman, D.: Mineral DustEntrainment and Deposition (DEAD) model: Descriptionand 1990s dust climatology, J. Geophys. Res., 108, 4416,doi:4410.1029/2002JD002775, 2003a.
Zender, C., Newman, D., and Torres, O.: Spatial Heterogene-ity in Aerolian Erodibility: Uniform, Topographic, Geomor-phic and Hydrologic Hypotheses, J. Geophys. Res., 108, 4543,doi:4510.1029/2002JD003039, 2003b.
www.atmos-chem-phys.net/10/10875/2010/ Atmos. Chem. Phys., 10, 10875–10893, 2010