observing-system experiments using the operational nwp ... · this paper describes the ose results....
TRANSCRIPT

-29-
Observing-system Experiments
Using the Operational NWP System of JMA
Koji Yamashita
Numerical Prediction Division, Japan Meteorological Agency, Tokyo, Japan
Yoichiro Ohta
Numerical Prediction Division, Japan Meteorological Agency, Tokyo, Japan
Kiyotomi Sato
Numerical Prediction Division, Japan Meteorological Agency, Tokyo, Japan
Tetsuo Nakazawa
Meteorological Research Institute, Japan Meteorological Agency, Tsukuba, Japan
Abstract
The Numerical Prediction Division of the Japan Meteorological Agency (JMA) conducted
observing-system experiments (OSEs) using the operational NWP system of JMA targeted for
typhoons Sinlaku (0813) and Jangmi (0815) with T-PARC special observations in 2008. In many
cases, positive impacts were found both in track and intensity forecasts using these observations.
Additionally, assimilation of operational tropical cyclone (TC) bogus data contributed to the
improvement of track and intensity forecasts at the before-recurvature stage, although it degraded
track forecasts in some cases. Investigating the usage of special observations in the operational
system revealed a number of problems with the assimilation of horizontally dense dropwindsonde
observations. In verification of the sensitivity analysis system, OSEs using T-PARC special
observations over a high-sensitivity area showed better performance in TC track forecasts for Sinlaku.
These results are expected to contribute to improving the TC forecasts of the NWP system in the near
future.
1. Introduction
Under the cooperation of the North American, Asian and European THORPEX Regional
Committees, the THORPEX Pacific Asian Regional Campaign (T-PARC) for typhoon track forecasts
in the summer of 2008 was run, and included special observation techniques such as dropwindsondes
from aircraft, extra upper soundings by JMA observatories and research-vessel monitoring. In
addition, Meteorological Satellite Center of JMA (MSC) produced MTSAT-2 Rapid Scan Atmospheric

-30-
Motion Vectors for T-PARC (MTSAT-2-RS-AMV). OSEs using the operational NWP system of
JMA were performed for typhoons Sinlaku and Jangmi with T-PARC special observations. The aim
of the OSEs was to demonstrate the impact of special observations and the effectiveness of the
next-generation Interactive Forecast System.
This paper describes the OSE results. Sections 4.2 and 4.3 give a brief outline of the global
NWP system and the experimental design. Section 4.4 gives the OSE results and details some case
studies. Section 4.5 summarizes the results and concludes the paper.
2. Outline of the global NWP system
All experiments were conducted using the operational JMA GSM (TL959L60, horizontal
resolution approx. 20 km) and 4D-Var data assimilation system (inner resolution T159L60, horizontal
resolution approx. 80 km, 6-hour assimilation window). An outline of the global NWP system is
given in Table 1. More details of the system can be found in Nakagawa (2009).
Table 1 Outline of the global NWP system at JMA
Global Data Assimilation SystemMethod 4D-Var Resolution (inner model) T159L60 (Gaussian grid, horizontal resolution approx. 80 km,
model top 0.1 hPa)Assimilation window 6 hours (±3 hours, time slots approx. 1 hour)TC bogus data Not used in TEST and CNTL experiments but assimilated in
operational run and BOGUS
Global Spectral ModelResolution TL959L60 (reduced Gaussian grid, horizontal resolution approx.
20 km, model top 0.1 hPa)Forecast time 84 hours/216 hours (00, 06, 18 UTC/12 UTC)
3. Experimental design
Three experiments were performed in T-PARC:
(I) Special observations were assimilated with techniques including dropwindsonde from
aircraft, upper soundings from JMA observatories and research-vessel monitoring
(TEST).
(II) TC bogus data (JMA 2007) were assimilated instead of special observations (BOGUS).
(III) No special observations or bogus data were assimilated (CNTL).
The aims of BOGUS were to evaluate the current TC bogus technique and investigate the relative
importance of special observations in an operational context.
-31-
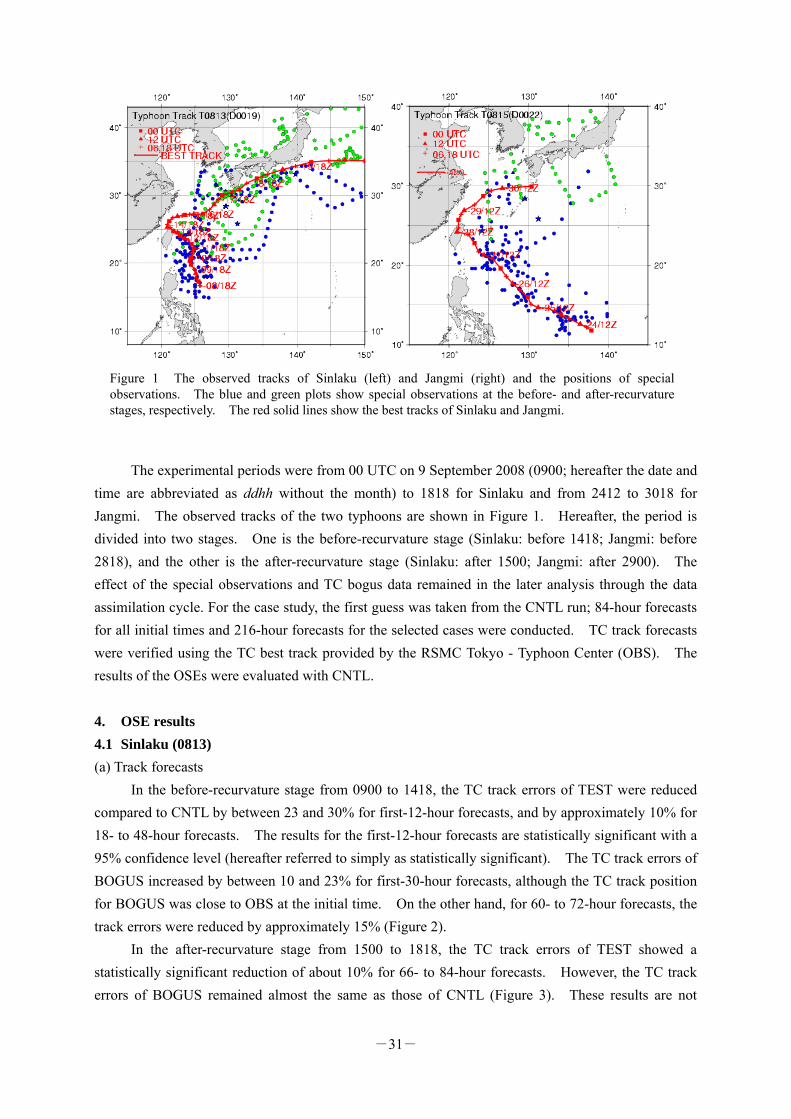
The experimental periods were from 00 UTC on 9 September 2008 (0900; hereafter the date and
time are abbreviated as ddhh without the month) to 1818 for Sinlaku and from 2412 to 3018 for
Jangmi. The observed tracks of the two typhoons are shown in Figure 1. Hereafter, the period is
divided into two stages. One is the before-recurvature stage (Sinlaku: before 1418; Jangmi: before
2818), and the other is the after-recurvature stage (Sinlaku: after 1500; Jangmi: after 2900). The
effect of the special observations and TC bogus data remained in the later analysis through the data
assimilation cycle. For the case study, the first guess was taken from the CNTL run; 84-hour forecasts
for all initial times and 216-hour forecasts for the selected cases were conducted. TC track forecasts
were verified using the TC best track provided by the RSMC Tokyo - Typhoon Center (OBS). The
results of the OSEs were evaluated with CNTL.
4. OSE results
4.1 Sinlaku (0813)
(a) Track forecasts
In the before-recurvature stage from 0900 to 1418, the TC track errors of TEST were reduced
compared to CNTL by between 23 and 30% for first-12-hour forecasts, and by approximately 10% for
18- to 48-hour forecasts. The results for the first-12-hour forecasts are statistically significant with a
95% confidence level (hereafter referred to simply as statistically significant). The TC track errors of
BOGUS increased by between 10 and 23% for first-30-hour forecasts, although the TC track position
for BOGUS was close to OBS at the initial time. On the other hand, for 60- to 72-hour forecasts, the
track errors were reduced by approximately 15% (Figure 2).
In the after-recurvature stage from 1500 to 1818, the TC track errors of TEST showed a
statistically significant reduction of about 10% for 66- to 84-hour forecasts. However, the TC track
errors of BOGUS remained almost the same as those of CNTL (Figure 3). These results are not
Figure 1 The observed tracks of Sinlaku (left) and Jangmi (right) and the positions of special observations. The blue and green plots show special observations at the before- and after-recurvature stages, respectively. The red solid lines show the best tracks of Sinlaku and Jangmi.
-32-
statistically significant. A forecast initialized at 0912 is shown in Figure 4. The tracks of both
TEST and BOGUS are closer to OBS data than those of CNTL.
(b) Intensity forecasts
The intensity forecasts were evaluated using the mean errors of the central pressure forecasts.
Figure 5 shows the results for the before-recurvature stage of Sinlaku. In this case, intensity forecast
errors showed a statistically significant reduction over 10 hPa in both TEST for 36-hour forecasts and
BOGUS for 24-hour forecasts. On the other hand, the impact on the intensity forecasts in TEST was
almost neutral in the after-recurvature stage. In the case of BOGUS, however, the intensity forecasts
showed negative pressure errors after the 12-hour stages (Figure 6). Since the typhoon was not in the
extra-tropical transition stage in this case, one reason may be that the operational NWP model did not
create a realistic typhoon structure.
(c) Impact of special observations on TC track predictions at 1112
Figure 7 shows the TC track forecasts of TEST, BOGUS and CNTL at 1112. BOGUS and
CNTL followed a track close to that of OBS at the beginning. The TC track forecasts of TEST
showed rapid recurvature, and this fast movement resulted in large track errors. We found that
dropwindsonde observations in the TC core fields within 200 km were assimilated (Figure 8). The
positions of observed wind circulations on each vertical level were different from those of OBS,
bringing a biased and warped vortex to the south in the analysis. The analysis fields for comparison
of TEST with CNTL are shown in Figure 9 as the differences between these results. Deepened
geopotential height and strengthened vortex circulation to the south and east of the TC center are
found. The TC generally tends to be moved to a deeper geopotential height, and moved southward
then northeastward. It can therefore be said that dropwindsonde data for the core region of the TC
have a large impact on TC forecasts. However, quality control (QC) procedures for observational
data around the TC center are difficult. This problem requires further investigation in the future.
-33-
Figure 2 Positional errors for Typhoon Sinlaku in
the before-recurvature stage from 0900 to 1418.
The red line is for TEST, which assimilated special
observations. The blue line is for CNTL, which did
not assimilate special observations. The green line
is for BOGUS, which assimilated TC bogus data but
did not use special observations. The red triangles
denote that the difference of TEST minus CNTL is
statistically significant with a 95% confidence level.
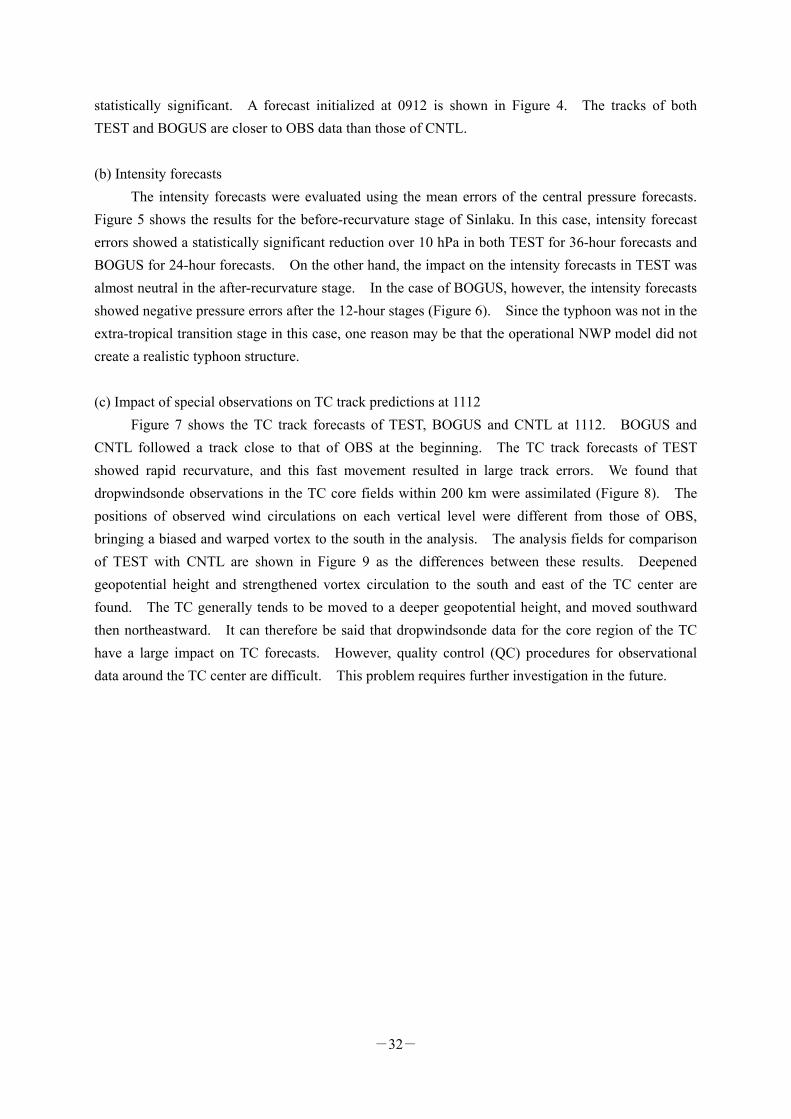
Figure 3 As per Figure 2, but for the
after-recurvature stage
Figure 4 Typhoon track forecasts from the OSEs with (red markers: TEST) and without (blue markers:
CNTL) special observations and with BOGUS data (green markers) for Typhoon Sinlaku, initialized at
0912. The black markers show OBS data. The numbers indicate the date of the typhoon’s location at
00 UTC.
18
171615
1413
12
1110
17
1514
13
12
15
16
1718
18
(Ⅰ)TEST
(Ⅱ)CNTL
OBS
(Ⅲ)BOGUS
10
1516
17
18

-34-
Figure 5 Mean error of TC central pressure
forecast for Typhoon Sinlaku in the before-
recurvature stage from 0900 to 1418. The line
notation is the same as that in Figure 2. The red
triangles denote that the result of TEST minus
CNTL is statistically significant with a 95%
confidence level, and the green triangles denote
that the result of BOGUS minus CNTL is
statistically significant.
Figure 6 As per Figure 5, but for the after-
recurvature stage
Figure 7 Typhoon track forecasts from the
OSEs with (red markers: TEST) and without
(blue markers: CNTL) C-130 special
observations and with BOGUS data (green
markers) for Typhoon Sinlaku, initialized at
1112. The black markers show OBS data. The
numbers indicate the date of the typhoon’s
location at 00 UTC.
Figure 8 C-130 special observations from 1111 to
1114, initialized at 1112. Black star, triangle,
square and circle plots show the positions of C-130
dropwindsonde observations.
11 UTC
13 UTC 12 UTC
14 UTC
TC center
12
1314
15 1617
18
1213
14
16 17
18
19
20
19
15

-35-
(d) Verification of sensitivity analysis system
To investigate the effectiveness of the sensitivity analysis system, we conducted another OSE
for special observations in the first mode of the-high sensitivity area calculated using the singular
vector (SV) method (Komori et al., 2010). The verification times were 1100 and 1000 for 24-hour
forecasts initiated at 1000 and 0900 (Figures 10 and 11). In these cases, two high-sensitivity areas
were found to the northeast and southwest of the TC center. Three numerical experiments were
carried out with different special observations as follows:
(I) Special observations to the northeast of the TC center (CASE_A)
(II) Special observations to the southwest of the TC center (CASE_B)
(III) Both CASE_A and CASE_B (CASE_A+B)
(IV) No special observations (CNTL)
(V) CASE_A without humidity (only OSE for 1100: NOVAPOR)
In the case of 1100, the TC track mean errors of CASE_A were reduced from those of CNTL by
between 32% and 45% for the early stages and by 16% after 60 hours. In this case, special
observations in the northeastern high-sensitivity area were more effective in improving the TC track
forecast. Improvements for NOVAPOR and CASE_A+B of between 32% and 45% for the early
stages and of 10% after 60 hours were also found (Figure 12). Comparing CASE_A and NOVAPOR,
CASE_A after the 60-hour forecast point showed a smaller improvement than NOVAPOR, indicating
that humidity observations contributed to the improvement of TC track forecasts after 60 hours. On
the other hand, the mean track errors in CASE_B increased, which may be because the observations
did not fit the analysis and the number of special observations for CASE_B was much lower than that
FT0
FT6
FT12FT0
FT6
FT12
(a) (b) (c)
Figure 9 Averaged wind vectors and geopotential height differences ((a) vertically averaged from 400
hPa to 700 hPa; (b) vertically averaged from 850 hPa to 1,000 hPa) defined as TEST minus CNTL in the
analysis at 1112. FT represents the forecast time from the initial time. The positions of the typhoon
plots and FT0 show the TC center of Typhoon Sinlaku at 1112. (c) TC track forecast of TEST initiated at
1112 from FT0 to FT12.
m/sm/s850 – 1,000 hPa400 - 700 hPa
TEST ( with drop ) – CNTL ( without drop ) (m)

-36-
in CASE_A. However, these are not considered to be the only reasons for the increased track errors
in CASE_B.
In the case of 1000, the TC track errors for CASE_A increased, although this case had
observations in the high-sensitivity area. On the other hand, the TC track errors were reduced in
CASE_B with observations in the low-sensitivity area. The special observations in CASE_B were
reflected appropriately in the analysis both to the southwest and to the northeast of the TC center,
resulting in the best forecasts for CASE_B. As for CASE_A, correction of counterclockwise
circulation to the northeast of the TC center was found in the analysis, causing the typhoon to move
northward and resulting in worse TC track forecasts. The impact of CASE_A+B was almost neutral
(Figure 13).

-37-
Figure 10 The sensitive areas in the first
mode calculated from the one-day forecast
field valid for 1100. Extra observation
points for upper-soundings by JMA research
vessels and ground observatories (green
points), dropsondes released by Falcon aircraft
(red) and those released by other planes
(yellow) are overlaid on the high-sensitivity
areas.
Figure 11 As per Figure 10, but from the
one-day forecast field valid for 1000.
Observation points for dropsondes released by
DOTSTAR aircraft (black) are overlaid on the
high-sensitivity areas.
Figure 12 Mean TC track forecast errors of Typhoon Sinlaku for CASE_A (red lines), CASE_B
(orange), CASE_A+B (green), NOVAPOR (thin blue) and CNTL (blue) from 1100 to 1112
High-sensitivity areas
Forecast field T+24 h
CASE_A
CASE_B
CASE_A
CASE_B
High-sensitivity areas
Forecast field T+24 h
0
50
100
150
200
250
0 6 12 18 24 30 36 42 48 54 60 66 72 78 84
Posi
tion
al e
rror (k
m)
Forecast time (hours)
CNTL
CASE_A
CASE_B
CASE_A+B
NOVAPOR

-38-
(e) Trial of OSEs using MTSAT-2-RS-AMV
MSC produced MTSAT-2-RS-AMV data derived from three consecutive images with intervals
of 15 minutes (MTSAT-2-RS-AMV_15MIN), 7 minutes (MTSAT-2-RS-AMV_7MIN) and 4 minutes
(MTSAT-2-RS-AMV_4MIN) for T-PARC. The OSEs for MTSAT-2-RS-AMV were conducted with
an initial time of 1718. The NWP system was the same as that of the OSEs for special observations
(see Section 4.2). The experimental design is outlined in Table 2.
Table 2 Experimental design of OSEs for MTSAT-2 Rapid Scan AMV
TEST CNTL
TC bogus data Not used Not used
Special observations Not used Not used
MTSAT-2 Rapid Scan AMVs Used Not used
Other observations Used Used
In TEST, a two-step thinning scheme was used as a trial. In this method,
MTSAT-2-RS-AMV_4MIN and MTSAT-2-RS-AMV_7MIN are thinned to a resolution of 100 km
(one AMV in each 1 deg. x 1 deg. x 100 hPa box in the hourly time window) after 200-km thinning
(one AMV in each 2 deg. x 2 deg. x 100 hPa box in the six-hour time window) of the other AMVs.
The other QC is the same as that for other AMVs. More details on the QC of AMVs can be found in
JMA (2007) and Yamashita (2008). Figure 14 shows examples of AMVs after QC at 18 – 19 UTC on
Figure 13 TC track forecast errors of Typhoon Sinlaku for CASE_A (red lines), CASE_B (orange),
CASE_A+B (green) and CNTL (blue) at 1000
0
50
100
150
200
0 6 12 18 24 30 36 42 48 54 60 66 72 78 84
Posi
tion
al e
rror (k
m)
Forecast time (hours)
CNTL
CASE_A+B
CASE_A
CASE_B

-39-
17 September 2008.
As a result, the slow bias speeds for TC track forecasts were slightly improved, indicating the
possibility of improvement for TC track forecasts using MTSAT-2-RS-AMV data (Figure 15 and
Figure 16).
Figure 15 Typhoon track forecasts from OSEs
with TEST (red markers) and CNTL (blue
markers) for Typhoon Sinlaku with an initial time
of 1718. The black markers show OBS data.
The numbers indicate the date of the typhoon’s
location at 00 UTC.
Figure 14 Distribution of MTSAT-2-
RS-AMVs after QC from 1718 to
1719. High layer wind barbs (less
than 500 hPa, red wind barbs) and low
ones (greater than 850 hPa, blue wind
barbs) are overlaid on the MTSAT-1R
IR image. The unit of wind barbs is
knots. Wind half-barbs are 5 knots,
and full barbs are 10 knots. Wind
flags are 50 knots.
Figure 16 TC track forecast errors of
Typhoon Sinlaku for TEST and CNTL with an
initial time of 1718
0
100
200
300
400
500
0 12 24 36 48 60 72
Posi
tion
al e
rror (km
)
Forecast time (hours)
TESTCNTLTESTCNTL
18
1919
20

-40-
4.2 Jangmi (0815)
(a) Track forecasts
Figure 17 shows average TC track forecast errors for Jangmi in the before-recurvature stage.
In this stage, both special observations and TC bogus data improved the track forecasts (24 to 42%
with 0- to 18-hour forecasts for TEST and 25% with the 6-hour forecast for BOGUS). It appears that
the analysis field was improved using special observations or TC bogus data at the before-recurvature
stage because Jangmi was located in an area where conventional observation data were sparse. For
BOGUS, the track forecasts became degraded after the 30-hour forecast stage. Figure 18 shows a
scatter diagram of positional errors for the 72-hour forecast. With TC bogus data, some forecast
tracks were shifted significantly leftward and decelerated. These cases made the average track
forecast errors worse.
Figure 19 is the same as Figure 17, but for the after-recurvature stage. No significant
difference was found between the mean track forecast errors for TEST and CNTL. As for BOGUS,
the track forecasts were slightly degraded for forecasts between 18 to 54 hours and slightly improved
for other forecast times.
0
100
200
300
400
500
600
0 12 24 36 48 60 72 84
Forecast time (hours)
Posi
tional err
or
(km
)
(Ⅰ)TEST(Ⅱ)BOGUS(Ⅲ)CNTL
Figure 17 Average TC track forecast errors for
Jangmi at the before-recurvature stage. The solid
red, solid green and dotted blue lines show the track
forecast errors for TEST, BOGUS and CNTL,
respectively. The red and green triangles indicate
that the differences of error from CNTL are
statistically significant at a 95% confidence level.
Figure 18 Scatter diagram of TC positional
errors for Jangmi in the before-recurvature stage
(72-hour forecast). The vertical and horizontal
axes denote along-track and cross-track errors.
The blue squares and red triangles show
BOGUS and CNTL, respectively.

-41-
0
200
400
600
800
1000
0 12 24 36 48 60 72 84
Forecast time (hours)
Pos
itio
nal err
or
(km
)
(Ⅰ)TEST(Ⅱ)BOGUS(Ⅲ)CNTL
Figure 19 As per Figure 17, but for the after- recurvature stage
(b) Intensity forecasts
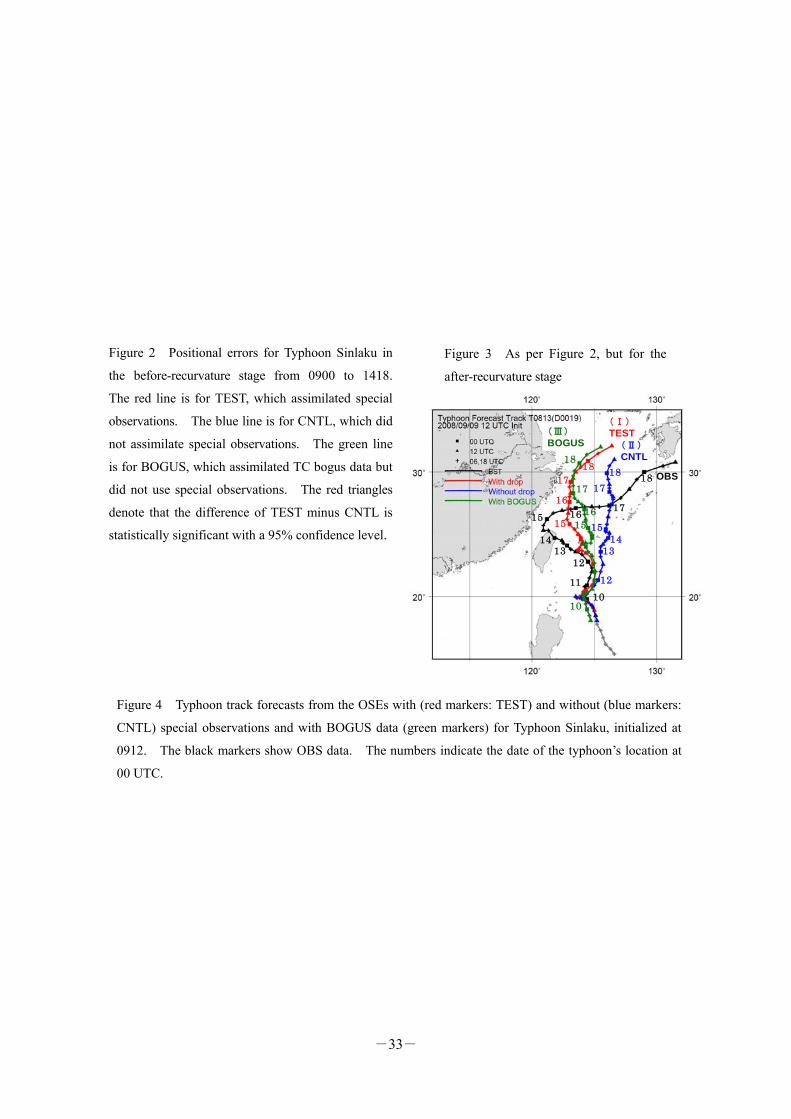
Figure 20 shows the mean errors of central pressure forecasts at the before-recurvature stage.
Without special observations or TC bogus data, the intensity of Jangmi remained too weak considering
that it was one of the strongest typhoons of 2008 (the minimum central pressure was 905 hPa).
Using special observations or TC bogus data resulted in significant improvements for intensity
forecasts, especially the short-range type. It seems that the assimilation of these data made realistic
TC structures and helped TC intensification at the development stage.
Figure 21 is the same as Figure 20, but for the after-recurvature stage. No significant
difference was found between TEST and CNTL. Using TC bogus data, the intensity forecast showed
a TC that was slightly too strong after the 48-hour forecast stage. Since Jangmi was in a period of
transition to an extra-tropical cyclone, the forecast after 48-hours appears to have been worse. In this
case, using TC bogus data made a cyclone that was too strong after the extra-tropical cyclone
transition stage.
-42-
(c) Case study
Further experiments were performed for a number of typical cases. On the forecasts initiated
at 2500, the GSM forecast track with special observations showed much better agreement with the
observed track and predicted recurvature after landing on Taiwan, which was not the case in the
forecast without special observations (Figure 22).
Figure 22 Forecast tracks for Jangmi (initial time 2500). The red, green and blue lines show the forecast tracks of TEST, BOGUS and CNTL, respectively. The black lines show OBS values.
26
27
29
28
30 01 TEST
BOGUS
CNTL
CNTL
BOGUS
TEST
OBS
OBS
-10
0
10
20
30
40
50
60
0 12 24 36 48 60 72 84Forecast time (hours)
ME o
f C
entr
al P
ress
ure
(hP
a)
(Ⅰ)TEST(Ⅱ)BOGUS(Ⅲ)CNTL
Figure 20 Mean errors of TC central pressure forecast for Jangmi at the before-recurvature stage. The notations of the lines and marks are the same as those in Figure 17.
-20
-15
-10
-5
0
5
10
15
20
0 12 24 36 48 60 72 84Forecast time (hours)
ME o
f C
entr
al P
ress
ure
(hPa)
(Ⅰ)TEST(Ⅱ)BOGUS(Ⅲ)CNTL
Figure 21 As per Figure 20, but for the after-recurvature stage

-43-
In further experiments, the special observations conducted around this initial time were
assimilated separately according to their observation points. Figure 23 shows the forecast without
observations (CNTL) and with all observations in the center and the northern quadrant of Jangmi (NC
ALL). It was found that using dropwindsonde observations near the center and in the northern
quadrant improved the intensity forecast, while using them in the eastern and southern quadrants
improved the track forecast (not shown).
An impact study regarding the selection of observation elements was conducted. Each element
of dropwindsonde observation (horizontal wind, temperature and humidity) was assimilated separately.
In Figure 23, the green lines show the forecast with wind observations to the north and center of
Jangmi only (NC WIND). Comparing these forecasts shows that wind observations had the largest
impact on the forecast of Jangmi in this case, especially for the short-range track forecast. Other
observation elements also had an impact on the intensity forecast.
(d) Observations and data assimilation system of JMA
The characteristics of the special observations and their usage in the operational global data
assimilation system of JMA were investigated. Large differences in wind observations from the
first-guess field were found around the center of Jangmi, and these decreased considerably after the
analysis. As for the dropwindsonde and additional upper sounding observations, most of those on
mandatory levels were assimilated, and no horizontal data thinning was applied. Thus, in most cases,
assimilation of these observations contributed to improvement of the analysis field, but there may be
some problems with a lack of horizontal thinning for such spatially dense observations. In fact, as
mentioned earlier, the assimilation of dropwindsonde observations near the center caused significant
degradation of the track forecast in some cases.
Figure 23 Forecast tracks for Jangmi (initialized at 2500). The red, green and blue lines show the forecast tracks for NC ALL, NC WIND and CNTL, respectively. The black lines show OBS data.
26
27
28
29
30 01
OBS
OBS
CNTL
CNTL
NC ALL
NC ALL
NC WIND
NC WIND

-44-
5. Summary and conclusion
The OSEs performed revealed the positive impacts of special observations in the operational
JMA GSM mainly at the before-recurvature stage of Sinlaku and Jangmi. Using TC bogus data also
contributed to the improvement of intensity forecasts and short-range track forecasts at the
before-recurvature stage. However, the assimilation of TC bogus data sometimes led to a degradation
of track forecasts.
Further experiments for Jangmi on a number of typical cases were conducted, and the impact of
each observation was investigated. Through these experiments, it was found that wind observation
had a large impact on the analysis and forecast fields.
Although the OSEs for Sinlaku and Jangmi demonstrated the effectiveness of special
observations, some problems were found with the assimilation of dropwindsonde data, especially for
those near the TC centers. These problems need to be investigated in more detail and treated
carefully to achieve further TC forecast improvements.
In the verification of the sensitivity analysis system, special observations in high-sensitivity
areas were more effective in improving TC track forecasts, indicating the high possibility of their use
as interactive forecast system tools. However, as there was a case in which special observations
caused deterioration in TC track forecasting, these studies should be continuously implemented to
address the problem.
In the trial involving OSEs using MTSAT-2-RS-AMV, the possibility of improvement for TC
track forecasts was shown.
References
JMA, 2007: Outline of the Operational Numerical Weather Prediction at the Japan
Meteorological Agency, March 2007, 17.
Komori, T., R. Sakai, H. Yonehara, T. Kadowaki, K. Sato, T. Miyoshi and M. Yamaguchi, 2010:
Total Energy Singular Vector Guidance developed at JMA for T-PARC. RSMC Tokyo-Typhoon Center
Technical Review, 12, in press.
Nakagawa, M., 2009: Outline of the High Resolution Global Model at the Japan Meteorological
Agency. RSMC Tokyo-Typhoon Center Technical Review, 11, 1 – 13.
Yamashita, K., 2008: Upgraded Usage of Atmospheric Motion Vectors from All Geostationary
Satellites in the Operational Global And Meso-Scale 4D-Var Assimilation System at JMA,
Proceedings of 9th IWW, USA.