occupation andfive cancers: a case-control...
TRANSCRIPT

British Journal of Industrial Medicine 1987;44:769-776
Occupation and five cancers: a case-control studyusing death certificatesC MAGNANI, D COGGON, C OSMOND, E D ACHESON
From the MRC Environmental Epidemiology Unit, University ofSouthampton, Southampton General Hospital,Southampton S09 4XY, UK
ABSTRACT A case-control approach has been used to examine mortality from five cancers-
oesophagus, pancreas, cutaneous melanoma, kidney, and brain-among young and middle agedmen resident in three English counties. The areas studied were chosen because they include majorcentres of chemical manufacture. By combining data from 20 years it was possible to look at localindustries with greater statistical power than is possible using routine national statistics. Each case
was matched with up to four controls of similar age who died in the same year from other causes.
The occupations and industries recorded on death certificates were coded to standard classificationsand risk estimates derived for each job category. Where positive associations were found the recordsof the cases concerned were examined in greater detail to see whether the risk was limited to specificcombinations of occupation and industry. The most interesting findings to emerge were risks ofbrain cancer associated with the production of meat and fish products (relative risk (RR) = 9.7,95% confidence interval (CI) 2-6-36-8) and with mineral oil refining (RR = 2-9, CI 1 2-7-0), and a
cluster of four deaths from melanoma among refinery workers (RR = 16-0, CI 1 8-143 2). Ajob-exposure matrix was applied to the data but gave no strong indications of further diseaseassociations. Local analyses of occupational mortality such as this can usefully supplement nationalstatistics.
Occupational mortality statistics for England andWales have been published since 1855 and are a wellestablished method of monitoring industrial healthhazards. Their value is limited, however, by the poorspecificity of many of the occupational categoriesanalysed. A fitter in a chemical works is exposed toknown and potential hazards quite different from afitter in a textile factory but both are classed togetherin the conventional method of analysis used by theRegistrar General. Possibly other methods of exam-ining occupational mortality data might shed light onhitherto unrecognised problems.We have used the case-control approach to look at
five cancers-oesophagus, pancreas, cutaneous mela-noma, kidney, and brain-for which the a priori evi-dence of occupational aetiology was relativelylimited.1`3 Our aim was to generate clues to newoccupational risks of cancer and our method differedfrom that of most previous mortality analyses inseveral important respects. Firstly, we concentratedon deaths occurring in geographically localised areasselected because they are centres of certain "suspect"
Accepted 24 November 1986
industries, in particular chemical manufacture. Thismeant that we could look at associations betweencancer and employment in these industries withgreater statistical efficiency. Secondly, we includedinformation about industry as well as occupation inour analysis and, thirdly, we restricted our attentionto cancers occurring before the age of 55. The advan-tage of focusing on the younger age groups is thatoccupational data from death certificates are likely tobe more complete and certified causes of death moreaccurate. Also, it appears that for certain knownindustrial carcinogens-for example, bischloromethylether4-the risk of cancer is highest and thereforemost easily demonstrable in young people.
Material and methods
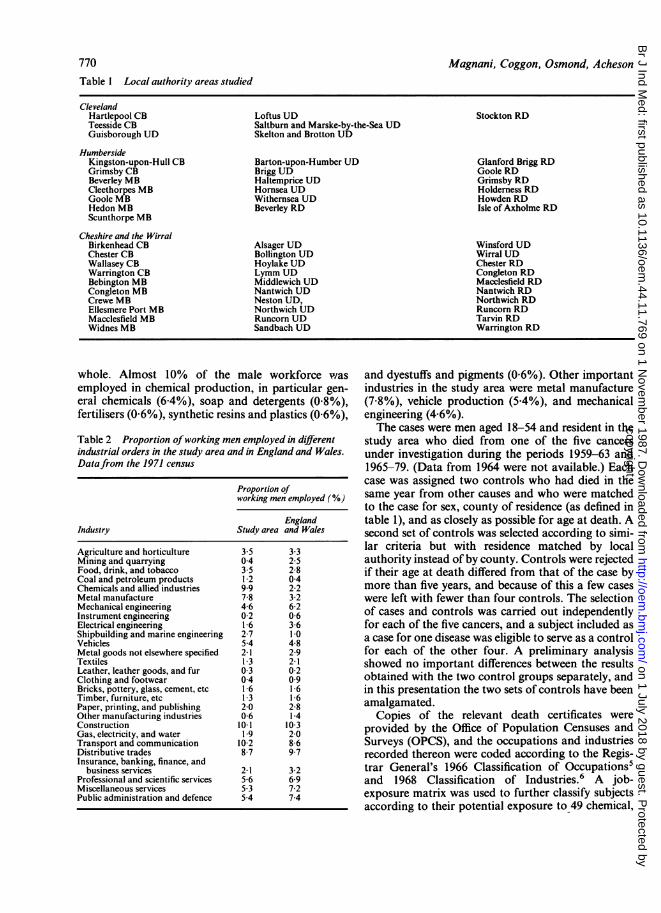
The area studied comprised the pre- 1974 localauthorities listed in table 1, and is roughly equivalentto the modern counties of Cleveland, Humberside,and Cheshire together with the Wirral district of Mer-seyside. Table 2 shows the distribution of industry inthis area at the time of the 1971 census and contraststhe pattern with that for England and Wales as a
769
copyright. on 1 July 2018 by guest. P
rotected byhttp://oem
.bmj.com
/B
r J Ind Med: first published as 10.1136/oem
.44.11.769 on 1 Novem
ber 1987. Dow
nloaded from
770Table I Local authority areas studied
Magnani, Coggon, Osmond, Acheson
ClevelandHartlepool CBTeesside CBGuisborough UD
HumbersideKingston-upon-Hull CBGrimsby CBBeverley MBCleethorpes MBGoole MBHedon MBScunthorpe MB
Cheshire and the WirralBirkenhead CBChester CBWallasey CBWarrington CBBebington MBCongleton MBCrewe MBEllesmere Port MBMacclesfield MBWidnes MB
Loftus UDSaltburn and Marske-by-the-Sea UDSkelton and Brotton UD
Barton-upon-Humber UDBrigg UDHaltemprice UDHornsea UDWithernsea UDBeverley RD
Alsager UDBollington UDHoylake UDLymm UDMiddlewich UDNantwich UDNeston UD,Northwich UDRuncorn UDSandbach UD
Stockton RD
Glanford Brigg RDGoole RDGrimsby RDHolderness RDHowden RDIsle of Axholme RD
Winsford UDWirral UDChester RDCongleton RDMacclesfield RDNantwich RDNorthwich RDRuncorn RDTarvin RDWarrington RD
whole. Almost 10% of the male workforce wasemployed in chemical production, in particular gen-eral chemicals (6-4%), soap and detergents (0 8%),fertilisers (0-6%), synthetic resins and plastics (0-6%),
Table 2 Proportion ofworking men employed in differentindustrial orders in the study area and in England and Wales.Datafrom the 1971 census
Proportion ofworking men employed (%)
EnglandIndustry Study area and Wales
Agriculture and horticulture 3 5 3-3Mining and quarrying 0 4 2 5Food, drink, and tobacco 3 5 2-8Coal and petroleum products 1 2 04Chemicals and allied industries 9 9 2-2Metal manufacture 7-8 3 2Mechanical engineering 46 6-2Instrument engineering 0-2 0-6Electrical engineering 1-6 3-6Shipbuilding and marine engineering 2-7 1.0Vehicles 5-4 4-8Metal goods not elsewhere specified 2-1 2-9Textiles 13 21Leather, leather goods, and fur 0 3 0-2Clothing and footwear 04 09Bricks, pottery, glass, cement, etc 1 6 1 6Timber, furniture, etc 1 3 1 6Paper, printing, and publishing 2 0 2-8Other manufacturing industries 0 6 1-4Construction 10-1 10-3Gas, electricity, and water 1.9 2 0Transport and communication 10-2 8 6Distributive trades 8-7 9 7Insurance, banking, finance, and
business services 2-1 3 2Professional and scientific services 5-6 6-9Miscellaneous services 5-3 7-2Public administration and defence 5 4 7-4
and dyestuffs and pigments (0.6%). Other importantindustries in the study area were metal manufacture(7.8%), vehicle production (5.4%), and mechanicalengineering (4-6%).The cases were men aged 18-54 and resident in the
study area who died from one of the five cancersunder investigation during the periods 1959-63 and1965-79. (Data from 1964 were not available.) Eachcase was assigned two controls who had died in thesame year from other causes and who were matchedto the case for sex, county of residence (as defined intable 1), and as closely as possible for age at death. Asecond set of controls was selected according to simi-lar criteria but with residence matched by localauthority instead of by county. Controls were rejectedif their age at death differed from that of the case bymore than five years, and because of this a few caseswere left with fewer than four controls. The selectionof cases and controls was carried out independentlyfor each of the five cancers, and a subject included asa case for one disease was eligible to serve as a controlfor each of the other four. A preliminary analysisshowed no important differences between the resultsobtained with the two control groups separately, andin this presentation the two sets of controls have beenamalgamated.
Copies of the relevant death certificates wereprovided by the Office of Population Censuses andSurveys (OPCS), and the occupations and industriesrecorded thereon were coded according to the Regis-trar General's 1966 Classification of Occupations'and 1968 Classification of Industries.6 A job-exposure matrix was used to further classify subjectsaccording to their potential exposure to 49 chemical,
copyright. on 1 July 2018 by guest. P
rotected byhttp://oem
.bmj.com
/B
r J Ind Med: first published as 10.1136/oem
.44.11.769 on 1 Novem
ber 1987. Dow
nloaded from

Occupation andfive cancers: a case-control study using death certificatesTable 3 Numbers ofcases and controls and distribution ofcauses ofdeath among the controls
Study cancer
Oesophagus Pancreas Melanoma Kidney BrainNo % No % No % No % No %
Cases 244 - 343 - 99 - 147 - 432Controls: 935 - 1315 - 361 - 556 - 1603
Cancers (other) 268 28-7 374 28-4 76 21-0 178 32-0 382 23-8Neurological disease (includingcerebrovascular) 46 4-9 54 4-1 15 4-2 22 4-0 95 59Cardiovascular disease 385 41-2 525 39-9 133 36-8 215 38-7 547 34-1Respiratory disease 78 8-3 103 7-8 29 8-0 38 6-8 111 6-9Injury and poisoning 87 9-3 128 9-7 73 20 2 71 12-7 319 19-9Other causes 71 7-6 131 10-0 35 9-7 32 5-8 149 9-3
physical, and biological agents.7 Associations with each of the five cancers studied and summarises thecancer were examined and maximum likelihood esti- causes of death in the control groups.mates of relative risk were derived with test based In our analysis of cancer by industry and95% confidence intervals according to the method for occupation we looked first at associations with thematched data with a variable number of controls.8 broad industrial and occupational orders defined by
the Registrar General (tables 4 and 5). As indicated inthe tables, industry and, to a lesser extent, occupation
Results were not always adequately recorded on deathcertificates. For all five cancers information was more
Table 3 shows the number of cases and controls for complete for cases than controls.
able 4 Associations between cancer and industrial orders: relative risks (RR) and 95% confidence intervals (CI)
Cancer site/type
Oesophagus Pancreas Melanoma Kidney Brain
RR Cl RR Cl RR Cl RR CI RR CI
griculture, forestry, fishing 1-1 (0 4-2 8) 0-8 (0-4-1-8) 0-7 (0-2-2-5) 1-5 (0-6-3-8) 1-0 (0-5-1-8)lining and quarrying (Oca v 9co) 0-5 (01-45) - 0-9 (0-1-84) 1 3 (0 3-49)ood, drink, and tobacco 0-4 (0-1-1-3) 1-5 (08-2-7) 0-4 (01-3-4) 0-6 (02-1-9) 2-6 (1 5-4 5)loal and petroleum products 1-8 (0-2-20-1) 1-8 (0-7-4-7) 8-0 (1-5-43-7) 1-3 (0-3-5-1) 3-5 (1 5-8-1)'hemicals and allied industries 1-1 (0-6-1-9) 1-4 (0-9-2-3) 1 5 (0-6-3-8) 1-3 (0-6-2-6) 1-1 (0-7-1-7)fetal manufacture 0-9 (0-5-1-7) 0-8 (0-5-1-4) 1-2 (0-4-3-0) 1-0 (0-5-1-9) 1 2 (0-8-1-8)fechanical engineering 1-0 (0-5-2-3) 0-9 (0-4-1-9) 0-3 (0-0-2-5) 1-9 (0-6-5-5) 1-4 (0-8-2-6)istrument engineering - 2-0 (0-2-22-1) (Oca v Ico) (Oca v Ico) (Oca v Ico)lectrical engineering (Oca v Sco) 0-8 (0-2-3-9) - 15-2 (1-7-136-0) 0-9 (0-2-4-3)hipbuilding and marineengineering 2-3 (1-0-5-1) 0-9 (0-4-1-9) 2-1 (0-5-8-9) 0-9 (0-2-4-2) 0-3 (0-1-1-0)
'ehicles 1-4 (0-6-3-0) 0-9 (0-4-1-8) 1-0 (0-3-3-7) 0-9 (0-2-3-1) 1-3 (0-7-2-5)letal goods nec 2-5 (0-9-7-5) 1-4 (0-5-4-5) 2-0 (0-2-22-1) 0-6 (0-1-5-1) 0-5 (0-1-1-6)extiles 2-7 (0-4-16-0) 1-6 (0-3-8-2) (Ica v Oco) (Oca v 2co) (Oca v 9co)eather, leather goods, and fur 1-6 (0- 1-18-2) 0-9 (0-1-8-0) (Oca v 3co) (Oca v 2co) (Oca v Sco)'lothing and footwear - 2-0 (0-2-22-1)[ricks, pottery, glass, cement, etc 0-4 (0-0-3-0) 0-4 (0-0-3-1) 4-0 (0-3-64-0) (Oca v 2co) 1-0 (0-3-3-4)*imber, furniture, etc (2ca v Oco) (Oca v Sco) - (Oca v 2co) 0-7 (0-1-5-5)'aper, printing, and publishing 3-9 (1-4-10-3) 2-2 (1-0-5-1) 2-5 (0-4-15-1) 1-3 (0-2-6-9) 1-8 (0-3-9-9))ther manufacturing industries 1-3 (0-1-12-8) 1-9 (0-3-10-4) 1-2 (0- 1-11-9) 4-0 (0-3-64-0) (Oca v 4co)onstruction 1-0 (0-6-1-6) 1-2 (0-7-1-8) 1-1 (0-5-2-3) 1-1 (0-6-2-2) 1-2 (0-8-1-8)Jas, electricity, and water 2-1 (0-9-4-8) 0-5 (0-2-1-8) 8-0 (0-7-88-2) 0-7 (0-2-3-2) 0-8 (0-3-2-0)ransport and communication 1-1 (0-7-1-7) 0-6 (0-4-1-0) 1-6 (0-8-3-1) 1-2 (0-7-2-2) 1-0 (0-7-1-5))istributive trades 1-0 (0-5-1-8) 1-3 (0-8-2-0) 0-8 (0-3-2-2) 0-9 (0-4-1-8) 1-1 (0-7-1-8)nsurance, banking, finance, andbusiness services 2-0 (0-6-6-6) 0-8 (0-3-2-3) 1-7 (0-4-6-8) 1-3 (0-3-6-4) 1-2 (0-5-2-7)
'rofessional and scientific services 0-9 (0-4-2-0) 0-9 (0-5-1-8) 0-5 (0-1-1-9) 1-2 (0-4-3-5) 1-1 (0-6-1-9)Aiscellaneous services 0-6 (0-3-1-4) 0-9 (0-5-1-7) 1-0 (0-3-3-9) 1-2 (0-5-3-0) 0-6 (0-3-1-2)'ublic administration and defence 0-7 (0-4-1-4) 1-6 (0-9-2-7) 0-5 (0-1-1-6) 0-6 (0-2-1-6) 1-2 (0-7-1-8)Jnknown 0-7 (0-5-1-1) 0-9 (0-7-1-2) 0-6 (0-3-1-1) 0-8 (0-5-1-2) 0-7 (0-5-0-9)
Then the relative risk was zero or infinite the numbers of cases and controls from the industry are given.-Implies no cases or controls worked in the industry. The figures for "unknown industry" are based on 52 cases and 243 controls for oesophageal cancer, 80ind 336 for pancreatic cancer, 20 and 98 for melanoma, 31 and 146 for renal cancer, and 96 and 461 for brain tumours.
771
copyright. on 1 July 2018 by guest. P
rotected byhttp://oem
.bmj.com
/B
r J Ind Med: first published as 10.1136/oem
.44.11.769 on 1 Novem
ber 1987. Dow
nloaded from

Table 5 Associations between cancers and occupational orders: relative risks (RR) and 95% confidence intervals (CI)
Cancer site/type
Oesophagus Pancreas Melanoma Kidney Brain
RR Cl RR CI RR CI RR CI RR Cl
Farmers, foresters, fishermen 1-5 (0-7-3-2) 0-6 (0-3-1.3) 10 (03-30) 1-3 (05-3-1) 10 (0-6-1-8)Miners and quarrymen (Oca v 6co) (Oca v 4co) (Oca v Ico) 4-0 (0-3-64-0) 0-3 (0-0-2-6)Gas, coke, and chemical makers 1 7 (0 9-3 2) 1-4 (0-8-2 5) 2-2 (0-8-6-1) 0 9 (0 3-2 5) 1.0 (0-61-7)Glass and ceramics makers (Oca v 2co) 1 6 (0-1-18-2) (Oca v Ico) (Oca v Ico) 1-2 (0.1-11.9)Furnace, forge, foundry, rolling
mill workers 0 6 (0-1-2-7) 0-8 (0-3-2-5) 3-9 (1-0-15-5) 1-5 (0-5-4-8) 1-2 (0-5-2-6)Electrical and electronic workers 1-4 (0-6-3-4) 0-6 (02-1-6) 1-2 (0 2-5 9) 1 7 (0 7-46) 1-3 (0-7-2-5)Engineering and allied trades
workers nec 1.0 (07-1 5) 1 0 (0-7-1-4) 09 (0 5-1 7) 09 (06-1 6) 1 1 (0 8-1-4)Woodworkers 0-3 (0 0-2 5) 1-8 (0-8-3-8) 1-5 (0 4-6 3) 0 3 (0 0-1 9) 1-3 (0 7-2 6)Leatherworkers 1.1 (01-11 1) (Ocav4co) - (Ocav2co) (Ocav5co)Textile workers (Oca v 4co) 1.0 (0 1-8 9) (Ica v Oco) (Oca v 4co) 0 5 (0 1-3 9)Clothing workers (Oca v 4co) (Oca v Ico) - 2-7 (0 4-16 0)Food, drink, and tobacco workers 0-5 (0-1-1 6) 2-0 (1 0-4 0) 0 4 (0-1-3-5) 1.5 (0 5-4-7) 3 9 (1 9-8 1)Paper and printing workers 1 7 (0-5-5 6) 24 (08-7 5) 1.1 (01-1 11) 07 (01-6 5) 1-2 (02-6 3)Makers of other products 1-5 (03-7-6) 0-8 (02-39) 3-5 (0.2-55-8) 40 (03-640) 0-6 (01-46)Construction workers 1 0 (0-5-1 9) 1 2 (0-7-2-1) 1-4 (0-5-4-0) 1-0 (0-4-2.4) 2-0 (1-2-3 3)Painters and decorators 2-0 (0 8-4 9) 0-8 (0-3-2 1) 0-8 (0 1-6 5) 0-7 (0-1-3-4) 1-4 (0-7-2 8)Drivers of stationary engines,
cranes, etc 1 6 (08-3-2) 10 (05-1-9) 0-6 (01-28) 04 (01-1 7) 1 1 (06-20)Labourers nec 0 9 (0-5-1 4) 1 0 (0-7-1 4) 0-2 (0-1-0-7) 1 2 (0-7-2 1) 0-6 (0 4-0 9)Transport and communication
workers 1 1 (07-1 7) 0-8 (0 5-12) 1-5 (0 8-3 0) 1.1 (06-18) 0-8 (06-12)Warehousemen, storekeepers,
packers, bottlers 1 6 (07-3-6) 1.1 (06-2 1) 1-3 (02-69) 0-8 (02-27) 06 (03-1-3)Clerical workers 1.0 (06-1-7) 0-8 (0 5-1 4) 14 (06-33) 1 3 (06-27) 1 1 (07-1-8)Sales workers 09 (05-1.9) 1.0 (06-1-7) 05 (02-1 3) 0-7 (0-3-1-6) 07 (0-4-1-2)Service, sport, and recreation
workers 0-7 (0-3-1-4) 0-9 (0-5-1-5) 2-8 (0-9-8-3) 0-8 (0-3-1-9) 0-5 (0-3-0-9)Administrators and managers 0-4 (0 1-1 0) 1 0 (06-1-9) 1 8 (06-4 8) 1-0 (0-4-2-3) 1 6 (0 9-2 6)Professional, technical workers,
artists 08 (0-4-1-5) 1 2 (08-1-9) 0-7 (03-18) 1-7 (09-3-5) 1 5 (1 0-2-3)Armed forces (British and foreign) 2-1 (0-67-2) (Oca v4co) 1 8 (0.2-20 1) 1.1 (0-1-10-3) 1-2 (0-3-44)Inadequately described
occupations 0-9 (0-4-2-3) 0-6 (0.2-2.1) 0 3 (0.0-2.0) (Oca v 12co) 0-5 (0.2-1.0)
When the relative risk was zero or infinite the numbers of cases and controls from the occupation are given.-Implies no cases or controls worked in the occupation. The figures for "inadequately described occupations" are based on six cases and 23 controls foroesophageal cancer, three and 18 for pancreatic cancer, one and 13 for melanoma, 0 and 12 for renal cancer, and seven and 55 for brain tumours.
We then examined the more specific categoriesknown as industrial and occupational units andwhere associations of interest emerged we looked tosee whether the risk applied to particular combina-tions of occupation and industry. The salient featuresof this analysis are presented below for each cancer inturn.
CANCER OF THE OESOPHAGUSOesophageal cancer occurred more frequently thanexpected in the industrial order "paper, printing, andpublishing" (RR = 3-9, CI 1410-3). More detailedexamination of the data, however, indicated that theeight cases were scattered throughout the industries inthe group; manufacture of paper and board (2), prod-uction of packaging (2), newspaper printing (2), andother printing (2).Ten cases worked in shipbuilding (RR = 2-3, CI
1 0-5* 1) but they were not concentrated in any oneoccupation.
Seven cases were employed in the electricity indus-try (RR = 3-4, CI 1 2-9-3) but again they had held avariety of different jobs.An association with sea transport (RR = 2-5, CI
1-.06-4) was due to a cluster of cases among bothseamen (RR = 3-2, CI 0 9-11.9) and their officers(RR = 2-6, CI 0.7-9.2).There were no statistically significant associations
with occupational orders but nine cases worked ascrane operators or slingers (RR = 5-8, CI 2-1-16-3),including four in the iron and steel industry.
CANCER OF THE PANCREASMortality from pancreatic cancer was high in theindustrial order paper, printing, and publishing (RR= 2-2, CI 1 *0-5 1) due largely to a cluster of five casesemployed in the production of paper and board (RR= 4-8, CI 1-3-18-1). Their occupations were trafficcontroller, fitter (two cases), electrical planningengineer, and machine tender.
772 Magnani, Coggon, Osmond, Acheson
copyright. on 1 July 2018 by guest. P
rotected byhttp://oem
.bmj.com
/B
r J Ind Med: first published as 10.1136/oem
.44.11.769 on 1 Novem
ber 1987. Dow
nloaded from

Occupation andfive cancers: a case-control study using death certificatesAn association was also found with the industrial
unit "dealing in coal, oil, etc" (RR = 7.3, CI1.3-39.9) but closer scrutiny of the cases'occupational records suggested that a commonunderlying cause was unlikely.Among the occupational orders, "food, drink, and
tobacco workers" showed the clearest excess of pan-creatic cancer (RR = 2-0, CI 1 0-4 0). Five cases (vseven controls) were butchers and five cases (v sevencontrols) had worked in fish shops or as fish filleters.A high relative risk was found for "packers, label-
lers, and related workers" (RR = 5 1, CI 1.1-22.9)but the industrial activities of the cases had little incommon.
CUTANEOUS MELANOMAAn association with the industrial order "coal andpetroleum products" (RR = 8-0, CI 1-5-43-7) arosefrom a small cluster of deaths among men employedin mineral oil refineries. The occupations of the fourcases were process worker/blender, engineer, securityofficer, and clerk of works.Two other industries showed associations with
melanoma-road haulage contracting (RR = 15-2,CI 1-7-136-0) and port and inland water transport(RR = 4-1, CI 1l1-15 5) but the occupations of thecases did not point to an underlying cause.An increased risk of melanoma in "furnace, forge,
foundry, and rolling mill workers" (RR = 3.9, CI1-0-15-5) could not be attributed to an excess in anyone occupation within the order.
CANCER OF THE KIDNEYFour cases worked in "electrical engineering" (RR =
15 2, CI 1-7-136-0) but came from various industrieswithin the group.
No occupational orders were significantly associ-ated with renal cancer. There was an excess of thetumour among electricians (RR = 2-9, CI 1-0 -83)but not among other electrical and electronic work-ers. The six electricians with cancer of the kidneycame from various industries but none was employedin electrical engineering.
Six deaths from renal cancer occurred in teachers(RR = 5-2, CI 1l5-18-6).
CANCER OF THE BRAINTwo industrial orders showed a significant excess ofbrain cancer. The increased risk in coal and petro-leum products (RR = 3-5, CI 1-5-8 1) applied to both"coke ovens and manufactured fuel" (two cases v no
controls) and mineral oil refining (RR = 2-9, CI1 2-7-0). Four cases (v four controls) worked as pro-
cess operators in refineries. In addition, three cases
were employed in wholesale petroleum distribution(RR = 10*3, CI 10-1008).
The association with food, drink, and tobaccoarose from an excess of brain tumours in "baconcuring, meat, and fish products" (RR = 9 7, CI2-6-36-8). In particular, seven cases worked in the fishprocessing and frozen food industry-two filleters,two shift supervisors, one hygiene worker, one whole-sale fish merchant, and an accounts clerk.
This partially explains the high rate of brain cancerin the occupational order food, drink, and tobaccoworkers (RR = 3 9, CI 1 9-8 1), although there wasalso an excess of brain tumours among bakers (threecases v no controls) and butchers (RR = 19, CI0-3-104).
"Construction workers" had a relative risk of 2-0(CI 1 2-3-3) for brain cancer, the association beingstrongest for bricklayers (RR = 3-8, CI 1-6-9-0) andbricklayers' labourers (RR = 3-7, CI 1-3-10-7).
Other isolated findings were an excess of braintumours in "managers nec" (RR = 3-0, CI 1 46-2)and "technologists nec" (RR = 3-6, CI 1[3-10-3). Inneither instance did the industrial activity of the casessuggest an occupational cause for the association.The results of the analysis using the job-exposure
matrix are summarised in table 6. Where positiveassociations emerged, risks were examined in relationto three grades of potential exposure. Only one asso-ciation was both statistically significant and exhibiteda dose response relation. The risk of melanoma injobs entailing possible exposure to lead and lead com-pounds (as compared with unexposed jobs) was 1-8(CI 1-0 -34). Of the 16 cases classed by the matrix ashaving possible contact with lead, seven were in lowexposure jobs (RR = 1-3), eight in the moderateexposure category (RR = 2-2), and one, a com-positor, was deemed to have potentially highexposure (RR = 4-0).
Discussion
This survey is subject to certain limitations that arecommon to all analyses of occupational mortalitybased on death certificates. One weakness is the inac-curacy of certified causes of death,9 although thefrequency of such errors should have been reduced byour concentration on mortality at young ages whenclinical investigation is likely to be more thorough.A greater shortcoming is the inaccuracy and
incompleteness of occupational data obtained fromdeath certificates. In England and Wales only themost recent fulltime job is registered and even thatmay not be adequately described. By adopting thecase-control approach we avoided the biases thatoccur when different sources of occupational infor-mation (death certificates and census) are used toderive the numerator and denominator of death
773
copyright. on 1 July 2018 by guest. P
rotected byhttp://oem
.bmj.com
/B
r J Ind Med: first published as 10.1136/oem
.44.11.769 on 1 Novem
ber 1987. Dow
nloaded from
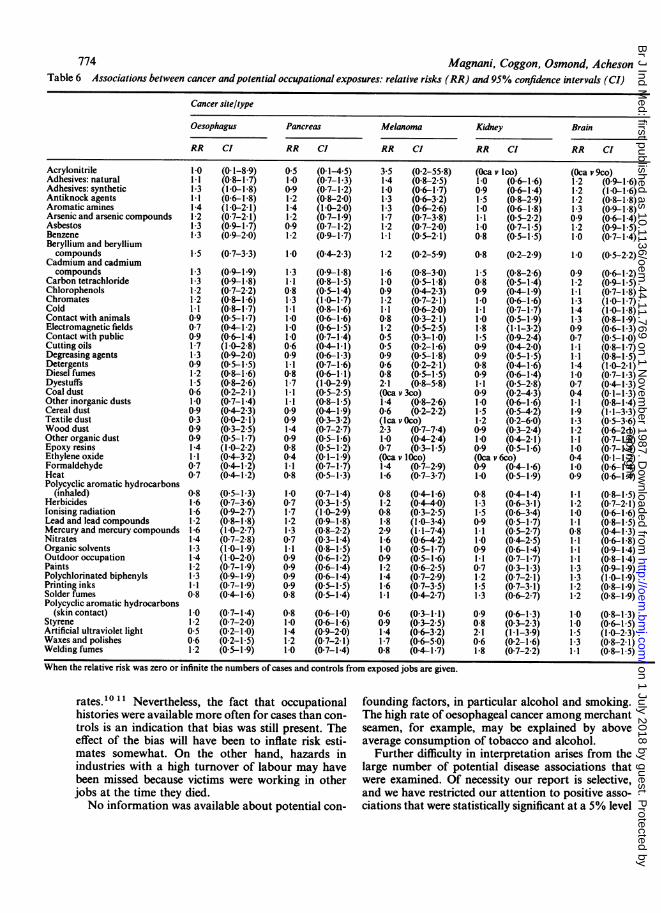
774 Magnani, Coggon, Osmond, AchesonTable 6 Associations between cancer andpotential occupational exposures: relative risks (RR) and 95% confidence intervals (CI)
Cancer site/type
Oesophagus Pancreas Melanoma Kidney Brain
RR CI RR CI RR Cl RR CI RR CI
Acrylonitrile 1 0Adhesives: natural 1-1Adhesives: synthetic 1-3Antiknock agents 1I1Aromatic amines 1-4Arsenic and arsenic compounds 1 2Asbestos 1-3Benzene 1-3Beryllium and berylliumcompounds 1-5
Cadmium and cadmiumcompounds 1-3
Carbon tetrachloride 1-3Chlorophenols 1 2Chromates 1-2Cold 1-1Contact with animals 0 9Electromagnetic fields 0 7Contact with public 0 9Cutting oils 1-7Degreasing agents 1-3Detergents 0 9Diesel fumes 1 2Dyestuffs 1-5Coal dust 0-6Other inorganic dusts 1.0Cereal dust 0-9Textile dust 0 3Wood dust 0 9Other organic dust 0 9Epoxy resins 1-4Ethylene oxide 1-1Formaldehyde 0 7Heat 0-7Polycyclic aromatic hydrocarbons
(inhaled) 0-8Herbicides 1-6lonising radiation 1-6Lead and lead compounds 1-2Mercury and mercury compounds 1-6Nitrates 1-4Organic solvents 1-3Outdoor occupation 1-4Paints 1-2Polychlorinated biphenyls 1-3Printing inks 1-1Solder fumes 0-8Polycyclic aromatic hydrocarbons
(skin contact) 1.0Styrene 1-2Artificial ultraviolet light 0-5Waxes and polishes 0-6Welding fumes 1-2
(0-1-8.9) 0-5 (0-1-4-5) 3-5 (0.2-55-8) (Oca v lco) (Oca v 9co)(0-8-1-7) 1-0 (07-1-3) 1-4 (08-2.5) 1-0 (0-6-1-6) 1-2 (0-9-1-6)(1-0-1-8) 0-9 (0-7-1-2) 1-0 (0.6-1.7) 0-9 (0-6-1.4) 1-2 (1-0-1-6)(0-6-1-8) 1-2 (0-8-2-0) 1.3 (0 6-3.2) 1-5 (0.8-2.9) 1-2 (0-8-1-8)(1-0-2-1) 1-4 (1-0-2-0) 1-3 (0-6-2-6) 1-0 (0-6-1-8) 1-3 (0-9-1-8)(0-7-2-1) 1-2 (0.7-1.9) 1-7 (0 7-3-8) 1.1 (0.5-2.2) 0 9 (0-6-1-4)(0.9-1.7) 0-9 (0-7-1-2) 1-2 (0.7-2.0) 1-0 (0-7-1.5) 1-2 (0-9-1.5)(09-20) 1-2 (0-9-1-7) 1-1 (0-5-2-1) 0-8 (05-1-5) 1-0 (0-7-1-4)
(0-7-3-3)
(0-9-1-9)(0-9-1-8)(0-7-2-2)(0-8-1-6)(0-8-1-7)(0 5-1-7)(0-4-1-2)(06-1-4)(10-2 8)(0-9-2-0)(0-5-1-5)(0-8-1-6)(0-8-26)(0.2-2-1)(0-7-1-4)(0 4-2-3)(0-0-2-1)(0-3-2 5)(0-5-1-7)(1-0-2-2)(0 4-3-2)(04-1*2)(0-4-1-2)
1-0 (0-4-2-3) 1-2 (0-2-5-9) 0-8 (0.2-2 9) 1.0 (0 5-2-2)1-3 (0-9-1-8)1 1 (08-15)0-8 (0-5-1-4)1-3 (1-01-7)1.1 (0-8-1-6)1-0 (0-6-16)10 (0-6-1-5)10 (0-7-1-4)0-6 (0 4-1-1)0 9 (0-6-1-3)1-1 (0-7-1-6)0-8 (0 6-1 1)1-7 (1.0-2-9)1}1 (0 5-2 5)1-1 (0-8-1-5)09 (04-19)09 (03-32)1-4 (0-7-2-7)0 9 (0-5-1-6)0-8 (0-5-1-2)0-4 (0-1-1.9)1-1 (0-7-1-7)0-8 (0-5-1-3)
1-6 (08-3.0)1-0 (0-5-1-8)0-9 (0.4-2.3)1-2 (0.7-2.1)1*1 (06-20)0-8 (0.3-21)1-2 (0.5-2-5)0-5 (0-3-1-0)0-5 (0-2-1-6)0-9 (0-5-1-8)0-6 (0-2-2-1)0-8 (0.5-1.5)2-1 (0-8-5-8)(Oca v 3co)1-4 (0.8-2.6)0-6 (0-2-2-2)(Ica v 0co)2-3 (0-7-7-4)1-0 (0-4-2.4)0-7 (0.3-1-5)(Oca v 10co)1-4 (0.7-2.9)1-6 (0-7-3-7)
1-5 (0.8-2-6)0-8 (0-5-1-4)0-9 (0.4-1-9)1-0 (0.6-1.6)1-1 (0-7-1-7)1-0 (0.5-1.9)1-8 (11-3-2)1-5 (0-9-2.4)0-9 (0-4-2.0)0 9 (0-5-1-5)0-8 (0-4-1-6)0-9 (0 6-1.4)1-1 (0 5-2.8)09 (0.2-4-3)1-0 (0 6-1.6)1-5 (0.5-4.2)1-2 (0.2-6.0)0 9 (0-3-2-4)10 (0-4-2-1)0.9 (0-5-1-6)(Oca v 6co)0-9 (0-4-1-6)1-0 (0 5-1 9)
(0.5-1 3) 1-0 (0-7-1-4) 0-8 (0-4-1-6) 0-8 (0-4-1-4)(0.7-3.6) 0-7 (0 3-1.5) 1-2 (0-4-40) 1-3 (0-6-3-1)(0-9-2 7) 1-7 (1-0-2-9) 0-8 (0 3-2-5) 1.5 (0 6-3-4)(0-8-1.8) 1-2 (0-9-1-8) 1-8 (1-0-3-4) 0 9 (0-5-1-7)(10-2-7) 1*3 (08-2-2) 2-9 (11-7.4) 1*1 (05-2-7)(0.7-2.8) 0 7 (0-3-1-4) 1-6 (0.6-4.2) 1.0 (0 4-2.5)(1.0-1.9) 1 1 (0.8-1-5) 1-0 (0.5-1-7) 0-9 (06-1-4)(1-0-2-0) 0-9 (0-6-1-2) 0-9 (0-5-1-6) 1-1 (0-7-1-7)(0 7-1-9) 0-9 (0-6-1-4) 1-2 (0.6-2.5) 0-7 (0-3-1-3)(0-9-1-9) 0-9 (0-6-1-4) 1-4 (0.7-2.9) 1-2 (0-7-2-1)(0.7-1-9) 0-9 (0-5-1.5) 1-6 (0-7-3-5) 1-5 (0-7-3-1)(0-4-1-6) 0-8 (0-5-1-4) 1-1 (0.4-2-7) 1-3 (0-6-2.7)
(0-7-1-4) 0-8 (0-6-1-0) 0-6 (0-3-1.1) 0-9 (0-6-1-3)(0-7-2.0) 1-0 (0-6-1-6) 0-9 (0.3-2-5) 0-8 (0.3-2-3)(0-2-1-0) 1-4 (0-9-2-0) 1-4 (0.6-3.2) 2-1 (1.1-3.9)(0.2-1.5) 1-2 (0-7-2-1) 1-7 (0-6-5-0) 0-6 (0-2-1.6)(0-5-1.9) 1-0 (0.7-1.4) 0-8 (0-4-1.7) 1-8 (0-7-2-2)
0-9 (0.6-1-2)1-2 (0-9-1.5)11 (0 7-1-8)1-3 (1-0-1-7)1-4 (1-0-1-8)1 3 (0-8-1-9)09 (06-1-3)0-7 (0.5-1-0)1.1 (08-1.7)1-1 (0-8-1-5)1-4 (1-0-2-1)1-0 (0.7-1-3)0-7 (0.4-1-3)04 (0.1-1.3)1-1 (0-8-1-4)1 9 (1 1-3 3)1-3 (05-3.6)1-2 (0-6-2-1)1-1 (0-7-1-8)1-0 (0-7-1-4)0 4 (0-1-1-2)1-0 (0-6-1-4)0 9 (0-6-1-4)
11 (0-8-1*5)1-2 (0.7-2.1)1-0 (0-6-1-6)1-1 (0.8-1.5)0-8 (0-4-1-3)1.1 (0-6-1-8)1-1 (0-9-1-4)1-1 (0-8-1-4)1-3 (0-9-1-9)1-3 (1.0-1.9)1-2 (08-1 9)1-2 (0.8-1.9)1-0 (0-8-1-3)1-0 (0.6-1-5)1-5 (1-0-2-3)1-3 (0.8-2.1)1-1 (08-1-5)
When the relative risk was zero or infinite the numbers of cases and controls from exposed jobs are given.
rates.'0II Nevertheless, the fact that occupational founding factors, in particular alcohol and smoking.histories were available more often for cases than con- The high rate of oesophageal cancer among merchanttrols is an indication that bias was still present. The seamen, for example, may be explained by aboveeffect of the bias will have been to inflate risk esti- average consumption of tobacco and alcohol.mates somewhat. On the other hand, hazards in Further difficulty in interpretation arises from theindustries with a high turnover of labour may have large number of potential disease associations thatbeen missed because victims were working in other were examined. Of necessity our report is selective,jobs at the time they died. and we have restricted our attention to positive asso-No information was available about potential con- ciations that were statistically significant at a 5% level
copyright. on 1 July 2018 by guest. P
rotected byhttp://oem
.bmj.com
/B
r J Ind Med: first published as 10.1136/oem
.44.11.769 on 1 Novem
ber 1987. Dow
nloaded from

Occupation andfive cancers: a case-control study using death certificatesand based on more than three cases. Inevitably, thesewill include many chance associations, and evaluationrequires consideration of data from other studies andthe biological plausibility of suggested hazards. Thecapacity to examine information about occupation inconjunction with industry was therefore an advan-tage.By concentrating on a limited geographical area
and combining data from 20 years we could look atlocal industries in a way not possible using nationalstatistics. Men employed in the fish processing andfrozen food industries (fish is one of the major frozenfood products in the study area) would contribute toseveral occupational units in the Registrar General'sanalyses of occupational mortality, and the effects ofany hazard would be diluted by the inclusion of work-ers from other food industries in the same categories.The risks of pancreatic and brain cancer found in thisgroup are therefore of particular interest and despitethe lack of an obvious carcinogenic mechanism war-rant further investigation.
Mineral oil refining is another local industry andwas found in association with both melanoma andbrain cancer. Unlike the processing of fish and frozenfood, the petrochemical industry has been extensivelyinvestigated in the past. A risk of melanoma inrefinery workers has been reported in one previousstudy'2 and an increased incidence of brain cancer infour investigations. 13 -16 In a recent review Aldersonpooled data from ten cohort studies of the industryand derived a relative risk of 1-16 for cancer of thebrain with a 95% confidence interval 1-0-1-3.'We chose our study area because it included
important centres of chemical manufacture and manyof the known occupational carcinogens are industrialchemicals. As things turned out, however, the surveydid not point to any risks in the chemical industry.This may be because there are no major hazards, or itis possible that even within the limited populationstudied the effects of a carcinogen have been maskedby a large majority of chemical workers not exposedto the compound.
Several of the associations demonstrated concernoccupations with a more uniform geographical distri-bution, and for looking at these jobs our methodoffers no advantage over larger national analyses ofoccupational mortality. Thus the increased incidenceof renal cancer in teachers and of brain cancer inbricklayers and their labourers must be weighedagainst the absence of any clear risk in the 1971 OPCSDecennial Supplement on Occupational Mortality."On the other hand, the excess of pancreatic cancer inbutchers is supported by an SMR of 156. A cohortstudy of butchers and slaughtermen is currently beingcarried out by the Medical Research Council andshould provide firmer evidence for or against ahazard.
In addition to the positive associations already dis-cussed several occupations and industries were foundto have significantly low risks of cancer.We have notdwelt on these, however, as it seems unlikely that theyrepresent a direct protective effect of the workingenvironment. A few negative associations-for exam-ple, the low incidence of brain cancer in labourers(RR = 0-6, CI 04-0-9)-may be attributable to cor-relates of social class, but most are probably spurious.
Application of the job-exposure matrix added littleto the analysis. This may be because there are noimportant associations between the agents included inthe matrix and the cancers studied, but the uncer-tainty with which exposures can be inferred from thelimited occupational information recorded on deathcertificates was a major constraint. For example,among the cases classed as potentially exposed to leadwere several chemical process workers and refineryworkers, but without more detailed job descriptions itis impossible to be sure which, if any, of these menactually had contact with lead. We are unaware ofany previous studies linking lead compounds withmelanoma and the association in our survey may wellhave occurred by chance.The most interesting findings of the study are those
relating to the processing of fish and frozen foods andto mineral oil refining. Whether the demonstratedassociations have a biological basis will only becomeclear with further research. We think, however, thatour observations show the potential value of thisanalytical approach as an adjunct to other methods ofexamining occupational mortality.
We thank the Office of Population Censuses and Sur-veys for providing us with the death certificates, PaulWinter who helped with the computing, and Dr AWard Gardner who helped with the coding ofoccupations.Dr C Magnani carried out this work during the
tenure of a research training fellowship awarded bythe International Agency for Research on Cancer.
References
1 Alderson M. Occupational cancer. London: Butterworth, 1986.2 Schottenfeld D, Fraumeni JF, eds. Cancer epidemiology and
prevention. Philadelphia: WB Saunders, 1982.3 Merletti F, Hesletine E, Saracci R, et al. Target organs for car-
cinogenicity of chemicals and industrial exposures in humans:a review of results in the IARC monographs on the evaluationof the carcinogenic risk of chemicals to humans. Cancer Res1984;44:2244-50.
4 Weiss W, Boucot KR. The respiratory effects of chloromethylmethyl ether. JAMA 1975;234:1 139-42.
5 General Register Office. Classification of occupations (1966).London: HMSO, 1966.
6 Central Statistical Office. Standard industrial classification. Lon-don: HMSO, 1968.
775
copyright. on 1 July 2018 by guest. P
rotected byhttp://oem
.bmj.com
/B
r J Ind Med: first published as 10.1136/oem
.44.11.769 on 1 Novem
ber 1987. Dow
nloaded from
776
7 Pannett B, Coggon D, Acheson ED. A job-exposure matrix foruse in population based studies in England and Wales. Br J IdMed 1985;42:777-83.
8 Breslow NE, Day NE. Statistical methods in cancer research. Vol1. The analysis of case-control studies. Lyon: InternationalAgency for Research on Cancer, 1980.
9 Heasman MA, Lipworth L. Accuracy of certification of cause ofdeath. London: HMSO, 1966. (General Registrar Office studieson medical and population subjects No 20.)
10 Alderson MR. Some sources of error in British occupational mor-
tality data. Br J Ind Med 1972;29:245-54.11 Office of Population Censuses and Surveys. Occupational mor-
tality 1970-72. Decennial supplement for England and Wales.London: HMSO, 1978. (Series DS No 1.)
Magnani, Coggon, Osmond, Acheson12 Rushton L, Alderson MR. An epidemiological survey of eight oil
refineries in Britain. Br J Ind Med 1981;38:225-34.13 Theriault G, Goulet L. A mortality study of oil refinery workers.
J Occup Med 1979;21:367-70.14 Waxweiler RJ, Alexander V, Leffingwell SS, Haring M, Lloyd
JW. Mortality from brain tumour.and other causes in a cohortof petrochemical workers. JNCI 1983;70:75-81.
15 Thomas TL, Waxweiler RJ, Crandall MS, et al. Brain canceramong OCAW members in three Texas oil refineries. Ann NYAcad Sci 1982;381:120-9.
16 Nicholson WJ, Seidman H, Selikoff IJ, et al. Brain tumoursamong operating engineers in the chemical and petrochemicalindustry in Texas and Louisiana. Ann NY Acad Sci1982;381:172-80.
Correction
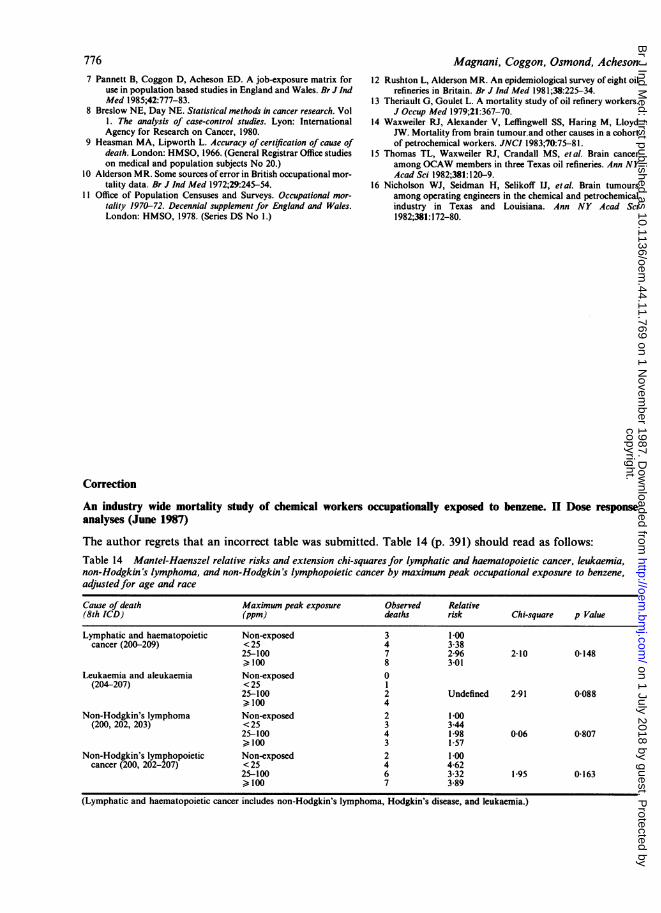
An industry wide mortality study of chemical workers occupationally exposed to benzene. II Dose responseanalyses (June 1987)
The author regrets that an incorrect table was submitted. Table 14 (p. 391) should read as follows:Table 14 Mantel-Haenszel relative risks and extension chi-squares for lymphatic and haematopoietic cancer, leukaemia,non-Hodgkin's lymphoma, and non-Hodgkin's lymphopoietic cancer by maximnum peak occupational exposure to benzene,adjustedfor age and race
Cause of death Maximum peak exposure Observed Relative(8th ICD) (ppm) deaths risk Chi-square p Value
Lymphatic and haematopoietic Non-exposed 3 1-00cancer (200-209) <25 4 3-38
25-100 7 2-96 2-10 0-148,_100 8 3-01
Leukaemia and aleukaemia Non-exposed 0(204-207) <25 1
25-100 2 Undefined 2-91 0-088_100 4
Non-Hodgkin's lymphoma Non-exposed 2 100(200, 202, 203) <25 3 3.44
25-100 4 1-98 0-06 0-807>100 3 1-57
Non-Hodgkin's lymphopoietic Non-exposed 2 1 00cancer (200, 202-207) <25 4 4-62
25-100 6 3-32 1 95 0-163>100 7 389
(Lymphatic and haematopoietic cancer includes non-Hodgkin's lymphoma, Hodgkin's disease, and leukaemia.)
copyright. on 1 July 2018 by guest. P
rotected byhttp://oem
.bmj.com
/B
r J Ind Med: first published as 10.1136/oem
.44.11.769 on 1 Novem
ber 1987. Dow
nloaded from