occupational changes during the 20th century occupations in other years, it was difficult to...
TRANSCRIPT

Monthly Labor Review March 2006 35
With occupation data from the 2000census now available, it is an appro-priate time to analyze occupational
employment trends over the 20th century. Theshift from a workforce composed mostly ofmanual workers to one comprising mostly white-collar and service workers is generally known.This article reveals just how radical that shifthas been. It also shows that many of the pro-jected employment changes over the 2004–14period1 are continuations of trends that beganin the previous century.
The article analyzes changes in occupa-tional staffing patterns—occupations andoccupation groups as a percent of total em-ployment in the economy—rather than numericchanges.2 This methodology indexes em-ployment growth to the average for all occu-pations over the period. Occupations andoccupational groups growing faster than aver-age appear as an increasing proportion of totalemployment, those growing as fast as averageas a constant percent, and slower growing ordeclining ones as a declining percent.3 For clar-ity, however, numeric employment data also aregiven.
Data and methodology
Occupational data presented in this article arefrom decennial censuses, adjusted by the In-tegrated Public Use Microdata Series (IPUMS)from the University of Minnesota’s Minnesota
Population Center.4 Every census taken in the 20thcentury used a different system to classifyoccupations, so data between censuses are notnecessarily comparable. IPUMS used the 1950 Indexof Occupations and Industries to impose anoccupational scheme on data from each census.Because of definitional changes and because someoccupations in the 1950 index were components ofbroader occupations in other years, it was difficultto determine some decade-to-decade employmentchanges. That is, while the broad trends shownfor larger occupation groups and many individualoccupations are believed to be relatively accurate,some decade-to-decade changes may reflect datacomparability problems between surveys ratherthan indicating actual changes in employment.5
Nevertheless, data estimates are shown to theclosest thousand; readers should be aware thatactual employment may have been somewhatdifferent.
The 1950 census classified all workers into 269occupation categories, hereafter referred to asoccupations;6 the same census also gives em-ployment estimates for each occupation. In itseffort to create a consistent time series, IPUMS
reduced the number of occupations to 230. The1950 census arranged all occupations into 11 majorgroups, as shown in chart 1, but, with a few excep-tions, no subgroups—all occupations were justlisted alphabetically.7 To better analyze growthpatterns within these 11 major groups, this articleclassifies the majority of occupations into sub-groups, closely corresponding to 2000 Standard
Occupational Changes
Ian D. WyattandDaniel E. Hecker
Professional, managerial, clerical, sales, and service workers(except private household service workers) grew from one-quarterto three-quarters of total employment between 1910 and 2000;laborers (except mine laborers), private household serviceworkers, and farmers lost the most jobs over the period
Occupational changesduring the 20th century
Ian D. Wyatt is aneconomist in theOffice ofOccupationalStatistics andEmploymentProjections, Bureau ofLabor Statistics; DanielE. Hecker is aneconomist formerly inthe same office. E-mail:[email protected]
36 Monthly Labor Review March 2006
Occupational Changes
0 5 10 15 20 25
0 5 10 15 20 25
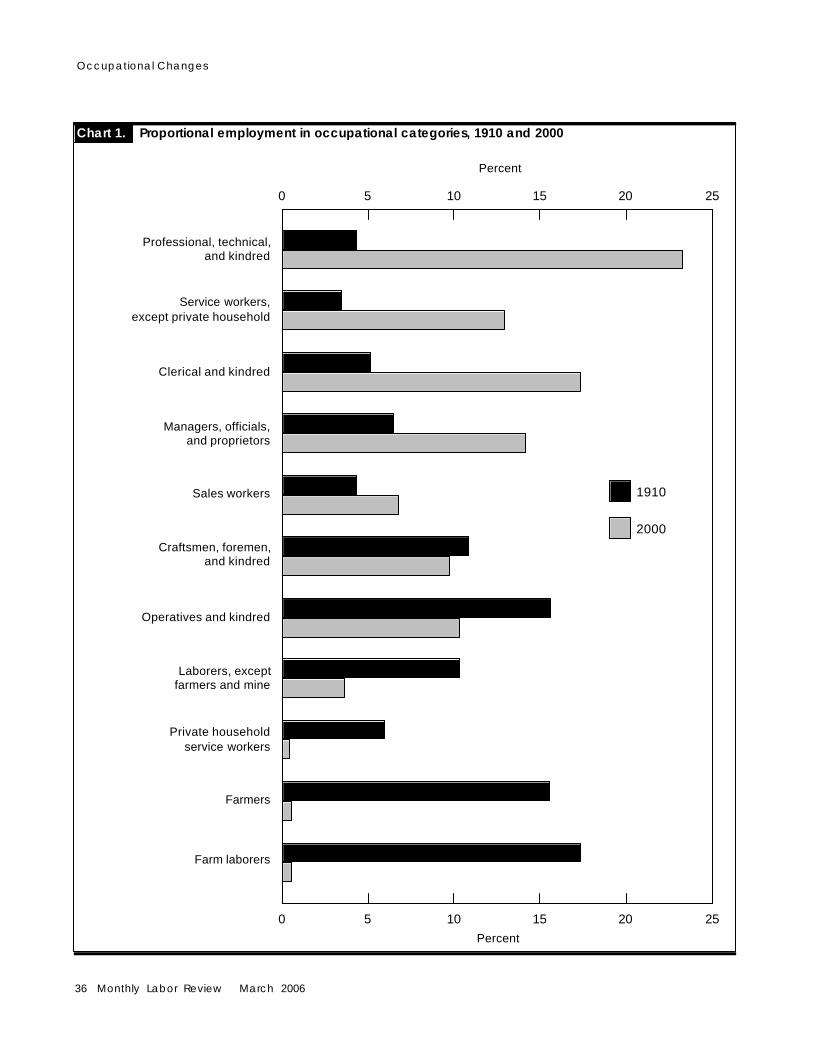
Chart 1. Proportional employment in occupational categories, 1910 and 2000
Percent
Professional, technical,and kindred
Service workers,except private household
Clerical and kindred
Managers, officials,and proprietors
Sales workers
Craftsmen, foremen,and kindred
Operatives and kindred
Laborers, exceptfarmers and mine
Private householdservice workers
Farmers
Farm laborers
Percent
1910
2000

Monthly Labor Review March 2006 37
Occupational Classification (SOC) major or minor groups.8
Some 1950 occupation and group names are genderspecific or differ in other ways from those in current use, andtheir coverage of occupations also may differ. In addition, in1950, some occupations were classified into major groupsdifferent from those they were classified into in 2000. Forexample, cashiers, judged a sales occupation in 2000, consti-tuted a clerical occupation in 1950, and the category of farm-ers and farm managers, which formed a minor occupationgroup within management occupations in the 2000 census,was one of the 11 major occupation groups in the 1950 classi-fication. Therefore, the 2000 employment levels shown in thisarticle for certain occupations or occupation groups may notmatch the employment levels listed in the 2000 census forthose same occupations or occupation groups.
The 1900 and 1930 data sets were unavailable from IPUMS
at the time the research that led to this article was beingcarried out. Therefore, the time series begins with 1910 andcovers eight additional data points: the year 1920 and theyears 1940 through 2000. An employment status filter wasapplied to the 1940–2000 samples, eliminating those who werenot actively employed. During that period, the census askedthese people what the last occupation they held was if it waswithin the previous 5 or 10 years (depending upon whichcensus year was in question). Including those employedwithin the previous 5 or 10 years would create some distor-tions, and the data obtained would not match other publiclyavailable data. By contrast, no filter was applied to the 1910or 1920 data. In both of these censuses, the question onoccupation was restricted to those who were either employedor actively looking for work. Those who were retired or out ofthe labor force for any other reason were not included. Whenthe employment filter was applied to the 1910 sample, certainoccupations nearly disappeared. Applying an employmentfilter to the 1920 survey was not possible, because that censusdid not ask any question about the respondent’s employmentstatus. Therefore, the 1910 and 1920 data include somepersons not employed in those years. Altogether, the censusdata show that employment increased 2.3 times over the 9decades, from 39.2 million to 129.7 million.
Occupation categories
Occupational staffing patterns changed radically over the1910–2000 period in response to changes in the mix of goodsand services produced and the methods used to producethem. Of the 11 major occupation groups listed in the 1950census, professional, technical, and kindred workers had thelargest percent (and numeric) increase, while the farmer andfarm laborer groups had the largest percent (and numeric)decreases. (See chart 1.) Professional, technical, and kindredworkers rose from ninth largest to the largest occupation
group, while the two farm groups dropped from largest andthird largest, respectively, to the smallest, except for privatehousehold workers.9
Five of the major occupation groups increased as a shareof the total, while six declined. All of the ones that declined,except for private household workers, consist of occupationsthat produce, repair, or transport goods and are concentratedin the agriculture, mining, construction, manufacturing, andtransportation industries. The five that increased are the so-called white-collar occupations, plus service workers, exceptprivate household. The four major groups that are white-collar occupations include mostly occupations having to dowith information, ideas, or people (many in the service groupalso work with people); are more concentrated in services-producing industries; and, at least for professional andmanagerial occupations, have higher-than-average educationrequirements. In aggregate, the five groups that increasedwent from 24 percent to 75 percent of total employment, whilethe six groups that declined went from 76 percent to 25percent over the 90-year period.10
The analysis that follows presents charts and discussesdecade-by-decade trends for
• the aforementioned 11 major occupation groups;• selected occupation subgroups, generally
corresponding to major or minor groups in the 2000SOC system; and
• individual occupations that are large, that helpexplain group trends, or that run counter to grouptrends.
Occupations and occupation groups are discussed in theorder of their staffing pattern changes, from the largest in-crease to the largest decrease. Those which increased as aproportion of the total tend to be concentrated in industriesthat grew more rapidly than average or that were a growingproportion of employment in their industries. For example,attendants in hospitals and in medical and dental offices grewparticularly fast, because they were employed in rapidlygrowing health services industries and, over the century, theyassumed many routine duties formerly performed by physi-cians, nurses, and other healthcare workers. In contrast, rail-road brakemen and switchmen declined very sharply, bothbecause demand for railroad services grew much more slowlythan average and because their work became increasinglymechanized.
Changes in the mix of goods and services produced, intechnology, and in business practices, as well as broadeconomic and social trends, are discussed to the extent thatthey explain changes in occupational staffing patterns. Forexample, the mechanization of the production of goods andservices and the development of technology are discussed in
38 Monthly Labor Review March 2006
Occupational Changes
the sections on production operatives and engineers, respectively;the spread of motor vehicle use is discussed in the context of roadvehicle operators, mechanics and repairers, and police; and thegrowth of large bureaucratic organizations is examined in thediscussion of accountants, clerical workers, and managers.
Some occupation groups exhibited sharp, steady growth asa percent of total employment over the entire period.11 Theseoccupations include professional occupations overall andseveral professional subgroups, such as accountants, collegeteachers, and healthcare workers except for physicians, as wellas protective service workers. Computer specialists hadespecially sharp growth from 1960, when data on that occupationwere first collected. Managers, officials, and proprietors alsogrew, but more slowly. Other groups grew rapidly after 1910, butslowed some time after midcentury. Among these groups areengineers; teachers, except college; and food service workers.Sales workers, mechanics and repairers, and road vehicleoperators stopped growing altogether. Judges and lawyers’ andphysicians and surgeons’ employment showed no growththrough 1970, but rose—particularly sharply for lawyers—after1970. For both groups, the early lack of growth was due, at leastin part, to artificial limits on supply. (See the discussion on pages10–11.)
Both operatives and clerical workers rose as a proportionof employment for a number of decades, but then declined.
Production and other craftsmen, laborers, mine operatives,and farmers and farm managers all rose from 1910 to 1920, butthen declined for the rest of the century, some sharply. Con-struction workers declined slowly throughout the period.
Farm laborers and foremen, as well as private householdworkers, dropped sharply after 1910. As a result, the occupa-tional staffing patterns in 2000 were vastly different fromthose in 1910.
Professional, technical, and kindred workers
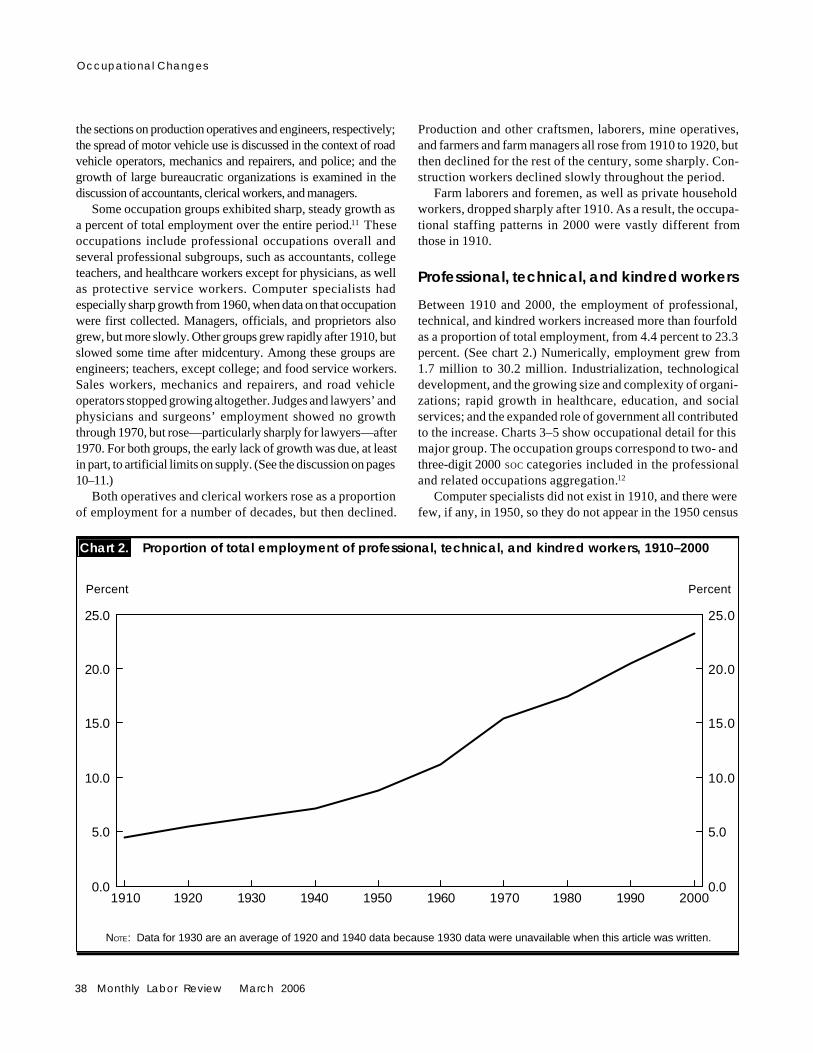
Between 1910 and 2000, the employment of professional,technical, and kindred workers increased more than fourfoldas a proportion of total employment, from 4.4 percent to 23.3percent. (See chart 2.) Numerically, employment grew from1.7 million to 30.2 million. Industrialization, technologicaldevelopment, and the growing size and complexity of organi-zations; rapid growth in healthcare, education, and socialservices; and the expanded role of government all contributedto the increase. Charts 3–5 show occupational detail for thismajor group. The occupation groups correspond to two- andthree-digit 2000 SOC categories included in the professionaland related occupations aggregation.12
Computer specialists did not exist in 1910, and there werefew, if any, in 1950, so they do not appear in the 1950 census
Chart 2. Proportion of total employment of professional, technical, and kindred workers, 1910–2000
Percent Percent
NOTE: Data for 1930 are an average of 1920 and 1940 data because 1930 data were unavailable when this article was written.
1910 1920 1930 1940 1950 1960 1970 1980 1990 20000.0
5.0
10.0
15.0
20.0
25.0
0.0
5.0
10.0
15.0
20.0
25.0
Monthly Labor Review March 2006 39
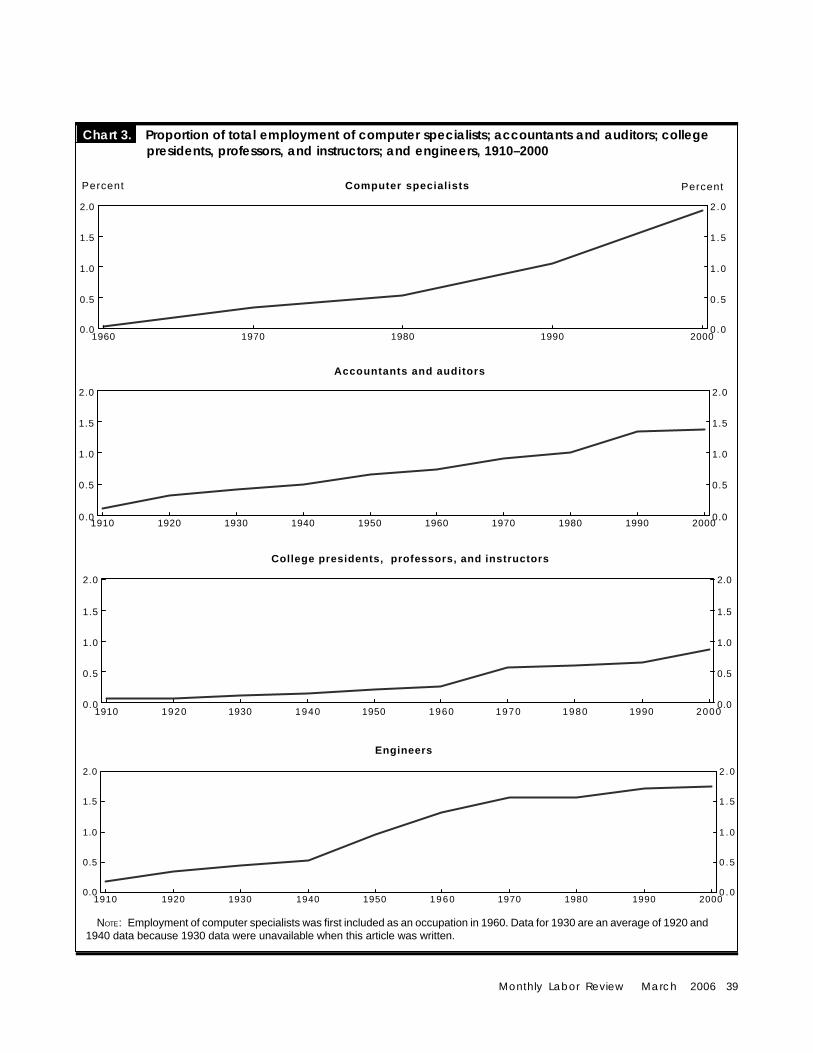
Chart 3. Proportion of total employment of computer specialists; accountants and auditors; collegepresidents, professors, and instructors; and engineers, 1910–2000
NOTE: Employment of computer specialists was first included as an occupation in 1960. Data for 1930 are an average of 1920 and1940 data because 1930 data were unavailable when this article was written.
1960 1970 1980 1990 20000.0
0.5
1.0
1.5
2.0
0 .0
0 .5
1 .0
1 .5
2 .0
1910 1920 1930 1940 1950 1960 1970 1980 1990 20000.0
0.5
1.0
1.5
2.0
0.0
0.5
1.0
1.5
2.0
1910 1920 1930 1940 1950 1 9 6 0 1970 1980 1990 20000.0
0.5
1.0
1.5
2.0
0 . 0
0 . 5
1 . 0
1 . 5
2 . 0
Percent Computer specialists
Accountants and auditors
College presidents, professors, and instructors
Engineers
1910 1920 1930 1940 1950 1960 1970 1980 1990 20000.0
0.5
1.0
1.5
2.0
0.0
0.5
1.0
1.5
2.0
Percent
40 Monthly Labor Review March 2006
Occupational Changes
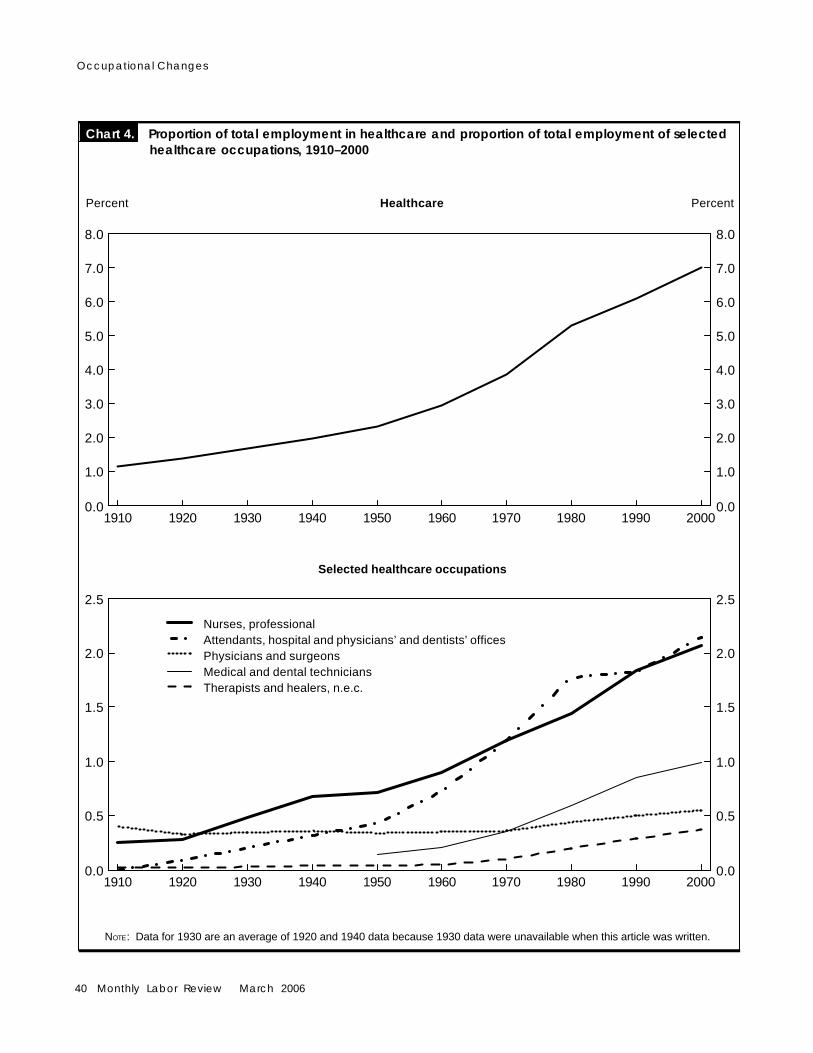
Chart 4. Proportion of total employment in healthcare and proportion of total employment of selectedhealthcare occupations, 1910–2000
Percent PercentHealthcare
Selected healthcare occupations
Nurses, professionalAttendants, hospital and physicians’ and dentists’ officesPhysicians and surgeonsMedical and dental techniciansTherapists and healers, n.e.c.
Attendants, hospital
Therapists and heal Therapists and heal Medical and dental
NOTE: Data for 1930 are an average of 1920 and 1940 data because 1930 data were unavailable when this article was written.
1910 1920 1930 1940 1950 1960 1970 1980 1990 20000.0
1.0
2.0
3.0
4.0
5.0
6.0
7.0
8.0
0.0
1.0
2.0
3.0
4.0
5.0
6.0
7.0
8.0
1910 1920 1930 1940 1950 1960 1970 1980 1990 20000.0
0.5
1.0
1.5
2.0
2.5
0.0
0.5
1.0
1.5
2.0
2.5

Monthly Labor Review March 2006 41
Chart 5. Proportion of total employment of lawyers and judges and of teachers, except college, 1910–2000
Percent PercentLawyers and judges
Teachers, except college
NOTE: Data for 1930 are an average of 1920 and 1940 data because 1930 data were unavailable when this article was written.
1910 1920 1930 1940 1950 1960 1970 1980 1990 20000.0
0.1
0.2
0.3
0.4
0.5
0.6
0.7
0.8
0.0
0.1
0.2
0.3
0.4
0.5
0.6
0.7
0.8
1910 1920 1930 1940 1950 1960 1970 1980 1990 20000.0
0.5
1.0
1.5
2.0
2.5
3.0
3.5
4.0
4.5
0.0
0.5
1.0
1.5
2.0
2.5
3.0
3.5
4.0
4.5

42 Monthly Labor Review March 2006
Occupational Changes
or the IPUMS classification system. The first commercialelectronic computer was delivered in 1951, and employmentdata on computer specialists were first collected in the 1960Census.13
Computer specialists grew 95 times as a proportion of totalemployment between 1960 and 2000, from 0.02 percent to 1.92percent. (See chart 3, top panel.) Employment grew from 12,000to 2,496,000.14 The rapid development of computer tech-nology—both more advanced hardware and software andthe growth of networks, including the Internet—plus sharplyfalling computer prices led to the spread of computer use toalmost all areas of the economy.
Accountants and auditors grew 13 times as a proportionof total employment between 1910 and 2000, from 0.1 percentto 1.4 percent. (See chart 3, second panel.) Employment grewfrom 39,000 to 1,795,000.15 The increasing complexity ofbusiness and government operations; more sophisticatedmanagement techniques that required more accounting data;greater government regulation regarding financial disclosure,mergers, pensions, and other issues; and the developmentof complex tax laws all contributed to the growth of thisoccupation.
College presidents, professors, and instructors grew 12times as a proportion of total employment between 1910 and2000, from 0.07 percent to 0.87 percent. (See chart 3, thirdpanel.) The number grew 43 times, from 26,000 to 1,132,000.Over the 9 decades, college enrollments also grew 43 times,from 355,000 to 14,979,000, while the proportion of thepopulation aged 25 and older with 4 or more years of collegegrew 9.5 times, from 2.7 percent to 25.6 percent.
The more rapid growth from 1960 to 1970 reflects theattendance of the 1946–64 baby-boom generation. From fall1959 to fall 1969, enrollments in degree-granting institutionsmore than doubled, from 3.64 million to 8 million. The sharpincrease from 1990 to 2000 reflects a sharp rise in enrollments,as well as growth in the proportion of part-time professorsand instructors. The latter growth may have spread the teach-ing load over more teachers.
Engineers increased 9 times as a proportion of totalemployment between 1910 and 2000, from 0.2 percent to 1.8percent. (See chart 3, bottom panel.) Their number grew from74,000 to 2,276,000. Rapid industrialization and growingtechnological sophistication, which increasingly dependedon the work of engineers, fueled the growth. Prior to 1910,much innovation was carried out by self-taught inventors,such as Thomas Edison, but it increasingly began to be carriedout by engineers, many in research-and-development labora-tories. A rapid growth of manufacturing, including the newmotor vehicle and aircraft industries; the development of avast infrastructure of roads, bridges, and electric power andother utilities; the growth of telephone and broadcast com-munications and the development of computers; more com-
mercial buildings; and sharp increases in defense spendingafter 1940 all fueled the growth.16 Slower growth after 1970reflects the slower growth of manufacturing, in whichengineers are concentrated, and the use of computers indesign work, which increased engineers’ productivity.17 The1990–2000 trend also reflects a drop in defense spending withthe end of the Cold War.
Healthcare workers grew 5 times as a proportion of totalemployment between 1910 and 2000, from 1.2 percent to 7.0percent. (See chart 4, top panel.) Employment grew from 453,000to 9,056,000. In 1950, some occupations included in healthcarewere not part of professional and technical employment. In orderto encompass all healthcare workers within the same category,attendants in hospitals and other institutions and practicalnurses, both of which were classified as service occupations inthe 1950 census, and attendants in physicians’ and dentists’offices, classified as a clerical occupation in 1950, are includ-ed among healthcare workers in this article.18
Growth occurred as improved medical technology per-mitted many more medical problems to be treated, or to betreated more aggressively, greater wealth and the spread ofhealth insurance made healthcare more affordable, and a morelong-lived population increased the need for healthcare. In1910, most healthcare was provided in the home, with basictasks performed by family members. Over the century, moreand more healthcare began to be provided by healthcareworkers in hospitals, nursing homes, and offices of medicalpractitioners.19 For example, there was a large increase in theproportion of childbirths in hospitals between 1920 and1940.20
The expansion of health insurance played a key role in thegrowth of healthcare after 1940. By shifting the responsibilityfor payment from the consumer to third-party payers such asinsurance companies and the government, health insuranceencouraged consumers to use more and costlier healthcareservices. Health insurance also encouraged the developmentof new programs and technologies with little concern for theirtrue cost.21 In 1939, only 6 percent of workers had hospitalinsurance; by 1950, 51 percent of workers were covered.22
Growth was stimulated during World War II, as wage controlsencouraged employers to offer benefits, such as hospitalinsurance, to recruit and retain workers.23 Gradually, hospitalinsurance was expanded from simply covering hospital careto covering a wide range of healthcare, whereupon it becamehealth insurance in general. In 1965, with the creation ofMedicare and Medicaid, insurance expanded further to coverthe elderly and the poor. By 1970, 86 percent of Americanshad some form of health insurance,24 and that percentageremained about the same through 2000.25
Despite growth in the proportion of healthcare workers,overall the proportion of physicians and surgeons droppedbetween 1910 and 1970, from 0.40 percent to 0.36 percent of
Monthly Labor Review March 2006 43
total employment. (See chart 4, bottom panel.) The drop wascaused by changes in healthcare delivery that increased theproductivity of physicians and surgeons and by restrictionson medical school enrollments that limited the supply of thoseprofessionals. Physicians’ productivity increased becausesome duties were shifted to other healthcare workers andbecause doctors stopped making house calls. The expansion ofmedical schools and the admission of more foreign-trainedphysicians and surgeons to the Nation helped raise the pro-portion of physicians and surgeons to 0.55 percent by 2000.26
Employment grew from 155,000 in 1910 to 279,000 in 1970 and709,000 in 2000.
The expansion of hospitals, nursing homes, and otherhealthcare services and the increasing specialization in health-care increased the proportional employment of most otherhealthcare workers. Professional nurses grew from 0.3 percent to2.1 percent of total employment, and therapists and healers grewfrom 0.02 percent to 0.37 percent. (See chart 4, bottom panel.)Attendants in hospitals and other institutions and attendants inphysicians’ and dentists’ offices grew from 0.1 percent to 2.2percent of total employment from 1920 to 2000 (no data wereavailable for 1910), as they assumed more routine tasks formerlydone by physicians, nurses, and other higher paid workers. (Seechart 4, bottom panel.) Medical and dental technicians grewfrom 0.14 percent to 0.99 percent of total employment between1950 and 2000. (See chart 4, bottom panel; no data were availablebefore 1950.)
Lawyers and judges increased one-and-a-half times as aproportion of total employment between 1910 and 2000, withalmost all growth coming since 1970. (See chart 5, top panel.)Between 1910 and 1970, lawyers and judges grew from 0.29percent to 0.35 percent of employment (reaching a peak of 0.36percent in 1940), after which they jumped to 0.71 percent by2000.27 Employment grew from 112,000 in 1910 to 272,000 in 1970and 927,000 in 2000. Stiff licensing requirements (for bothindividuals and law schools) and other restrictions on supplylimited growth through 1970, but as these restrictions weakenedor disappeared, the number of law graduates grew.28 At the sametime, demand for lawyers increased, as many more laws wereenacted, business activities became more complex, and societybecame more litigious. Civil rights legislation for minorities,women, and older and disabled persons; laws regarding theenvironment, employer-employee relations, product safety, andconsumer protection; and higher crime and divorce rates allcontributed to the growth of lawyers and judges.29 SeveralSupreme Court decisions expanded the right to a court-appointedcounsel for criminal defendants, which in turn led to increasedfunds for public-defenders’ offices and a sharp increase in thenumber of court-appointed defense attorneys.
Teachers below the college level30 increased 1.4 times as aproportion of total employment between 1910 and 2000, from1.6 percent to 3.8 percent. (See chart 5, bottom panel.) Their
number rose sevenfold, from 624,000 to 4,972,000. Decreasingclass size, as measured by pupil-to-teacher ratios, and greaterenrollments drove the growth of schoolteachers. The sharpgrowth in the number of adults taking self-enrichment classes,in subjects such as cooking, dancing, and creative writing,as well as those taking remedial education, adult literacy, andEnglish as a second language, drove the growth of adulteducation teachers.
The elementary and secondary school pupil-to-teacherratio dropped by more than half, from about 35 in 1910 to 16.4in 2000.31 Elementary and secondary school enrollments grew1.7 times, from 19,372,000 to 52,989,000, between 1910 and2000, while total U.S. population grew more than twofold,from 92,000,00032 to 281,000,000.33 The number of 5- to 18-year-olds increased 1.3 times, from 24,361,000 in 1910 to61,298,000 (5- to 19-year-olds) in 2000.34 Enrollments increasedeven faster than the 5- to 18-year-old population, becausestudents remained in school for more years, on average, in2000 than in 1910. Much of the increase in educationalattainment occurred during the middle of the century. Be-tween 1940 and 1980, the percentage of 25- to 29-year-oldswith a high school diploma increased from 38.1 percent to85.4 percent. (The percentage of black 25- to 29-year-oldswith a high school diploma increased from 12.3 percent to76.7 percent.) Growth slowed after 1980, but reached 88.1percent in 2000.35 The increase in the number of teachersbelow the college level was more pronounced among sec-ondary school teachers than among elementary schoolteachers.
The drop in teachers as a proportion of the total employedin 1950 reflects lower enrollments as the smaller age cohort ofthose born during the 1930s moved through the educationsystem. The increases in 1960 and 1970 reflect higher enroll-ments as the baby-boom generation, born between 1946 and1964, moved through the system. After 1970, lower enroll-ments, together with a continued drop in pupil-teacher ratios,led to more modest growth in teachers as a proportion of thetotal employed.
Clergy (trend not charted), one of the larger professionaloccupations in 1910, decreased slightly as a proportion oftotal employment between 1910 and 2000, from 0.32 percentto 0.29 percent. Employment of clergy grew from 125,000 to379,000.36
Service workers, except private household
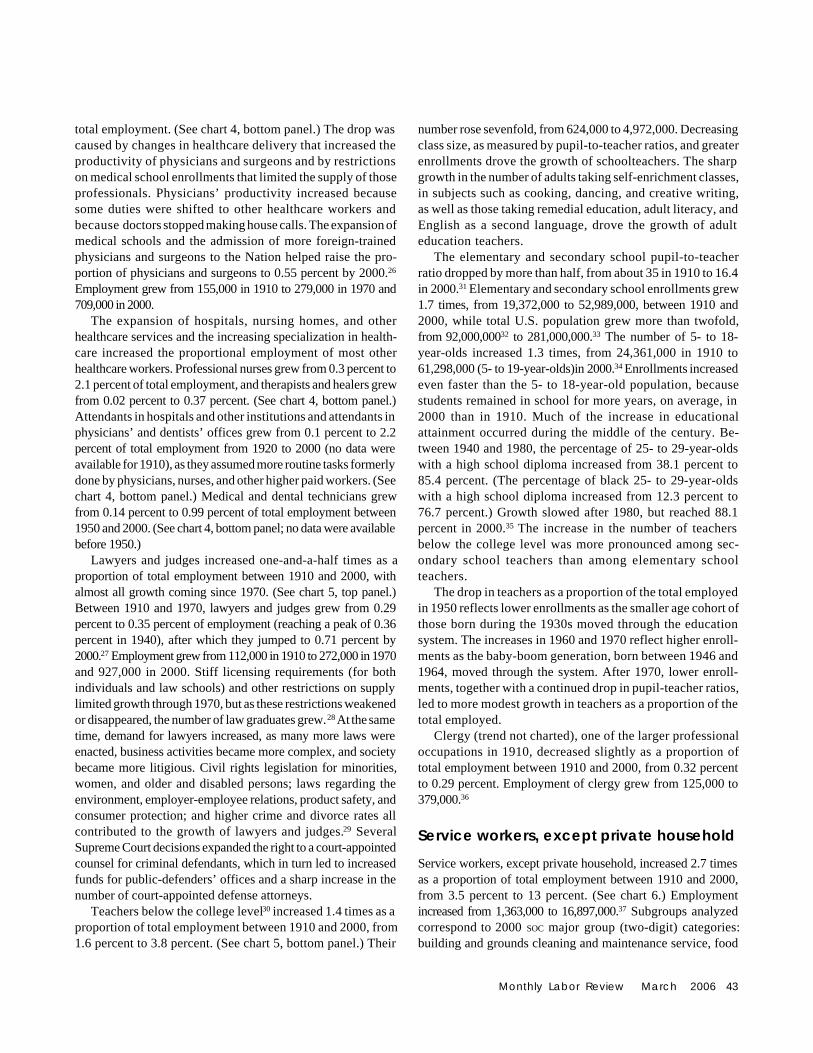
Service workers, except private household, increased 2.7 timesas a proportion of total employment between 1910 and 2000,from 3.5 percent to 13 percent. (See chart 6.) Employmentincreased from 1,363,000 to 16,897,000.37 Subgroups analyzedcorrespond to 2000 SOC major group (two-digit) categories:building and grounds cleaning and maintenance service, food
44 Monthly Labor Review March 2006
Occupational Changes
preparation and serving, protective service, and personal careand service occupations. (Health service, a fifth SOC majorgroup within the service occupations, which includesattendants at hospitals and other institutions, as well aspractical nurses, was discussed earlier with professionalhealthcare workers.38)
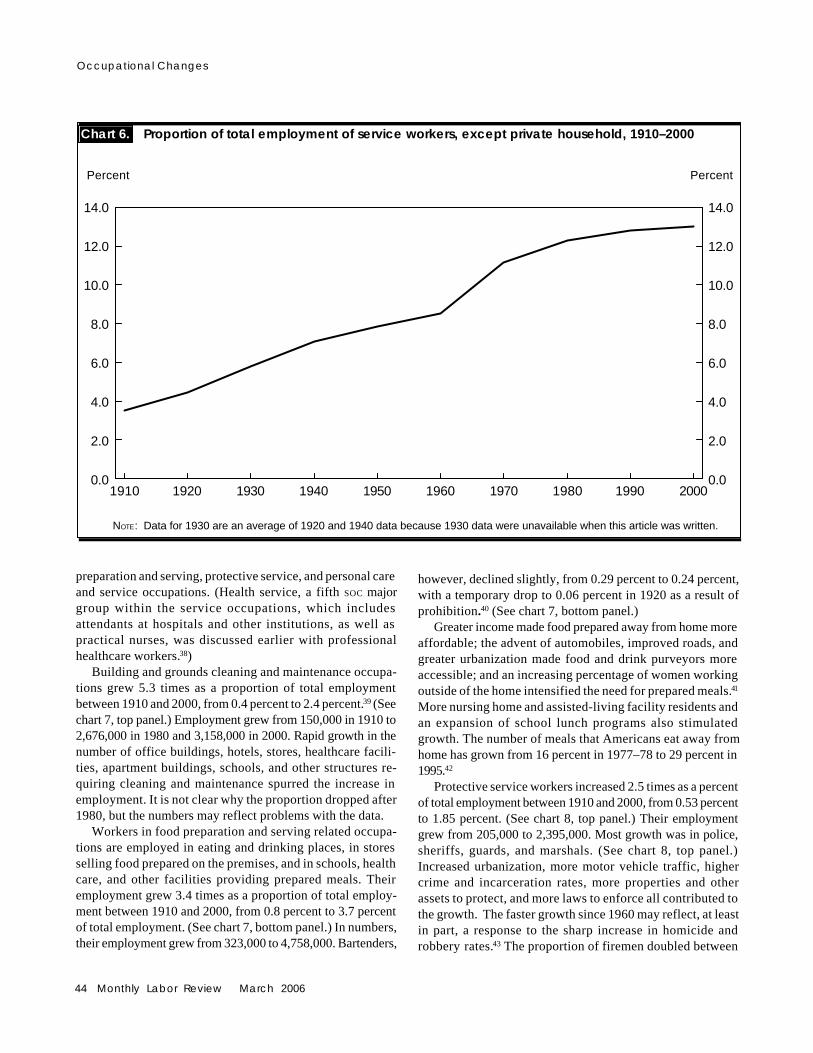
Building and grounds cleaning and maintenance occupa-tions grew 5.3 times as a proportion of total employmentbetween 1910 and 2000, from 0.4 percent to 2.4 percent.39 (Seechart 7, top panel.) Employment grew from 150,000 in 1910 to2,676,000 in 1980 and 3,158,000 in 2000. Rapid growth in thenumber of office buildings, hotels, stores, healthcare facili-ties, apartment buildings, schools, and other structures re-quiring cleaning and maintenance spurred the increase inemployment. It is not clear why the proportion dropped after1980, but the numbers may reflect problems with the data.
Workers in food preparation and serving related occupa-tions are employed in eating and drinking places, in storesselling food prepared on the premises, and in schools, healthcare, and other facilities providing prepared meals. Theiremployment grew 3.4 times as a proportion of total employ-ment between 1910 and 2000, from 0.8 percent to 3.7 percentof total employment. (See chart 7, bottom panel.) In numbers,their employment grew from 323,000 to 4,758,000. Bartenders,
however, declined slightly, from 0.29 percent to 0.24 percent,with a temporary drop to 0.06 percent in 1920 as a result ofprohibition.40 (See chart 7, bottom panel.)
Greater income made food prepared away from home moreaffordable; the advent of automobiles, improved roads, andgreater urbanization made food and drink purveyors moreaccessible; and an increasing percentage of women workingoutside of the home intensified the need for prepared meals.41
More nursing home and assisted-living facility residents andan expansion of school lunch programs also stimulatedgrowth. The number of meals that Americans eat away fromhome has grown from 16 percent in 1977–78 to 29 percent in1995.42
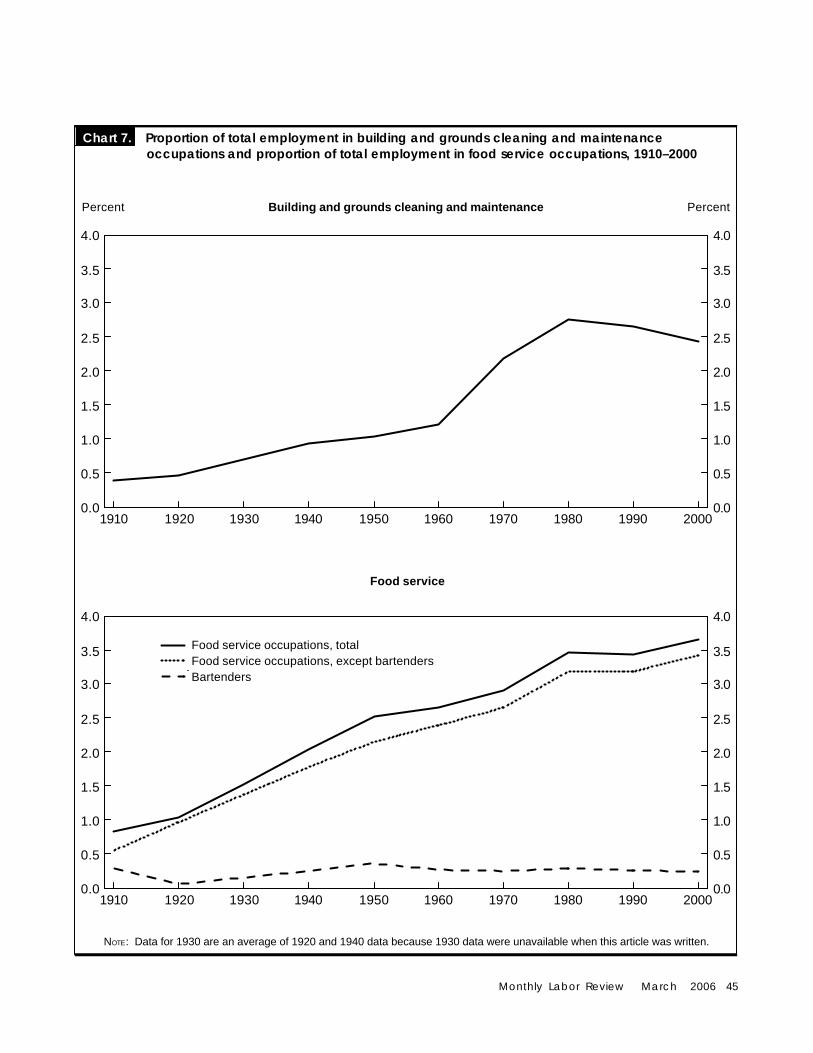
Protective service workers increased 2.5 times as a percentof total employment between 1910 and 2000, from 0.53 percentto 1.85 percent. (See chart 8, top panel.) Their employmentgrew from 205,000 to 2,395,000. Most growth was in police,sheriffs, guards, and marshals. (See chart 8, top panel.)Increased urbanization, more motor vehicle traffic, highercrime and incarceration rates, more properties and otherassets to protect, and more laws to enforce all contributed tothe growth. The faster growth since 1960 may reflect, at leastin part, a response to the sharp increase in homicide androbbery rates.43 The proportion of firemen doubled between
Chart 6. Proportion of total employment of service workers, except private household, 1910–2000
Percent Percent
1910 1920 1930 1940 1950 1960 1970 1980 1990 20000.0
2.0
4.0
6.0
8.0
10.0
12.0
14.0
0.0
2.0
4.0
6.0
8.0
10.0
12.0
14.0
NOTE: Data for 1930 are an average of 1920 and 1940 data because 1930 data were unavailable when this article was written.
Monthly Labor Review March 2006 45
Chart 7. Proportion of total employment in building and grounds cleaning and maintenanceoccupations and proportion of total employment in food service occupations, 1910–2000
Percent PercentBuilding and grounds cleaning and maintenance
Food service
Bartenders
Food service occupations, totalFood service occupations, except bartendersBartenders
NOTE: Data for 1930 are an average of 1920 and 1940 data because 1930 data were unavailable when this article was written.
1910 1920 1930 1940 1950 1960 1970 1980 1990 20000.0
0.5
1.0
1.5
2.0
2.5
3.0
3.5
4.0
0.0
0.5
1.0
1.5
2.0
2.5
3.0
3.5
4.0
1910 1920 1930 1940 1950 1960 1970 1980 1990 20000.0
0.5
1.0
1.5
2.0
2.5
3.0
3.5
4.0
0.0
0.5
1.0
1.5
2.0
2.5
3.0
3.5
4.0
46 Monthly Labor Review March 2006
Occupational Changes
Chart 8. Proportion of total employment in protective service occupations and in personal care andservice occupations, 1910–2000
Percent PercentProtective service
Personal care and service
Protective services, totalPolicemen, sheriffs, guards, and marshalsFiremen, fire protectionBartenders
NOTE: Data for 1930 are an average of 1920 and 1940 data because 1930 data were unavailable when this article was written.
1910 1920 1930 1940 1950 1960 1970 1980 1990 20000.0
0.5
1.0
1.5
2.0
2.5
0.0
0.5
1.0
1.5
2.0
2.5
1910 1920 1930 1940 1950 1960 1970 1980 1990 20000.0
0.5
1.0
1.5
2.0
2.5
0.0
0.5
1.0
1.5
2.0
2.5
Monthly Labor Review March 2006 47
1910 and 1950, due to urbanization and the replacement ofvolunteers with paid firefighters, but remained level there-after. (See chart 8, top panel.)
Personal care and service occupations grew 77 percent asa proportion of employment between 1910 and 2000, from 1.3percent to 2.4 percent. (See chart 8, bottom panel.) Employ-ment grew from 515,000 to 3,054,000. Most of the growth tookplace after 1970 and was among professional and personalservices attendants, an occupation that includes teachers’aides and childcare workers. Over the 90-year period, em-ployment of barbers, beauticians, and manicurists showedlittle growth, while that of porters and elevator operatorsdeclined.
Clerical and kindred workers
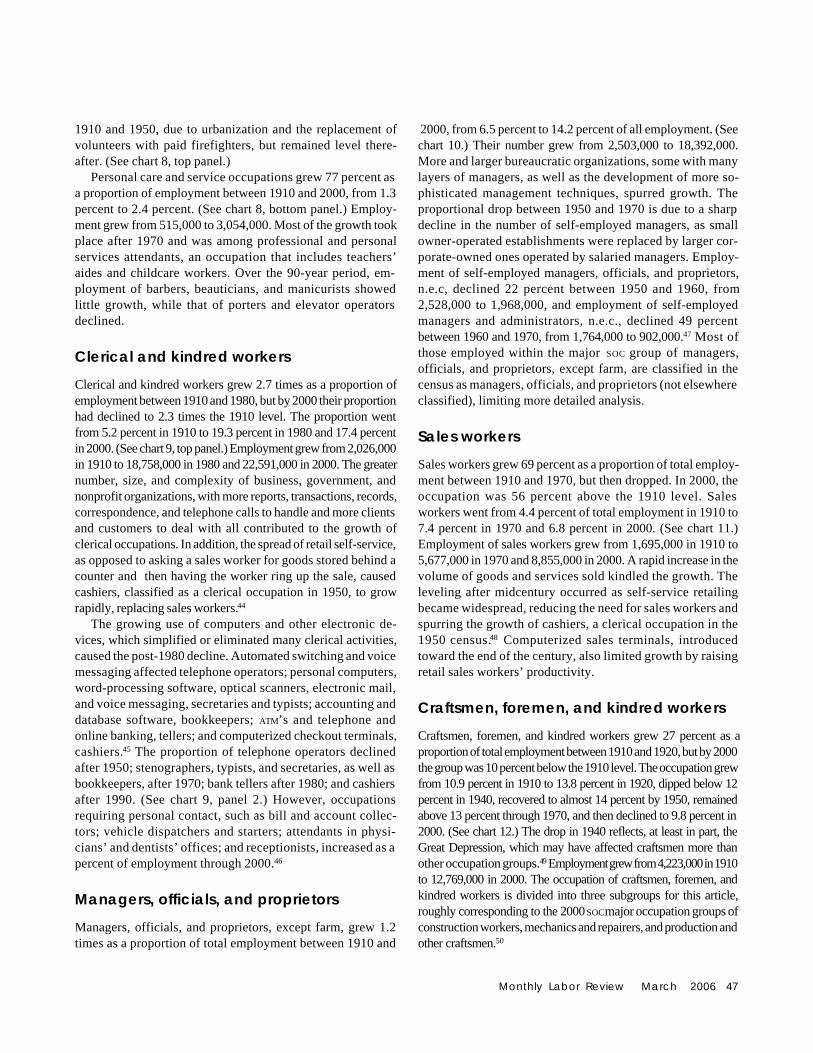
Clerical and kindred workers grew 2.7 times as a proportion ofemployment between 1910 and 1980, but by 2000 their proportionhad declined to 2.3 times the 1910 level. The proportion wentfrom 5.2 percent in 1910 to 19.3 percent in 1980 and 17.4 percentin 2000. (See chart 9, top panel.) Employment grew from 2,026,000in 1910 to 18,758,000 in 1980 and 22,591,000 in 2000. The greaternumber, size, and complexity of business, government, andnonprofit organizations, with more reports, transactions, records,correspondence, and telephone calls to handle and more clientsand customers to deal with all contributed to the growth ofclerical occupations. In addition, the spread of retail self-service,as opposed to asking a sales worker for goods stored behind acounter and then having the worker ring up the sale, causedcashiers, classified as a clerical occupation in 1950, to growrapidly, replacing sales workers.44
The growing use of computers and other electronic de-vices, which simplified or eliminated many clerical activities,caused the post-1980 decline. Automated switching and voicemessaging affected telephone operators; personal computers,word-processing software, optical scanners, electronic mail,and voice messaging, secretaries and typists; accounting anddatabase software, bookkeepers; ATM’s and telephone andonline banking, tellers; and computerized checkout terminals,cashiers.45 The proportion of telephone operators declinedafter 1950; stenographers, typists, and secretaries, as well asbookkeepers, after 1970; bank tellers after 1980; and cashiersafter 1990. (See chart 9, panel 2.) However, occupationsrequiring personal contact, such as bill and account collec-tors; vehicle dispatchers and starters; attendants in physi-cians’ and dentists’ offices; and receptionists, increased as apercent of employment through 2000.46
Managers, officials, and proprietors
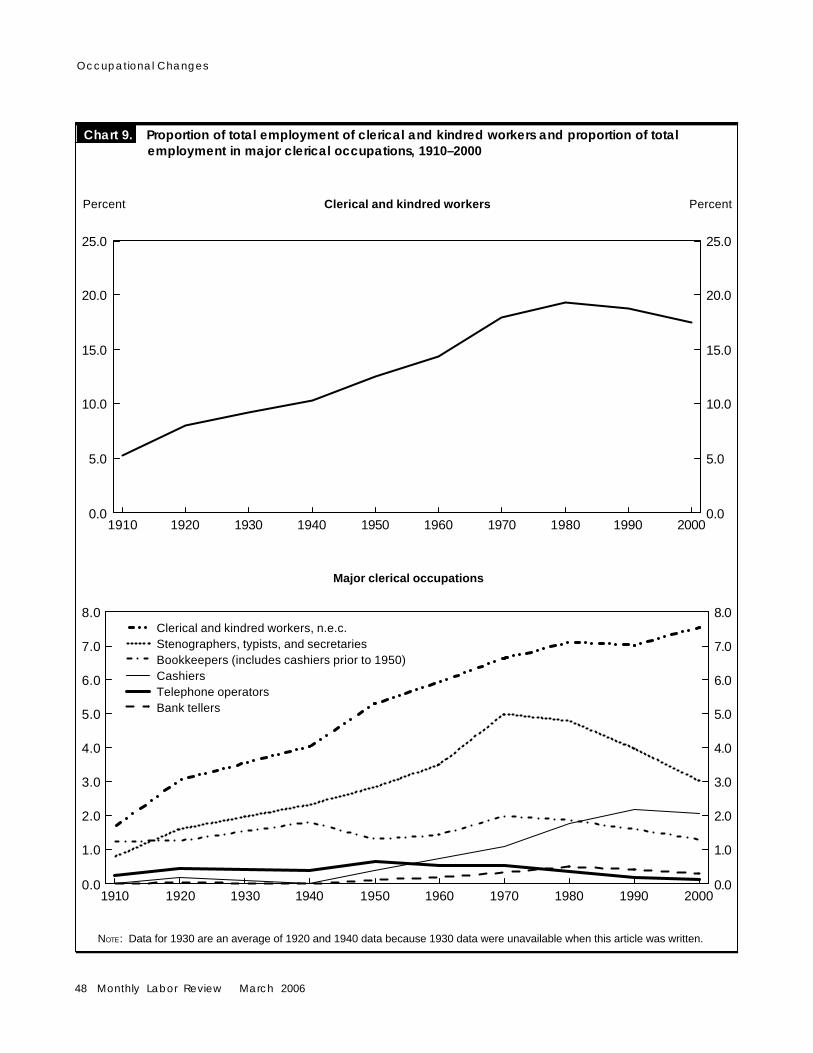
Managers, officials, and proprietors, except farm, grew 1.2times as a proportion of total employment between 1910 and
2000, from 6.5 percent to 14.2 percent of all employment. (Seechart 10.) Their number grew from 2,503,000 to 18,392,000.More and larger bureaucratic organizations, some with manylayers of managers, as well as the development of more so-phisticated management techniques, spurred growth. Theproportional drop between 1950 and 1970 is due to a sharpdecline in the number of self-employed managers, as smallowner-operated establishments were replaced by larger cor-porate-owned ones operated by salaried managers. Employ-ment of self-employed managers, officials, and proprietors,n.e.c, declined 22 percent between 1950 and 1960, from2,528,000 to 1,968,000, and employment of self-employedmanagers and administrators, n.e.c., declined 49 percentbetween 1960 and 1970, from 1,764,000 to 902,000.47 Most ofthose employed within the major SOC group of managers,officials, and proprietors, except farm, are classified in thecensus as managers, officials, and proprietors (not elsewhereclassified), limiting more detailed analysis.
Sales workers
Sales workers grew 69 percent as a proportion of total employ-ment between 1910 and 1970, but then dropped. In 2000, theoccupation was 56 percent above the 1910 level. Salesworkers went from 4.4 percent of total employment in 1910 to7.4 percent in 1970 and 6.8 percent in 2000. (See chart 11.)Employment of sales workers grew from 1,695,000 in 1910 to5,677,000 in 1970 and 8,855,000 in 2000. A rapid increase in thevolume of goods and services sold kindled the growth. Theleveling after midcentury occurred as self-service retailingbecame widespread, reducing the need for sales workers andspurring the growth of cashiers, a clerical occupation in the1950 census.48 Computerized sales terminals, introducedtoward the end of the century, also limited growth by raisingretail sales workers’ productivity.
Craftsmen, foremen, and kindred workers
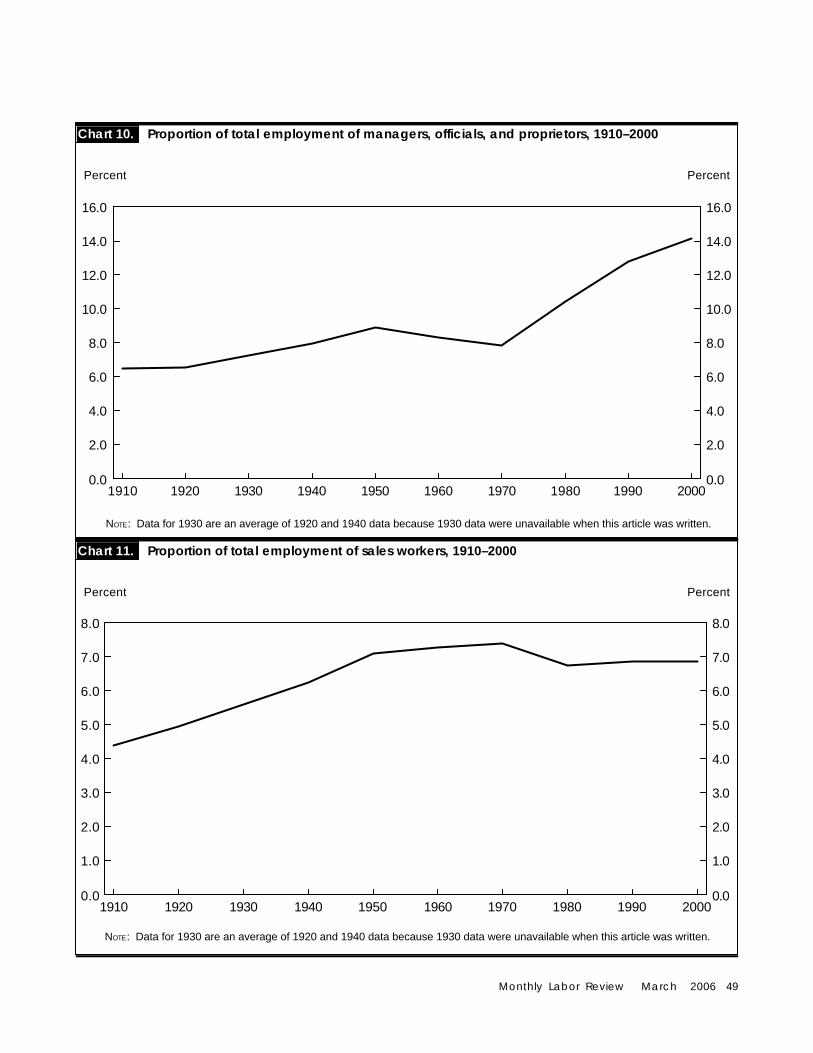
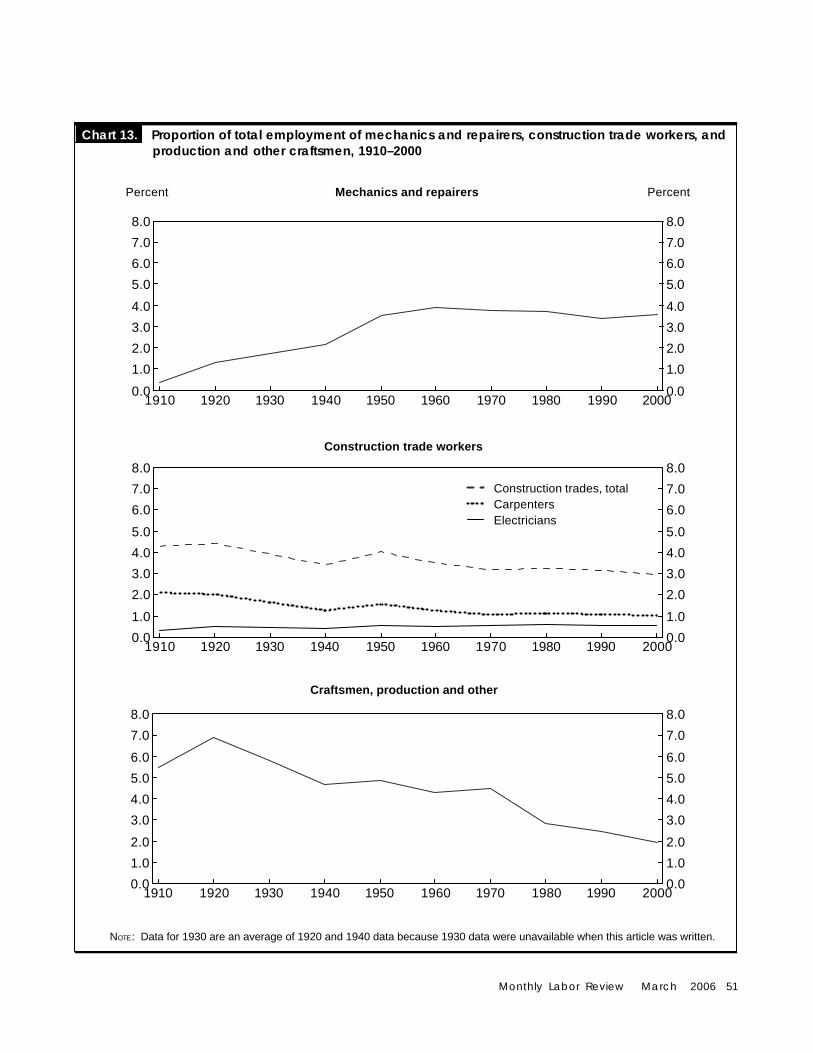
Craftsmen, foremen, and kindred workers grew 27 percent as aproportion of total employment between 1910 and 1920, but by 2000the group was 10 percent below the 1910 level. The occupation grewfrom 10.9 percent in 1910 to 13.8 percent in 1920, dipped below 12percent in 1940, recovered to almost 14 percent by 1950, remainedabove 13 percent through 1970, and then declined to 9.8 percent in2000. (See chart 12.) The drop in 1940 reflects, at least in part, theGreat Depression, which may have affected craftsmen more thanother occupation groups.49 Employment grew from 4,223,000 in 1910to 12,769,000 in 2000. The occupation of craftsmen, foremen, andkindred workers is divided into three subgroups for this article,roughly corresponding to the 2000 SOC major occupation groups ofconstruction workers, mechanics and repairers, and production andother craftsmen.50
48 Monthly Labor Review March 2006
Occupational Changes
Chart 9. Proportion of total employment of clerical and kindred workers and proportion of totalemployment in major clerical occupations, 1910–2000
Percent PercentClerical and kindred workers
Major clerical occupations
Stenographers, typiClerical and kindred workers, n.e.c.Stenographers, typists, and secretariesBookkeepers (includes cashiers prior to 1950)CashiersTelephone operatorsBank tellers
Telephone operators Cashiers
1910 1920 1930 1940 1950 1960 1970 1980 1990 20000.0
5.0
10.0
15.0
20.0
25.0
0.0
5.0
10.0
15.0
20.0
25.0
1910 1920 1930 1940 1950 1960 1970 1980 1990 20000.0
1.0
2.0
3.0
4.0
5.0
6.0
7.0
8.0
0.0
1.0
2.0
3.0
4.0
5.0
6.0
7.0
8.0
NOTE: Data for 1930 are an average of 1920 and 1940 data because 1930 data were unavailable when this article was written.
Monthly Labor Review March 2006 49
Chart 10. Proportion of total employment of managers, officials, and proprietors, 1910–2000
Percent Percent
1910 1920 1930 1940 1950 1960 1970 1980 1990 20000.0
2.0
4.0
6.0
8.0
10.0
12.0
14.0
16.0
0.0
2.0
4.0
6.0
8.0
10.0
12.0
14.0
16.0
NOTE: Data for 1930 are an average of 1920 and 1940 data because 1930 data were unavailable when this article was written.
Chart 11. Proportion of total employment of sales workers, 1910–2000
Percent Percent
NOTE: Data for 1930 are an average of 1920 and 1940 data because 1930 data were unavailable when this article was written.
1910 1920 1930 1940 1950 1960 1970 1980 1990 20000.0
1.0
2.0
3.0
4.0
5.0
6.0
7.0
8.0
0.0
1.0
2.0
3.0
4.0
5.0
6.0
7.0
8.0
50 Monthly Labor Review March 2006
Occupational Changes
Mechanics and repairers grew 10.9 times as a proportionof total employment between 1910 and 1950, but by 2000 theoccupation had dropped to 9.9 times the 1910 proportion. Itgrew from 0.32 percent to 3.91 percent in 1960 and then slippedto 3.58 percent in 2000. (See chart 13, top panel.) Employmentof mechanics and repairers grew from 140,000 in 1910 to2,520,000 in 1960 and 4,642,000 in 2000. A vast increase in theamount of machinery, all requiring maintenance and repair,drove the growth. There was greater mechanization of facto-ries, farms, offices, mines, service industries, and homes, allmade possible by the spread of a network of electric powerlines and generating facilities. The number of motor vehiclesand aircraft in use grew exponentially, as did machinery relatedto central heating and air-conditioning, telephone and broad-cast communications, computers, and many other technolo-gies. The proportion of mechanics and repairers declinedslightly after 1960 as the pace of mechanization slowed andas machinery and equipment became more reliable and easierto repair.
Construction workers declined 31 percent as a proportionof total employment between 1910 and 2000, from 4.3 percentto 3.0 percent. (see chart 13, middle panel.) Employment grewfrom 1,663,000 in 1910 to 3,837,000 in 2000. Most of the relativedecline in construction workers’ share of employment was
among carpenters. Electricians, the second-largest construc-tion occupation after carpenters in 2000, grew from 0.34percent of total employment in 1910 to 0.57 percent in 2000,with most growth between 1910 and 1920. (See chart 13,middle panel.)
Production and other craftsmen grew 26 percent as aproportion of total employment from 1910 to 1920, but thendeclined, dropping to 65 percent below the 1910 level. Thecategory grew from 5.5 percent in 1910 to 6.9 percent in 1920,but fell to 1.9 percent by 2000. (See chart 13, bottom panel.)Employment grew from 2,125,000 in 1910 to 3,435,000 in 1970,but slipped to 2,515,000 by 2000. Mechanization and automa-tion in the manufacturing and railroad industries, as well as inother industries; more efficient management; and, in the laterdecades, greater imports caused the decline.
Operatives
Operatives and kindred workers include operators of motorvehicles and fixed machinery; assemblers, inspectors, pack-ers, and related workers; and apprentices to craft workers. Inthe early years of the 20th century, the occupation alsoincluded many operators of horse-drawn vehicles. Opera-tives grew 28 percent as a proportion of total employment
Chart 12. Proportion of total employment of craftsmen, foremen, and kindred workers, 1910–2000
Percent Percent
NOTE: Data for 1930 are an average of 1920 and 1940 data because 1930 data were unavailable when this article was written.
1910 1920 1930 1940 1950 1960 1970 1980 1990 20000.0
2.0
4.0
6.0
8.0
10.0
12.0
14.0
16.0
0.0
2.0
4.0
6.0
8.0
10.0
12.0
14.0
16.0
Monthly Labor Review March 2006 51
Chart 13. Proportion of total employment of mechanics and repairers, construction trade workers, andproduction and other craftsmen, 1910–2000
NOTE: Data for 1930 are an average of 1920 and 1940 data because 1930 data were unavailable when this article was written.
Craftsmen, production and other
Construction trade workers
Mechanics and repairers PercentPercent
1910 1920 1930 1940 1950 1960 1970 1980 1990 20000.0
1.0
2.0
3.0
4.0
5.0
6.0
7.0
8.0
0.0
1.0
2.0
3.0
4.0
5.0
6.0
7.0
8.0
1910 1920 1930 1940 1950 1960 1970 1980 1990 20000.0
1.0
2.0
3.0
4.0
5.0
6.0
7.0
8.0
0.0
1.0
2.0
3.0
4.0
5.0
6.0
7.0
8.0
1910 1920 1930 1940 1950 1960 1970 1980 1990 20000.0
1.0
2.0
3.0
4.0
5.0
6.0
7.0
8.0
0.0
1.0
2.0
3.0
4.0
5.0
6.0
7.0
8.0Construction trades,
Construction trades, totalCarpentersElectricians
Electricians

52 Monthly Labor Review March 2006
Occupational Changes
between 1910 and 1950, but by 2000 their proportion hadfallen to 33 percent below the 1910 level. Operatives grewfrom 15.7 percent of total employment in 1910 to 20.1 percentin 1950, but then declined to 10.4 percent in 2000. (See chart14.) Employment grew from 6,079,000 in 1910 to 11,518,000 in1950, peaked at 14,346,000 in 1980, and declined to 13,544,000by 2000. The group is divided into three components foranalysis: road (motor and horse-drawn) vehicle operators,mine operatives and laborers, and production and otheroperatives.
Road vehicle operators grew 88 percent as a proportion oftotal employment between 1910 and 1960, but by 2000 thecategory was only 59 percent above the 1910 level.51 Roadvehicle operators grew from 1.9 percent of total employmentin 1910 to 3.6 percent in 1960, but then settled at about 3.0percent for the rest of the century. (See chart 14.) Employmentgrew from 735,000 in 1910 to 3,917,000 by 2000. The increasewas due to growth in the volume of goods moved by roadand in the distances the goods were shipped.
The employment drop to 641,000 and 1.5 percent of totalemployment in 1920 reflects the shift from horse-drawn tomotorized vehicles, which greatly increased driverproductivity.52 (The 1910 and 1920 censuses did not dis-tinguish clearly between operators of horse-drawn and
motorized vehicles.) The growth of truck registrations from10,000 in 1910 to 1.1 million in 1920 indicates the magnitude ofthe shift. So does the drop in employment of livery stablekeepers and managers from 35,000 to 11,000 over the sameperiod.53
Mine operatives and laborers declined 95 percent as aproportion of total employment between 1910 and 2000, from2.4 percent in the former year to 0.1 in the latter (see chart 14),while employment fell from 917,000 to 158,000. The sharpdecline was due to advances in mining technology and mech-anization and to the slower-than-average growth of miningindustry output.
Production and other operatives grew 32 percent as aproportion of total employment from 1910 to 1950, but by2000 was 53 percent below the 1910 level. (See chart 14.)Employment grew from 4,265,000 in 1910 to 8,829,000 in 1950,peaked at 11,010,000 in 1980, and dropped to 9,412,000 by2000. The trend largely reflects developments in mass pro-duction in manufacturing. In the early decades of the 20thcentury, mass production, which relied on considerablemechanization and the splitting of complex tasks into simpleones, required large numbers of operatives.54 Operativestended the machines used in rapidly growing continuous-process industries such as steel, paper, and chemicals; oper-
Chart 14. Proportion of total employment of operatives, 1910–2000
Percent Percent
Operatives, totalProduction and other
Operatives, totalProduction and other operativesRoad vehicle operatorsMine operatives and laborers
NOTE: Data for 1930 are an average of 1920 and 1940 data because 1930 data were unavailable when this article was written.
1910 1920 1930 1940 1950 1960 1970 1980 1990 20000.0
5.0
10.0
15.0
20.0
25.0
0.0
5.0
10.0
15.0
20.0
25.0

Monthly Labor Review March 2006 53
ated metal-fabricating, sewing, printing, textile, and othermachinery; and assembled and inspected motor vehicles and,later, refrigerators, radios, televisions, and many other prod-ucts.55 In nonmanufacturing industries, they operated laundryand drycleaning machinery and railroad switches and brakes,made and altered dresses and suits, and parked cars. Theproportional decline of operatives after 1950 reflects automa-tion in manufacturing, laundries, railroads, and other indus-tries; more efficient management; and, in the later decades ofthe 20th century, greater imports.
Laborers, except farm and mine
Laborers other than farm and mine laborers declined by 64percent as a proportion of total employment between 1910and 2000. During that span, these laborers’ share of employ-ment went from 10.4 percent to 3.7 percent, although theproportion peaked at 11.4 percent in 1920. (See chart 15.)Employment of the group grew from 4,035,000 in 1910 to4,972,000 in 1990, but dropped to 4,851,000 in 2000. Both moreefficient management and the mechanization of production,construction, and material-handling activities led to the de-cline. However, the proportion of gardeners, except farm, andgroundskeepers nearly tripled, from 0.26 percent to 0.7
percent, with most growth occurring after 1980. (See chart15.) Employment grew from 100,000 to 903,000. More publicand commercial buildings, highways, and recreation facilitiesrequiring gardening services, plus more extensive landscap-ing, stimulated the growth. Rising incomes also permittedhomeowners to do more extensive landscaping and lawn careand to hire workers for tasks formerly done by householdmembers. Employment of laborers, excluding gardeners, was3,900,000 in 2000, the same level as in 1910.
Private household workers
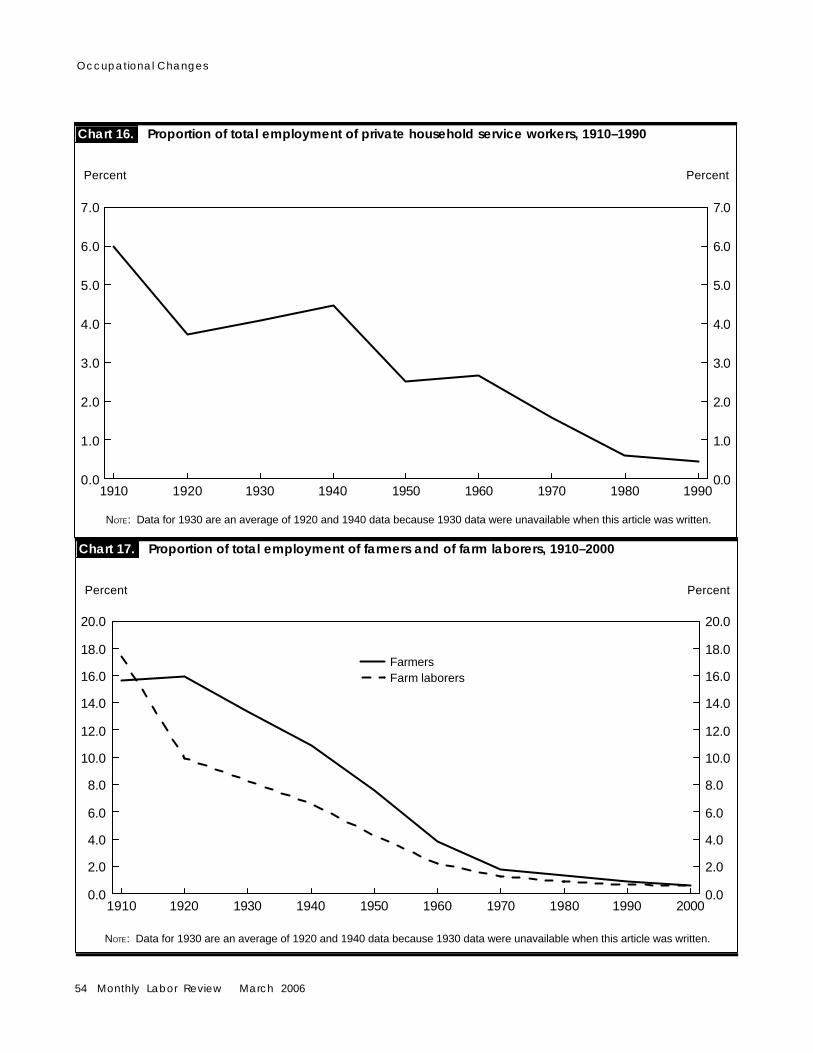
Private household workers fell 92 percent as a proportion oftotal employment, from 6.0 percent in 1910 to 0.45 percent in1990. (See chart 16.) Employment of these workers declinedfrom 2,319,000 to 523,000. (Due to changes in the occupationalclassification system used in the 2000 census, data for 2000 arenot available.56) The decline reflects changes in both demandand supply. The need for private household workers decreasedover the period as home production of goods and servicesshifted to manufacturing and service industries and ashousework became more mechanized. A greater proportion offood was prepared in food-processing plants, grocery stores,and restaurants; clothing increasingly was produced in
Chart 15. Proportion of total employment of laborers, except farm and mine, 1910–2000
Percent Percent
Laborers, except farm and mineLaborers, except gardeners and groundskeepersGardeners, except farm, and groundskeepers
Gardeners, except fa
NOTE: Data for 1930 are an average of 1920 and 1940 data because 1930 data were unavailable when this article was written.
1910 1920 1930 1940 1950 1960 1970 1980 1990 20000.0
2.0
4.0
6.0
8.0
10.0
12.0
0.0
2.0
4.0
6.0
8.0
10.0
12.0
54 Monthly Labor Review March 2006
Occupational Changes
Chart 16. Proportion of total employment of private household service workers, 1910–1990
Percent Percent
NOTE: Data for 1930 are an average of 1920 and 1940 data because 1930 data were unavailable when this article was written.
1910 1920 1930 1940 1950 1960 1970 1980 19900.0
1.0
2.0
3.0
4.0
5.0
6.0
7.0
0.0
1.0
2.0
3.0
4.0
5.0
6.0
7.0
Chart 17. Proportion of total employment of farmers and of farm laborers, 1910–2000
Percent Percent
FarmersFarm laborers
NOTE: Data for 1930 are an average of 1920 and 1940 data because 1930 data were unavailable when this article was written.
1910 1920 1930 1940 1950 1960 1970 1980 1990 20000.0
2.0
4.0
6.0
8.0
10.0
12.0
14.0
16.0
18.0
20.0
0.0
2.0
4.0
6.0
8.0
10.0
12.0
14.0
16.0
18.0
20.0
Monthly Labor Review March 2006 55
manufacturing industries and cleaned in service industries; andmore and more children were cared for in daycare centers. At thesame time, labor-saving technologies such as hot and coldrunning water, central heating, gas and electric stoves,refrigerators and freezers, clothes washers and dryers, vacuumcleaners, dishwashers, and wash-and-wear clothing madehousekeeping easier to perform.57 The supply of workers to thisoccupation also became more limited, particularly in the earlypart of the century, as outside employment opportunities forwomen—most of these workers were women—broadened,chiefly in clerical and service occupations.58
Farmers and farm laborers
The two occupation groups of farmers (including farm managers)and farm laborers (including foremen) combined declined 96percent as a proportion of total employment between 1910 and2000, from 33 percent to 1.2 percent. (See chart 17.) Employmentdeclined from 12,809,000 to 1,598,000 between the 2 years.59
Sharply rising farm productivity, together with limited appetitesfor farm products, caused the decline. In addition, rapid growthin demand for workers in other occupations, as well as higherearnings, encouraged the shift out of farming.
Farm mechanization, most notably the replacement ofhorses and mules with gasoline-powered tractors of growingpower and efficiency, greatly increased farm workers’ produc-tivity. So did improved fertilizers and pesticides, higher yieldvarieties of plants and breeds of animals, improved irrigationpractices, more efficient farm management, and farm consoli-dation. Near the end of the century, genetically modified cropsincreased yields, reduced pesticide usage, and increasedresistance to many pests and fungi. The proportion of farmlaborers dropped especially sharply from 1910 to 1920, as
people left for military service or factory work during WorldWar I and did not return. In addition, the 1920 census wasconducted on January 1; had it been conducted on April 15,a time of greater farm activity, a greater number of seasonalfarm laborers would have been reported.60
Despite declining farm employment over the 1910–2000period, agricultural output grew. Wheat production increased2.6 times, from 625 million bushels to 2,228 million bushels,and yield per acre tripled, from 13.7 bushels to 42.0 bushels.Corn production grew 2.5 times, from 2,852 million bushels to9,915 million bushels, with yield per acre growing 4 times,from 27.9 bushels to 136.9 bushels.61 However, these in-creases in output, while substantial, were much more modestthan increases in output in other sectors, such as manufac-turing and services. Still, from 1900 to 1997, the time requiredto cultivate an acre of wheat decreased from more than 2weeks to about 2 hours, while for an acre of corn, it declinedfrom 38 hours to 2 hours.
EVERY 2 YEARS, THE BUREAU ANALYZES historic employ-ment trends as part of its program of 10-year occupation andindustry employment projections. The Bureau projects thatmany of the long-term trends described in this article willcontinue into the 21st century.62 Professional and relatedoccupations and health service workers are projected toincrease their share of total employment between 2004 and2014. Construction occupations and installation, mainte-nance, and repair occupations are expected to remain aboutthe same proportion of total employment, while productionoccupations (roughly equivalent to production craftsmenand production-related operatives), office and administrativesupport occupations (roughly equivalent to clerical occu-pations), and agricultural managers and agricultural workersare projected to decline.
Notes1 See the November 2005 Review.
2 In the Bureau’s biennial projections, an industry-occupationmatrix is used to analyze occupations as a percentage of total employ-ment in each industry. (See Occupational Outlook Handbook, 2004–05, Bulletin 2570 (Bureau of Labor Statistics, March 2004), pp. 663–64; and Occupational Projections and Training Data, 2004–05,Bulletin 2572 (Bureau of Labor Statistics, March 2004), pp. 42–43;on the Internet at http://www.bls.gov/emp.)
3 Those with a numeric decline in employment have a staffingpattern decline of 70 percent or more.
4 On the Internet at http://www.ipums.org/. (See Steven Ruggles,Matthew Sobek, Trent Alexander, Catherine A. Fitch, Ronald Goeken,Patricia Kelly Hall, Miriam King, and Chad Ronnander, IntegratedPublic Use Microdata Series: Version 3.0 (Minneapolis, Minnesota
Population Center, 2004.)) IPUMS provides Census Bureau microdatadating back to 1850. The size of the microdata sample is either 1percent or 5 percent, depending upon the year.
5 In addition, the original Census Bureau data have both samplingand nonsampling errors.
6 An occupation category consists of a homogeneous group of occupa-tion titles. (See Alphabetical index of occupations and industries, 1950 Censusof Population, rev. ed. (U.S. Bureau of the Census, 1950), p. vi.)
7 The 1950 census did include three subgroups: engineers, naturalscientists, and mechanics and repairers.
8 See Standard Occupational Classification Manual, 2000(Executive Office of the President, Office of Management and Budget,2000).

56 Monthly Labor Review March 2006
Occupational Changes
9 Data in chart 1 on private household workers are for 1990,rather than 2000. In the 2000 census, the employment of privatehousehold workers cannot be determined, because those workers areincluded with workers having similar duties in cleaning, childcare, foodpreparation, or other service worker occupations. Therefore, thechange in private household workers’ employment over the 90-yearperiod cannot be calculated.
10 Of course, these shifts began well before 1910. For example,employment in the agricultural sector, roughly equivalent to farmoccupation employment, declined from 64.5 percent in 1850 to 32.1percent in 1910. Over the same period, employment in the goods-producing sector increased from 17.7 percent to 32.1 percent, andthat in the service-producing sector increased from 17.8 percent to35.9 percent. (See Michael Urquhart, “The employment shift toservices: where did it come from?” Monthly Labor Review, April 1984,pp. 15–22, especially table 1, p. 16.)
11 That is, their growth appears as a straight line in the charts that arepresented. Obviously, growth rates over the period need not be steady.
12 The group included SOC numbers 15–29–0000 in 2000. (SeeStandard Occupational Classification Manual, 2000 , p. xvi.)Accountants and auditors, however, a category classified as a businessand financial operations occupation in the 2000 SOC , also is discussedhere because it was classified as a professional, technical, and kindredoccupation in 1950.
13 See Greatest Engineering Achievements of the 20th Century(Washington, DC, National Academy of Engineering, 2006), on theInternet at http://www.greatachievements.org/.
14 Data are from the 1960–90 censuses and the 2000 Current Pop-ulation Survey (CPS). Computer programmers; computer systems analysts;and computer specialists, not elsewhere classified (n.e.c.), first appearedas titles of occupations in the 1960 census, within professional, technical,and kindred workers, n.e.c., and as Bureau of the Census occupations (withemployment data) in 1970. Special tabulations provide employment datafor 1960. (See Constance Bogh DiCesare, “Changes in the occupationalstructure of U.S. jobs,” Monthly Labor Review, March 1975, pp. 24–34,especially Table 2, p. 26; and John A. Priebe, Joan Heinkel, and StanleyGreene, 1970 Occupation and Industry Classification Systems in Terms ofTheir 1960 Occupation and Industry Elements, Technical Paper 26 (U.S.Department of Commerce, Bureau of the Census, 1972), especially table1, p. 19.)
15 Data on accountants for the 1910–40 period are from HistoricalStatistics of the United States, Colonial Times to 1970, BicentennialEdition, part 1 (U.S. Department of Commerce, Bureau of the Census,1975). Accountants and auditors are classified with business andfinancial operations occupations in 2000.
16 Greatest Engineering Achievements.
17 William C. Goodman, “The software and engineering industries:threatened by technological change?” Monthly Labor Review, August1996, pp. 37–45.
18 Healthcare workers, excluding attendants and practical nurses,increased 4.6 times, from 0.8 percent to 4.4 percent.
19 In the latter part of the century, home healthcare provided byhealthcare workers also grew rapidly.
20 David E. Kyvig, Daily Life in the United States, 1920–1940(Chicago, Ivan R. Dee, 2002).
21 See Anne Kahl and Donald Clark, “Employment in healthservices: long term trends and projections,” Monthly Labor Review,
August 1986, pp. 17–36; and David Hiles, “Health services: the realjobs machine,” Monthly Labor Review, November 1992, pp. 3–16.
22 Theodore Caplow, Louis Hicks, and Ben J. Wattenberg, The FirstMeasured Century: An Illustrated Guide to Trends in America, 1900–2000 (Washington, DC, AEI Press, 2001).
23 Personal interview with Dale C. Smith, Ph. D., chairman, Depart-ment of Medical History, U.S. University of the Health Services, Dec.8, 2004.
24 Caplow, Hicks, and Wattenberg, The First Measured Century.
25 Statistical Abstract of the United States: 2003 (U.S. CensusBureau, 2003). Data are based on the CPS.
26 At 9.1 percent, physicians and surgeons were the second-largestprofessional and technical occupation in 1910, but by 2000 they haddropped to 2.4 percent of all professional workers. Dentists andpharmacists remained a fairly steady proportion of total employmentthroughout the century.
27 The higher 1940 ratio may reflect the smaller-than-averageimpact of the Great Depression on the employment levels of lawyers.In 1940, the overall unemployment rate was 14.6 percent ( StatisticalAbstract of the United States, 1961 (U.S. Census Bureau, 1961).)
28 Richard L. Abel, American Lawyers (New York, Oxford Univer-sity Press, 1989); see especially pp. 123–26.
29 Federal laws include the Civil Rights Act of 1964, the AgeDiscrimination in Employment Act of 1967, the National Environ-mental Policy Act of 1969, and the Occupational Safety and HealthAct of 1970.
30 In the census, teachers, n.e.c. The only other category of teach-ers is college presidents, professors, and instructors. Teachers, n.e.c.,made up by far the largest professional occupation in 1910, at 36.4percent of all professional workers. By 2000, it was still the largest,but was only 16.4 percent of professional workers.
31 Thomas D. Snyder, ed., 120 Years of American Education: A StatisticalPortrait (Washington, DC, National Center for Education Statistics, 1993); seealso IES/NCES, “Youth Indicators, 2005: Trends in the Well-being of AmericanYouth, Indicator 11: Pupil/Teacher Ratios and Expenditures per Student,”table 11, on the Internet at http://nces.ed.gov/programs/youthindicators/.asp?PubPageNumber=11&ShowTablePage=TablesHTML/11.asp.
32 United States Summary: Population and Housing Unit Counts(U.S. Census Bureau, August 1993), table 2, on the Internet at http://www.census.gov/population/censusdata/table-2.pdf.
33 National and State Population Estimates: Annual PopulationEstimates 2000–2005 (U.S. Census Bureau, Dec. 21, 2005), on theInternet at http://www.census.gov/popest/states/NST-ann-est.html.
34 The percent change here is based on data for 5- to 19- year-olds,prorated for 5- to 18-year-olds.
35 Digest of Education Statistics Tables and Figures (NationalCenter for Education Statistics, Institute of Education Sciences, U.S.Department of Education, 2001), table 8, on the Internet at http://nces.ed.gov/programs/digest/d01/dt008.asp. Between 1910 and1940, the proportion of people aged 25 years and older with a highschool diploma increased from 13.5 percent to 24.5 percent.
36 Clergy declined from 7.3 percent to 1.3 percent of professionalsover the period.

Monthly Labor Review March 2006 57
37 The 2000 data include some workers classified as private house-hold workers in earlier years.
38 Health service workers grew 4 times as a percent of total employ-ment, from 0.39 percent to 1.95 percent. Their numbers grew from97,000 to 3,513,000. Practical nurses are classified with serviceworkers in the 1950 census, but with healthcare practitioners andtechnical occupations in the SOC. Data for service workers, n.e.c., arenot included in the components.
39 Gardeners, except farm, and groundskeepers are included withinlaborers, just as they are in the 1950 census classification.
40 Nationwide prohibition began on January 16, 1920, with the18th amendment to the Constitution, but State and local laws hadalready significantly affected the drinking of alcoholic beverages. Theamendment was repealed in 1934. (See Kyvig, Daily Life in the UnitedStates, pp. 3, 24, and 25.)
41 John A. Jakle and Keith A. Sculle, Fast food: roadside restaurantsin the automobile age (Baltimore, Johns Hopkins University Press,1999).
42 http://www.fns.usda.gov/cga/PressReleases/1999/PR-0060.htm.
43 Caplow, Hicks, and Wattenberg, The First Measured Century, pp.214–17.
44 In the 2000 SOC, cashiers are classified as sales workers.45 See Teresa L. Morisi, “Commercial banking transformed by
computer technology,” Monthly Labor Review, August 1996, pp. 30–36; and Michael J. Pilot, “ Occupational Outlook Handbook: a reviewof 50 years of change,” Monthly Labor Review, May 1999, pp. 8–26.
46 Data on attendants in physicians’ and dentists’ offices also areincluded in data on healthcare workers.
47 John Priebe, Changes between the 1950 and 1960 Occupationaland Industry Classifications (U.S. Bureau of the Census, July 1969).DiCesare, “Occupational structure of U.S. jobs,” cautions that part ofthe 1960–70 decline could be attributed to definitional changes.
48 See note 44.
49 See, for example, note 27.
50 Data for these three categories do not include foremen, n.e.c.The Census Bureau aggregated data for all foremen, so there was noway to allocate their employment to each of the categories. Craftsmenand kindred workers, n.e.c., also were not allocated. The occupation
of mechanics and repairers is a 1950 census group, roughly equivalentto installation, maintenance, and repair occupations in the 2000 SOC.
51 This group corresponds to motor vehicle operators in the 2000SOC.
52 Fourteenth Census of the United States taken in the Year 1920,Volume IV, Population 1920, Occupations (U.S. Bureau of the Census),p. 16.
53 Ibid., p. 39.
54 See Harold F. Williamson, The Growth of the American Economy(New York: Prentice-Hall, Inc., 1944), especially pp. 499–519.
55 See Kyvig, Daily Life in the United States, pp. 35–37, for adiscussion of Henry Ford’s role in developing mass production.
56 See Standard Occupational Classification Manual, 2000.
57 The First Measured Century, pp. 36–37, 98–99. The greaterlabor force participation rate of women in the latter part of thecentury did not appear to affect the decline in the number andproportion of private household service workers.
58 Between 1910 and 1950, the number of women employed inclerical occupations increased 5.5 times (by 3.8 million), while maleclerical workers increased 1.1 times. (See Historical Statistics of theUnited States, pp. 139, 140).
59 Employment of farmers declined from 15.6 percent of all em-ployment to 0.6 percent, from a level of 6,048,000 to 775,000.Employment of farm laborers declined from 17.4 percent to 0.6percent, or, numerically, from 6,761,000 to 823,000.
60 See Fourteenth Census, pp. 12, 13, 22–24. The 1910 census wasconducted on April 15. The Fourteenth Census also discusses thepossible overcount in the 1910 census of children aged 10–15 yearsreported as farm laborers. In the early years of the 20th century, alarge proportion of farm laborers were unpaid family workers.
61 See Track Records: United States Crop Production (U.S.Department of Agriculture, National Agricultural Statistics Service,April 2003), on the Internet at http://usda.mannlib.cornell.edu/data-sets/crops/96120/track03c.htm#all; and 2002 Census ofAgriculture—State Data: New York (U.S. Department of Agriculture,National Agricultural Statistics Service, no date), table 33, on theInternet at http://www.nass.usda.gov/census/census02/volume1/ny/st36_1_033_033.pdf.
62 Daniel E. Hecker, “Occupational employment projections to2014,” Monthly Labor Review, November 2005, pp. 70–101.