oceans graduate school characterisation of uwa superfine
TRANSCRIPT

1
Oceans Graduate School
Characterisation of UWA superfine silica sand
Release: 18844 Date: 25 September 2019
By: Shiao Huey Chow, Anamitra Roy, Manuel Herduin, Evelyn Heins, Louis
King, Britta Bienen, Conleth O’Loughlin, Christophe Gaudin, Mark Cassidy
Characterisation of UWA superfine silica sand Chow et al. 18844 September 2019
ii
Document information summary
Item Description
Client Name Centre for Offshore Foundation Systems
Client Contact
Date of issue 25/9/2019
Report title Characterisation of UWA superfine silica sand
Report number GEO 18844
Version Date of issue
Prepared Verified Comments
V0 26/11/2018 SHC First issue for information
V1 25/9/2019 SHC Second issue with new test results

Characterisation of UWA superfine silica sand Chow et al. 18844 September 2019
iii
TABLE OF CONTENTS
1 Introduction ............................................................................................................... 1
2 Index properties of UWA SF silica sand .................................................................... 1
3 Permeability of UWA SF silica sand .......................................................................... 3
4 Consolidation characteristics of UWA SF silica sand ................................................. 5
5 Shear strength parameters of UWA SF Silica Sand ................................................... 8
5.1 Direct shear test ................................................................................................ 8
5.2 Direct simple shear test ..................................................................................... 9
5.3 Triaxial test .......................................................................................................11
6 Stress-dilatancy relationship of UWA SF sand .........................................................19
7 Stiffness parameter ..................................................................................................22
8 Conclusion ...............................................................................................................23
Acknowledgements ..........................................................................................................23
References ......................................................................................................................23
Appendix 1 Manufacturer specification of UWA SF silica sand .........................................26
Appendix 2 SEM and EDS of UWA SF Silica Sand ..........................................................27

Characterisation of UWA superfine silica sand Chow et al. 18844 September 2019
iv
LIST OF TABLES
Table 1 Index properties of UWA SF sand ............................................................................ 2 Table 2 Consolidation parameters and permeability determined from Rowe cell tests .......... 3 Table 3 Sand permeability determined from triaxial tests ...................................................... 3 Table 4 Sand permeability at various relative densities determined from constant head permeability tests .................................................................................................................. 4 Table 5 Compression parameters established from oedometer tests conducted at TUHH .... 5 Table 6 Direct shear test program and results conducted at Monash University.................... 8 Table 7 DSS test program and results ................................................................................ 10 Table 8 Triaxial test program and results conducted at UWA .............................................. 13 Table 9 Triaxial test program and results conducted at TUHH ............................................ 14 Table 10 Summary of Bolton’s fitting parameters calibrated through different tests ............. 20 Table 11 Summary of fitted parameters using different stress-dilatancy frameworks .......... 22
LIST OF FIGURES
Figure 1 Particle size distribution curves of UWA SF silica sand ........................................... 2 Figure 2 Grain shape of UWA SF silica sand examined through SEM .................................. 2 Figure 3 Permeability of UWA SF silica sand measured using triaxial and Rowe cell tests ... 4 Figure 4 Variation of permeability of UWA SF silica sand with relative density measured through constant head permeability tests .............................................................................. 4 Figure 5 Oedometer test tests results conducted at TUHH : (a) loose sand; (b) dense sand . 6 Figure 6 Rowe cell consolidation tests results: (a) compression curve; (b) coefficient of volume compressibility; (c) coefficient of consolidation profiles .......................................................... 7 Figure 7 Direct shear test results conducted at Monash University: (a) σ′vc < 150 kPa; (b) (a) σ′vc > 150 kPa ....................................................................................................................... 9 Figure 8 DSS test results for (a) dense sand (Dr ~ 95%); (b) medium sand (Dr ~ 55%) ....... 11 Figure 9 Triaxial tests conducted at UWA : (a) CIUC tests; (b) CKUC tests ........................ 15 Figure 10 Triaxial test (CIDC) results conducted at TUHH: (a) loose sand; (b) dense sand 15 Figure 11 CSL in (a) q-p′ plane; and (b) ν-ln p′ plane .......................................................... 16 Figure 12 Critical stress ratio, M established from peak dilatancy-peak friction relationship 17 Figure 13 Typical end of test photos of specimens with formation of rupture plane ............. 18 Figure 14 CSL in power-law form ........................................................................................ 18 Figure 15 Calibration of Bolton’s stress dilantancy parameters: (a) α; (b) β; (c) Q and R; and (d) Q using R = 1 ................................................................................................................ 20 Figure 16 Stress-dilatancy of loose SF sand established through other frameworks ........... 21 Figure 17 Normalised maximum shear modulus with normalised mean effective stress profile ........................................................................................................................................... 22

Characterisation of UWA superfine silica sand Chow et al. 18844 September 2019
1
1 Introduction UWA superfine silica (SF) sand is one of the most investigated sand at Centre for Offshore Foundation Systems (COFS). The UWA SF sand is commercially available from Sibelco Australia Limited, with the manufacturer specification provided in Appendix 1. Although the sand has been used extensively at COFS, there has been no systematic effort in characterising the sand with different set of soil parameters being reported by different investigators over the years. This report summarises a comprehensive laboratory investigation to characterise the UWA SF silica sand, which include basic index properties, permeability, consolidation and shear strength tests. This would provide consistent reporting of the UWA SF silica sand properties in the future, and also a valuable database for numerical model parameter calibration and validation purpose.
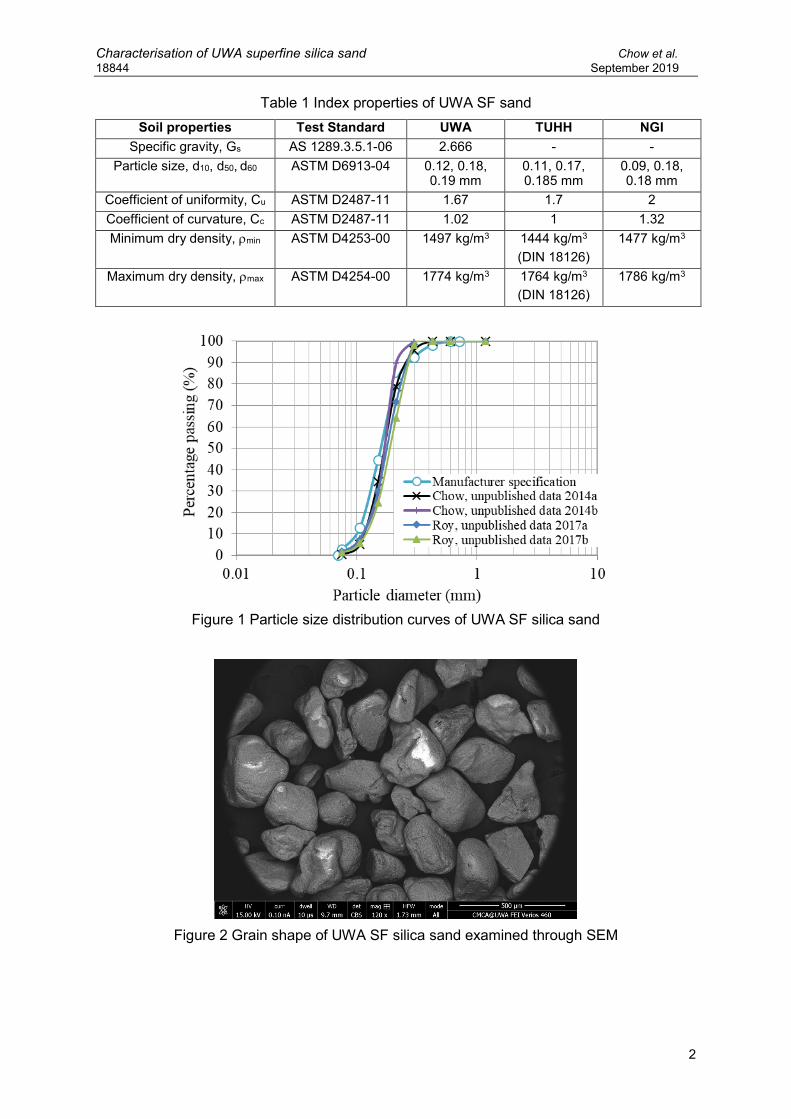
2 Index properties of UWA SF silica sand The index properties of the UWA SF silica sand were determined using particle size distribution tests, specific gravity tests and minimum and maximum density tests. Table 1 lists these soil properties, and also the corresponding test standards used in the investigation. The UWA SF silica sand has a specific gravity of 2.67 and minimum and maximum dry densities of 1497 and 1774 kg/m3 respectively. The minimum and maximum dry densities have seen some variation in previous studies (e.g. Lehane et al. 2005; Teh et al. 2006; Xu 2007) due to the difference in the Test Standard adopted and the use of a modified test apparatus. Previous studies had adopted AS 1289.5.5.1 using a modified mould, which is much smaller in size (0.4 L instead of 1L mould). Similar variation in minimum and maximum densities using different Test Standards is also reported in Blaker et al. (2015).
The particle size distribution (PSD) curves of the sand are illustrated in Figure 1, which shown consistent test results between two different investigators spanning across 2014 to 2017 (Chow’s unpublished data, 2014; Roy’s unpublished data, 2017). Averaging these results, the sand has a mean size, d50 of approximately 0.17 mm and can be classified as poorly graded sand (SP) according to the Unified Soil Classification System (USCS) system. The UWA SF silica sand is also observed to be sub-rounded to sub-angular in grain shape, as examined through scanning electron microscope imaging (SEM) shown in Figure 2. Additional SEM of the sand was also undertaken in combination with energy-dispersive X-ray spectroscopy (EDS) at Monash University, which provided an indication of the sand mineralogy. Results from EDS confirmed that the majority of grains were silica (SiO2); however, a trace amount of denser grains consisting of titanium, iron, and oxygen were also observed (King et al. 2018 and more details in Appendix 2). Also included in Table 1 for comparison are recent classification tests conducted at Hamburg University of Technology (TUHH) and Norwegian Geotechnical Institute (NGI).
Characterisation of UWA superfine silica sand Chow et al. 18844 September 2019
2
Table 1 Index properties of UWA SF sand Soil properties Test Standard UWA TUHH NGI
Specific gravity, Gs AS 1289.3.5.1-06 2.666 - - Particle size, d10, d50, d60 ASTM D6913-04 0.12, 0.18,
0.19 mm 0.11, 0.17, 0.185 mm
0.09, 0.18, 0.18 mm
Coefficient of uniformity, Cu ASTM D2487-11 1.67 1.7 2 Coefficient of curvature, Cc ASTM D2487-11 1.02 1 1.32 Minimum dry density, ρmin ASTM D4253-00 1497 kg/m3 1444 kg/m3
(DIN 18126) 1477 kg/m3
Maximum dry density, ρmax ASTM D4254-00 1774 kg/m3 1764 kg/m3 (DIN 18126)
1786 kg/m3
Figure 1 Particle size distribution curves of UWA SF silica sand
Figure 2 Grain shape of UWA SF silica sand examined through SEM
Characterisation of UWA superfine silica sand Chow et al. 18844 September 2019
3
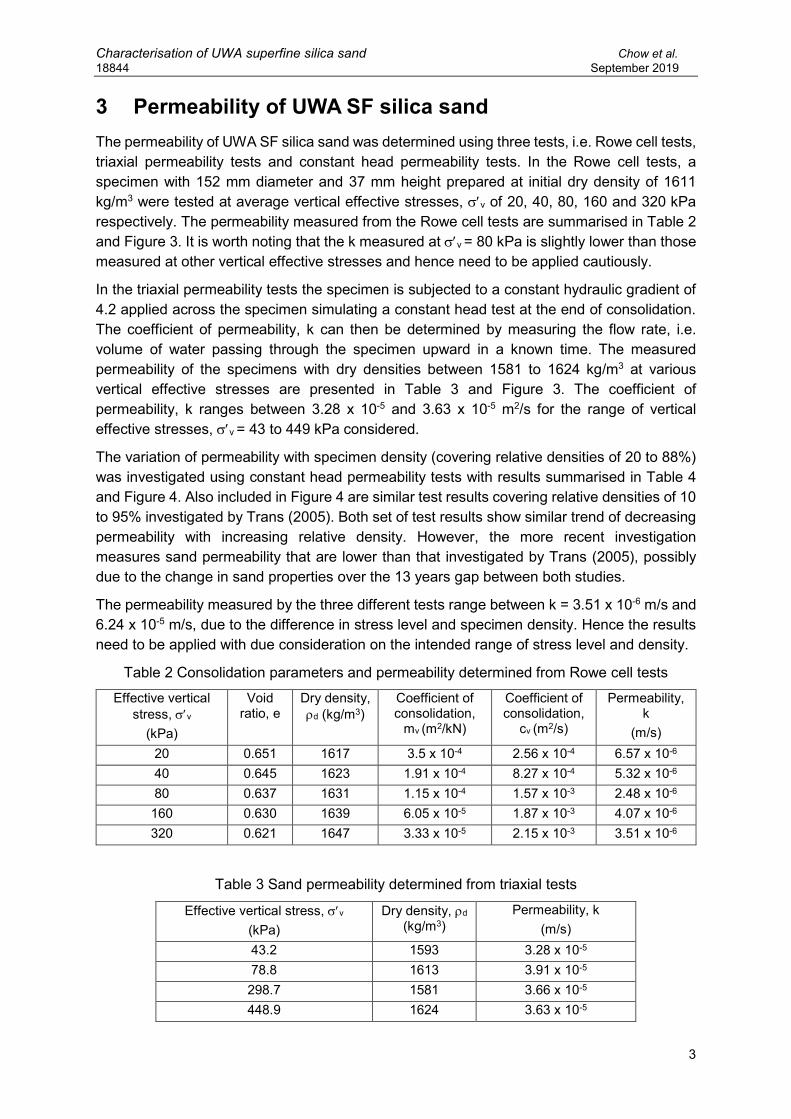
3 Permeability of UWA SF silica sand The permeability of UWA SF silica sand was determined using three tests, i.e. Rowe cell tests, triaxial permeability tests and constant head permeability tests. In the Rowe cell tests, a specimen with 152 mm diameter and 37 mm height prepared at initial dry density of 1611 kg/m3 were tested at average vertical effective stresses, σ′v of 20, 40, 80, 160 and 320 kPa respectively. The permeability measured from the Rowe cell tests are summarised in Table 2 and Figure 3. It is worth noting that the k measured at σ′v = 80 kPa is slightly lower than those measured at other vertical effective stresses and hence need to be applied cautiously.
In the triaxial permeability tests the specimen is subjected to a constant hydraulic gradient of 4.2 applied across the specimen simulating a constant head test at the end of consolidation. The coefficient of permeability, k can then be determined by measuring the flow rate, i.e. volume of water passing through the specimen upward in a known time. The measured permeability of the specimens with dry densities between 1581 to 1624 kg/m3 at various vertical effective stresses are presented in Table 3 and Figure 3. The coefficient of permeability, k ranges between 3.28 x 10⁻⁵ and 3.63 x 10⁻⁵ m2/s for the range of vertical effective stresses, σ′v = 43 to 449 kPa considered.
The variation of permeability with specimen density (covering relative densities of 20 to 88%) was investigated using constant head permeability tests with results summarised in Table 4 and Figure 4. Also included in Figure 4 are similar test results covering relative densities of 10 to 95% investigated by Trans (2005). Both set of test results show similar trend of decreasing permeability with increasing relative density. However, the more recent investigation measures sand permeability that are lower than that investigated by Trans (2005), possibly due to the change in sand properties over the 13 years gap between both studies.
The permeability measured by the three different tests range between k = 3.51 x 10⁻⁶ m/s and 6.24 x 10⁻⁵ m/s, due to the difference in stress level and specimen density. Hence the results need to be applied with due consideration on the intended range of stress level and density.
Table 2 Consolidation parameters and permeability determined from Rowe cell tests
Effective vertical stress, σ′v
(kPa)
Void ratio, e
Dry density, ρd (kg/m3)
Coefficient of consolidation,
mv (m2/kN)
Coefficient of consolidation,
cv (m2/s)
Permeability, k
(m/s) 20 0.651 1617 3.5 x 10⁻⁴ 2.56 x 10⁻⁴ 6.57 x 10⁻⁶ 40 0.645 1623 1.91 x 10⁻⁴ 8.27 x 10⁻⁴ 5.32 x 10⁻⁶ 80 0.637 1631 1.15 x 10⁻⁴ 1.57 x 10⁻³ 2.48 x 10⁻⁶ 160 0.630 1639 6.05 x 10⁻⁵ 1.87 x 10⁻³ 4.07 x 10⁻⁶ 320 0.621 1647 3.33 x 10⁻⁵ 2.15 x 10⁻³ 3.51 x 10⁻⁶
Table 3 Sand permeability determined from triaxial tests
Effective vertical stress, σ′v
(kPa) Dry density, ρd
(kg/m3) Permeability, k
(m/s) 43.2 1593 3.28 x 10⁻⁵ 78.8 1613 3.91 x 10⁻⁵ 298.7 1581 3.66 x 10⁻⁵ 448.9 1624 3.63 x 10⁻⁵

Characterisation of UWA superfine silica sand Chow et al. 18844 September 2019
4
Table 4 Sand permeability at various relative densities determined from constant head permeability tests
Relative density
(%) Dry density, ρd
(kg/m3) Permeability, k
(m/s) 19.9 1545 6.24 x 10⁻⁵ 27.0 1563 5.58 x 10⁻⁵ 40.1 1597 4.21 x 10⁻⁵ 63.1 1661 3.63 x 10⁻⁵ 78.0 1705 3.13 x 10⁻⁵ 88.1 1736 2.93 x 10⁻⁵
Figure 3 Permeability of UWA SF silica sand measured using triaxial and Rowe cell tests
Figure 4 Variation of permeability of UWA SF silica sand with relative density measured
through constant head permeability tests
Characterisation of UWA superfine silica sand Chow et al. 18844 September 2019
5
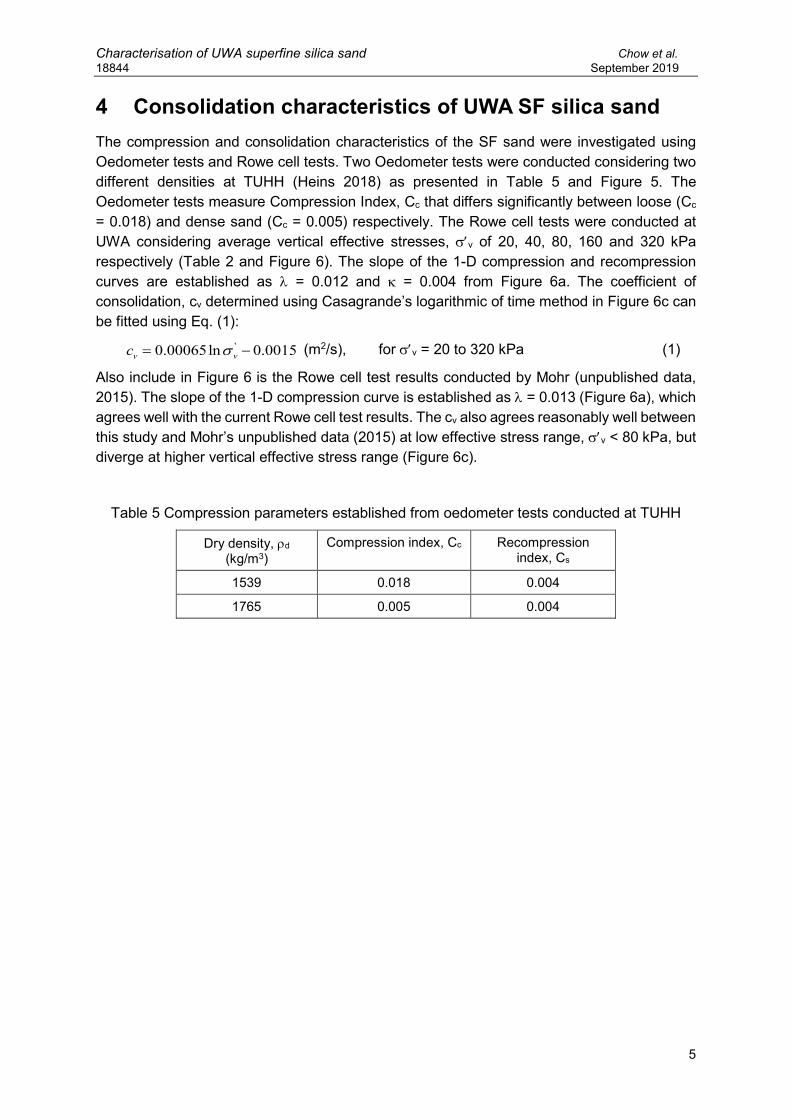
4 Consolidation characteristics of UWA SF silica sand The compression and consolidation characteristics of the SF sand were investigated using Oedometer tests and Rowe cell tests. Two Oedometer tests were conducted considering two different densities at TUHH (Heins 2018) as presented in Table 5 and Figure 5. The Oedometer tests measure Compression Index, Cc that differs significantly between loose (Cc = 0.018) and dense sand (Cc = 0.005) respectively. The Rowe cell tests were conducted at UWA considering average vertical effective stresses, σ′v of 20, 40, 80, 160 and 320 kPa respectively (Table 2 and Figure 6). The slope of the 1-D compression and recompression curves are established as λ = 0.012 and κ = 0.004 from Figure 6a. The coefficient of consolidation, cv determined using Casagrande’s logarithmic of time method in Figure 6c can be fitted using Eq. (1):
'0.00065ln 0.0015v vc σ= − (m2/s), for σ′v = 20 to 320 kPa (1)
Also include in Figure 6 is the Rowe cell test results conducted by Mohr (unpublished data, 2015). The slope of the 1-D compression curve is established as λ = 0.013 (Figure 6a), which agrees well with the current Rowe cell test results. The cv also agrees reasonably well between this study and Mohr’s unpublished data (2015) at low effective stress range, σ′v < 80 kPa, but diverge at higher vertical effective stress range (Figure 6c).
Table 5 Compression parameters established from oedometer tests conducted at TUHH
Dry density, ρd (kg/m3)
Compression index, Cc Recompression index, Cs
1539 0.018 0.004
1765 0.005 0.004

Characterisation of UWA superfine silica sand Chow et al. 18844 September 2019
6
Figure 5 Oedometer test tests results conducted at TUHH : (a) loose sand; (b) dense sand

Characterisation of UWA superfine silica sand Chow et al. 18844 September 2019
7
Figure 6 Rowe cell consolidation tests results: (a) compression curve; (b) coefficient of
volume compressibility; (c) coefficient of consolidation profiles

Characterisation of UWA superfine silica sand Chow et al. 18844 September 2019
8
5 Shear strength parameters of UWA SF Silica Sand The shear strength parameters, i.e. friction angles and critical state parameters were determined here using direct shear (DS), direct simple shear (DSS) and triaxial (TX) tests. The peak and critical friction angles were determined under all three conditions. The critical state parameters (M, Γ, λ) were determined from the triaxial tests based on several frameworks (Roscoe et al. 1958; Atkinson & Bransby 1978; Nova 1982) in Section 5.3.1. The stress-dilatancy relationship of the sand was also assessed using several framework (Bolton 1986; Nova 1982, Rowe 1962) in Section 6.
5.1 Direct shear test A recent direct shear test (DS) study was conducted by King (2019) at Monash University which considered very dense UWA SF sand (Dr = 88 to 98%) at normal stress range between 21 and 400 kPa. The DS test results are presented in Figure 7 and summarised in Table 6. Table 6 lists the specimen relative density at the end of consolidation, Dr(c), relative density at peak stress, Dr(p), preshear vertical effective stress, σ′vc, peak shear stress, τp, peak friction angle, φ′p(DS), peak dilation rate, (dδv/dδh)p, peak dilation angle, ψp, shear stress at critical state, τcs, and critical state friction angle, φ′cs(DS) for each test.
The average critical state friction angle is established as φ′cs(DS) = 33.1°, which is higher than that reported by Lehane & Liu (2012), i.e. φ′cs(DS) = 30°. However, φ′cs(DS) established through direct shear tests is expected to be higher (e.g. 3° as discussed in Bolton (1987)) than that established through triaxial compression tests (φ′cs(TX) = 31.9°, section 5.3.1). In addition, the properties of the sand may have changed since the Lehane & Liu's studies in 2012. Hence the φ′cs(DS) = 33.1° recently established by King (2019) appears to be reliable.
Table 6 Direct shear test program and results conducted at Monash University
Test No
Dr(c) (%)
Dr(p) (%)
σ′vc (kPa)
τp (kPa)
φ′p(DS) (°)
(dδv/dδh)p ψ p (°)
τcs (kPa)
φcs(DS) (°)
1 98.1 95.2 21.02 23.79 48.5 0.258 14.5 13.74 33.2
2 90.0 86.2 41.12 35.86 41.1 0.187 10.6 27.46 33.7
3 93.9 91.4 81.00 71.33 41.4 0.195 11.0 53.56 33.5
4 91.7 88.0 101.18 93.51 42.8 0.212 12.0 64.42 32.5
5 97.3 92.7 121.18 113.92 43.2 0.224 12.6 76.50 32.3
6 94.0 91.0 199.88 180.05 42.0 0.211 11.9 138.61 34.74
7 91.7 87.0 301.09 281.53 43.1 0.254 14.3 185.12 31.58
8 87.8 81.9 401.12 337.24 40.1 0.206 11.7 241.36 31.04

Characterisation of UWA superfine silica sand Chow et al. 18844 September 2019
9
Figure 7 Direct shear test results conducted at Monash University: (a) σ′vc < 150 kPa; (b) (a)
σ′vc > 150 kPa
5.2 Direct simple shear test Direct simple shear (DSS) monotonic tests were performed using the Illinois multi-directional cyclic Direct Simple Shear (I-mcDSS) apparatus at the University of Illinois (Herduin 2019). These dry drained tests (constant vertical effective stress) considered five different vertical effective stresses (σ′vc = 25, 50, 100, 200, 500 kPa) and two different densities (Dr = 55% and 95%). The specimen was prepared using dry pluviation technique with a diameter of 101.6 mm and a height of 19.05 mm. The specimen was confined laterally by 26 metal annular stacked rings, coated with air-dry MoS2 (molybdenum disulfide) ensuring low ring friction. The shear stresses were applied to the soil specimen by rigid porous plates with rough surfaces. The specimens were sheared at a rate of 0.05 mm/s.
The DSS test results are presented in Figure 8. Assuming that the horizontal plane is the plane of maximum stress obliquity, the friction angle is determined as:
'vc
tan φ =στ (2)
Where τ is the measured shear stress and σ′vc is the applied vertical effective stress. The interpreted test results for the ten DSS tests are summarised in Table 7, which lists the specimen relative density at the end of consolidation, Dr(c), relative density at peak stress, Dr(p), preshear vertical effective stress, σ′vc, peak shear stress, τp, peak friction angle, φ′p(DSS), peak dilation rate, (dεv/dεs)p, peak dilation angle, ψp, shear stress at critical state, τcs, and critical

Characterisation of UWA superfine silica sand Chow et al. 18844 September 2019
10
state friction angle, φ′cs(DSS) for each test. The average critical state friction angle is established as φ′cs(DSS) = 32.8°. However, the two DSS tests at the lowest σ′vc = 25 kPa are observed to produce much higher φ′cs(DSS) as compared to other tests conducted at higher σ′vc. Hence if the two tests are excluded, the average critical state friction angle is established as φ′cs(DSS) = 31.6°.
Other than the drained tests in Figure 8, the same series of DSS monotonic tests were repeated under undrained condition. DSS cyclic multi-directional tests were also conducted using the same I-mcDSS device (Herduin 2019). The cyclic tests were conducted strain-controlled under drained conditions at constant vertical effective stress of 50 kPa considering two different densities (Dr = 55% and 95%). These tests are excluded in the report for brevity.
Table 7 DSS test program and results
Test No
Dr(c) (%) Dr(p) (%) σ′vc
(kPa) τp
(kPa) φp(DSS)
(°) (dεv/dεs) p ψ p
(°) τcs
(kPa) φcs(DSS)
(°)
1 96.8 87.2 25 23.6 43.4 -0.324 17.9 19.8 38.4
2 95.2 85.7 50 37.7 37.0 -0.231 13.0 30.4 31.3
3 96.8 88.4 100 74.7 36.8 -0.208 11.7 61.6 31.6
4 97.9 89.5 200 133.3 33.7 -0.187 10.6 114.6 29.8
5 102.9 96.4 500 337.7 34.0 -0.162 9.2 317.7 32.4
6 51.9 49.4 25 19.7 38.3 -0.084 4.8 18.5 36.5
7 55.4 51.3 50 32.7 33.2 -0.091 5.2 32.2 32.8
8 60.8 56.4 100 65.4 33.2 -0.090 5.1 65.0 33.0
9 59.6 60 200 118.8 30.7 -0.051 2.9 118.7 30.7
10 70.6 72.1 500 305.3 31.4 -0.081 4.6 304.8 31.4

Characterisation of UWA superfine silica sand Chow et al. 18844 September 2019
11
Figure 8 DSS test results for (a) dense sand (Dr ~ 95%); (b) medium sand (Dr ~ 55%)
5.3 Triaxial test Triaxial tests were conducted at two different laboratories (UWA and TUHH) considering different sample preparation techniques and test conditions. At UWA, six triaxial tests were conducted using the UWA in-house triaxial test system. Selected tests were instrumented with a pair of bender elements for the measurement of maximum shear modulus, Gmax (see Section 7). Triaxial specimens with 150 mm height and 70 mm diameter were prepared using two different techniques, i.e. dry pluviation or wet pluvation. Majority of the specimens were prepared using wet pluviation as the technique was found to closely replicate the behaviour of insitu specimen as compared to other methods such as dry pluvation and moist tamping techniques (Vaid et al. 1999; Yamamuro & Wood 2004; Murthy et al. 2007). Selected specimens were prepared using dry pluviation to model similar soil fabric as for the centrifuge test specimens at COFS for numerical validation purpose. The specimen was water-flushed then saturated at a back-pressure of 500 kPa until the pore pressure coefficient, B > 0.95. The specimen was subsequently isotropically or anisotropically (using Ko = 0.5) consolidated to the vertical effective confining pressure, σ′vc as specified in the test program. On reaching the prescribed σ′vc, permeability tests were conducted on selected test specimens. The specimen was then sheared in drained compression under a constant axial strain rate of 0.1 mm/min until they achieved critical state.

Characterisation of UWA superfine silica sand Chow et al. 18844 September 2019
12
The triaxial test program and results are summarised in Table 8. Six monotonic constant-rate of strain compression triaxial tests were conducted considering the following variables:
• preshear vertical effective stresses, σ′vc (50 to 1000 kPa) • relative density, Dr (37 to 89%) • stress path (CIDC, CKDC)
Table 8 lists the specimen void ratio, ec and relative density at the end of consolidation, Dr(c), relative density at peak stress, Dr(p), preshear vertical effective stress, σ′vc, peak mean effective stress, p´p, peak deviator stress, qp, peak friction angle, φ′p(TX), peak dilation rate, (dεv/dεs)p, peak dilation angle, ψp, mean effective stress at critical state, p´cs, deviator stress at critical state, qcs, critical stress ratio, M, critical state friction angle, φ′cs(TX) and void ratio at at critical state, ecs. The tests are identified as CIDCn_x, where ‘CI’ denotes the stress path – ‘CI’ for isotropically consolidated, ‘CK’ for Ko consolidated; ‘D’ denotes the drainage condition – ‘D’ for drained; and ‘C’ denotes compression tests; ‘n’ denotes the preshear vertical effective stresses, σ′vc and ‘n’ denotes the sand density where ‘L’ for loose and ‘D’ for dense.
Other than the tests in Table 8, a series of CKUC tests were also conducted on dense samples at a fixed σ′vc = 50 kPa in a separate investigation on cavitation potential of the SF sand (Tedja 2018). In addition, selected isotropically consolidated extension tests were also conducted at UWA and Furgo Wallingford (Roy et al. 2018). These tests are excluded here for brevity.
At TUHH, six CIDC tests were conducted by considering two sand relative densities (Dr = 32 and 88%) at three preshear vertical effective stresses, σ′vc (50, 100 and 200 kPa) using wet pluviation specimen preparation technique. The test results are summarised in Table 9.
The stress-strain curves of the triaxial tests listed in Table 8 and Table 9 are presented in Figure 9 and Figure 10 respectively. Some of the tests failed to achieve volume constancy at the end of testing (e.g. CKDC100_L in Figure 9b and all three tests in Figure 10a), and hence excluded from the determination of the critical state parameters for the SF sand.

Characterisation of UWA superfine silica sand Chow et al. 18844 September 2019
13
Table 8 Triaxial test program and results conducted at UWA
All tests was conducted at a back pressure of 500 kPa (except CKDC50_D) and sheared at 0.1 mm/min 1 DP for dry pluviation and WP for wet pluviation specimen preparation technique 2 Excluded from critical state parameter determination due to failure to achieve volume constancy at the end of test 3 Tests conducted at a back pressure of 400 kPa
Test No ec Dr(c) (%)
Dr(p) (%)
σ′vc
(kPa) p′p
(kPa) qp
(kPa) φ′p(TX)
(°) (dεv/dεa)p ψp
(°) p′cs
(kPa) qcs
(kPa) M
(qcs/p′cs)
φ′cs(TX)
(°) ecs Remarks1
CIDC300_L 0.658 44.1 29.2 299.0 584.6 854.7 36.0 0.397 9.5 529.5 690.8 1.30 32.4 0.723 DP
CIDC80_L 0.663 42.2 22.6 78.7 163.3 251.1 37.7 0.470 11.0 141.6 188.0 1.33 32.9 0.745 DP
CIDC450_L 0.651 46.8 32.4 448.6 883.4 1301.0 36.2 0.421 10.0 784.8 1006.3 1.28 31.9 0.701 WP
CKDC100_L2 0.679 36.6 14.9 96.6 102.2 160.8 38.6 0.529 12.1 - - - - - WP
CKDC1000_L 0.660 43.3 15.7 1001.1 954.4 1359.7 35.1 0.410 9.8 841.2 1020.9 1.21 30.3 0.732 WP
CKDC50_D3 0.534 89.0 79.3 51.2 65.2 114.6 42.8 0.981 19.2 50.8 72.0 1.42 35.0 0.610 WP
Note:

Characterisation of UWA superfine silica sand Chow et al. 18844 September 2019
14
Table 9 Triaxial test program and results conducted at TUHH
Test No ec Dr(c) (%)
Dr(p) (%) σ′vc
(kPa) p′p
(kPa) qp
(kPa) φ′p(TX)
(°) (dεv/dεa)p ψ
(°) p′cs
(kPa) qcs
(kPa) M
(qcs/p′cs)
φ′cs(TX)
(°) ecs
CIDC50_D 0.544 85.1 76.1 50.47 108.27 172.84 39.1 0.655 14.3 90.64 121.32 1.34 33.2 0.643
CIDC100_D 0.527 91.3 80.7 100.80 219.81 356.44 39.7 0.731 15.5 181.50 241.50 1.33 33.0 0.649
CIDC200_D 0.534 88.7 82.0 200.21 433.51 699.64 39.5 0.765 16.1 358.35 473.54 1.32 32.8 0.647
CIDC50_L 0.701 28.8 28.5 50.34 93.44 128.83 34.1 0.099 2.7 91.94 124.02 1.38 34.1 0.714
CIDC100_L 0.690 32.6 31.8 100.64 183.94 250.03 33.6 0.139 3.7 178.36 233.89 1.36 33.6 0.711
CIDC200_L 0.683 35.0 33.7 199.94 360.70 481.49 33.1 0.152 4.1 348.69 445.48 1.33 33.1 0.709
Note: All tests was conducted at a back pressure of 400 kPa and sheared at 0.0008 mm/min

Characterisation of UWA superfine silica sand Chow et al. 18844 September 2019
15
Figure 9 Triaxial tests conducted at UWA : (a) CIUC tests; (b) CKUC tests
Figure 10 Triaxial test (CIDC) results conducted at TUHH: (a) loose sand; (b) dense sand

Characterisation of UWA superfine silica sand Chow et al. 18844 September 2019
16
5.3.1 Critical state parameters The critical state parameters are determined based on the critical state theory (Roscoe et al. 1958; Atkinson & Bransby 1978). Figure 11a shows the stress path in q-p′ plane and the critical state line (CSL) described by Eq. (3).
'=cs csq Mp (3)
'
'
63
s
cs
csinMsinφφ
=−
(4)
where q is the deviator stress, p′ is the mean effective stress, the subscripts cs denote ultimate failure at the critical state, M is the critical stress ratio and φ′cs is the critical effective friction angle. Good agreement in the CSL (Figure 11a) is observed between the UWA and TUHH triaxial test data. Based on the CSL in Figure 11a, the average critical stress ratio is established as M = 1.28 with a corresponding critical friction angle of 31.9°.
The critical stress ratio, M can also be established from the peak dilatancy-peak friction relationship following Nova (1982):
min(1 )= − −p M N Dη (5)
where ηp is the peak stress ratio (qp/p'p), N is a volumetric coupling term and Dmin is the minimum strain ratio (dεv/dεq)p representing the maximum or peak dilatancy. As shown in Figure 12, the critical stress ratio is established as M = 1.28 with a corresponding critical friction angle of 31.9°, which is similar to that established in Figure 11a.
Figure 11 CSL in (a) q-p′ plane; and (b) ν-ln p′ plane

Characterisation of UWA superfine silica sand Chow et al. 18844 September 2019
17
Figure 12 Critical stress ratio, M established from peak dilatancy-peak friction relationship
The projection of the CSL into ν-ln p′ plane is presented in Figure 11b, as described below:
ln 'pν λ= Γ − (6)
where ν is the specific volume taken as 1 + ecs, ecs is the void ratio at critical state, Γ is defined as the value of ν at p´= 1 kPa on the critical state line and λ is the slope of the critical state line and the normal consolidation line. Contrary to the CSL in q-p′ plane, the fitting of Γ and λ encountered a wide scatter with the TUHH dense sand data fell completely out of range. This complication is contributed by the difficulty in identifying the critical state, in which volume constancy is not observed at the end of testing for many tests (e.g. all TUHH data in Figure 10) as discussed earlier. The scatter in ecs is also caused by formation of rupture plane or shear band as observed for all UWA samples at the end of test (Figure 13), which is known to cause non-uniformity in the specimen void ratio (Desrues et al. 2015). In addition, test data with p′cs > 1MPa have to be excluded from establishing the CSL in ν-ln p′ plane as these tests produced a steeper CSL due to grain crushing at high stress level (Been et al. 1991).
Considering that the test data in Table 8 and Table 9 could not be used in establishing the critical state parameters in Eq. (6), a separate exercise involving loose samples prepared using moist tamping method was conducted to obtain the parameters (David Reid, personal correspondence). Establishing the CSL parameters using loose samples avoids the formation of shear band and have shown to produce similar parameters as those of dense sand (Been & Jefferies 2004). Preparing the samples using moist tamping method is also observed (through CT scans) to produce more uniform sample than air or wet pluviated samples in a recent study at NGI (Siren Knudsen, personal communication), despite previous studies who suggested otherwise (Vaid et al. 1999). In addition, the critical state is known to be independent of sample preparation technique or soil fabric effects (Been et al. 1991). Through the separate study, the critical state parameters, λ and Γ are established as 0.009 and 0.764 respectively (David Reid, personal correspondence). The λ = 0.009 is observed to be in close agreement to the range of λ = 0.005 - 0.018 established from the 1DNCL tests in Section 4.

Characterisation of UWA superfine silica sand Chow et al. 18844 September 2019
18
In addition to Eq. (6), it is also useful to establish the CSL in the power-law form described in Eq. (7) as suggested by Li & Wang (1998):
csat
p 'eP
ξ
= Γ −λ
(7)
where ecs is the void ratio at critical state, Pat is the atmospheric pressure, and Г, λ and ξ are fitting parameters. ξ is typically taken as 0.7 for sands (Li & Wang 1998). Keeping ξ = 0.7, Г and λ are established as 0.732 and 0.009 respectively using the same data for Eq. (6) (Figure 14).
Figure 13 Typical end of test photos of specimens with formation of rupture plane
Figure 14 CSL in power-law form

Characterisation of UWA superfine silica sand Chow et al. 18844 September 2019
19
6 Stress-dilatancy relationship of UWA SF sand 6.1 Bolton (1986) Framework The stress-dilatancy relationship of the UWA SF sand can be established by calibrating Bolton (1986)’s dilatancy equation:
' '− =p cs RIφ φ α (8)
' '− =p cs pφ φ βψ (9)
Where φ′p is the peak friction angle, Ψp is the peak dilation angle, α and β are two fitting parameters, and IR is the dilatancy index determined as below:
( ) ( ln ')= − −R r cI D Q p R (10)
Where Dr(c) is the relative density at end of consolidation, Q is a fitting parameter that can be link to soil mineralogy, p’ is the mean effective stress and R is also a fitting parameter.
The peak dilation angle, Ψp can be determined under plane strain (DS, DSS) and triaxial compression condition using the following equations:
1( , ) tan−
= −
vp DS DSS
s p
ddεψε
(11)
1( ) sin
2
−
= − −
v
a pp TX
v
a p
dd
dd
εε
ψεε
(12)
It is useful to calibrate the Bolton (1986)’s fitting parameters in Eqs. (8) to (10) for estimation of peak friction angle at a known relative density and stress level. The Bolton’s parameters were calibrated using the suite of soil strength tests (DS, DSS, TX) discussed in Section 5. In order to perform the calibration, the dilatancy index, IR is first established using Eq. (13) based on the formulation in Bolton (1986):
1
0.3
= −
vR
p
dIdεε
(13)
The fitting parameters, α, β, Q and R can then be calibrated using the known IR as shown in Figure 15 and summarised in Table 10 using least squares linear regression method. As shown in Table 10 and Figure 15, α are calibrated as 13.5, 5.3 and 2.6 for DS, DSS and TX tests respectively. The α values established for the DSS and TX agree well with existing literature (αplane strain = 5 and αTX = 3, Bolton 1986). However, α = 13.5 for the DS tests is significantly higher than the expected α = 5 under plane strain condition. More validation is desired as the DS tests are all limited to very dense sand (Dr = 88 to 98%). β are calibrated as 0.8, 0.3 and 0.4 for DS, DSS and TX tests respectively, which agree reasonably well with existing literature (βplane strain = 0.8 and βTX = 0.5, Bolton 1986).

Characterisation of UWA superfine silica sand Chow et al. 18844 September 2019
20
Table 10 Summary of Bolton’s fitting parameters calibrated through different tests
Test Type
Number of tests
Eq. (8) Eq. (9) Eq. (10) Eq. (10) (R = 1)
α R2 β R2 Q R R2 Q R2
DS 5 13.49 0.88 0.80 0.88 9.46 4.43 0.95 5.59 0.79
DSS 10 5.27 0.72 0.31 0.72 7.15 1.28 0.80 6.79 0.80
TXC 11 2.64 0.79 0.43 0.94 6.07 -1.27 0.95 9.63 0.56
Figure 15 Calibration of Bolton’s stress dilantancy parameters: (a) α; (b) β; (c) Q and R; and
(d) Q using R = 1
As shown in Table 10, a range of Q = 6.1 to 9.5 and R = -1.3 to 4.4 are calibrated from the different tests. For a simpler relationship using R = 1 as in Bolton (1986), Q ranges between 5.6 and 9.6, albeit with a lower regression coefficient in most cases. It is observed that QTX =

Characterisation of UWA superfine silica sand Chow et al. 18844 September 2019
21
9.6 (R = 1) agrees with that reported for a siliceous material, i.e. Q = 9 to 10 (Bolton 1986). However, QDS = 5.6 and QDSS = 6.8 (R = 1) are lower than expected, which could be contributed by the stress level dependency on Q for p′ < 150 kPa (Chakraborty & Salgado 2010) as majority of the DS and DSS tests were conducted at p′ < 150 kPa. However, more verification is required as Bolton (1987) has suggested otherwise with a relative dilatancy index (IR = 5Dr -1) that is independent of stress level for p′ < 150 kPa.
In general, the data exhibit considerable scatter producing regression coefficient, R2 ~ 0.56 to 0.95 in the fitted regression lines. The fitting can be further improved by expanding the test database to consider a wider range of relative densities and stress level. The stress-dilatancy relation at low stress level requires further study, taken into consideration the conflicting findings between Bolton (1987) and Chakraborty & Salgado (2010). In addition, the fabric anisotropy effect (Tatsuoka 1987) is not accounted for in this exercise.
6.2 Other Frameworks The stress dilatancy relationship of the SF sand can also be explored using other frameworks (Cam Clay, Nova 1982, Rowe 1962) as listed in Table 11. Figure 16 shows the derivation of stress-dilatancy relationship from selected drained tests on loose samples by plotting the stress ratio, η (q/p') against the plastic dilatancy, DP using the procedure detailed in Been & Jefferies (2004). The three loose samples in Figure 16 exhibit a linear stress-dilatancy response between the stress ratios of 0.8 and 1.6 (peak stress ratio). The linear response is also observed in other reported studies (Been & Jefferies 2004). Also included in Figure 16 are the stress-dilatancy relationships (ignoring η < 0.8) established using the three frameworks. The fitted parameters for each framework are summarized in Table 11. Note that the fitted M = 1.15 does not represent the critical stress ratio (M = 1.28) as the dilation continues into the negative dilatancy space.
Figure 16 Stress-dilatancy of loose SF sand established through other frameworks

Characterisation of UWA superfine silica sand Chow et al. 18844 September 2019
22
Table 11 Summary of fitted parameters using different stress-dilatancy frameworks
7 Stiffness parameter The determination of maximum shear modulus, Gmax using bender elements is based on a simple principle. An electrical pulse is applied to the bender element located at one end of the specimen, which cause the element to bend and emit a shear wave to the receiving element at the other end. The shear wave velocity, vsw can then be determined by dividing the distance between the two bender elements, Lb over the travel time, t. With the known shear wave velocity, the maximum shear modulus can be determined using Eq. (14):
2max b swG vρ= (14)
where ρb is the bulk density of soil, vsw is the shear wave velocity taken as Lb/t.
Figure 17 shows the variation of normalised soil maximum shear modulus, Gmax/Pa (where Pa is the atmospheric pressure) with normalised mean effective stress, p′/Pa measured from selected triaxial tests instrumented with bender elements. The relationship between Gmax/Pa and p′/Pa can be expressed in Eq. (15).
0.52max ( ) '1000
1 −
= + a a
G n e pP e P
(15)
Where n is a fitting parameter established as 1.7 and 1.8 for anisotropically and isotropically consolidated specimen respectively.
Figure 17 Normalised maximum shear modulus with normalised mean effective stress profile
Framework Relationship Fitted parameters
Cam Clay DP = M - η M = 1.15
Nova (1982) DP = (M - η) / (1 - N) M = 1.15, N = 0.48
Rowe (1962) DP = 9 (M - η) / (9 + 3M - 2Mη) M = 1.15

Characterisation of UWA superfine silica sand Chow et al. 18844 September 2019
23
8 Conclusion A laboratory soil characterisation test database has been established for the UWA superfine silica sand. The database includes basic index properties, permeability, consolidation, shear strength and stiffness properties of the UWA superfine silica sand. Please contact Shiaohuey Chow ([email protected]) for the test data. The database can be further expanded to include shear strength tests considering other stress path, wider range of relative densities and stress levels, and also cyclic loading.
Acknowledgements This work forms part of the activities of the Centre for Offshore Foundation Systems (COFS), currently supported as a Centre of Excellence by the Lloyd's Register Foundation. The Lloyd’s Register Foundation invests in science, engineering and technology for public benefit, worldwide. The generosity of Evelyn Heins (TUHH), Louis King (Monash University) and Rasmus Tofte Klinkvort (NGI) in sharing their soil characterisation test data on the UWA SF silica sand is gratefully acknowledged. The first author also benefits from discussion with David Reid (UWA), Siren Knudsen (NGI), Yusuke Suzuki (NGI), Pasquale Carotenuto (NGI) and Knut Andersen (NGI).
References Atkinson, J. H. & Bransby, P. L. (1978). The mechanics of soils: an introduction to critical state
soil mechanics. McGraw-Hill Book Company (UK) Limited, London.
Been, K., Jefferies, M. G., & Hachey, J. (1991). The critical state of sands. Géotechnique, 41(3), 365–381.
Been, K. & Jefferies, M. G. (2004). Stress-dilatancy in very loose sands. Canadian Geotechnical Journal, 41, 972–989.
Blaker, Ø., Lunne, T., Vestgården, T., Krogh, L., Thomsen, N.V., Powell, J.J.M. & Wallace, C.F. (2015) Method dependency for determining maximum and minimum dry unit weights of sand. Proceedings of 3rd International Symposium on Frontiers in Offshore Geotechnics, 1159-1166.
Bolton, M. D. (1986). The strength and dilatancy of sands. Géotechnique, 36(1), 65–78.
Bolton, M. D. (1987). Reply to Discussion: The strength and dilatancy of sands. Geotechnique, 37(2), 225–226.
Chakraborty, T. & Salgado, R. (2010). Dilatancy and shear strength of sand at low confining pressures. Journal of Geotechnical and Geoenvironmental Engineering, 136(3), pp.527–532
Desrues, J., Chambon, R., Mokni, M. and Mazerolle, F. (2015). Void ratio evolution inside shear bands in triaxial sand specimens studied by computed tomography. Géotechnique, 46(3), 529-546.

Characterisation of UWA superfine silica sand Chow et al. 18844 September 2019
24
Heins, E. (2018). Numerical based identification of the pile-soil interaction in terms of the axial pile bearing capacity, PhD Thesis, Proceedings of the Institute for Geotechnical Engineering and Construction Management at Hamburg University of Technology, issue 44.
Herduin, M. (2019). Multi-directional load on shared anchors for offshore renewable energy application: Soil element and centrifuge modelling approaches. PhD thesis, the University of Western Australia, submitted for examination.
King, L., Bouazza, a., Maksimenko, a., Gates, W. P. & Dubskyd, D. (2018). Measurement of three-dimensional displacement field in piled embankments using synchrotron X-ray tomography. Canadian Geotechnical Journal, 2019, 56(6): 885-892.
King, L. (2019). The progressive development of soil arching in geosynthetic reinforced piled embankments, PhD thesis, Monash University.
Lehane, B., Gaudin, C., & Schneider, J. (2005). Scale effects on tension capacity for rough piles buried in dense sand. Géotechnique, 55(10), 709–719.
Lehane, B. M., & Liu, Q. B. (2013). Measurement of Shearing Characteristics of Granular Materials at Low Stress Levels in a Shear Box. Geotechnical and Geological Engineering, 31(1), 329–336.
Li, X.S. & Wang, Y. (1998). Linear Representation of Steady-State Line for Sand. Journal of Geotechnical and Geoenvironmental Engineering, 124(12), pp.1215–1217.
Murthy, T. G., Loukidis, D., Carraro, J. A. H., Prezzi, M., & Salgado, R. (2007). Undrained monotonic response of clean and silty sands. Géotechnique, 57(3), 273–288.
Nova, R. (1982). A constitutive model under monotonic and cyclic loading. In Soil Mechanics- transietr and cyclic loads (eds. Pande & Zienkeiwicz), 343-373. Wiley.
Roscoe, K. H., Schofield, A. N. & Wroth, C. P. (1958). On the yielding of soils. Géotechnique, 8(1), pp. 22–52.
Roy, A., Chow, S.H. O’Loughlin, C.D., Randolph, M.F. & Whyte, S. (2018). Use of a bounding surface model for predicting element tests and capacity of simple surface footings. In preparation.
Rowe, P.W. (1962). The stress–dilatancy relation for static equilibrium of an assembly of particles in contact. Proceedings of the Royal Society of London, Series A, 269: 500–527.
Tatsuoka, F. (1987). Discussion: The strength and dilatancy of sands. Geotechnique, 37(2), 219–225.
Tedja, A. (2018). A triaxial investigation of the occurrence of cavitation in sand. Master of Professional Engineering (MPE) thesis, the University of Western Australia.
Teh, K. L., Cassidy, M. J., Chow, Y. K., & Leung, C. F. (2006). Effects of Scale and Progressive Failure on Spudcan Ultimate Bearing Capacity in Sand. Symposium Proceedings, France, 1, pp. 481-489.
Trans (2005). Installation of Suction Caissons in Dense Sand and the Influence of Silt and Cemented Layers. PhD thesis, the University of Sydney.
Vaid, Y. P., Sivathayalan, S., & Stedman, D. (1999). Influence of specimen reconstitution

Characterisation of UWA superfine silica sand Chow et al. 18844 September 2019
25
method on the undrained response and microstructure of silty sand. Geotechnical Testing Journal, 22(3), 187–195.
Xu, X. (2007). Investigation of the end bearing performance of displacement piles in sand. PhD thesis, The University of Western Australia.
Yamamuro, J. A., & Wood, F. M. (2004). Effect of depositional method on the undrained behavior and microstructure of sand with silt. Soil Dynamics and Earthquake Engineering, 24(9–10), 751–760.

Characterisation of UWA superfine silica sand Chow et al. 18844 September 2019
26
Appendix 1 Manufacturer specification of UWA SF silica sand

Characterisation of UWA superfine silica sand Chow et al. 18844 September 2019
27
Appendix 2 SEM and EDS of UWA SF Silica Sand
Figure 1. Typical sand grains used for testing
Figure 2. Element map (from figure 1) identifying 3 sand grains of different composition to
SiO2.

Characterisation of UWA superfine silica sand Chow et al. 18844 September 2019
28
Figure 3. Silica sand grain next to sand grain of Ti and Fe composition
Figure 4. Surface of (a) silica sand grain; and (b) Ti and Fe sand grain
Ti and Fe grain
Silica sand grain
(a) (b)

Characterisation of UWA superfine silica sand Chow et al. 18844 September 2019
29
Figure 5. Typical spectrum of (a) Silica sand grain; and (b) Ti and Fe grains
(a)
(b)