ochsner st. anne general hospital · 2018-08-29 · community health needs assessment ochsner st....
TRANSCRIPT

Ochsner St. Anne General Hospital Community Health Needs Assessment
October 2015

Table of Contents
Introduction… Page: 1
Community Definition… Page: 2
Consultant Qualifications… Page: 3
Project Mission & Objectives … Page: 4
Methodology… Page: 5
Key Community Health Priorities… Page 8
Community Health Needs Identification… Page 28
Secondary Data… Page: 33
Key Stakeholder Interviews… Page: 61
Survey… Page: 69
Conclusions … Page: 76
Appendix A: Community Resource Inventory … Page: 78
Appendix B: Community Secondary Data Profile … Page: 82

Community Health Needs Assessment Ochsner St. Anne General Hospital Tripp Umbach
Introduction
Ochsner St. Anne General Hospital, a 35‐bed, community hospital located in Raceland, Louisiana; in
response to its community commitment, contracted with Tripp Umbach to facilitate a comprehensive
Community Health Needs Assessment (CHNA). The CHNA was conducted between March 2015 and
October 2015; it identifies the needs of the residents served by Ochsner St. Anne General Hospital. As a
partnering hospital of a regional collaborative effort to assess community health needs, Ochsner St.
Anne General Hospital collaborated with 15 hospitals and other community based organizations in the
region during the CHNA process. The following is a list of organizations that participated in the process
in some way:
Louisiana Office of Public Health
Humana Louisiana
Director ‐ Medical Student Clerkship
Louisiana Public Health Institute
Acadian Ambulance
Greater New Orleans Foundation
Susan G. Komen, New Orleans
Cancer Association of Greater New
Orleans (CAGNO)
Local Businessman
Raceland Sugar
The Metropolitan Hospital Council of New
Orleans (MHCNO)
Ochsner Medical Center
Ochsner Medical Center Kenner
Ochsner Baptist Medical Center
Ochsner Medical Center Northshore
Ochsner St. Anne General Hospital
Ochsner Medical Center Westbank
St. Charles Parish Hospital
Children’s Hospital of New Orleans
Touro Infirmary
University Medical Center
East Jefferson General Hospital
West Jefferson Medical Center
Slidell Memorial Hospital
This report fulfills the requirements of the Internal Revenue Code 501(r)(3); a statute
established within the Patient Protection and Affordable Care Act (ACA) requiring that non‐
profit hospitals conduct a CHNA every three years. The CHNA process undertaken by Ochsner
St. Anne General Hospital, with project management and consultation by Tripp Umbach,
included extensive input from persons who represent the broad interests of the community
served by the hospital facility, including those with special knowledge of public health issues,
data related to vulnerable populations, and representatives of vulnerable populations served by
the hospital. Tripp Umbach worked closely with leadership from Ochsner St. Anne General
Hospital and a project oversight committee to accomplish the assessment.
1

Community Health Needs Assessment Ochsner St. Anne General Hospital Tripp Umbach
Community Definition
While community can be defined in many ways, for the purposes of this report, the Ochsner St. Anne General Hospital (Ochsner St. Anne) community is defined as 16 zip codes – including 3 parishes/counties that hold a large majority (80%) of the inpatient discharges for the hospital (See Table 1 and Figure 1).
Table 1. Ochsner St. Anne Study Area Definition – Zip Codes
City Zip Code Parish/County City Zip Code Parish/County Thibodaux 70301 Lafourche Parish Raceland 70394 Lafourche Parish
Cut Off 70345 Lafourche Parish Des Allemands 70030 St. Charles Parish
Galliano 70354 Lafourche Parish Luling 70070 St. Charles Parish
Gheens 70355 Lafourche Parish Paradis 70080 St. Charles Parish
Golden Meadow 70357 Lafourche Parish Gray 70359 Terrebonne Parish
Larose 70373 Lafourche Parish Houma 70360 Terrebonne Parish
Lockport 70374 Lafourche Parish Houma 70363 Terrebonne Parish
Mathews 70375 Lafourche Parish Houma 70364 Terrebonne Parish
Figure 1. Map of Ochsner St. Anne General Hospital Study Area
2

Community Health Needs Assessment Ochsner St. Anne General Hospital Tripp Umbach
Consultant Qualifications
Ochsner St. Anne General Hospital contracted with Tripp Umbach, a private health care
consulting firm headquartered in Pittsburgh, Pennsylvania to complete the CHNA. Tripp
Umbach is a recognized national leader in completing CHNAs, having conducted more than 300
CHNAs over the past 25 years; more than 75 of which were completed within the last three
years. Today, more than one in five Americans lives in a community where Tripp Umbach has
completed a CHNA.
Paul Umbach, founder and president of Tripp Umbach, is among the most experienced
community health planners in the United States, having directed projects in every state and
internationally. Tripp Umbach has written two national guide books1 on the topic of community
health and has presented at more than 50 state and national community health conferences.
The additional Tripp Umbach CHNA team brought more than 30 years of combined experience
to the project.
1 A Guide for Assessing and Improving Health Status Apple Book:
http://www.haponline.org/downloads/HAP_A_Guide_for_Assessing_and_Improving_Health_Status_Apple_Book_
1993.pdf and
A Guide for Implementing Community Health Improvement Programs: http://www.haponline.org/downloads/HAP_A_Guide_for_Implementing_Community_Health_Improvement_Programs_Apple_2_Book_1997.pdf
3
Community Health Needs Assessment Ochsner St. Anne General Hospital Tripp Umbach
Project Mission & Objectives
The mission of the Ochsner St. Anne General Hospital CHNA is to understand and plan for the
current and future health needs of residents in its community. The goal of the process is to
identify the health needs of the communities served by the hospital, while developing a deeper
understanding of community needs and identifying community health priorities. Important to
the success of the CHNA process is meaningful engagement and input from a broad cross‐
section of community‐based organizations, who are partners in the CHNA.
The objective of this assessment is to analyze traditional health‐related indicators, as well as
social, demographic, economic, and environmental factors and measure these factors with
previous needs assessments, state, and national trends. Although the consulting team brings
experience from similar communities, it is clearly understood that each community is unique.
This project was developed and implemented to meet the individual project goals as defined by
the project sponsors and included:
Ensuring that community members, including underrepresented residents and those
with a broad‐based racial/ethnic/cultural and linguistic backgrounds are included in
the needs assessment process. In addition, educators, health‐related professionals,
media representatives, local government, human service organizations, institutes of
higher learning, religious institutions, and the private sector were engaged at some
level in the process.
Obtaining information on the health status and socio‐economic/environmental
factors related to the health of residents in the community.
Developing accurate comparisons to previous assessments as well as to state and
national baselines of health measures ‐ utilizing the most currently validated data.
Utilizing data obtained from the assessment to address the identified health needs
of the service area.
Providing recommendations for strategic decision‐making regionally and locally to
address the identified health needs within the region to use as a benchmark for
future assessments.
Developing a CHNA document as required by the Patient Protection and Affordable
Care Act (ACA).
4

Community Health Needs Assessment Ochsner St. Anne General Hospital Tripp Umbach
Methodology
Tripp Umbach facilitated and managed a comprehensive CHNA on behalf of Ochsner St. Anne
General Hospital — resulting in the identification of community health needs. The assessment
process included input from persons who represent the broad interests of the community
served by the hospital facility, including those with special knowledge and expertise of public
health issues. The needs assessment data collection methodology was comprehensive.
Key data sources in the CHNA included:
Community Health Assessment Planning: A series of meetings was facilitated by the
consultants and the CHNA oversight committee consisting of leadership from
Ochsner St. Anne General Hospital and other participating hospitals and
organizations. This process lasted from March 2015 until August 2015.
Secondary Data: Tripp Umbach completed comprehensive analysis of health status
and socio‐economic environmental factors related to the health of residents of the
Ochsner St. Anne General Hospital community from existing data sources such as
state and county public health agencies, the Centers for Disease Control and
Prevention, County Health Rankings, Truven Health Analytics, Community Need
Index, Healthy People 2020, and other additional data sources. This process lasted
from March 2014 until August 2015.
Trending from 2013 CHNA: In 2013, Ochsner St. Anne General Hospital contracted
with Tripp Umbach to complete a CHNA. The data sources used were similar to
those from the 2013 CHNA, which made it possible to review trends and changes
across the hospital service area. There were several data sources with changes in the
definition of specific indicators, which restricted the use of trending in several cases.
The factors that could not be trended are clearly defined in the secondary data
section of this report. Additionally, the findings from primary data (i.e., community
leaders, stakeholders, and focus groups) are presented when relevant in the
executive summary portion of this report. The 2013 CHNA can be found online at:
http://www.ochsner.org/giving/community‐outreach/community‐health‐needs‐
assessment/
Interviews with Key Community Stakeholders: Tripp Umbach worked closely with
the CHNA oversight committee to identify leaders from organizations that included:
1) Public health expertise; 2) Professionals with access to community health related
data; and 3) Representatives of underserved populations (i.e., seniors, low‐income
(including families), uninsured, Latino, chronically ill, residents with a mental health
history, homeless, residents with a literacy challenge, women of child bearing age,
5

Community Health Needs Assessment Ochsner St. Anne General Hospital Tripp Umbach
diabetic, and residents with special needs). Such persons were interviewed as part of
the needs assessment planning process. A series of 32 interviews were completed
with key stakeholders in the Ochsner St. Anne General Hospital community. A
complete list of organizations represented in the stakeholder interviews can be
found in the “Key Stakeholder Interviews” section of this report. This process lasted
from April 2015 until August 2015.
Survey of vulnerable populations: Tripp Umbach worked closely with the CHNA
oversight committee to ensure that community members, including under‐
represented residents, were included in the needs assessment through a survey
process. A total of 192 surveys were collected in the Ochsner St. Anne General
Hospital service area which provides a +/‐ 7.07 confidence interval for a 95%
confidence level. Tripp Umbach worked with the oversight committee to design a 32
question health status survey. The survey was offered in English, Spanish, and
Vietnamese. The survey was administered by community based organizations
providing services to vulnerable populations in the hospital service area. Community
based organizations were trained to administer the survey using hand‐distribution.
Surveys were administered onsite and securely mailed to Tripp Umbach for
tabulation and analysis. Surveys were analyzed using SPSS software. Geographic
regions were developed by the CHNA oversight committee for analysis and
comparison purposes:
Bayou Region: Lafourche and Terrebonne Parishes.
Southeast Louisiana (SELA) Region: all parishes included in the study area,
including; Ascension Parish, Iberville Parish, Jefferson Parish, Orleans Parish,
Plaquemines Parish, Lafourche Parish, East Baton Rouge, Livingston Parish,
St. John Parish, St. Tammany Parish, St. Charles Parish, Washington Parish,
Terrebonne Parish, and St. Bernard Parishes.
Vulnerable populations were identified by the CHNA oversight committee and
through stakeholder interviews. Vulnerable populations targeted by the surveys
were residents that were: seniors, low‐income (including families), uninsured,
Latino, chronically ill, residents with a mental health history, homeless, residents
with a literacy challenge, women of child bearing age, diabetic, and residents with
special needs. This process lasted from May 2014 until July 2015.
There are several inherent limitations to using a hand‐distribution methodology that
targeted medically vulnerable and at‐risk populations. Often, the demographic
characteristics of populations that are considered vulnerable populations are not the
same as the demographic characteristics of a general population. For example,
vulnerable populations, by nature, may have significantly less income than a general
population. For this reason the findings of this survey are not relevant to the general
6

Community Health Needs Assessment Ochsner St. Anne General Hospital Tripp Umbach
population of the hospital service area. Additionally, hand‐distribution is limited by
the locations where surveys are administered. In this case Tripp Umbach asked CBOs
to self‐select into the study and as a result there are several populations that have
greater representation in raw data (i.e., low‐income, women, etc.). These limitations
were unavoidable when surveying low‐income residents about health needs in their
local communities.
Identification of top community health needs: Top community health needs were
identified and prioritized by community leaders during a regional community health
needs identification forum held on August 7, 2015. Consultants presented to
community leaders the CHNA findings from analyzing secondary data, key
stakeholder interviews, and surveys. Community leaders discussed the data
presented, shared their visions and plans for community health improvement in
their communities, and identified and prioritized the top community health needs in
the Ochsner St. Anne General Hospital community.
Public comment regarding the 2013 CHNA and implementation plan: Ochsner St.
Anne General Hospital made the CHNA document publicly available on October 3,
2013. Since October 2013, Ochsner St. Anne General Hospital has offered a link on
their web page for questions and comments related to the CHNA document. While
the main Ochsner Health System CHNA website has been viewed 6,326 times since
October 2013; Ochsner St. Anne General Hospital has not yet received any feedback
related to the CHNA or 990 documents.
Final Community Health Needs Assessment Report: A final report was developed
that summarizes key findings from the assessment process including the priorities
set by community leaders.
7

Community Health Needs Assessment Ochsner St. Anne General Hospital Tripp Umbach
Key Community Health Priorities Louisiana is a state that has not expanded Medicaid, a key component of health reform that
extends Medicaid eligibility to a greater population of residents. Many health needs identified
in this assessment relate to the lack of Medicaid expansion and the resulting restricted access
to health services. Community leaders reviewed and discussed existing data, in‐depth
interviews with community stakeholders representing a cross‐section of agencies, and survey
findings presented by Tripp Umbach in a forum setting, which resulted in the identification and
prioritization of four community health priorities in the Ochsner St. Anne General Hospital
community. Community leaders identified the following top community health needs that are
supported by secondary and/or primary data: 1) Access to health services; 2) Behavioral health
and substance abuse; 3) Resource awareness and health literacy; and 4) Access to healthy
options. Many of the same underlying factors were identified in the 2013 CHNA, with slightly
different priorities. A summary of the top four needs in the Ochsner St. Anne General Hospital
community follows:
INCREASING ACCESS TO HEALTH SERVICES
Underlying factors identified by secondary data and primary input from community leaders,
community stakeholders, and resident survey respondents:
1. Residents need solutions that reduce the financial burden of health services (including
medical and dental care).
2. Provider to population ratios are not adequate enough to meet the need.
3. Need for care coordination
4. Limited access to health care as a result of transportation issues.
Increasing access to health care was identified as the number one community health priority by
community leaders. Access to health care is an ongoing health need in rural areas across the
United States. Apart from issues related to insurance and Medicaid reimbursements, access to
health care in the hospital service area is limited by provider to population ratios, location of
providers, transportation issues, limited awareness of residents related to the location of health
services as well as appropriate preventive practices.
Findings supported by study data:
Residents need solutions that reduce the financial burden of health care:
Socio‐economic status creates barriers to accessing health care (e.g., lack of health insurance,
inability to afford care, transportation challenges, etc.), which typically have a negative impact
on the health of residents. Often, there is a high correlation between poor health outcomes,
8

Community Health Needs Assessment Ochsner St. Anne General Hospital Tripp Umbach
the geographic areas where socio‐economic indicators (i.e., income, insurance, employment,
education, etc.) are the poorest, and the consumption of health care resources. In the needs
assessment completed by Ochsner St. Anne General Hospital in 2013, access to health care and
medical services (i.e., primary, preventive, and mental) was also identified as a need in the
hospital service area, by primary input from community stakeholders and focus group
participants and supported by secondary data.
In findings from the 2013 CHNA, stakeholders perceived a lack of access to obtaining
adequate medical coverage, which included: lack of education, lack of funding, and lack
of public transportation for residents. Stakeholders also believed the lack of access to
health care was due to jobs that did not offer insurance. Today, poverty is prevalent in
the area.
During the current 2015 study, incomes have improved for the hospital service area and
the state since the 2013 CHNA2; however, the Ochsner St. Anne General Hospital study
area has an average annual household income of $67,005; the study area shows pockets
of poverty.
Single parent homes are most likely to be living in poverty with at least one quarter of
these homes below the federal poverty rate in every zip code area. In Golden Meadow,
LA (70357) almost two‐thirds (64.4%) of single parent homes earn incomes below
federal poverty rates.
There are indications in the secondary data that the geographic pockets of poverty align
with data showing fewer providers and poor health outcomes in the same areas. For
example, residents in zip code areas with higher CNI scores (greater socio‐economic
barriers to accessing health care) tend to experience lower educational attainment,
lower household incomes, higher unemployment rates, as well as consistently showing
less access to health care due to lack of insurance, lower provider ratios, and
consequently poorer health outcomes when compared to other zip code areas with
lower CNI scores (fewer socio‐economic barriers to accessing health care).
The overall CNI score for the Ochsner St. Anne General Hospital service area rose from
3.7 (2011) to 3.9 (2015), both scores are higher than the median for the scale (3.0)
indicating an increase in already greater than average socio‐economic barriers to
accessing health care across the service area. Ten of the sixteen (81%) zip code areas
that are included in the hospital service area fall above the median score for the CNI
scale. Ochsner St. Anne General Hospital does not have CNI scores that are as high as
many of the other facilities in the Ochsner Health system; however, the rural nature of
the service area can reduce the access residents have to health services. The zip code
areas with the greatest barriers to access health services are Houma (70363 and 70364),
Golden Meadow (70357), and Gray (70359). These areas show the highest rates of child
2 In 2013, 19.1% of the state population made less than $15,000 per year compared to 16.9% in 2015.
9

Community Health Needs Assessment Ochsner St. Anne General Hospital Tripp Umbach
Figure 2 – Louisiana Medicaid Eligibility
poverty (married parents with children and single parents with children living in
poverty), uninsured, unemployed, and the lowest educational attainment.
The data suggest that there is an increase in barriers to accessing health care for the
hospital service area. A closer look at the changes in scores shows there were 10 zip
code areas that saw increases in barriers since 2011, 4 remained unchanged and 2
showed improvement. The change in CNI scores may be slightly inflated due to the lack
of Medicaid expansion causing higher uninsured rates in the hospital service area than
national norms. However, when socio‐economic indicators measured by CNI are
compared at the zip code‐level from 2011 to 2015, we see a pattern of increased rates
of poor socio‐economic measures. In the Ochsner St. Anne General Hospital service area
there is a pattern of increased barriers in areas that previously showed higher CNI
scores (greater barriers to accessing health care) and less dramatic increases in zip code
area with lower CNI scores (fewer barriers to accessing health care). This means that it is
becoming increasingly more difficult
to secure health care in areas with
lower‐socioeconomic status. This is
a trend across the nation that is the
result of the consolidation of health
care resources and sustainability
challenge faced by many rural
health service providers.
Louisiana is a state that has chosen not to
expand Medicaid, a key component in
healthcare reform that extends the
population that is eligible for Medicaid
insurance coverage. The Kaiser Family
Foundation estimates that 32% of uninsured nonelderly Louisiana residents (866,000 people)
remain ineligible for any insurance coverage or tax credits due to the lack of Medicaid
expansion.3 The primary pathway for uninsured residents to gain coverage is the federally
administered Marketplace where 34% (approximately 298,000) of uninsured Louisianans
become eligible tax credits. Residents earning between 19% to 100% Federal Poverty Line (FPL)
or $4,476 to $23, 550/year for a family of four do not qualify for any assistance at all.
In the findings of the 2013 CHNA, stakeholders felt there was a lack of affordable health
care and medications.
Today, the uninsured rate for the service area is lower than any other hospital in the
Ochsner Health System.
3 Source: Kaiser Family Foundation analysis based on 2014 Medicaid eligibility levels and 2012‐2013 Current Population Survey
10

Community Health Needs Assessment Ochsner St. Anne General Hospital Tripp Umbach
While the uninsured rate for the hospital service area (12.2%) is less than the
state (19%); there are five zip code areas that have higher rates of uninsured
than the service area average – Houma (70363 and 70364), Golden Meadow
(70357), Gray (70359), and Thibodaux (70301).
From the hand‐distributed survey, the most common forms of health insurance
carried by respondents were: No Insurance (42.2%), Private/Commercial (28.1%),
and Medicaid only (14.1%). The most common reason why individuals indicated
that they do not have health insurance is because they can’t afford it (56.9%).
There also appear to be several disparities in the uninsured rates. Latino
residents are more likely to be uninsured than their counterparts (Non‐Hispanic
or Non‐Latino) in Lafourche Parish (47.33% to 15.29% respectively) and
Terrebonne Parish (51.92% to 15.89% respectively). Additionally, the highest
uninsured rates are among residents reporting “Some other race”, Native
American/Alaska Native, and Asian across all Parishes in the study area
(Lafourche and Terrebonne Parishes).
Often insurance disparities are linked to income status, which is apparent in the hospital
service area with Latino residents more likely to experience poverty than their
counterparts in Lafourche Parish (15.68% to 14.02% respectively) and Terrebonne Parish
(22.04% to 16.85% respectively). Additionally, the highest poverty rates are among
residents reporting “Some other race”, Native American/Alaska Native, and Black or
African American across all Parishes in the study area (Lafourche and Terrebonne
Parishes).
During the community planning forum, community leaders discussed residents in the
most rural areas and also areas with high rates of poverty that do not have access to
general health services. Leaders and stakeholders indicate that there are very few
resources available to address complex and specialty care medical needs. Stakeholders
addressed the limitations of the Medicaid Waiver4, which does not cover prescription
medications or specialty care. As a result, many community based clinics do not have
access to specialty diagnostic services and many treatment options. Survey results for
the Bayou region show 20.9% of respondents reporting not taking medications as
prescribed in the last 12 months due to cost.
During the interview process for this CHNA, stakeholders discussed the cost of health
services in relationship to health insurance, uninsured care, and poor reimbursement
rates of health service providers (medical, dental and behavioral). Many providers (i.e.,
wound care specialists, sleep labs, etc.) are not accepting patients with Medicaid
insurance due to the low reimbursement rates and lack of Medicaid expansion placing a
strain on health resources to meet the needs of uninsured and underinsured residents.
4 In 2015, there are multiple Medicaid Waivers operating in Louisiana. Residents are qualify for one of the Medicaid Waivers whereby receiving health services from health providers which accept the Medicaid Waiver, and are then eligible for Medicaid reimbursement.
11

Community Health Needs Assessment Ochsner St. Anne General Hospital Tripp Umbach
The percent of insured population receiving Medicaid benefits (2009‐2013) was highest
in Terrebonne Parish (25.65%) followed by Lafourche Parish (23.64%) compared to the
state (25.70%) and national (20.21%) rates. If physicians are not accepting new Medicaid
patients, it is possible that as many as one in four insured residents in the hospital
service area are not able to secure primary care using their insurance coverage.
Community leaders and stakeholders indicated that uninsured and underinsured
residents may be resisting seeking health services due to the cost of uninsured care,
unaffordable copays, and/or high deductibles according to stakeholders. This trend was
apparent in surveys collected with 53.0% of respondents reporting less than $29,999
annual household income. A higher percentage of respondents indicated that they could
not see a doctor in the last 12 because of cost (30.9%) when compared to the state
average (18.9%). Additionally, 20.9% of respondents reported not taking medications as
prescribed in the last 12 months due to cost. Stakeholders also felt that residents in
poverty are less likely to secure health services prior to issues becoming emergent due
to a lack of resources (i.e., time, money, transportation, etc.) and a focus on meeting
basic needs, leading to a lower prioritization of health and wellness.
Provider to population ratios that are not adequate enough to meet the need.
Community leaders and stakeholders discussed that specialty care is not always available (i.e.,
Pediatric neurosurgery, pediatric cardiology, endocrinology, outpatient Medicaid providers
(dental, etc.), inpatient behavioral health and substance abuse services, adequate outpatient
behavioral health and substance abuse services, care coordination, HIV services, primary care
(rural areas), community based supportive services for seniors, diagnostics and treatment).
There are additional challenges to accessing specialty care for residents that are uninsured,
Medicaid recipients, and residents that live in rural communities with the highest rates of
poverty.
Community leaders discussed the aging physician workforce, which is leading to a
decrease in the number of physicians available. The inability to attract new physicians to
replace retiring physicians further restricts access to health services.
Lafourche and Terrebonne Parishes are both health care professional shortage areas
(HPSA). The primary care physician ratio in Terrebonne Parish (62.56 per 100,000 pop.)
and Lafourche Parish (42.26 per 100,000 pop.) are lower than state, and the national
rates (86.66 and 78.92 per 100,000 pop. respectively). The rates of Federally Qualified
Health Centers (FQHCs) is highest in Terrebonne Parish (1.79 per 100,000 pop.) when
compared to the state, and national rates (2.1 and 1.92 per 100,000 pop. respectively)
and non‐existent/not‐reported in Lafourche Parish (0 per 100,000 pop.).
Table 2: Survey Responses – Health Services Received During the Previous 12 Month Period
12

Community Health Needs Assessment Ochsner St. Anne General Hospital Tripp Umbach
Test Received SELA Region Bayou Region
Blood test 52.3% 39.6%
Cholesterol test 31.5% 27.1%
Colonoscopy 8.6% 8.9%
Check‐up 45.8% 44.8%
EKG 15.0% 13.5%
Respondents from the Bayou region report lower testing rates than those across the
SELA Region. This may be related to the limited access residents have to health services
in general as indicated by at least 1 in 10 survey respondents indicated they did not have
ready access to: dental services (14.1%), vision services (12.7%), or pediatric and
adolescent health (10.5%).
While not as clear an indication of limited access to health care as provider rates;
preventable hospitalizations that are higher than expected rates are usually driven by a
lack of securing primary care in the community. The end result is hospitalizations for
illnesses that could have been resolved prior to becoming emergency situations. In the
Ochsner St. Anne General Hospital service area there are higher rates throughout the
study area when compared to the state and national rate across six of the preventable
quality indicator (PQI) measures. The six measures include: Chronic Obstructive
Pulmonary Disease (COPD) or adult asthma, angina without procedure, perforated
appendix, dehydration, bacterial pneumonia, and urinary tract infection. There are an
additional three measures where Ochsner St. Anne General Hospital shows higher
hospitalizations than the nation, but not higher than state rates; these include: short‐
term complications of diabetes, congestive heart failure, and low birth weight. It is
apparent that there is a need for effective resources to provide geriatric care in the
hospital service area due to service area rates being higher than state and national
rates. For the service area, the PQI value for COPD is the highest (621.00) when
compared to state (531.03) and national (495.71) norms.
Table 3: Survey Responses – Perceptions about Health Service Availability
Bayou Region Available to me Available to others Not available NA*
Dental services 62.4% 8.8% 5.3% 23.5%
Vision services 64.7% 7.5% 5.2% 22.5%
Affordable, safe, and healthy housing 47.7% 6.3% 5.7% 40.2%
Cancer screening 11.2% 1.8% 3.6% 83.4% *NA = Not applicable
Community leaders and stakeholders discussed the lack of dental services in the hospital
services area, particularly for low‐income residents that are Medicaid eligible or
13

Community Health Needs Assessment Ochsner St. Anne General Hospital Tripp Umbach
uninsured. Survey findings in the Bayou region echoed a lack of dental services. The
dentist ratio in Terrebonne Parish (41.69 per 100,000 pop.) and Lafourche Parish (42.21
per 100,000 pop.) are lower than state, and the national rates (50.61 and 63.18 per
100,000 pop. respectively).
Need for care coordination:
Leaders discussed the need for care coordination for residents related to Medicaid‐eligible
residents and seniors that may be seeking health services in the emergency room. Community
leaders and stakeholders discussed the need to ensure that patients have access to treatment
methods prescribed by their physician (i.e., medications, healthy nutrition, etc.) and providers
following up with patients to improve implementation of treatment recommendations.
Stakeholders discussed the lack of care coordination provided for uninsured and
underinsured residents, including seniors, who are seeking care in inappropriate settings
like the emergency room. Several stakeholders mentioned the benefits of home health
care for care coordination, though Medicaid‐eligible residents, reportedly, are not often
approved for home health services.
Limited access to health care as a result of transportation issues.
Transportation was discussed as a barrier to accessing health services for residents in local
communities with the highest poverty rates.
In the 2013 CHNA, overall, stakeholders believed a lack of public transportation limited
opportunities for employment, getting to medical appointments and involvement in
activities etc. Stakeholders perceived that there was a lack of public transportation
services for low income and indigent populations, particularly those that were
uninsured.
Today, the topic of transportation was most often discussed by stakeholders in
relationship to residents seeking health care and healthy nutrition in rural areas. Often
residents in rural areas are not able to get to and from the health services that they
need. For this reason, stakeholders indicated that rural residents often delay seeking
health services until the issue becomes an emergency and potential outcomes are often
poor. The lack of adequate transportation impacts health in a variety of ways by limiting
the access residents have to healthy options like medical providers and grocery stores
with healthy produce. Additionally, the limitations of transportation may restrict the
access that residents have to employment opportunities, which could be a barrier to
insurance and financial stability.
14

Community Health Needs Assessment Ochsner St. Anne General Hospital Tripp Umbach
While the general population shows average or below average rates of households with
no motor vehicles when compared to state (8.48%) and national (9.07%) norms; more
than one in five (21.3%) of survey respondents indicated that they use some method of
transportation other than a personal vehicle: 14.7% used a family/friend’s car; 3.3%
used public transportation; and 3.3% said that they walk.
Residents do not always have access to care (including primary/preventive care and
dental care) due to a lack of transportation. The location of providers becomes a barrier
to accessing health care due to the limited transportation options.
Stakeholders noted that the need for accessible health care among medically vulnerable
populations (e.g., uninsured, low‐income, Medicaid insured, etc.) has an impact on the health
status of residents in a variety of ways and often leads to poorer heath outcomes. Several of
the noted effects include:
Higher cost of health care that results from hospital readmissions and increased
usage of costly emergency medical care.
The Ochsner St. Anne General Hospital study area reports higher preventable
admission rates than the State of Louisiana for six of the 14 PQI measures.
Residents delaying medical treatment and/or are non‐compliant due to the lack of
affordable options for them and limited awareness of what options do exist.
Survey respondents in the Bayou Region reported not seeing the doctor and
not taking medications as prescribed in the last 12 months due to cost.
Poor outcomes in adult, maternal, and pediatric care due to limited care
coordination and lack of patient compliance.
Lafourche Parish reports a higher rate of poor general health than
Terrebonne Parish (23% and 19.60% respectively). Both parishes, along with
Louisiana, exceed the national rate of 15.74%.
0
20
40
60
80
100
Percent of Responses
Bayou Region
Chart 1 ‐ Survey Repondents Methods of Regular Transportation
my car
family/friend car
public transportation
taxi/cab
walk
15
Community Health Needs Assessment Ochsner St. Anne General Hospital Tripp Umbach
Increasing access to health care is an issue that carries forward from previous assessments,
though some progress has been made by increasing access to community based health services
through the growth of FQHCs, and urgent care clinics. It will be very important to further
understand the access issues for residents that are low‐income, Medicaid eligible, seniors,
and/or Latino(a) in the hospital service area. Primary data collected during this assessment
from community leaders and residents offered several recommendations to increase access to
health care. Some of which included:
Physician recruitment and retention: Community leaders felt that there is a need to
recruit more physicians that will accept Medicaid and specialty providers to local
communities. Two methods for increasing access to primary care services in
communities were discussed. Leaders felt that the national transition from a fee‐for‐
service culture to a pay‐for‐performance health care model will naturally attract primary
care providers to the industry. Also, leaders discussed the possibility of offering summer
programs and internships to high school and first year college students to generate
interest in medical practice in rural settings.
Increase preventive care in local communities: Leaders discussed the need to shift the
focus of health care away from acute episodic care to prevention, noting that preventive
care is less costly and a more effective long‐term solution to improving health outcomes
in communities served by Ochsner St. Anne General Hospital. Leaders discussed
identifying creative ways to provide screenings in places where residents go (e.g., the
grocery store, recreational areas, etc.). Prevention was discussed regarding behavioral
health as well. Particularly, leaders discussed the need to teach youth healthy coping
skills at a young age.
Offer health and other necessary services in areas where the rate of poverty is high:
Leaders discussed increasing access to health services in communities where the
poverty rates are high and transportation may be an issue. Leaders recommended
hospitals provide an educator at facilities to provide enrollment information and
assistance for Medicaid and marketplace insurances. Leaders also recommended that
hospitals collaborate with local providers to offer in‐home medical care for residents
without regular transportation.
ADDRESSING BEHAVIORIAL HEALTH ISSUES INCLUDING SUBSTANCE ABUSE
Underlying factors identified by secondary data and primary input from community leaders,
community stakeholders, and resident survey respondents:
16

Community Health Needs Assessment Ochsner St. Anne General Hospital Tripp Umbach
1. There are not enough providers to meet the demand and the spectrum of services
available in most areas is not comprehensive enough to treat individual needs.
2. Care coordination is needed among behavioral health, substance abuse, and primary
care/medical providers.
Addressing needs related to behavioral health and substance abuse was identified as a top
health priority by community leaders at the community forum. Community leaders,
stakeholders, and survey respondents agree that behavioral health and substance abuse is a
top health priority. Community leader and stakeholder discussions focused primarily on the
limited number of providers, the need for care coordination and the fact that individuals with
behavioral health and substance abuse needs often have poor health outcomes.
Findings supported by study data:
There are not enough providers to meet the demand and the spectrum of services available in
most areas is not comprehensive enough to treat individual needs:
During the needs assessment conducted by Ochsner St. Anne General Hospital in 2013,
stakeholders believed that there was a lack of behavioral health services and overall
mental health was not seen as a primary health care issue. Stakeholders perceived there
to be a lack of public transportation services for low income and indigent populations,
particularly those that are uninsured. Stakeholders stated this lack of public
transportation presents an obstacle to engaging in programs and services designed to
assist individuals with behavioral health needs.
Today, data suggests there is a need for behavioral health services:
Table 4: County Health Rankings –Mental Health Providers (Count/Ratio) by Parish
Measure of Mental Health Providers* LA Lafourche Parish Terrebonne Parish
Mental health providers (count) 5386 78 130
Mental health providers (ratio Population to provider)
859:1 1,245:1 867:1
*County Health Ranking 2015
The ratio of population to mental health providers in Lafourche Parish is a significantly
larger population to provider ratio (1,245 pop. for every 1 mental health provider) than
Terrebonne Parish and the state (867 and 859 pop. per provider respectively).
17
Community Health Needs Assessment Ochsner St. Anne General Hospital Tripp Umbach
Source: Community Commons. 06/08/2015
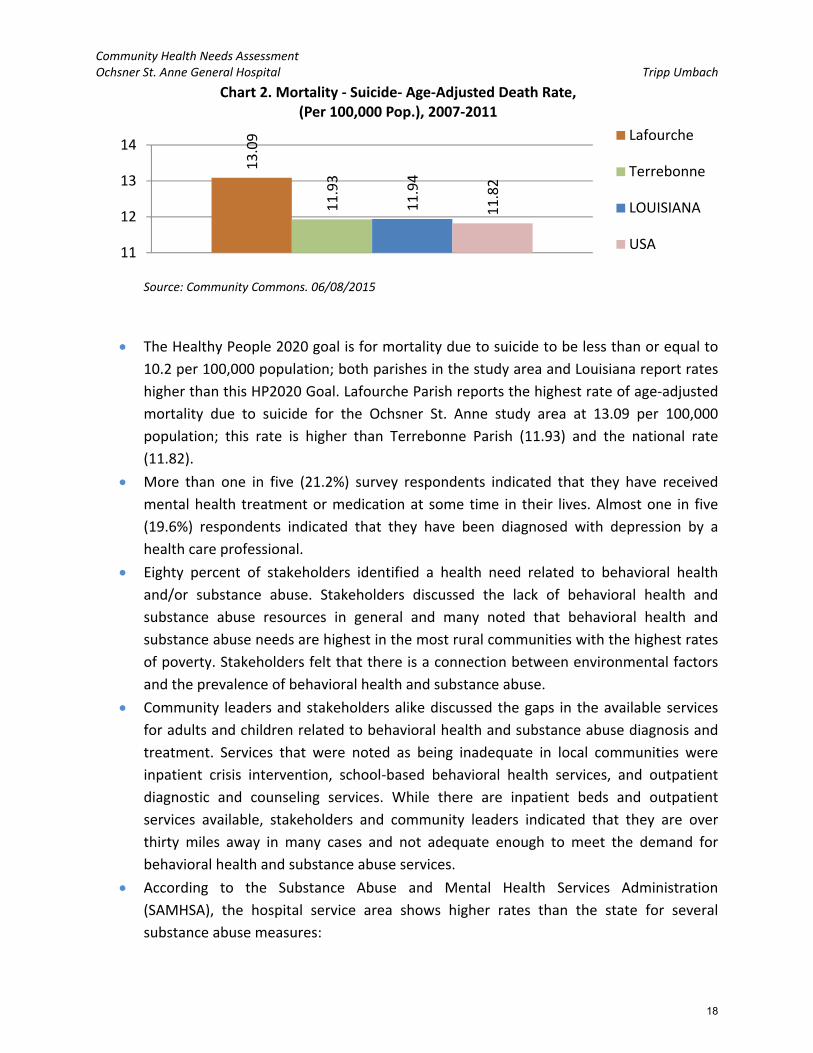
The Healthy People 2020 goal is for mortality due to suicide to be less than or equal to
10.2 per 100,000 population; both parishes in the study area and Louisiana report rates
higher than this HP2020 Goal. Lafourche Parish reports the highest rate of age‐adjusted
mortality due to suicide for the Ochsner St. Anne study area at 13.09 per 100,000
population; this rate is higher than Terrebonne Parish (11.93) and the national rate
(11.82).
More than one in five (21.2%) survey respondents indicated that they have received
mental health treatment or medication at some time in their lives. Almost one in five
(19.6%) respondents indicated that they have been diagnosed with depression by a
health care professional.
Eighty percent of stakeholders identified a health need related to behavioral health
and/or substance abuse. Stakeholders discussed the lack of behavioral health and
substance abuse resources in general and many noted that behavioral health and
substance abuse needs are highest in the most rural communities with the highest rates
of poverty. Stakeholders felt that there is a connection between environmental factors
and the prevalence of behavioral health and substance abuse.
Community leaders and stakeholders alike discussed the gaps in the available services
for adults and children related to behavioral health and substance abuse diagnosis and
treatment. Services that were noted as being inadequate in local communities were
inpatient crisis intervention, school‐based behavioral health services, and outpatient
diagnostic and counseling services. While there are inpatient beds and outpatient
services available, stakeholders and community leaders indicated that they are over
thirty miles away in many cases and not adequate enough to meet the demand for
behavioral health and substance abuse services.
According to the Substance Abuse and Mental Health Services Administration
(SAMHSA), the hospital service area shows higher rates than the state for several
substance abuse measures:
13.09
11.93
11.94
11.82
11
12
13
14
Chart 2. Mortality ‐ Suicide‐ Age‐Adjusted Death Rate, (Per 100,000 Pop.), 2007‐2011
Lafourche
Terrebonne
LOUISIANA
USA
18

Community Health Needs Assessment Ochsner St. Anne General Hospital Tripp Umbach
The rate of nonmedical use of pain relievers has declined in the hospital service
area (from 5.49% in 2004 to 5.08% in 2012), though it remains higher than state
rates (5.03% in 2012).
The rate of binge drinking has declined in the hospital service area (from 25.57%
in 2004 to 24.23% in 2012), though it remains higher than state rates (23.77% in
2012).
Tobacco use is greater in the hospital service area (34.61%) than the state
(31.98%).
Illicit drug use is greater in the hospital service area (7.04%) than the state
(6.85%).
Nearly fifty percent (47%) of survey respondents selected “Drugs and Alcohol” as one of
the top five health concerns in their communities. Stakeholders felt that the culture of
New Orleans and the tourist industry encourage substance abuse and identified
tobacco, alcohol, prescription pain medications, heroin, and marijuana as the most
common substances being abused.
Stakeholders also felt that substance abuse is often a way for residents to self‐medicate
or cope with behavioral health issues including stress and serious mental illness (i.e.,
bipolar, schizophrenia, etc.). There was discussion regarding the prevalence of stress
and limited coping mechanisms among some residents which may lead to substance
abuse as a method to cope with stress related issues like unemployment, financial crisis,
etc.
Care coordination is needed among behavioral health, substance abuse, and primary
care/medical providers.
Community leaders discussed a fractured behavioral health system where residents are
not seeking and receiving effective ongoing behavioral health and/or substance abuse
treatment. Residents may be seen in the emergency room for crisis behavioral health
and then have little follow up afterward, contributing to a repeat crisis or an even more
acute episode in the future. Community leaders and stakeholders agree that care
coordination is needed among behavioral health providers, substance abuse providers,
and physical health providers.
Stakeholders noted that behavioral health and substance abuse has an impact on the health
status of residents in a variety of ways and often leads to poorer heath outcomes. Several of
the noted effects of behavioral health and substance abuse include:
Higher suicide rates and incarceration rates for residents with mental illness.
Residents with a history of behavioral health and substance abuse do not always
practice healthy behaviors and may be non‐compliant with necessary medical
treatments (i.e., HIV treatments, etc.).
19

Community Health Needs Assessment Ochsner St. Anne General Hospital Tripp Umbach
Behavioral health has remained a top health priority that appears as a theme in each data
source included in this assessment. The underlying factors include: care coordination and
workforce supply vs. resident demand. Primary data collected during this assessment from
community leaders and residents offered several recommendations to address the need for
behavioral health and substance abuse. Some of which included:
Increase the number of facilities offering behavioral health and substance abuse
services: Leaders discussed the need to increase the number a facilities that offer
behavioral health services in order to improve the access that residents have to
behavioral health and substance abuse services. With transportation being a barrier to
accessing care, leaders recommended facilities be located in communities where the
need is the greatest.
Develop school‐based behavioral health services and screening for youth: Leaders
discussed the possibility of schools and other community based organizations
collaborating to develop school‐based behavioral health services (e.g., counselors, social
workers, etc.) and other community based clinics using funds available through
Medicaid/Bayou Health.
RESOURCE AWARENESS AND HEALTH LITERACY
Underlying factors identified by secondary data and primary input from community leaders,
community stakeholders and resident survey respondents:
1. A lack of awareness about health resources
System navigation
2. Presence of barriers related to literacy and awareness
Need to increase educational outreach to vulnerable populations
Improving resource awareness and health literacy is identified as a top health priority for the
Ochsner St. Anne General Hospital service area. While there has been some development in
health services since the last needs assessment in 2013; there is limited awareness among
residents regarding where to secure services and the health provider landscape remains largely
disjointed. According to stakeholders and community leaders the use of effective information
dissemination, comprehensive and up‐to‐date directories, etc. is needed. There is agreement
across data sources in support of improving resource awareness and health literacy of residents
in the hospital service area.
20

Community Health Needs Assessment Ochsner St. Anne General Hospital Tripp Umbach
Findings supported by study data:
A lack of awareness about health resources:
In the 2013 CHNA, stakeholders believed there was a lack of education and services
available to citizens for healthy living options and routines.
Today, stakeholders discussed a shift in the way health services are provided from the
charity care model before Katrina to the community‐based Federally Qualified Health
Center (FQHC) model providing primary care to residents through a network of FQHCs.
One of the most discussed barriers to accessing health services in the study area was the
awareness of residents about what services are available and where they are located.
Residents are not securing health services in the proper locations because they are not
aware of new clinics and services that may be available to them. The result has
reportedly been an over utilization of the emergency rooms for primary care and
behavioral health concerns.
Community leaders felt that it can be difficult to identify which physicians accept
Medicaid and which ones are not accepting new patients with Medicaid coverage.
Leaders discussed the difficulty this poses in referrals as well as residents’ ability to
secure community based primary care services.
Community leaders and stakeholders felt that residents are not securing health services
in the proper locations because they are not aware of where health services are located
and what services are available at each location. There were further discussions by both
sources about residents that may not always know how to utilize insurances once they
are insured, and may continue to seek more costly care in the emergency room due to
the need for health services that are more convenient.
Stakeholders also indicated that residents are not always practicing prevention (e.g.,
screenings) due to a lack of awareness about healthy preventive practices. Stakeholders
also addressed education in charter schools as an issue related to the access youth have
to education about reducing the spread of STIs and HIV. A lack of awareness about
preventive practices was evident among survey findings when 83.4% of respondents
indicated that cancer screening was “not applicable” to them or their family.
21

Community Health Needs Assessment Ochsner St. Anne General Hospital Tripp Umbach
Table 5: Survey Responses – Preferences for Receiving Information about Health care
Preferred Method Respondents (%)
Newspaper 38.5%
TV 30.7%
Internet 30.7%
Word of Mouth 58.3%
Radio 8.9%
Library 4.7%
Clinics 16.7%
Faith/Religious Organizations 12.5%
Call 2‐1‐1 1.6%
Other 5.7%
One of the greatest challenges to increasing health literacy and resources awareness will
be what survey results show as the method in which many respondents prefer to
receive information about health services – word of mouth (58.3%).
Language barriers related to accessing care and understanding care provided.
While the rate of limited English speaking skills in the hospital service area are not as
high as some of the more urban areas in South East Louisiana; Lockport (70374) shows
the highest percentage of residents with limited English speaking skills (4.5%) with
Galliano (70354) and Cut Off (70345) showing higher rates than the average for the
service area (3.0%, 2.8%, and 1.2% respectively).
Community leaders and stakeholders discussed the limited awareness of residents with
the lowest educational attainment in their communities; noting that the capacity to
advocate for themselves is greatly reduced as a result. Stakeholders noted that there is
a high correlation between lower educational attainment and a lower level of health
literacy; indicating that residents are not always being assessed for their level of
understanding. Stakeholders discussed languages spoken in the communities served by
Ochsner St. Anne General Hospital and the need to ensure that health services are
culturally competent and accessible for residents who have limited English speaking
skills. The language most referenced was Spanish. Additionally, stakeholders felt that
the movement toward electronic medical records, the use of online applications, and
internet based systems may leave some residents that do not have access to computers
and/or whom may be unfamiliar with computers without access to relevant health
information.
22

Community Health Needs Assessment Ochsner St. Anne General Hospital Tripp Umbach
Health literacy can impact the level of engagement with health providers at every level; limiting
preventive care, emergent care, and ongoing care for chronic health issues, leading to health
disparities among populations with limited English skills, limited literacy skills, and limited
computer literacy.
There are socio‐economic and racial disparities apparent in secondary data related
to health outcomes (i.e., low birth weight, infant mortality, heart disease, colon
cancer, prostate cancer, stroke, and homicide).
Primary data collected during this assessment from community leaders and residents offered
several recommendations to improving resource awareness and health literacy. Some of which
include:
Increase access to accurate information about what services are available: Leaders
discussed the dissemination of accurate information about what services are available in
local communities. Specifically, leaders recommended that hospitals and health
providers work with neighborhood associations to disseminate information about
available services, as well as, preventive education on an ongoing basis. Leaders also
recommended offering an internet‐based searchable data warehouse of available
resources that would be updated on a regular basis to ensure accuracy of information
and linked to parish websites. Additionally, leaders discussed promotion of the use of
the Health Information Exchange among providers and residents alike. Leaders felt that
hospitals have a unique role in the community through which they can raise awareness
about health issues and advocate for systemic change.
NEED TO IMPROVE ACCESS TO HEALTHY OPTIONS
Underlying factors identified by secondary data as well as primary input from community
leaders, community stakeholders, and resident survey respondents identified the following
subcategories for the need to improve access to healthy options:
1. Limited access to healthy nutrition
2. Lack of safe exercise options
3. Limited access to prevention and education
Community leaders identified access to healthy options as a community health priority.
Community leaders and stakeholders understood that health issues in the hospital service area
are driven by both personal choices of residents and the amount of access individuals have to
healthy options. Leaders focused discussions around the limited access residents have to
healthy nutrition, safe exercise opportunities, and need for education and outreach. There is
agreement across data sources in support of increasing access to healthy options in the hospital
service area.
23

Community Health Needs Assessment Ochsner St. Anne General Hospital Tripp Umbach
Findings supported by study data:
Limited access to healthy nutrition:
In the 2013 CHNA, stakeholders believed that there was a general lack of knowledge
about healthy life style choices, mixed with overall health not being a priority to some
residents.
Today, community leaders and stakeholders discussed food security related to the
health of seniors and youth. Grocery stores are not often located in low income
neighborhoods creating what is being called a “food desert”. Youth and seniors residing
in these food deserts may not have ready access to healthy nutrition (e.g., fresh
produce) due to the lack of transportation options. Lafourche Parish reported the
lowest rate of grocery stores per population at 14.54 per 100,000 pop.; Terrebonne
Parish follows at 16.99 per 100,000 pop.; both are lower than state (21.88) and national
(21.2) norms.
While access is an issue related to healthy nutrition, education about health food
preparation is also important as community leaders and stakeholders felt that residents
are not always aware of how to prepare foods in healthy ways. Traditional diets are
steeped in unhealthy preparation methods like fried and fatty foods.
Limited access to prevention and education:
Community leaders discussed the rural nature of the service area coupled with the
disconnected nature of residents in relationship to the level of information and instruction
about healthy choices that reaches residents in local communities. Leaders and stakeholders
believe that many low‐income, uninsured/underinsured residents are not always informed
about the most effective preventive practices due to being disconnected from primary care.
0
5
10
15
20
25
Chart 3. Grocery Store Establishments, Rate per 100,000 population (2013)
Lafourche
Terrebonne
LOUISIANA
USA
24
Community Health Needs Assessment Ochsner St. Anne General Hospital Tripp Umbach
In the 2013 CHNA, stakeholders perceived the health status of many residents to be
poor due to various factors such as limited education on how to promote healthy living.
Specifically, stakeholders referenced the increase of chronic and infectious diseases (i.e.,
Obesity, Diabetes, and HIV/AIDS). Stakeholders focused their discussion on target
populations such as the underserved/uninsured, children and elderly, and the working
poor. A sentiment echoed among stakeholders during the current assessment.
Today, stakeholders felt that a lack of education coupled with low exposure to healthy
resources causes residents in poverty to be unaware of healthy options. When residents
are aware of healthier choices they may perceive these options to be out of their reach
e.g., healthy produce and nutrition may not be viewed as consistently attainable due to
a lack of grocery stores, limited transportation, and cost.
When residents are not seeing a physician on a regular basis and they live in rural areas,
they may not have access to outlets of information about healthy practices. For
example, community leaders indicated that new mothers are not always connected to
community based resources upon discharge from the hospital and they are not always
aware of healthy practices for their infants.
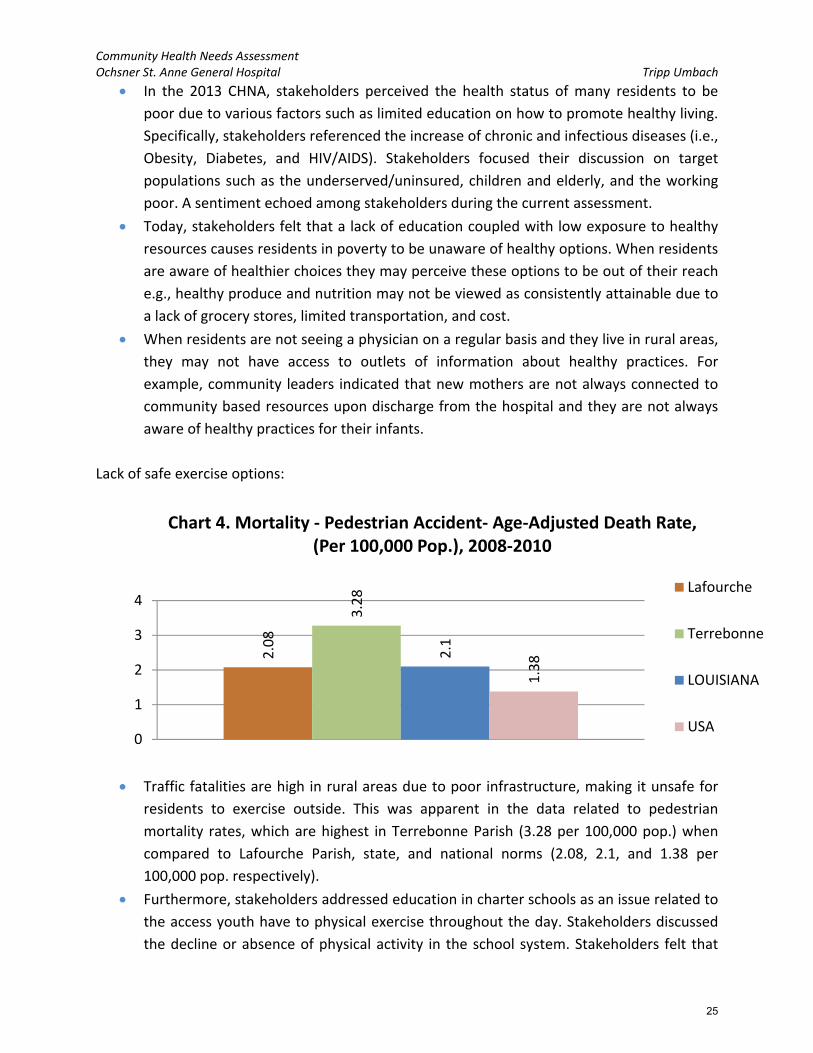
Lack of safe exercise options:
Traffic fatalities are high in rural areas due to poor infrastructure, making it unsafe for
residents to exercise outside. This was apparent in the data related to pedestrian
mortality rates, which are highest in Terrebonne Parish (3.28 per 100,000 pop.) when
compared to Lafourche Parish, state, and national norms (2.08, 2.1, and 1.38 per
100,000 pop. respectively).
Furthermore, stakeholders addressed education in charter schools as an issue related to
the access youth have to physical exercise throughout the day. Stakeholders discussed
the decline or absence of physical activity in the school system. Stakeholders felt that
2.08
3.28
2.1
1.38
0
1
2
3
4
Chart 4. Mortality ‐ Pedestrian Accident‐ Age‐Adjusted Death Rate, (Per 100,000 Pop.), 2008‐2010
Lafourche
Terrebonne
LOUISIANA
USA
25
Community Health Needs Assessment Ochsner St. Anne General Hospital Tripp Umbach
youth are becoming obese for a variety of reasons, one of which is the limited exercise
they may be participating in during school hours.
Stakeholders discussed the implications of the limited access to healthy options that residents
of the hospital service area have, they include:
Lifestyle diseases such as obesity, diabetes, cancer, hypertension, and cardiovascular
disease. Several of these measures are high in the hospital service area today.
Terrebonne Parish reports the highest rate of age‐adjusted mortality due to
ischemic heart disease for the Ochsner St. Anne study area at 164.18 per
100,000 population. The Healthy People 2020 goal is for mortality due to
ischemic heart disease to be less than or equal to 103.4 per 100,000 population;
both of the study area parishes and state report rates higher than this HP2020
Goal.
The average Body Mass Index (BMI) among survey respondents in the Bayou
Region (29.9) was higher than any other region and national norms; they border
on Obese (BMI>30).
Poor birth outcomes (e.g., low birth weight) and limited access to healthy options.
Terrebonne Parishes reports the highest rate of infant mortality for the Ochsner
St. Anne study area at 8 per 1,000 births; this rate is higher than the national rate
of 6.52 per 1,000 births. Lafourche follows closely with 7 per 1,000 births. The
Healthy People 2020 goal is for infant mortality to be less than or equal to 6.0
per 1,000 births; both parishes report rates higher than this HP2020 Goal. The
Non‐Hispanic Black population of Terrebonne Parish reports the highest rate of
infant mortality for the study area at 13.1 per 1,000 births.
There are more preventable hospitalizations related to low‐birth weight in the
hospital service area (69.78) than the national average (62.14).
Increased behavioral health symptoms of trauma e.g., risky behaviors, suicide, anxiety,
depression, violence, apathy, etc.
As referenced above (in the Behavioral health and substance abuse section)
suicide rates are higher in both Terrebonne and Lafourche Parishes than state
and national norms.
Primary data collected during this assessment from community leaders and residents offered
recommendations to improve access to healthy options. Some of which included:
Increase collaboration in the community to meet needs: Leaders discussed the need
to increase collaboration among hospitals, community based organizations, and
community based providers. The discussion focused on the need to coordinate
services to maximize the impact of what resources are available (e.g., screening,
outreach, and free health services) and develop creative solutions to challenging
problems. For example, leaders discussed hospital sponsored evidence‐based
training could be offered to community members and community based
26

Community Health Needs Assessment Ochsner St. Anne General Hospital Tripp Umbach
organizations to address needs (e.g., Alzheimer’s aggression and management).
Leaders also recommended that transportation services could increase outreach
education efforts and access to healthy produce during the daily services provided
to residents.
Increase supportive services provided to first‐time mothers: Leaders recommended
that hospitals could keep first‐time mothers for a short period to provide
information and education regarding healthy infant care and practices. Additionally,
leaders recommended that hospitals connect new mothers with the Nurse Family
Partnership to ensure follow up care and support for the family.
27

Community Health Needs Assessment Ochsner St. Anne General Hospital Tripp Umbach
Community Health Needs Identification Forum
INTRODUCTION:
The following qualitative data were gathered during a regional community planning forum held on
August 7, 2015 in Raceland, LA. The community planning forum was conducted with community leaders
representing the Ochsner St. Anne General Hospital primary service area. Community leaders were
identified by the CHNA oversight committee for Ochsner St. Anne General Hospital. Ochsner St. Anne
General Hospital is a 35‐bed, community hospital located in Raceland, Louisiana. The community forum
was conducted by Tripp Umbach consultants and lasted approximately three hours.
Tripp Umbach presented the results from secondary data analysis, community leader interviews, and
community surveys, and used these findings to engage community leaders in a group discussion.
Community leaders were asked to share their vision for the community they represent, discuss an action
plan for health improvement in their community and prioritize their concerns. Breakout groups were
formed to pinpoint, identify, and prioritize issues/problems that were most prevalent and widespread in
their community. Most importantly, the breakout groups were charged to identify ways to resolve their
community’s identified problems through innovative solutions in order to bring about a healthier
community.
GROUP RECOMMENDATIONS:
The group provided many recommendations to address community health needs and concerns for
residents in the Ochsner St. Anne General Hospital service area. Below is a brief summary of the
recommendations:
Increase the number of facilities offering behavioral health and substance abuse services: Leaders
discussed the need to increase the number a facilities that offer behavioral health services in order
to improve the access that residents have to behavioral health and substance abuse services. With
transportation being a barrier to accessing care, leaders recommended facilities be located in
communities where the need is greatest.
Physician recruitment and retention: Community leaders felt that there is a need to recruit more
physicians that will accept Medicaid and specialty providers to local communities. Two methods for
increasing access to primary care services in communities were discussed. Leaders felt that the
national transition from fee‐for‐service to pay‐for‐performance health care models would naturally
attract primary care providers to the industry. Also, leaders discussed the possibility of offering
summer programs and internships to high school and first year college students to generate interest
in medical practice in rural settings.
Increase preventive care in local communities: Leaders discussed the need to shift the focus of health
care away from acute episodic care to prevention, noting that preventive care is less costly and a
more effective long‐term solution to improving health outcomes in communities served by Ochsner
St. Anne General Hospital. Leaders discussed identifying creative ways to provide screenings in
places where residents go (e.g., the grocery store, recreational areas, etc.). Prevention was
28

Community Health Needs Assessment Ochsner St. Anne General Hospital Tripp Umbach
discussed regarding behavioral health as well. Particularly, leaders discussed the need to teach
youth healthy coping skills at a young age.
Offer health and other necessary services in areas where the rate of poverty is high: Leaders discussed
increasing access to health services in communities where the poverty rates are high and
transportation may be an issue. Leaders recommended that hospitals provide an educator at
facilities to provide enrollment information and assistance for Medicaid and marketplace
insurances. Leaders also recommended that hospitals collaborate with local providers to offer in‐
home medical care for residents without regular transportation.
Increase access to accurate information about what services are available: Leaders discussed the
dissemination of accurate information about what services are available in local communities.
Specifically, leaders recommended that hospitals and health providers work with neighborhood
associations to disseminate information about available services, as well as, preventive education on
an ongoing basis. Leaders also recommended offering an internet‐based searchable data warehouse
of available resources that would be updated on a regular basis to ensure accuracy of information
and linked to parish websites. Additionally, leaders discussed promotion of the use of the Health
Information Exchange among providers and residents alike. Leaders felt that hospitals have a unique
role in the community through which they can raise awareness about health issues and advocate for
systemic change.
Increase supportive services provided to first‐time mothers: Leaders recommended that hospitals could
keep first‐time mothers for a short period to provide information and education regarding healthy
infant care and practices. Additionally, leaders recommended that hospitals connect new mothers
with the Nurse Family Partnership to ensure follow up care and support for the family.
Increase collaboration in the community to meet needs: Leaders discussed the need to increase
collaboration among hospitals, community based organizations, and community based providers.
The discussion focused on the need to coordinate services to maximize the impact of what
resources are available (e.g., screening, outreach, and free health services) and develop creative
solutions to challenging problems. For example, leaders discussed hospital sponsored evidence‐
based training could be offered to community members and community based organizations to
address needs (e.g., Alzheimer’s aggression and management). Leaders also recommended that
transportation services could increase outreach education efforts and access to healthy produce
during the daily services provided to residents.
Develop school‐based behavioral health services and screening for youth: Leaders discussed the
possibility of schools and other community based organizations collaborating to develop school‐
based behavioral health services (e.g., counselors, social workers, etc.) and other community based
clinics using funds available through Medicaid/Bayou Health.
29

Community Health Needs Assessment Ochsner St. Anne General Hospital Tripp Umbach
PROBLEM IDENTIFICATION:
During the community planning forum process, community leaders discussed regional health needs that
centered around four themes. These were (in order of priority assigned):
1. Access to Health Services
2. Behavioral Health and Substance Abuse
3. Resource Awareness and Health Literacy
4. Access to Healthy Options
The following summary represents the most important topic areas within the community discussed at
the planning retreat, in order of priority. Community leaders believe the following concerns are the
most pressing problems and are identified as the most manageable to address and tackle.
ACCESS TO HEALTH SERVICES:
Community leaders identified access to health services as a community health priority. Leaders focused
discussions around Medicaid access issues, physician workforce issues, and care coordination.
Contributing Factors:
There are not enough primary care providers in local communities accepting new patients
with Medicaid. Many families and individuals do not have access to a local medical provider
that 1) Accepts Medicaid and 2) Accepts new patients.
There is a general lack of primary care physicians in the community. Leaders discussed more
specifically the lack of vision services, dental care, and senior services.
Leaders discussed the uncertainty in the medical industry and low reimbursement rates that
drive the lack of services for Medicaid populations.
There is a general lack of resources to meet the needs of residents with complex health
needs and co‐occurring health issues. This general lack of resources is often more
pronounced among populations with higher poverty rates.
Specialty care is not always available (i.e., diagnostic and treatment services in general and
Alzheimer’s services). There are additional challenges to accessing specialty care for
residents that live in the most rural communities, residents that are uninsured, and,
Medicaid recipients.
The physician workforce is aging, leading to a decrease in the number of physicians
available. The inability to attract new physicians to replace retiring physicians further
restricts access to health services.
Transportation was discussed as a barrier to accessing health services for residents in the
most rural communities.
There is limited follow up for Medicaid populations that seek care in the hospital.
Dental health services are not covered under the Affordable Care Act and may be
unaffordable for many residents as a result.
30

Community Health Needs Assessment Ochsner St. Anne General Hospital Tripp Umbach
BEHAVIORAL HEALTH AND SUBSTANCE ABUSE:
Behavioral health and substance abuse services were discussed at the community forum. Community
leaders focused their discussions primarily on the limited number of providers and the need for care
coordination.
Contributing Factors:
There is a stigma associated with behavioral health diagnoses, causing residents to resist
seeking diagnosis and treatment.
There are gaps in the available services for adults and children related to behavioral health
and substance abuse diagnosis and treatment. Services that were noted as being
inadequate in local communities were inpatient crisis intervention and outpatient
counseling services. Leaders noted that the level of services is not adequate to meet the
demand. Leaders discussed the impact of inadequate services on the higher than average
suicide rates in the communities served by Ochsner St. Anne General Hospital.
Leaders discussed a fragmented behavioral health system where residents are not seeking
and receiving effective ongoing behavioral health and/or substance abuse treatment.
Residents may be seen in the emergency room during a behavioral health crisis and receive
little or no follow‐up care; contributing to a repeat crisis or an even more acute episode in
the future. Care coordination among behavioral health providers, substance abuse
providers, and physical health providers could promote lasting positive outcomes for
residents with behavioral health or substance abuse issues.
There was discussion regarding the prevalence of stress and limited coping mechanisms
among some residents which may lead to substance abuse as a method to cope with stress
related issues like unemployment, financial crisis, etc.
Leaders felt that substance abuse is an issue in their communities, particularly related to
tobacco and alcohol.
RESOURCE AWARENESS AND HEALTH LITERACY:
Community leaders discussed resource awareness and health literacy as a top health priority.
Community leaders focused their discussions primarily on awareness among providers and residents of
the health resources that exist, system navigation issues, and the education of vulnerable populations.
Contributing Factors:
Leaders discussed the limited awareness of residents with the lowest educational
attainment in their communities; noting that the capacity to advocate for themselves is
greatly reduced as a result.
Residents are not always aware of where health services are located and what services are
available at each location.
31

Community Health Needs Assessment Ochsner St. Anne General Hospital Tripp Umbach
It can be difficult to identify which physicians accept Medicaid and which ones are not
accepting new patients with Medicaid coverage. Leaders discussed the difficulty this poses
in referrals as well as residents’ ability to secure community based primary care services.
New mothers are not always connected to community based resources upon discharge from
the hospital and they are not always aware of healthy practices for their infants.
Residents are not always practicing prevention (e.g., screenings) due to a lack of awareness
about healthy preventive practices.
Residents are not always being assessed to determine their level of understanding and
health literacy.
Residents do not always know how to utilize insurances once they are insured, and may
continue to seek more costly care in the emergency room due to the need for health
services that are more convenient.
ACCESS TO HEALTHY OPTIONS:
Community leaders identified access to healthy options as a community health priority. Leaders focused
discussions around the limited access residents have to healthy nutrition, safe exercise opportunities,
and need for education and outreach.
Contributing Factors:
Residents in local communities do not always have access to grocery stores with healthy
food options (e.g., fresh produce) due to a lack of transportation and limited access to
grocery stores in areas where poverty rates are the highest; thus, creating “food deserts”.
Residents are not always aware of how to prepare foods in healthy ways. Traditional diets
are steeped in unhealthy preparation methods like fried and fatty foods.
Residents do not always have access to information and instruction related to healthy
choices in local communities.
Traffic fatalities occur frequently in rural areas due to poor infrastructure, making it unsafe
for residents to exercise outside.
32
Community Health Needs Assessment Ochsner St. Anne General Hospital Tripp Umbach
Secondary Data
Tripp Umbach worked collaboratively with the Ochsner St. Anne General Hospital CHNA
oversight committee to develop a secondary data process focused on three phases: collection,
analysis, and evaluation. Tripp Umbach obtained information on the demographics, health
status, and socio‐economic and environmental factors related to the health and needs of
residents from the multi‐community service area of Ochsner St. Anne General Hospital. The
process developed accurate comparisons to the state baseline of health measures utilizing the
most current validated data. In addition to demographic data, specific attention was focused on
two key community health index factors: Community Need Index (CNI) and Prevention Quality
Indicators Index (PQI). Tripp Umbach provided additional comparisons and trend analysis for
CNI data from 2012 to present.
Demographic Data
Tripp Umbach gathered data from Truven Health Analytics, Inc. to assess the demographics of
the Ochsner St. Anne General Hospital (Ochsner St. Anne) study area. The Ochsner St. Anne
General Hospital (Ochsner St. Anne) community is defined as 16 zip codes – including 3
parishes/counties that hold a large majority (80%) of the inpatient discharges for the hospital
Information pertaining to population change, gender, age, race, ethnicity, education level,
housing, income, and poverty data are presented below.
Demographic Profile – Key Findings:
The Ochsner St. Anne study area encompasses more than 203,000 residents.
In 2015, the largest parish in the study area is Terrebonne Parish with 119,649 residents.
From 2015 to 2020, Terrebonne Parish is projected to experience the largest percentage
change in population with a 2.9% increase and the largest rise in number of residents
(3,518 people) as compared to other parishes in the study area.
The gender breakdown for the Ochsner St. Anne study area is generally consistent
across the parishes and similar to state and national norms.
Lafourche Parish reports the largest population of residents aged 65 and older (14.3%)
followed by Terrebonne Parish (12.7%).
Lafourche Parish reports the highest White, Non‐Hispanic population percentage at
75.8%, this is higher than state (59.1%) and national norms (61.8%).
33

Community Health Needs Assessment Ochsner St. Anne General Hospital Tripp Umbach
Terrebonne Parish reports the highest Black, Non‐Hispanic population across the study
area at 69.1%.
Both Terrebonne and Lafourche Parishes report lower rates of Hispanic residents as
compared with the country (17.6%). Terrebonne Parish reports 4.8% while, Lafourche
Parish reports 4.5%. Terrebonne Parish reports the highest percentage of Asian or
Pacific Islander residents (1.2%) as compared with Lafourche Parish.
Lafourche Parish reports the highest rate of residents with ‘Less than a high school’
degree (11.5%); this is nearly double the state (6.1%) and national (5.9%) rates.
Lafourche Parish also reports the highest rate of residents with a Bachelor’s degree or
higher with 16.0%; this is lower than state (21.7%) and national (28.9%) norms.
Both parishes in the study area report an average annual household income above the
state average. Lafourche Parish reports an average annual household income of
$64,405; which is only slightly above the state average of $64,209. Terrebonne Parish,
also close to the state average, reports $67,512. However, both parishes fall below the
national rate of $74,165.
Terrebonne Parish reports the highest rate of households that earn less than $15,000
per year at 14.2%; Lafourche follows with 12.8%. Lafourche Parish’s rate is in line with
the national rate of 12.7%.
34

Community Health Needs Assessment Ochsner St. Anne General Hospital Tripp Umbach
Community Needs Index (CNI)
In 2005 Catholic Healthcare West, in partnership with Thomson Reuters, pioneered the nation’s
first standardized Community Need Index (CNI).5 CNI was applied to quantify the severity of
health disparity for every zip code in the study area based on specific barriers to health care
access. Because the CNI considers multiple factors that are known to limit health care access,
the tool may be more accurate and useful than other existing assessment methods in
identifying and addressing the disproportionate unmet health‐related needs of neighborhoods
or zip code areas.
The CNI score is an average of five different barrier scores that measure various socio‐economic
indicators of each community using the 2015 source data. The five barriers are listed below
along with the individual 2015 statistics that are analyzed for each barrier. These barriers, and
the statistics that comprise them, were carefully chosen and tested individually by both Dignity
Health and Truven Health:
1. Income Barrier
a. Percentage of households below poverty line, with head of household age 65 or
more
b. Percentage of families with children under 18 below poverty line
c. Percentage of single female‐headed families with children under 18 below
poverty line
2. Cultural Barrier
a. Percentage of population that is minority (including Hispanic ethnicity)
b. Percentage of population over age 5 that speaks English poorly or not at all
3. Education Barrier
a. Percentage of population over 25 without a high school diploma
4. Insurance Barrier
a. Percentage of population in the labor force, aged 16 or more, without
employment
b. Percentage of population without health insurance
5. Housing Barrier
a. Percentage of households renting their home
Every populated zip code in the United States is assigned a barrier score of 1, 2, 3, 4, or 5
depending upon the zip code’s national rank (quintile). A score of 1 represents the lowest rank
nationally for the statistics listed, while a score of 5 indicates the highest rank nationally. For
example, zip codes that score a 1 for the Education Barrier contain highly educated
populations; zip codes with a score of 5 have a very small percentage of high school graduates.
5 Truven Health Analytics, Inc. 2015 Community Need Index.
35

Community Health Needs Assessment Ochsner St. Anne General Hospital Tripp Umbach
A total of 13 of the 16 zip code areas (81.3%) for the Ochsner St. Anne General Hospital study
area fall above the median score for the scale (3.0), two fall at the median, and one falls below
the median. Being above the median for the scale indicates that these zip code areas have
more than average the number of barriers to health care access.
Figure 3. Ochsner St. Anne General Hospital Study Area 2015 CNI Map
Table 6. Ochsner St. Anne General Hospital ‐ 2015 CNI Detailed Data
Zip City 2015 CNI Score
Poverty 65+
Poverty Married w/ kids
Poverty Single w/kids
Limited English
Minority No High School Diploma
Un‐employed
Un‐insured
Renting
70363 Houma 4.6 7.0% 29.2% 48.8% 0.8% 47.1% 32.6% 9.0% 16.3% 28.7%
70357 Golden Meadow 4.4 15.4% 19.1% 64.4% 1.9% 21.2% 40.1% 10.8% 12.4% 27.5%
70359 Gray 4.2 11.1% 24.6% 51.4% 1.7% 36.2% 25.2% 10.2% 17.9% 20.3%
70364 Houma 4.2 10.6% 23.9% 53.5% 1.3% 27.2% 22.0% 6.3% 14.4% 33.0%
70301 Thibodaux 4.0 13.4% 17.1% 37.9% 0.7% 27.5% 22.1% 6.5% 10.7% 29.9%
70354 Galliano 3.8 22.5% 20.3% 34.5% 3.0% 19.6% 35.7% 12.7% 13.0% 21.8%
70373 Larose 3.8 14.4% 18.4% 47.7% 1.9% 21.7% 28.8% 7.9% 12.2% 18.0%
70394 Raceland 3.8 11.7% 18.8% 34.5% 0.9% 27.3% 24.9% 7.2% 10.9% 20.2%
70080 Paradis 3.8 12.2% 16.5% 44.6% 0.4% 20.7% 17.3% 5.5% 11.9% 27.8%
70345 Cut Off 3.4 11.4% 9.9% 25.5% 2.8% 19.7% 29.3% 10.7% 10.4% 19.6%
70374 Lockport 3.4 17.8% 15.6% 31.3% 4.5% 13.7% 25.1% 4.7% 11.2% 24.6%
36

Community Health Needs Assessment Ochsner St. Anne General Hospital Tripp Umbach
Zip City 2015 CNI Score
Poverty 65+
Poverty Married w/ kids
Poverty Single w/kids
Limited English
Minority No High School Diploma
Un‐employed
Un‐insured
Renting
70360 Houma 3.4 7.7% 14.1% 40.2% 0.6% 24.9% 14.0% 5.7% 10.0% 29.6%
70375 Mathews 3.2 1.5% 16.7% 26.7% 0.6% 10.4% 26.2% 5.3% 12.2% 18.0%
70355 Gheens 3.0 0.0% 19.5% 23.3% 0.7% 5.1% 30.0% 4.8% 13.1% 16.3%
70030 Des Allemands 3.0 7.7% 15.5% 33.7% 0.5% 14.1% 15.6% 5.6% 12.0% 13.9%
70070 Luling 2.8 7.7% 13.0% 27.9% 1.1% 23.9% 10.7% 4.7% 8.0% 16.8%
For the Ochsner St. Anne General Hospital study area there are 5 zip code areas with CNI scores
of 4.0 or greater, indicating significant barriers to health care access. These zip code areas are:
70363 and 70364 in Houma; 70357 in Golden Meadow; 70359 in Gray; and 70301 in Thibodaux.
70357 – Golden Meadow reports the highest rates in the study area for: single
parents living in poverty with children (64.4%) and residents without a high school
diploma (40.1%).
Zip code area 70354 in Galliano reports the highest rates of residents aged 65 and
older living in poverty (22.5%) and residents who are unemployed (12.7%); this is
much higher than state (6.6%) and national (5.5%) unemployment rates.6
70363 – Houma reports the highest rates for the study area for: married parents
living in poverty with children (29.2%) and residents identifying themselves as
minority (47.1%). Zip code area 70364, also in Houma, shows the highest percentage
of people renting (33%).
17.9% of the residents in zip code area 70359 (Gray) are uninsured; the highest in
the study area.
4.5% of residents living in zip code area 70374 – Lockport have limited English
proficiency; the highest in the study area.
On the other end of the spectrum, the lowest CNI score for the study area is 2.8 in 70070 –
Luling.
Along with the lowest CNI score, zip code area 70070 (Luling) reports the lowest
rates in the study area for: residents without a high school diploma (10.7%);
unemployed residents (4.7%); and uninsured residents (8.0%). 70374 – Lockport also
reports an unemployment rate of 4.7%.
Zip code area 70355 (Gheens) reports 0.0% of their population as aged 65 and older
living in poverty. This zip code also reports the lowest rates in the study area for:
single parents living in poverty with children (23.3%) and residents identifying as
minority (5.1%).
6 March 2015 state and national statistics. U.S. Bureau of Labor Statistics.
37

Community Health Needs Assessment Ochsner St. Anne General Hospital Tripp Umbach
70030 – Des Allemands reports the lowest rate of renters across the study area at
13.9%.
Only 0.4% of residents in 70080 – Paradis have limited English proficiency; the
lowest in the study area.
Cut Off (70345) reports the lowest rate of married parents living in poverty with
children at 9.9%.
Figure 4. CNI Trending – Ochsner St. Anne General Hospital Study Area 2011 ‐ 2015 CNI Difference Map
3.93.7
4.0
0
1
2
3
4
5
Chart 5. Overall CNI Values ‐ Ochsner St. Anne, Parishes
38

Community Health Needs Assessment Ochsner St. Anne General Hospital Tripp Umbach
Table 7. CNI Trending ‐ Ochsner St. Anne General Hospital – 2011 to 2015 CNI Comparison
Zip Community Name
County Income Rank
Culture Rank
Education Rank
Insurance Rank
Housing Rank
2015 CNI Score
2011 CNI Score
Diff. 2011 – 2015
70363 Houma Terrebonne Parish 4 5 5 5 4 4.6 4.4 + 0.2
70357 Golden Meadow Lafourche Parish 5 4 5 4 4 4.4 3.6 + 0.8
70359 Gray Terrebonne Parish 4 4 5 5 3 4.2 4.0 + 0.2
70364 Houma Terrebonne Parish 4 4 5 4 4 4.2 3.6 + 0.6
70301 Thibodaux Lafourche Parish 3 4 5 4 4 4.0 4.2 ‐ 0.2
70354 Galliano Lafourche Parish 3 4 5 4 3 3.8 3.4 + 0.4
70373 Larose Lafourche Parish 4 4 5 4 2 3.8 3.2 + 0.6
70394 Raceland Lafourche Parish 3 4 5 4 3 3.8 3.8 0.0
70080 Paradis St. Charles Parish 3 4 4 4 4 3.8 3.0 + 0.8
70345 Cut Off Lafourche Parish 2 4 5 4 2 3.4 3.0 + 0.4
70374 Lockport Lafourche Parish 2 3 5 4 3 3.4 3.6 ‐ 0.2
70360 Houma Terrebonne Parish 3 4 3 3 4 3.4 3.4 0.0
70375 Mathews Lafourche Parish 2 3 5 4 2 3.2 3.2 0.0
70355 Gheens Lafourche Parish 2 2 5 4 2 3.0 2.8 + 0.2
70030 Des Allemands St. Charles Parish 3 3 4 4 1 3.0 3.0 0.0
70070 Luling St. Charles Parish 2 4 3 3 2 2.8 2.2 + 0.6
Trending (2011‐2015): Across the 16 Ochsner St. Anne General Hospital study area zip codes:
2 experienced a decline in their CNI score from 2011 to 2015, indicating a shift to fewer
barriers to health care access (green, negative values)
4 remained the same from 2011 to 2015
10 experienced a rise in their CNI score from 2011 to 2015, indicating a shift to more
barriers to health care access (red, positive values)
Zip code areas 70357 – Golden Meadow and 70080 – Paradis experienced a 0.8 increase, the
largest rise in CNI score for the study area (going from 3.6 to 4.4 for Golden Meadow; and going
from 3.0 to 3.8 for Paradis).
70301 – Thibodaux and 70347 – Lockport (both located in Lafourche Parish) were the only two
zip codes to improve their CNI score and both by 0.2 points. Thibodaux went from 4.2 in 2011
to 4.0 in 2015. Lockport went from 3.6 to 3.4.
39

Community Health Needs Assessment Ochsner St. Anne General Hospital Tripp Umbach
Prevention Quality Indicators (PQI) and
Pediatric Quality Indicators (PDI)7
The Prevention Quality Indicators index (PQI) was developed by the Agency for Healthcare
Research and Quality (AHRQ). PQI is similarly referred to as Ambulatory Care Sensitive
Hospitalizations. The quality indicator rates are derived from inpatient discharges by zip code
using ICD diagnosis and procedure codes. There are 14 quality indicators.
The PQI index identifies potentially avoidable hospitalizations for the benefit of targeting
priorities and overall community health. The index measures number of residents living in the
hospital service area, which are hospitalized for one of the following reasons (note: this does
not indicate that the hospitalization took place at Ochsner St. Anne General Hospital). Lower
index scores represent fewer admissions for each of the PQIs.
PQI Subgroups:
1. Chronic Lung Conditions
PQI 5 Chronic Obstructive Pulmonary Disease (COPD) or Asthma in Older Adults (40+) Admission Rate8
PQI 15 Asthma in Younger Adults Admission Rate9
2. Diabetes
PQI 1 Diabetes Short‐Term Complications Admission Rate
PQI 3 Diabetes Long‐Term Complications Admission Rate
PQI 14 Uncontrolled Diabetes Admission Rate
PQI 16 Lower Extremity Amputation Rate Among Diabetic Patients
3. Heart Conditions
PQI 7 Hypertension Admission Rate
PQI 8 Congestive Heart Failure Admission Rate
PQI 13 Angina Without Procedure Admission Rate
4. Other Conditions
PQI 2 Perforated Appendix Admission Rate10
PQI 9 Low Birth Weight Rate11
PQI 10 Dehydration Admission Rate
7 PQI and PDI values were calculated including all relevant zip‐code values from Louisiana; Mississippi data could not be obtained and was therefore not included. 8 PQI 5 for past study was COPD in 18+ population; PQI 5 for current study is now restricted to COPD and Asthma in 40+ population 9 PQI 15 for past study was Adult Asthma in 18+ population; PQI 15 for current study is now restricted to Asthma in 18‐39 population (“Younger”). 10 PQI 2 changed from Perforated Appendix in Males 18+ for the past study to Perforated Appendix in Total 18+ population as a rate per 1,000 ICD‐9 code admissions for appendicitis. This shift has changed the values for this measure drastically and therefore, Tripp Umbach did not adjust. 11 Although not clearly explained by the AHRQ, it would seem that a definition of Newborn population has shifted for PQI 9 because the values are drastically lower in 2014 than in previous years (2011). This has shifted PQI 9 values drastically. Tripp Umbach did not adjust.
40

Community Health Needs Assessment Ochsner St. Anne General Hospital Tripp Umbach
PQI 11 Bacterial Pneumonia Admission Rate
PQI 12 Urinary Tract Infection Admission Rate
Table 8. Prevention Quality Indicators (PQI) Ochsner St. Anne General Hospital / LA / U.S.A. 2015
Prevention Quality Indicators (PQI)
Ochsner St. Anne
Study Area2015 PQI
LA 2015 PQI
U.S.A. 2015 PQI
Ochsner St. Anne Study Area – LA Diff.
Ochsner St. Anne Study
Area – U.S.A.Diff.
Chronic Lung Conditions
COPD or Adult Asthma (PQI5) 621.00 531.03 495.71 + 89.97 + 125.29
Asthma in Younger Adults (PQI15) 40.00 42.83 46.02 ‐ 2.83 ‐ 6.02
Diabetes
Diabetes Short‐Term Complications (PQI1) 92.08 98.10 63.86 ‐ 6.02 + 28.22
Diabetes Long‐Term Complications (PQI3) 103.18 126.06 105.72 ‐ 22.88 ‐ 2.54
Uncontrolled Diabetes (PQI14) 14.31 15.57 15.72 ‐ 1.26 ‐ 1.41
Lower Extremity Amputation Among Diabetics (PQI16)
10.97 12.74 16.50 ‐ 1.77 ‐ 5.53
Heart Conditions35.26
Hypertension (PQI7) 35.26 46.06 54.27 ‐ 10.80 ‐ 19.01
Congestive Heart Failure (PQI8) 392.52 404.11 321.38 ‐ 11.59 + 71.14
Angina Without Procedure (PQI13) 19.59 13.74 13.34 + 5.85 + 6.25
Other Conditions
Perforated Appendix (PQI2) 388.89 322.43 323.43 + 66.46 + 65.46
Low Birth Weight (PQI9) 69.78 86.51 62.14 ‐ 16.73 + 7.64
Dehydration (PQI10) 163.42 124.53 135.70 + 38.89 + 27.72
Bacterial Pneumonia (PQI11) 311.77 305.80 248.19 + 5.97 + 63.58
Urinary Tract Infection (PQI12) 240.38 209.39 167.01 + 30.99 + 73.37
Key Findings from 2015 PQI Data:
The Ochsner St. Anne General Hospital study area reports higher preventable admission
rates than the State of Louisiana for six of the 14 PQI measures as depicted by the red
values in the corresponding column of Table 8 (above). The greatest difference (89.97
preventable admissions) is seen with PQI5 – COPD or Adult Asthma. The study area
reports a rate of 621.00 preventable admissions per 1,000 admissions versus the state
rate of 531.03.
When comparing the Ochsner St. Anne General Hospital PQI data to the national rates,
the study area reports higher preventable hospital admissions for:
o Diabetes, Short‐Term Complications
o Perforated Appendix
41
Community Health Needs Assessment Ochsner St. Anne General Hospital Tripp Umbach
o COPD or Adult Asthma
o Congestive Heart Failure
o Low Birth Weight
o Dehydration
o Bacterial Pneumonia
o Urinary Tract Infection
o Angina without Procedure
There are also a number of PQI measures in which the Ochsner St. Anne General
Hospital Study Area reports lower values than the nation (indicating areas in which
there are fewer preventable hospital admissions than the national norm), these include:
o Diabetes, Long‐Term Complications
o Hypertension
o Uncontrolled Diabetes
o Asthma in Younger Adults
o Lower Extremity Amputation among Diabetics
Pediatric Quality Indicators Overview The Pediatric Quality Indicators (PDIs) are a set of measures that can be used with hospital
inpatient discharge data to provide a perspective on the quality of pediatric health care.
Specifically, PDIs screen for problems that pediatric patients experience as a result of exposure
to the health care system and that may be amenable to prevention by changes at the system or
provider level.
Development of quality indicators for the pediatric population involves many of the same
challenges associated with the development of quality indicators for the adult population.
These challenges include the need to carefully define indicators using administrative data,
establish validity and reliability, detect bias and design appropriate risk adjustment, and
overcome challenges of implementation and use. However, the special population of children
invokes additional, special challenges. Four factors—differential epidemiology of child health
care relative to adult health care, dependency, demographics, and development—can pervade
all aspects of children’s health care; simply applying adult indicators to younger age ranges is
insufficient.
PDIs focus on potentially preventable complications and iatrogenic events for pediatric patients
treated in hospitals and on preventable hospitalizations among pediatric patients.
The PDIs apply to the special characteristics of the pediatric population; screen for problems
that pediatric patients experience as a result of exposure to the health care system and that
may be amenable to prevention by changes at the provider level or area level; and, help to
42

Community Health Needs Assessment Ochsner St. Anne General Hospital Tripp Umbach
evaluate preventive care for children in an outpatient setting, and most children are rarely
hospitalized.
PDI Subgroups:
PDI 14 Asthma Admission Rate (per 100,000 population ages 2 – 17)
PDI 15 Diabetes, Short‐Term Complications Admission Rate (per 100,000
population ages 6 – 17)
PDI 16 Gastroenteritis Admission Rate (per 100,000 population ages 3 months –
17 years)
PDI 17 Perforated Appendix Admission Rate (per 1,000 admissions ages 1 – 17)
PDI 18 Urinary Tract Infection Admission Rate (per 100,000 population ages 3
months – 17 years)
Key Findings from PDI Data:
The Ochsner St. Anne General Hospital study area reports preventable hospitalization
rates lower than the national rate in all but one of the Pediatric Quality Indicator (PDI)
measures.
Terrebonne Parish and Lafourche Parishes are at opposite ends of the spectrum for
rates of diabetes, short‐term complications for those aged 6 to 17 years old for the
study area (60.39 and 18.00, respectively). Terrebonne’s rates are nearly double the
state rate of 36.00 and triple the national rate of 23.89; while Lafourche’s rate is half
that of the state and lower than the national rate. This is the only measure where a
parish in the study area reports a higher rate than the nation.
Terrebonne Parish reports the highest rate for the study area of preventable
hospitalizations due to Asthma for children aged 2 to 17 at 88.12 per 100,000
population; less than the national rate of 117.37 and the state rate of 117.52. Lafourche
Parish reports a rate of 60.25 per 100,000 population; almost half the state and national
rates.
Lafourche Parish reports the highest rate of gastroenteritis for the Ochsner St. Anne
General Hospital study area at 37.31 per 100,000 population aged 3 months to 17 years.
However, both Lafourche and Terrebonne Parishes fall below the national rate of 47.28.
Terrebonne Parish reports the highest rate of preventable hospitalizations due to
perforated appendix for ages 1 to 17 years old with 307.69 per 1,000 admissions.
Lafourche Parish reports 294.12 per 1,000 admissions.
43

Community Health Needs Assessment Ochsner St. Anne General Hospital Tripp Umbach
Terrebonne reports the higher rate of preventable hospital admissions due to urinary
tract infections for those aged 3 months to 17 years in the study area with 13.06 per
100,000 population being admitted while the national rate stands at 29.64.
Community Commons Data
Tripp Umbach gathered data from Community Commons related to social and economic factors, physical environment, clinical care, and health behaviors for the parishes of interest for the Ochsner St. Anne General Hospital CHNA.12 The data is presented in the aforementioned categories below.
Insurance/Medicaid/Poverty
Terrebonne Parish reports the highest rate of Insured Residents Receiving Medicaid at
25.65%; this rate is higher than the national rate (20.21%).
Lafourche Parish shows the most drastic decline in its rates of uninsured adults going
from a high of 29.10% in 2009, down to 26.80% in the most recent data year of 2012.
After an increase from 25.90% in 2009 to 27.70% in 2010, Terrebonne Parish shows very
little change between 2010 and 2012 rates.
Residents of Hispanic or Latino ethnicity are more likely to be uninsured than their
counterparts (Non‐Hispanic or Latino).
26.19% of the Native American/Alaskan Native population in Lafourche Parish is
uninsured.
Residents reporting “Some other race”, across the study area, have the highest rates of
being uninsured.
More than 30% of the Asian population of Terrebonne Parish report being uninsured.
In general, the Hispanic/Latino population of the study area is living in poverty at higher
rates than their counterparts.
In Terrebonne Parish, 22.04% of the Hispanic/Latino population is living below the
federal poverty level (the highest for the study area).
The Native Hawaiian or Pacific Islander populations of Terrebonne Parish experience
some of the highest rates of living in poverty as compared with the other study area
parishes (82.76%).
Primary Care Physicians
12 Community Commons. http://www.communitycommons.org/ Accessed 06/08/2015.
44

Community Health Needs Assessment Ochsner St. Anne General Hospital Tripp Umbach
Terrebonne Parish reports the highest number of physicians across the study area
parishes at 46. Lafourche follows closely at 39.
Of the two parishes in the study area, Terrebonne Parish has the higher primary care
physician (PCP) rate per 100,000 population at 62.56 in 2012.
Lafourche Parish reports a lower rate of PCPs per 100,000 population at 42.6 in 2012.
Dentists
Terrebonne Parish reports the highest number of dentists across the study area parishes
at 47; Lafourche Parish reports slightly less at 41.
Lafourche and Terrebonne Parishes reported similar rates for dentists per 100,000
population in 2013 (42.21 and 41.69, respectively).
Both parishes fall short of the state rate of 50.61 and the national rate of 63.18.
Dental Health
Lafourche Parish reports the highest rate of adults with poor dental health for the
Ochsner St. Anne study area at 19.10%; this is higher than the national rate of 15.65%.
While Terrebonne Parish reports a lower rate of 16.65%, it is still above the national
rate.
Federally Qualified Health Centers (FQHCs)
Terrebonne Parish has the higher rate, in the study area, of federally qualified health
centers per 100,000 population at 1.79 (similar to the national rate of 1.92).
Lafourche Parish reports 0 FQHCs per 100,000 population.
Population Living in an HPSA (Health Professional Shortage Area)
The parishes of Lafourche and Terrebonne are both health care professional shortage
areas (HPSA); 100% of their populations live in an HPSA designated area.
Poor Health
Residents of Lafourche Parish self‐report poor general health at a higher rate than
residents of Terrebonne Parish (23% and 19.60% respectively).
Both parishes, along with Louisiana, exceed the national rate of 15.74%.
Chlamydia Infection
45

Community Health Needs Assessment Ochsner St. Anne General Hospital Tripp Umbach
Terrebonne Parish reports 134.5 per 100,000 population more cases of chlamydia
infection than Lafourche Parish (721.1 and 586.6, respectively). The national chlamydia
rate is 454.1 per 100,000 population; both study area parishes report higher rates of
chlamydia infection as compared with the nation.
Colon and Rectum Cancer
Terrebonne Parish reports the highest incidence rate of colon and rectum cancer for the
Ochsner St. Anne study area at 50.3 per 100,000 population; this is higher than the
national rate of 43.3 per 100,000 pop.
The Healthy People 2020 goal is for colon and rectum cancer incidence to be less than or
equal to 38.7 per 100,000 population; both of the study area parishes, Louisiana, and
the nation report rates higher than this goal.
The African‐American/Black population reports higher rates of colon and rectum cancer
incidence as compared with other racial groups for the study area, the state, and
nationally.
Lung Cancer
Terrebonne Parish reports the highest incidence rate of lung cancer for the Ochsner St.
Anne study area at 75.1 per 100,000 population followed by Lafourche Parish at 68.8;
these values are higher than the national rate of 64.9 per 100,000 pop.
The African‐American/Black population in Lafourche Parish reports the highest rate of
lung cancer incidence when looking at incidence by race/ethnicity (100.5 per 100,000
pop.).
Prostate Cancer
Both parishes in the study area report similar incidence rates of prostate cancer per
100,000 population for the Ochsner St. Anne study area (Lafourche = 147.3; Terrebonne
= 135.6); these values are close to the national rate of 142.3 per 100,000 pop.
The African‐American/Black population reports higher rates of prostate cancer
incidence as compared with other racial groups for the study area, the state, and
nationally.
Low Birth Weight
46

Community Health Needs Assessment Ochsner St. Anne General Hospital Tripp Umbach
Terrebonne Parish reports the highest rate of low‐weight births for the study area at
10% followed closely by Lafourche Parish with 9.20%.
Both parishes and Louisiana report higher rates of low‐weight births than the national
rate of 8.2%.
The Healthy People 2020 goal is for low – weight births to be less than or equal to 7.8%;
both parishes and state report rates higher than this goal.
The Non‐Hispanic African‐American/Black population sees higher rates of low‐weight
births as compared with other racial groups for the Ochsner St. Anne study area, the
state, and nationally.
Mortality – Stroke
Terrebonne Parish reports the highest rate of age‐adjusted mortality due to stroke for
the study area at 49.33 per 100,000 population.
The Healthy People 2020 goal is for mortality due to stroke to be less than or equal to
33.8 per 100,000 population; both of the study area parishes and state report rates
higher this HP2020 Goal.
The Non‐Hispanic Black population of Terrebonne Parish reports the highest rate of
death as a result of stroke for the study area at 92.56 per 100,000 population.
Mortality – Homicide
Terrebonne Parish reports the highest rate of age‐adjusted mortality due to homicide
for the study area at 8.79 per 100,000 population; this rate is higher than the national
rate (5.63) and Lafourche Parish.
The Healthy People 2020 goal is for mortality due to homicide to be less than or equal to
5.5 per 100,000 population; Lafourche Parish reports a rate already lower than this
HP2020 Goal.
The Non‐Hispanic Black population of Terrebonne Parish reports the highest rate of
death as a result of homicide across the Ochsner St. Anne study area at 22.14 per
100,000 population.
Depression
The State of Louisiana reports a higher rate of residents with depression (15.66%) than
the country (15.45%).
Both parishes in the study area report lower rates than the state and the nation.
47

Community Health Needs Assessment Ochsner St. Anne General Hospital Tripp Umbach
Mortality – Suicide
Lafourche Parish reports the highest rate of age‐adjusted mortality due to suicide for
the Ochsner St. Anne study area at 13.09 per 100,000 population; this rate is higher
than the national rate (11.82) and Terrebonne Parish.
The Healthy People 2020 goal is for mortality due to suicide to be less than or equal to
10.2 per 100,000 population; both parishes in the study area and Louisiana report rates
higher than this HP2020 Goal.
Men are more likely than women to die as a result of a suicide.
Households with No Motor Vehicle
Lafourche and Terrebonne Parishes both report similar rates of households with no
motor vehicle (7.35% and 7.21%, respectively).
Fast Food
In 2013, Terrebonne Parish reported the highest rate of fast food restaurants per
population at 67.05 per 100,000 pop.; Lafourche follows at 51.91; these rates are lower
than state (71.56) and national (72.74) norms.
Grocery Stores
In 2013, Lafourche Parish reported the lowest rate of grocery stores per population at
14.54 per 100,000 pop.; Terrebonne Parish follows at 16.99 per 100,000 pop.; both are
lower than state (21.88) and national (21.2) norms.
Recreation and Fitness Facilities
In 2013, Terrebonne Parish reported the lower rate of recreation and fitness facilities
per population at 10.73 per 100,000 pop.; Lafourche Parish follows at 11.42 per 100,000
pop.; both are higher than state (9.6) and national (9.72) norms.
Mortality – Ischemic Heart Disease
Terrebonne Parish reports the highest rate of age‐adjusted mortality due to ischemic
heart disease for the Ochsner St. Anne study area at 164.18 per 100,000 population.
48

Community Health Needs Assessment Ochsner St. Anne General Hospital Tripp Umbach
The Healthy People 2020 goal is for mortality due to ischemic heart disease to be less
than or equal to 103.4 per 100,000 population; both of the study area parishes and the
state report rates higher than this HP2020 Goal.
Low Food Access
The low‐income populations of Lafourche and Terrebonne parishes experience similar
rates of low food access (11.01% and 10.90%, respectively) to each other and the state
(10.82%). Both parishes, along with Louisiana, report rates much higher than the nation
(6.27%).
Lafourche Parish experiences the highest rate of population with low or no healthy food
access; this parish has a disparity index of 37.88 compared to 19.31 for the State of
Louisiana and a national rate of 16.59.
More than 67% of the Non‐Hispanic Black population, in both Lafourche and Terrebonne
Parishes, experiences low food access.
56.8% of the Non‐Hispanic ‘Other’ race population, in Lafourche Parish, experience low
food access.
Terrebonne Parish reports higher rates of low food access than Lafourche Parish across
all but two groups. Lafourche Parish reports a higher rate for the Non‐Hispanic ‘Other’
race population and is about equal with the Non‐Hispanic Black population.
Terrebonne Parish has the highest rate of SNAP‐Authorized retailers for the Ochsner St.
Anne study area at 105.49 per 100,000 population.
Lafourche Parish reports the fewest SNAP‐Authorized retailers for the study area at only
83.06 per 100,000 population.
Both parishes are above either state (104.62) or national (78.44) norms.
County Health Rankings
The County Health Rankings were completed as a collaboration between the Robert Wood
Johnson Foundation and the University of Wisconsin Population Health Institute.13
Each parish receives a summary rank for its health outcomes, health factors, and also for the
four different types of health factors: health behaviors, clinical care, social and economic
factors, and the physical environment. Analyses can also drill down to see specific parish‐level
13 2015 County Health Rankings. Robert Wood Johnson Foundation and the University of Wisconsin Population Health Institute
49

Community Health Needs Assessment Ochsner St. Anne General Hospital Tripp Umbach
data (as well as state benchmarks) for the measures upon which the rankings are based.
Parishes in each of the 50 states are ranked according to summaries of more than 30 health
measures. Those having high ranks, e.g. 1 or 2, are considered to be the “healthiest.” Parishes
are ranked relative to the health of other parishes in the same state on the following summary
measures:
Health Outcomes – Rankings are based on an equal weighting of one length of life
(mortality) measure and four quality of life (morbidity) measures.
Health Factors – Rankings are based on weighted scores of four types of factors:
Health behaviors
Clinical care
Social and economic
Physical environment
• Louisiana has 64 parishes. A score of 1 indicates the “healthiest” parish for the state in a
specific measure. A score of 64 for LA indicates the “unhealthiest” parish for the state in
a specific measure.
Key Findings from County Health Rankings:
Terrebonne Parish reports higher County Health Rankings than Lafourche across all of the
measures.
Terrebonne Parish reports relatively unhealthy county health rankings for:
o Physical Environment – Rank of 50 (15th worst parish in the state)
o Health Behaviors ‐ Rank of 48 out of worst possible 64
12 10
20
816
25
7
2227 30
26 29
48
27
15
50
05
101520253035404550556065
HealthOutcomes
HealthFactors
Mortality(Length of
Life)
Morbidity(Quality of
Life)
HealthBehaviors
Clinical Care Social andEconomicFactors
PhysicalEnvironment
Chart 6. County Health Rankings ‐ Ochsner St. Anne Parishes
Lafourche Terrebonne
50

Community Health Needs Assessment Ochsner St. Anne General Hospital Tripp Umbach
Lafourche Parish ranks above average (average for the State of Louisiana being 32, the
median between 1 and 64) for all of the County Health Ranking measures indicating
generally healthier than a majority of the other parishes in the state.
It is important to note that both Lafourche and Terrebonne parishes report many
“healthier” than average county health rankings for the state (better than the median).
Substance Abuse and Mental Health
The Substance Abuse and Mental Health Services Administration (SAMHSA) gathers region
specific data from the entire United States in relation to substance use (alcohol and illicit drugs)
and mental health.
Every state is parceled into regions defined by SAMHSA. The regions are defined in the
‘Substate Estimates from the 2010‐2012 National Surveys on Drug Use and Health’. Data is
provided at the first defined region (i.e., those that are grouped).
The Substate Regions for Louisiana are defined as such:
• Regions 1 and 10 (Data for Regions 1 and 10 provided separately for this grouping only)
o Region 1 – Orleans, Plaquemines, St. Bernard
o Region 10 – Jefferson
• Regions 2 and 9
o Region 2 – Ascension, East Baton Rouge, East Feliciana, Iberville, Pointe Coupee,
West Baton Rouge, West Feliciana
o Region 9 – Livingston, St. Helena, St. Tammany, Tangipahoa, Washington
• Region 3
o Region 3 – Assumption, Lafourche, St. Charles, St. James, St. John the Baptist, St.
Mary, Terrebonne
• Regions 4, 5, and 6
o Region 4 – Acadia, Evangeline, Iberia, Lafayette, St. Landry, St. Martin, Vermilion
o Region 5 – Allen, Beauregard, Calcasieu, Cameron, Jefferson Davis
o Region 6 – Avoyelles, Catahoula, Concordia, Grant, La Salle, Rapides, Vernon,
Winn
• Regions 7 and 8
o Region 7 – Bienville, Bossier, Caddo, Claiborne, De Soto, Natchitoches, Red River,
Sabine, Webster
o Region 8 – Caldwell, East Carroll, Franklin, Jackson, Lincoln, Madison,
Morehouse, Ouachita, Richland, Tensas, Union, West Carroll
51

Community Health Needs Assessment Ochsner St. Anne General Hospital Tripp Umbach
Data concerning alcohol use, illicit drug use, and psychological distress for the various regions of
the study area are shown here.
Alcohol Use in the Past Month
Both Region 3 (which includes Lafourche and Terrebonne parishes) and the State of
Louisiana have seen rises in the rates of alcohol use in the past month from the 2002‐
2004 study to the 2010‐2012 study.
Binge Alcohol Use in the Past Month
Region 3 has seen a decline in binge alcohol use from 25.57% in 2002‐2004 to 24.23% in
2010‐2012.
46.42%
46.78%
47.01%
47.70%
45.50%
46.00%
46.50%
47.00%
47.50%
48.00%
2002‐2004 2010‐2012
Chart 7. Alcohol Use in the Past Month
Region 3
LA
52
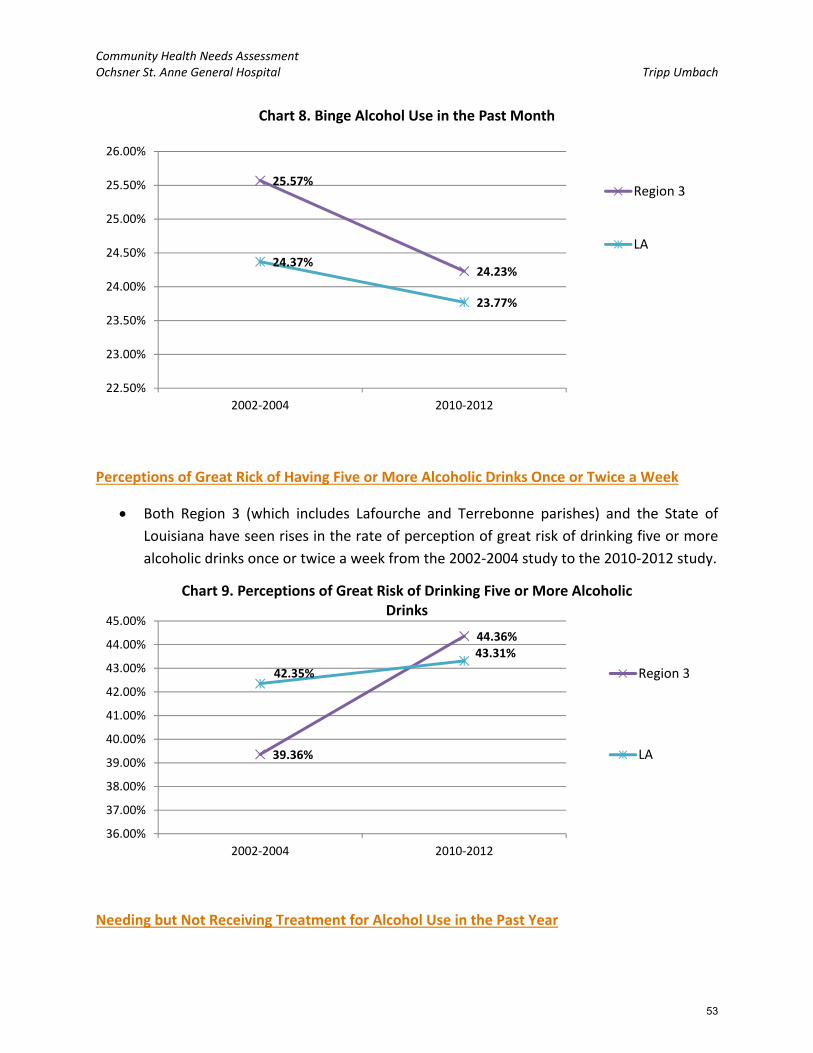
Community Health Needs Assessment Ochsner St. Anne General Hospital Tripp Umbach
Perceptions of Great Rick of Having Five or More Alcoholic Drinks Once or Twice a Week
Both Region 3 (which includes Lafourche and Terrebonne parishes) and the State of
Louisiana have seen rises in the rate of perception of great risk of drinking five or more
alcoholic drinks once or twice a week from the 2002‐2004 study to the 2010‐2012 study.
Needing but Not Receiving Treatment for Alcohol Use in the Past Year
25.57%
24.23%24.37%
23.77%
22.50%
23.00%
23.50%
24.00%
24.50%
25.00%
25.50%
26.00%
2002‐2004 2010‐2012
Chart 8. Binge Alcohol Use in the Past Month
Region 3
LA
39.36%
44.36%
42.35%
43.31%
36.00%
37.00%
38.00%
39.00%
40.00%
41.00%
42.00%
43.00%
44.00%
45.00%
2002‐2004 2010‐2012
Chart 9. Perceptions of Great Risk of Drinking Five or More Alcoholic Drinks
Region 3
LA
53
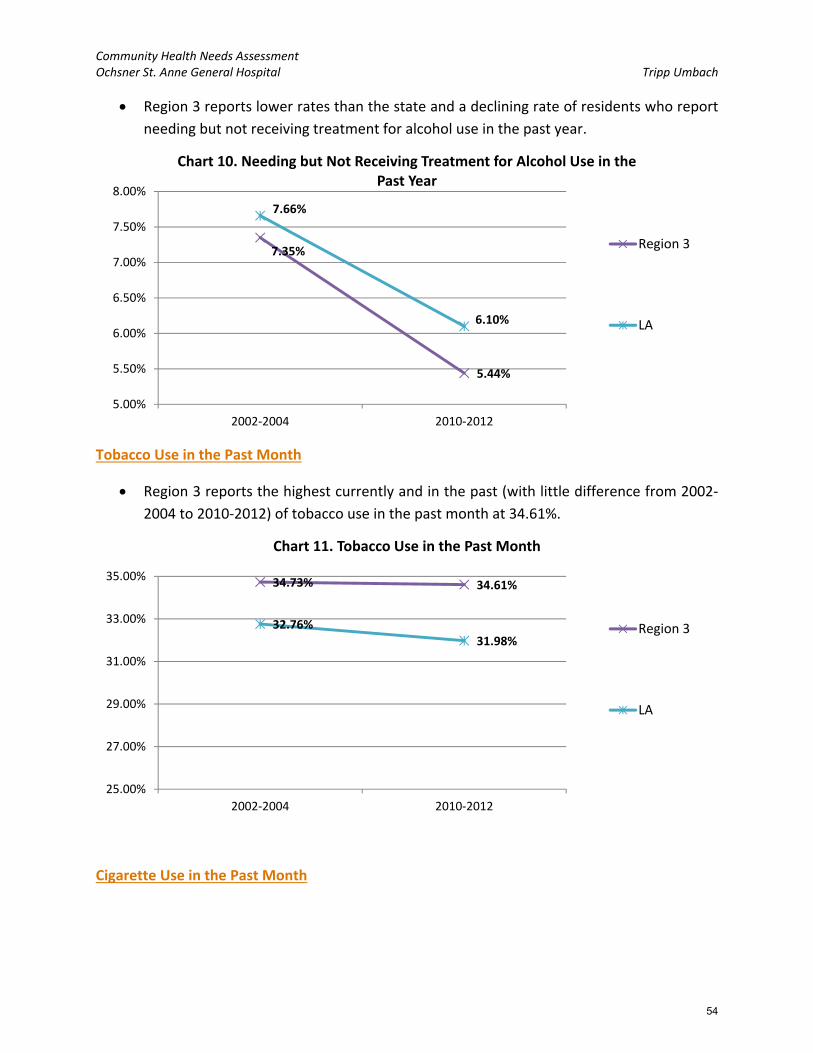
Community Health Needs Assessment Ochsner St. Anne General Hospital Tripp Umbach
Region 3 reports lower rates than the state and a declining rate of residents who report
needing but not receiving treatment for alcohol use in the past year.
Tobacco Use in the Past Month
Region 3 reports the highest currently and in the past (with little difference from 2002‐
2004 to 2010‐2012) of tobacco use in the past month at 34.61%.
Cigarette Use in the Past Month
7.35%
5.44%
7.66%
6.10%
5.00%
5.50%
6.00%
6.50%
7.00%
7.50%
8.00%
2002‐2004 2010‐2012
Chart 10. Needing but Not Receiving Treatment for Alcohol Use in the Past Year
Region 3
LA
34.73% 34.61%
32.76%31.98%
25.00%
27.00%
29.00%
31.00%
33.00%
35.00%
2002‐2004 2010‐2012
Chart 11. Tobacco Use in the Past Month
Region 3
LA
54

Community Health Needs Assessment Ochsner St. Anne General Hospital Tripp Umbach
Cigarette use in the past month is highest for Region 3 and was for the 2002‐2004
analysis as well; it has seen a slight decline in rate over the years going from 30.13% to
29.63%.
Perceptions of Great Rick of Smoking One or More Packs of Cigarettes per Day
Region 3 reports the lowest rate (correlating to the higher usage) of perceptions of great
risk of smoking one or more packs of cigarettes per day.
30.13%29.63%
28.49%
26.71%
22.00%
24.00%
26.00%
28.00%
30.00%
32.00%
2002‐2004 2010‐2012
Chart 12. Cigarette Use in the Past Month
Region 3
LA
66.87%
69.54%69.08%
71.55%
64.00%
65.00%
66.00%
67.00%
68.00%
69.00%
70.00%
71.00%
72.00%
2002‐2004 2010‐2012
Chart 13. Perceptions of Great Risk of Smoking One or More Packs of Cigarettes per Day
Region 3
LA
55

Community Health Needs Assessment Ochsner St. Anne General Hospital Tripp Umbach
Illicit Drug Use in the Past Month
Both Region 3 and the state have seen declines in the rates of illicit drug use; both going
from around 8% to now around 7%.
Marijuana Use in the Past Month
In the most recent analysis, 2010‐2012, both Region 3 and the state report 4.5% of the
relevant population (age 12 and older), have used marijuana in the past month.
Cocaine Use in the Past Year
7.57%
7.04%
7.98%
6.85%
6.00%
6.50%
7.00%
7.50%
8.00%
8.50%
9.00%
9.50%
10.00%
2002‐2004 2010‐2012
Chart 14. Illicit Drug Use in the Past Month
Region 3
LA
5.15%
4.50%
5.56%
4.50%
0.00%
1.00%
2.00%
3.00%
4.00%
5.00%
6.00%
2002‐2004 2010‐2012
Chart 15. Marijuana Use in the Past Month
Region 3
LA
56

Community Health Needs Assessment Ochsner St. Anne General Hospital Tripp Umbach
In 2010‐2012, Region 3 reported 1.39% of the relevant population having used cocaine
in the past year. This is down from 2.69% in 2002‐2004 and has fallen below the rate
seen across the state (1.5%).
Nonmedical Use of Pain Relievers in the Past Year
Region 3 experienced a decline in the rate of nonmedical use of pain relievers in the
past year from 5.49% in 2002‐2004 to 5.08% in 2010‐2012. The state rate remained
relatively consistent, going from 5.06% to 5.03%
Needing but Not Receiving Treatment for Illicit Drug Use in the Past Year
2.69%
1.39%
2.58%
1.50%
1.00%
1.50%
2.00%
2.50%
3.00%
3.50%
4.00%
2002‐2004 2010‐2012
Chart 16. Cocaine Use in the Past Year
Region 3
LA
5.49%
5.08%5.06% 5.03%
4.00%
4.50%
5.00%
5.50%
6.00%
2002‐2004 2010‐2012
Chart 17. Nonmedical Use of Pain Relievers in the Past Year
Region 3
LA
57

Community Health Needs Assessment Ochsner St. Anne General Hospital Tripp Umbach
Both Region 3 and the state have seen declines in the rates of residents reporting that
they needed but did not receive treatment for illicit drug use in the past year from 2002‐
2004 to 2010‐2012.
America’s Health Rankings
America’s Health Rankings® is the longest‐running annual assessment of the nation’s health on
a state‐by‐state basis. For the past 25 years, America’s Health Rankings® has provided a holistic
view of the health of the nation. America’s Health Rankings® is the result of a partnership
between United Health Foundation, American Public Health Association, and Partnership for
Prevention™.
For this study, the Louisiana State report was reviewed. The following were the key
findings/rankings for Louisiana:
- Louisiana Ranks:
o 48th overall in terms of health rankings
o 44th for smoking
o 45th for diabetes
o 45th in obesity
- Louisiana Strengths:
o Low incidence of pertussis
o High immunization coverage among teens
o Small disparity in health status by educational attainment
- Louisiana Challenges:
o High incidence of infectious disease
3.16%
2.09%
3.07%
2.36%
2.00%
2.50%
3.00%
3.50%
4.00%
2002‐2004 2010‐2012
Chart 18. Needing but Not Receiving Treatment for Illicit Drug Use in the Past Year
Region 3
LA
58

Community Health Needs Assessment Ochsner St. Anne General Hospital Tripp Umbach
o High prevalence of low birthweight
o High rate of preventable hospitalizations
- Louisiana Highlights:
o In the past year, children in poverty decreased by 15 percent from 31.0 percent
to 26.5 percent of children.
o In the past 2 years, physical inactivity decreased by 10 percent from 33.8 percent
to 30.3 percent of adults.
o In the past 20 years, low birthweight increased by 15 percent from 9.4 percent to
10.8 percent of births. Louisiana ranks 49th for low birthweight infants.
o In the past 2 years, drug deaths decreased by 25 percent from 17.1 to 12.9
deaths per 100,000 population.
o Since 1990, infant mortality decreased by 32 percent from 11.8 to 8.2 deaths per
1,000 live births. Louisiana now ranks 47th in infant mortality among states.
59
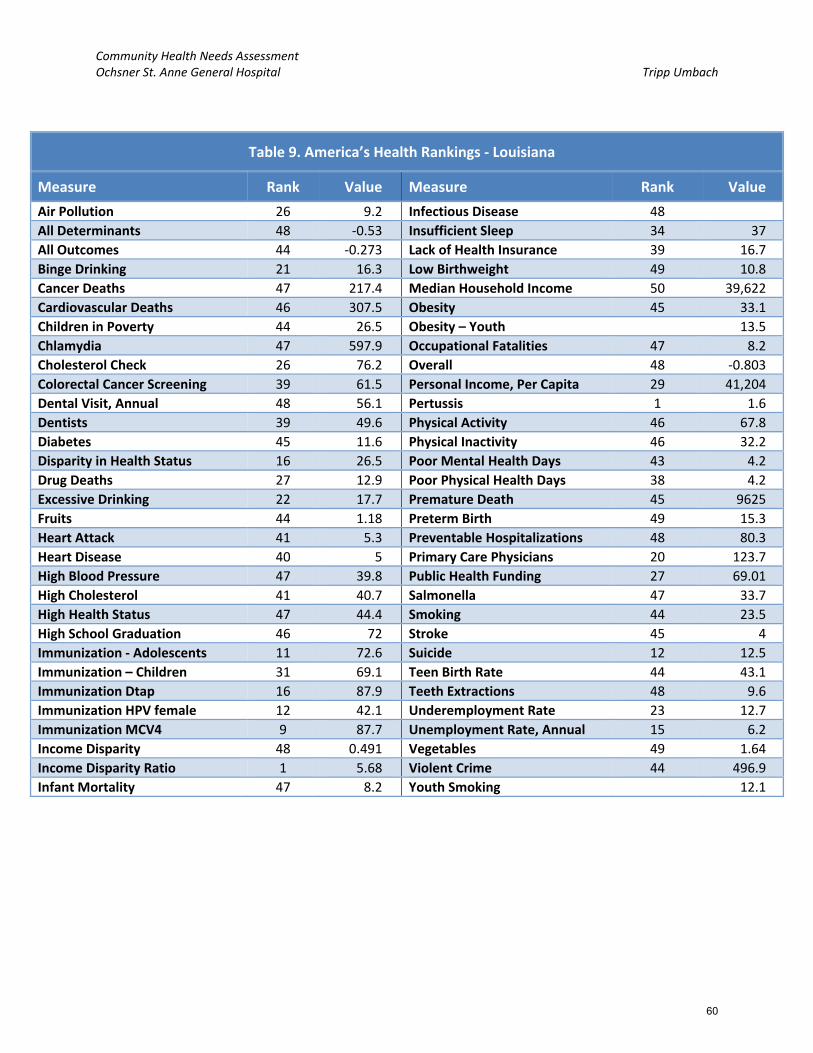
Community Health Needs Assessment Ochsner St. Anne General Hospital Tripp Umbach
Table 9. America’s Health Rankings ‐ Louisiana
Measure Rank Value Measure Rank Value
Air Pollution 26 9.2 Infectious Disease 48
All Determinants 48 ‐0.53 Insufficient Sleep 34 37
All Outcomes 44 ‐0.273 Lack of Health Insurance 39 16.7
Binge Drinking 21 16.3 Low Birthweight 49 10.8
Cancer Deaths 47 217.4 Median Household Income 50 39,622
Cardiovascular Deaths 46 307.5 Obesity 45 33.1
Children in Poverty 44 26.5 Obesity – Youth 13.5
Chlamydia 47 597.9 Occupational Fatalities 47 8.2
Cholesterol Check 26 76.2 Overall 48 ‐0.803
Colorectal Cancer Screening 39 61.5 Personal Income, Per Capita 29 41,204
Dental Visit, Annual 48 56.1 Pertussis 1 1.6
Dentists 39 49.6 Physical Activity 46 67.8
Diabetes 45 11.6 Physical Inactivity 46 32.2
Disparity in Health Status 16 26.5 Poor Mental Health Days 43 4.2
Drug Deaths 27 12.9 Poor Physical Health Days 38 4.2
Excessive Drinking 22 17.7 Premature Death 45 9625
Fruits 44 1.18 Preterm Birth 49 15.3
Heart Attack 41 5.3 Preventable Hospitalizations 48 80.3
Heart Disease 40 5 Primary Care Physicians 20 123.7
High Blood Pressure 47 39.8 Public Health Funding 27 69.01
High Cholesterol 41 40.7 Salmonella 47 33.7
High Health Status 47 44.4 Smoking 44 23.5
High School Graduation 46 72 Stroke 45 4
Immunization ‐ Adolescents 11 72.6 Suicide 12 12.5
Immunization – Children 31 69.1 Teen Birth Rate 44 43.1
Immunization Dtap 16 87.9 Teeth Extractions 48 9.6
Immunization HPV female 12 42.1 Underemployment Rate 23 12.7
Immunization MCV4 9 87.7 Unemployment Rate, Annual 15 6.2
Income Disparity 48 0.491 Vegetables 49 1.64
Income Disparity Ratio 1 5.68 Violent Crime 44 496.9
Infant Mortality 47 8.2 Youth Smoking 12.1
60

Community Health Needs Assessment Ochsner St. Anne General Hospital Tripp Umbach
Key Stakeholder Interviews
Tripp Umbach conducted interviews with community leaders on behalf of the Ochsner St. Anne
General Hospital. Leaders who were targeted for interviews encompassed a wide variety of
professional backgrounds including 1) Public health expertise; 2) Professionals with access to
community health related data; and 3) Representatives of underserved populations. The
interviews offered community leaders an opportunity to provide feedback on the needs of the
community, secondary data resources, and other information relevant to the study.
This report represents a section of the overall community health needs assessment project
completed by Tripp Umbach.
DATA COLLECTION:
The following qualitative data were gathered during individual interviews with 11 stakeholders
in communities served by the Ochsner St. Anne General Hospital, a 35‐bed hospital located in
Raceland, LA. Each interview was conducted by a Tripp Umbach consultant and lasted
approximately 60 minutes. All respondents were asked the same set of questions developed
by Tripp Umbach and previously reviewed by an Ochsner St. Anne General Hospital CHNA
oversight committee. The purpose of these interviews was for stakeholders to identify health
issues and concerns affecting residents in the communities served by Ochsner St. Anne
General Hospital, as well as ways to address those concerns.
There was a diverse representation of community‐based organizations and agencies among
the 11 stakeholders interviewed. The organizations included:
Louisiana Office of Public Health
Humana Louisiana
Director ‐ Medical Student Clerkship
Louisiana Public Health Institute
Acadian Ambulance
Greater New Orleans Foundation
Susan G. Komen, New Orleans
Ochsner Health System
Cancer Association of Greater New
Orleans (CAGNO)
Local Businessman
Raceland Sugar
STAKEHOLDER RECOMMENDATIONS:
The stakeholders provided many recommendations to address health issues and concerns for
residents living in the Ochsner St. Anne General Hospital study area. Below is a brief summary
of the recommendations:
61

Community Health Needs Assessment Ochsner St. Anne General Hospital Tripp Umbach
Increase collaboration between hospitals, FQHCs, and clinics: Stakeholders felt that the
hospital could be more connected with FQHCs and clinics in local communities through
collaboration and referrals to reduce the use of emergency rooms and urgent care
clinics. Stakeholders recommended that hospitals work with local FQHCs and clinics to
provide access to specialty diagnostics and treatment for residents that are uninsured or
Medicaid eligible. Additionally stakeholders felt that increased collaboration could mean
additional funding for health care providers throughout the community.
Hospitals could facilitate the community conversation among health providers in their
service areas regarding collaboration to address common health issues and social
determinants of health using the spectrum of care and care coordination to begin to
move away from acute care models, increase prevention and education, and reduce
prevalence rates improving population health.
Integrate behavioral health services into primary care settings through co‐location of
behavioral health providers to decrease stigma and increase treatment options for
behavioral health. Additional integration could include psychiatric consultation on an as
needed basis for primary care providers to treat behavioral health issues that are not
severe or persistent.
Health care providers could participate in a universal way in the exchange of health
information in order to facilitate collaboration among all providers including FQHCs,
hospitals, and private practices.
Providers and other community based organizations should educate residents about the
appropriate use of health care resources (e.g., primary care, emergency medical care,
urgent care, etc.).
Increase education and implementation of healthy options (e.g., physical activity,
healthy nutrition, etc.) in public settings (i.e., summer camps, public schools, etc.).
PROBLEM IDENTIFICATION:
During the interview process, stakeholders discussed five overall health needs and concerns in
their community. The top five health needs in order from most discussed to least discussed
were:
1. Accessibility of health services
2. Social and environmental determinants of health
3. Common health concerns
4. Personal behaviors that impact health
5. Behavioral health, including substance abuse
62

Community Health Needs Assessment Ochsner St. Anne General Hospital Tripp Umbach
ACCESSIBILITY OF HEALTH SERVICES:
All stakeholders representing communities included in the hospital study area articulated a need to
improve the accessibility of health services (medical, dental, behavioral) in the study area. Several
stakeholders acknowledged the significant investments that have been made in health care,
including establishing FQHC Clinics. The discussion about accessibility of services was related most
often to the cost of care, acceptance of insurance, awareness of services available, and the number
and location of providers.
Stakeholders discussed a shift in the way health services are delivered through the community‐
based FQHC clinic model providing charity care to residents through a network of community based
clinics. One of the most discussed about barriers to accessing health services in the study area was
the awareness of residents about what services are available and where they are located. Residents
are not securing health services in the proper locations because they are not aware of new clinics
and services that may be available to them. The result has reportedly been an over utilization of
the emergency rooms for primary care and behavioral health concerns.
Stakeholders discussed the cost of health services in relationship to health insurance, uninsured
care, and poor reimbursement rates of health service providers (medical, dental and behavioral).
Many providers are not accepting patients with Medicaid insurance due to the low reimbursement
rates (e.g., wound care specialist, sleep labs, etc.). This does not include non‐profit hospitals. One
stakeholder mentioned a trend among primary care providers toward a cash only payment model,
which does not accept any form of insurance. Medicaid patients have limited options for local
primary care providers in the study area. Stakeholders discussed the lack of Medicaid expansion
placing a strain on health resources to meet the needs of uninsured and underinsured residents.
Residents that are uninsured often seek health services when an issue becomes an emergency and
requires more intense and costly care, which typically yields poorer outcomes than primary and
preventive care practices.
Stakeholders discussed the fragmentation of health services and the gaps in services that are
available. According to stakeholders, there are several health services that are not readily available
in their region, specifically: outpatient Medicaid providers (dental, etc.), inpatient behavioral health
and substance abuse services, adequate outpatient behavioral health and substance abuse
services, care coordination, HIV services, primary care (rural areas), community based supportive
services for seniors. Stakeholders described disparate health resources with lower income
neighborhoods containing the fewest resources. The Medicaid Waiver provides some access to
care but does not cover prescription medications or specialty care. As a result, many community
based clinics do not have access to specialty care. Residents may have an undiagnosed illness that
they cannot afford to treat due to the cost of medications. Stakeholders discussed the lack of care
coordination provided for uninsured and underinsured residents, including seniors, who are
63

Community Health Needs Assessment Ochsner St. Anne General Hospital Tripp Umbach
seeking care in inappropriate settings like the emergency room. Several stakeholders mentioned
the benefits of home health care for care coordination, though Medicaid eligible residents,
reportedly, are not often approved for home health services.
Stakeholders noted that the need for accessible health care among medically vulnerable populations
(e.g., uninsured, low‐income, Medicaid insured, etc.) has an impact on the health status of residents in
a variety of ways and often leads to poorer heath outcomes. Several of the noted effects are:
Higher cost of health care that results from hospital readmissions and increased usage of costly
emergency medical care.
Residents delaying medical treatment and/or non‐compliant due to the lack of affordable
options and limited awareness of what options do exist.
Poor outcomes in adult, maternal, and pediatric care due to limited care coordination and lack
of patient compliance.
SOCIAL AND ENVIRONMENTAL DETERMINANTS OF HEALTH:
More than 90 percent of stakeholders discussed the social and environmental determinants of health
in communities served by Ochsner St. Anne General Hospital. The most common social and
environmental factors discussed by stakeholders were the lack of education and poverty on the health
of seniors, adults, children, and unborn children.
The topic of transportation was addressed by a few stakeholders and most often discussed in
relationship to residents seeking health care and healthy nutrition in rural areas. Often residents in
rural areas are not able to get to and from the health services they need. For this reason, stakeholders
indicated that rural residents often delay seeking health services until the issue becomes an emergency
and potential outcomes are often poor. The lack of adequate transportation impacts health in a variety
of ways by limiting the access residents have to healthy options like medical providers and grocery
stores with healthy produce. Additionally, the limitations of transportation may restrict the access
residents have to employment opportunities, which could be a barrier to insurance and financial
stability.
The greater New Orleans area and surrounding areas, including communities served by Ochsner St.
Anne General Hospital, are famous for the culture, food, and drinking. Stakeholders discussed the
impact that culture has on the practices, views, and health of residents. Stakeholders noted that the
culture of residents is close and supportive, but often centers around food and alcohol consumption.
Traditional diets of residents are reflective of culture and historically are high in fried and fatty foods.
Additionally, the tourism industry is focused on the party atmosphere and encourages excessive
consumption alcohol and foods that can be unhealthy. Stakeholders noted that changing behavior can
be difficult particularly when it is steeped in accepted cultural practices and supported by the economy
64

Community Health Needs Assessment Ochsner St. Anne General Hospital Tripp Umbach
of tourism. Excessive consumption of alcohol and fried foods can cause lifestyle diseases such as
cardiovascular disease, obesity, diabetes, and cancer.
Hurricane Katrina resulted in the displacement of residents as well as loss and extensive damage to
property. Post‐Katrina, housing has been overcrowded due to extended family living arrangements due
to damaged homes and an overall reduction in healthy safe living conditions. Stakeholders often
reminisced about the informal and numerous support networks for child care, transportation, etc. that
existed in areas where poverty was the highest. According to stakeholders, many residents practiced a
communal sharing of resources (child care, transportation, food, money, etc.). As a result of Katrina,
many residents had to move from the communities where they lived and lost access to these informal
networks.
The economy was discussed regarding the lack of opportunity many residents have. Stakeholders
addressed the high rates of poverty and the poor outcomes for residents in poverty. Discussions
focused on poverty as an explanation for the high prevalence of substance abuse, low educational
attainment, poor health, limited access to health services, etc. Often stakeholders pointed out that the
lack of opportunity, limited employment, and low educational attainment found in communities of
poverty cause residents to feel apathetic. Stakeholders noted that many residents live below the
federal poverty line. Stakeholders felt that the lack of education coupled with low exposure to healthy
resources causes residents in poverty to be unaware of healthy options. When residents are aware of
healthier choices they may perceive these options to be out of their reach e.g., healthy produce and
nutrition may not be viewed as consistently attainable due to a lack of grocery stores, limited
transportation, and cost.
Food security was discussed by stakeholders related to the health of seniors and youth. Grocery stores
are not often located in low‐income neighborhoods creating what is being called a “food desert”.
Youth and seniors residing in these food deserts may not have ready access to healthy nutrition due to
the lack of transportation options.
The education in charter schools was addressed as an issue related to the access youth have to physical
exercise throughout the day and education about reducing the spread of STIs and HIV. Stakeholders
felt that youth are not always getting their behavioral health needs met in the school systems due to
the lack of formal oversight for behavioral health in the school system. Additionally stakeholders
discussed the decline or absence of physical activity in the school system. Stakeholders felt that youth
are becoming obese for a variety of reasons, one of which is the limited exercise they may be
participating in during school hours.
Stakeholders discussed the level of health literacy among residents. Health literacy is influenced by
literacy levels, language barriers, and access to and understanding of technology. Stakeholders noted
that there is a high correlation between lower educational attainment and lower level of health
literacy. Stakeholders discussed languages spoken in the communities served by Ochsner St. Anne
65

Community Health Needs Assessment Ochsner St. Anne General Hospital Tripp Umbach
General Hospital and the need to ensure that health services are culturally competent and accessible
for residents who have limited English speaking abilities ‐ the language most referenced was Spanish.
Additionally, stakeholders felt that the movement toward electronic medical records, the use of online
applications, and internet based systems may leave some residents that do not have access to
computers and/or whom may be unfamiliar with computers without access to relevant health
information.
Stakeholders discussed the implications of social and environmental determinants of health to include
the following:
Lifestyle diseases such as obesity, diabetes, cancer, hypertension, and cardiovascular disease.
Higher rates of poor birth outcomes such as low birth weight.
Increased behavioral health symptoms of trauma i.e., risky behaviors, suicide, anxiety,
depression, violence, apathy, etc.
Poor birth outcomes (e.g., low birth weight) and limited access to healthy options.
NEED FOR BEHAVIORAL HEALTH INCLUDING SUBSTANCE ABUSE SERVICES:
Behavioral health services and issues were discussed separate from medical or dental health services,
with 80 percent of stakeholders identifying a health need related to behavioral health and/or
substance abuse. Stakeholders discussed the lack of behavioral health and substance abuse resources
in general and many noted that behavioral health and substance abuse needs are highest in the most
rural areas and communities with the highest rates of poverty. Stakeholders felt that there is a
connection between environmental factors and the prevalence of behavioral health and substance
abuse. Stakeholders felt that the culture of the area and local tourist industry encourages substance
abuse and identified tobacco, alcohol, prescription pain medications, heroin, and marijuana as the
most common substances being abused. Stakeholders also felt that substance abuse is often a way for
residents to self‐medicate or cope with behavioral health issues including stress and serious mental
illness (e.g., bipolar, schizophrenia, etc.).
Often communities with higher rates of poverty are also the areas with limited resources available to
treat diagnoses related to behavioral health and substance abuse. This is in part due to the low
reimbursement rates for behavioral health services. There is reportedly a resistance among behavioral
health providers to accept Medicaid insurance and the cost of uninsured behavioral health services is
unaffordable for residents who are Medicaid eligible.
Stakeholders noted that there has been a decrease in funding for behavioral health and substance
abuse services which has led to limited resources. While there are inpatient beds and outpatient
services available, they are located 30 miles away. Stakeholders indicated that behavioral health and
substance abuse services are not adequate enough to meet the demand in local communities. In
recent years there has been a decrease in the number of inpatient beds and crisis services have
66

Community Health Needs Assessment Ochsner St. Anne General Hospital Tripp Umbach
declined. Outpatient services often have lengthy waiting lists for diagnostic services as well as ongoing
treatment.
Stakeholders noted that behavioral health and substance abuse has an impact on the health status of
residents in a variety of ways and often leads to poorer heath outcomes. Several of the noted effects of
behavioral health and substance abuse are:
Higher suicide rates and incarceration rates for residents with mental illness.
Residents with a history of behavioral health and substance abuse do not always practice
healthy behaviors and may be non‐compliant with necessary medical treatments (i.e., HIV
treatments, etc.).
COMMON HEALTH CONCERNS:
More than 90 percent of stakeholders discussed specific health concerns of residents. The most
common health concerns discussed by stakeholders were obesity, diabetes, and heart disease.
1. Obesity – One half of stakeholders discussed the prevalence and cause of obesity among
residents in local communities. Stakeholders indicated that obesity is an issue among adults as
well as a growing problem among youth. Stakeholders identified social and environmental
determinants (e.g., culture, lack of awareness, limited access to healthy nutrition, etc.) as well
as personal choice and behaviors within the control of residents (e.g., choices about nutrition,
exercise, etc.) as driving the high rates of obesity.
2. Diabetes – More than one‐third of stakeholders discussed the prevalence and cause of diabetes
as a common health issue among residents. Stakeholders identified social and environmental
determinants (i.e., lack of awareness, limited access to primary care, food deserts, etc.) as well
as personal choice and behaviors within the control of residents (i.e., choices about nutrition,
exercise, etc.) as driving the high rates of diabetes.
3. Heart disease – More than one quarter of stakeholders discussed heart disease and
cardiovascular complications as a common health concern among residents. Stakeholders
identified social and environmental determinants (i.e., lack of awareness, culture, etc.) as well
as personal choice and behaviors within the control of residents (i.e., smoking, exercising, etc.)
as driving the high rates of heart disease.
The impact of common health issues can be poor health outcomes of a population and greater
consumption of health care resources.
PERSONAL BEHAVIORS THAT IMPACT HEALTH:
Approximately two‐thirds of the stakeholders interviewed discussed lifestyle choices that impact the
health status and subsequent health outcomes for residents. Stakeholders noted that there are factors
like smoking, lack of physical exercise, and risky behaviors that are related to the personal choices of
residents and influence health outcomes. The topic of personal choice was most often discussed in
67
Community Health Needs Assessment Ochsner St. Anne General Hospital Tripp Umbach
relationship to obesity, the prevalence of STIs, and cancer and respiratory issues related to smoking
and alcoholism. Note that these are also health concerns stakeholders felt were heavily influenced by
social and environmental determinants of health. It is this coupling of social/environmental and
personal choice determinants of health that present the greatest challenge to improving lifestyle
related diseases like diabetes, obesity, cancer, and STIs
Stakeholders recognized that there are social determinants that drive the rate of obesity such as food
deserts, lack of awareness about healthy food preparation, and the inability to exercise outdoors due
to a lack of safety; however, stakeholders also recognized that residents often make personal choices
based on preferences for unhealthy foods and limited motivation to exercise.
At the same time that stakeholders recognized that there are social and environmental determinants
of cancer and respiratory diseases like chemical run off from factories and pollution; they discussed the
personal choice to continue smoking as an additional factor that facilitates low birth weight, cancer,
COPD, and heart disease in communities where smoking rates are greatest.
While stakeholders understood the impact of social and environmental determinants such as youth not
learning the practices that reduce the spread of STIs and HIV in school settings; stakeholders also
recognized that parents are choosing not to provide education to their children about preventing the
spread of STIs and youth are making the decision to practice risky behaviors.
68

Community Health Needs Assessment Ochsner St. Anne General Hospital Tripp Umbach
Survey of Vulnerable Populations
Tripp Umbach worked closely with the CHNA oversight committee to ensure that community
members, including under‐represented residents, were included in the needs assessment through a
survey process.
DATA COLLECTION:
Vulnerable populations were identified by the CHNA oversight committee and through stakeholder
interviews. Vulnerable populations targeted by the surveys were: seniors, low‐income residents
(including families), uninsured, Latino, chronically ill, residents with a mental health history, homeless
residents, literacy challenged residents, residents with limited English speaking abilities, women of
child bearing age, diabetic, and residents with special needs.
Tripp Umbach worked with the oversight committee to design a 32 question health status survey. The
survey was administered by community based organizations providing services to vulnerable
populations in the hospital service area.
Community based organizations (CBOs) were trained to administer the survey using hand‐
distribution.
Surveys were administered on‐site and securely mailed to Tripp Umbach for tabulation and
analysis.
Surveys were analyzed using Statistical Packages for the Social Sciences (SPSS) software.
A total of 192 surveys were collected in the Ochsner St. Anne General Hospital service area which
provides a +/‐ 7.07 confidence interval for a 95% confidence level.
Limitations of Survey Collection:
There are several inherent limitations to using a hand‐distribution methodology that targeted
medically vulnerable and at‐risk populations in survey collection. Often, the demographic
characteristics of populations that are considered vulnerable populations are not the same as the
demographic characteristics of a general population. For example, vulnerable populations by nature
may have significantly less income than a general population. For this reason, the findings of this
survey are not relevant to the general population of the hospital service area, but are critical in
understanding the needs of the underserved population of the Ochsner St. Anne General Hospital
study area. Additionally, hand‐distribution is limited by the locations where surveys are administered.
In this case, Tripp Umbach asked CBOs to self‐select into the study and as a result there are several
populations that have greater representation in raw data (i.e., low‐income, women, etc.). These
limitations were unavoidable when surveying low‐income residents about health needs in their local
communities.
69

Community Health Needs Assessment Ochsner St. Anne General Hospital Tripp Umbach
Demographics:
Survey respondents were asked to provide basic anonymous demographic data.
Table 10: Survey Responses – Self‐Reported Age of Respondent
Age Respondents (%)
18‐24 10.6%
25‐34 14.4%
35‐44 18.6%
45‐54 22.9%
55‐64 25.5%
65‐74 5.9%
75‐84 1.6%
85+ 0.5%
Of the surveys gathered: 53.1% were female, 46.9% were male.
The majority of the survey respondents reported their race as Black or African American (45.6%),
the next largest racial group was White or Caucasian (41.5%), and third largest was ‘More Than One
Race’ (4.7%).
Table 11: Survey Responses – Self‐Reported Annual Income of Respondents
Income Respondents (%)
< $10k 25.6%
$10‐19,999 14.3%
$20‐29,999 13.1%
$30‐39,999 8.3%
$40‐49,999 4.8%
$50‐59,999 6.0%
$60‐69,999 3.6%
$70‐79,999 0.6%
$80‐99,999 2.4%
$100‐149,999 2.4%
The household income level categories with the most responses were ‘Less than $10,000’
(25.6%) and $10,000 ‐ $19,999 (14.3%)
53.0% of respondents reported less than $29,999 annual household income.
70

Community Health Needs Assessment Ochsner St. Anne General Hospital Tripp Umbach
Health care:
The most popular place for residents to seek care is a doctor’s office (52.4%), with ‘Free or
reduced cost clinics’ being the second most popular (17.3%), hospital clinics third (14.6%), and
ER and Urgent Care fourth (5.9%).
The most common responses to ‘What insurance do you have?’ was No Insurance (42.2%),
Private/Commercial (28.1%), and Medicaid only (14.1%).
The most common reason why individuals indicated that they do not have health insurance is
because they can’t afford it (56.9%).
30.9% of respondents could not see a doctor in the last 12 because of cost; this is much higher
than the state rate of 18.9%.
The majority of respondents had been examined by a physician within the last 12 months at
least once (64.6%).
20.9% of respondents reported not taking medications as prescribed in the last 12 months due
to cost.
The most common mode of transportation for survey respondents was their own car (78.8%).
Table 12. Survey Responses Related to HIV/AIDS Testing
Ever Been Tested for HIV Bayou Region LA* U.S.*
Yes 35.8% 43.5% 35.2%
No 64.2% 56.5% 64.8%
*Behavioral Risk Factor Surveillance System
The Bayou region reports a lower rate of HIV testing (35.8%) than the state (43.5%), but higher
than the U.S. (35.2%).
0
20
40
60
80
100
Percent of Responses
Bayou Region
Chart 19. Survey Results ‐Method of Regular Transportation
my car
family/friend car
public transportation
taxi/cab
walk
71
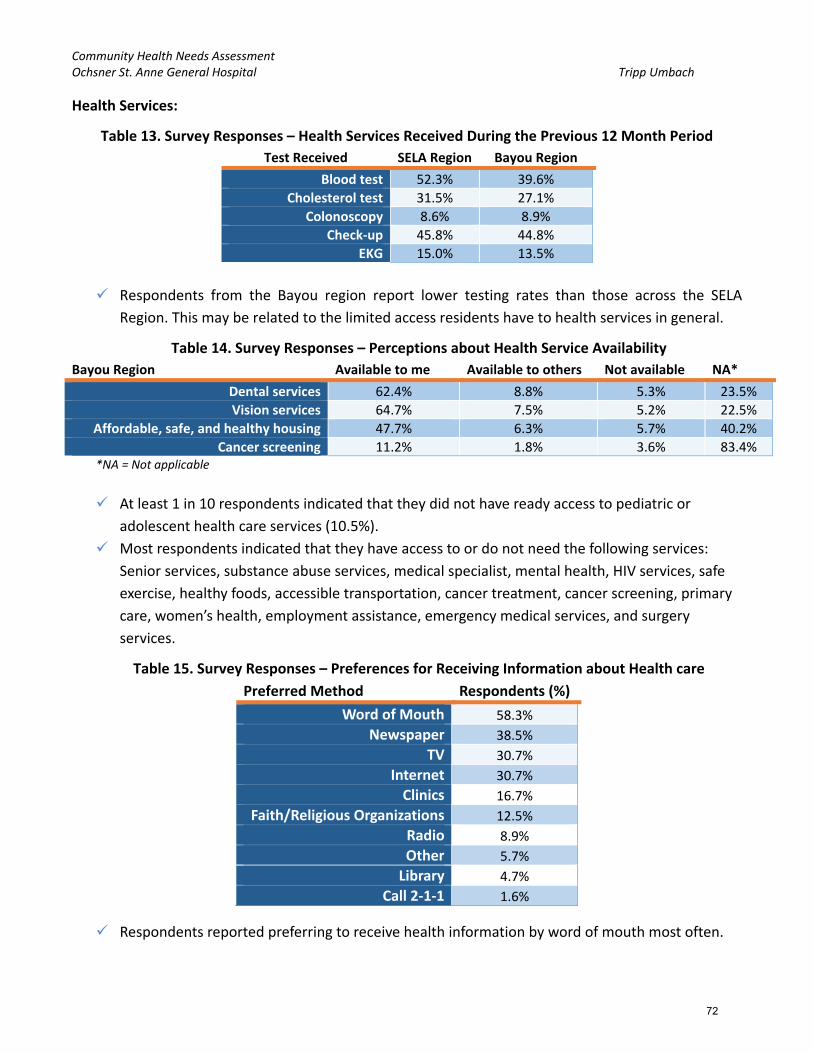
Community Health Needs Assessment Ochsner St. Anne General Hospital Tripp Umbach
Health Services:
Table 13. Survey Responses – Health Services Received During the Previous 12 Month Period
Test Received SELA Region Bayou Region
Blood test 52.3% 39.6%
Cholesterol test 31.5% 27.1%
Colonoscopy 8.6% 8.9%
Check‐up 45.8% 44.8%
EKG 15.0% 13.5%
Respondents from the Bayou region report lower testing rates than those across the SELA
Region. This may be related to the limited access residents have to health services in general.
Table 14. Survey Responses – Perceptions about Health Service Availability
Bayou Region Available to me Available to others Not available NA*
Dental services 62.4% 8.8% 5.3% 23.5%
Vision services 64.7% 7.5% 5.2% 22.5%
Affordable, safe, and healthy housing 47.7% 6.3% 5.7% 40.2%
Cancer screening 11.2% 1.8% 3.6% 83.4% *NA = Not applicable
At least 1 in 10 respondents indicated that they did not have ready access to pediatric or
adolescent health care services (10.5%).
Most respondents indicated that they have access to or do not need the following services:
Senior services, substance abuse services, medical specialist, mental health, HIV services, safe
exercise, healthy foods, accessible transportation, cancer treatment, cancer screening, primary
care, women’s health, employment assistance, emergency medical services, and surgery
services.
Table 15. Survey Responses – Preferences for Receiving Information about Health care
Preferred Method Respondents (%)
Word of Mouth 58.3%
Newspaper 38.5%
TV 30.7%
Internet 30.7%
Clinics 16.7%
Faith/Religious Organizations 12.5%
Radio 8.9%
Other 5.7%
Library 4.7%
Call 2‐1‐1 1.6%
Respondents reported preferring to receive health information by word of mouth most often.
72
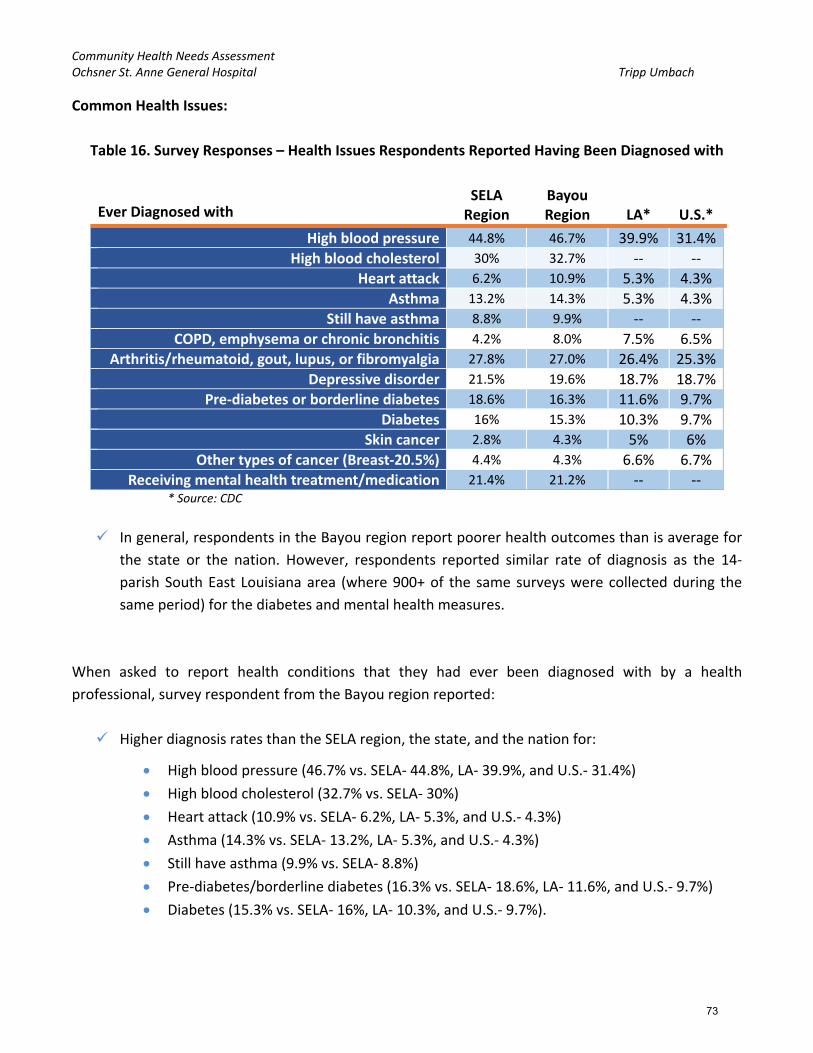
Community Health Needs Assessment Ochsner St. Anne General Hospital Tripp Umbach
Common Health Issues:
Table 16. Survey Responses – Health Issues Respondents Reported Having Been Diagnosed with
Ever Diagnosed with SELA Region
Bayou Region LA* U.S.*
High blood pressure 44.8% 46.7% 39.9% 31.4%
High blood cholesterol 30% 32.7% ‐‐ ‐‐
Heart attack 6.2% 10.9% 5.3% 4.3%
Asthma 13.2% 14.3% 5.3% 4.3%
Still have asthma 8.8% 9.9% ‐‐ ‐‐
COPD, emphysema or chronic bronchitis 4.2% 8.0% 7.5% 6.5%
Arthritis/rheumatoid, gout, lupus, or fibromyalgia 27.8% 27.0% 26.4% 25.3%
Depressive disorder 21.5% 19.6% 18.7% 18.7%
Pre‐diabetes or borderline diabetes 18.6% 16.3% 11.6% 9.7%
Diabetes 16% 15.3% 10.3% 9.7%
Skin cancer 2.8% 4.3% 5% 6%
Other types of cancer (Breast‐20.5%) 4.4% 4.3% 6.6% 6.7%
Receiving mental health treatment/medication 21.4% 21.2% ‐‐ ‐‐ * Source: CDC
In general, respondents in the Bayou region report poorer health outcomes than is average for
the state or the nation. However, respondents reported similar rate of diagnosis as the 14‐
parish South East Louisiana area (where 900+ of the same surveys were collected during the
same period) for the diabetes and mental health measures.
When asked to report health conditions that they had ever been diagnosed with by a health
professional, survey respondent from the Bayou region reported:
Higher diagnosis rates than the SELA region, the state, and the nation for:
High blood pressure (46.7% vs. SELA‐ 44.8%, LA‐ 39.9%, and U.S.‐ 31.4%)
High blood cholesterol (32.7% vs. SELA‐ 30%)
Heart attack (10.9% vs. SELA‐ 6.2%, LA‐ 5.3%, and U.S.‐ 4.3%)
Asthma (14.3% vs. SELA‐ 13.2%, LA‐ 5.3%, and U.S.‐ 4.3%)
Still have asthma (9.9% vs. SELA‐ 8.8%)
Pre‐diabetes/borderline diabetes (16.3% vs. SELA‐ 18.6%, LA‐ 11.6%, and U.S.‐ 9.7%)
Diabetes (15.3% vs. SELA‐ 16%, LA‐ 10.3%, and U.S.‐ 9.7%).
73

Community Health Needs Assessment Ochsner St. Anne General Hospital Tripp Umbach
More than 1 in 5 (21.2%) survey respondents indicated they have received mental health
treatment or medication at some point in their lives.
Table 17. Survey Responses – Top Health Concerns Reported
Health Concern SELA Region Bayou Region
Diabetes 50.8% 47.6%
High blood pressure 49.9% 42.9%
Drugs and Alcohol 47.7% 47.0
Cancer 42.1% 56.5%
Heart disease 38.5% 39.3%
When asked to identify five of the top health concerns in their communities; there was a great
deal of agreement between the two regions; Diabetes, High blood pressure, Drugs and Alcohol,
Cancer, and Heart disease rising to the top.
o Several of the additional choices that were not as popular were: adolescent health,
asthma, family planning / birth control, flood related health concerns (like mold),
hepatitis infections, HIV, maternal and child health, pollution (e.g., air quality, garbage),
sexually transmitted diseases, stroke, teen pregnancy, tobacco use, violence or injury,
other, and don’t know.
Lifestyle:
Table 18. Survey Responses – Average Body Mass Index (BMI) of Survey Respondents
Weight & BMI SELA Region Bayou Region Avg. Female (5’4”)* Avg. Male (5’9”)*
BMI** 29.3 29.9 26.5 26.6 * Source: CDC
** Survey Respondents were asked to report their weight and height, from which the BMI calculation was possible.
Respondents in both regions show higher weight and BMI than national and state averages
regardless of gender.
Most respondents reported having access to fresh fruits and vegetables (84.3%).
Table 19. Survey Responses – Self‐Reported Smoking Rates
Smoking SELA Region Bayou Region LA* U.S.*
Everyday 15.5% 19.0% 19.3% 15.4%
Some days 8.1% 8.2% 6.4% 5.7%
Not at all 74.7% 71.7% ‐‐ ‐‐ *Behavioral Risk Factor Surveillance System
Self‐reported smoking rates are lower in the regions studied than is average for the state, but
are higher than averages across the nation.
74

Community Health Needs Assessment Ochsner St. Anne General Hospital Tripp Umbach
Table 20. Survey Responses – Self‐Reported Physical Activity Rates
Physical Activities SELA Region Bayou Region U.S.*
Yes 57.3% 46.5% 74.7%
No 42.7% 53.5% 25.3%
*Behavioral Risk Factor Surveillance System
Respondents in both the SELA and Bayou regions report lower rates of physical activity than those reported for the nation.
75
Community Health Needs Assessment Ochsner St. Anne General Hospital Tripp Umbach
Conclusions and Recommended Next Steps The community needs identified through the Ochsner St. Anne General Hospital CHNA process are not
all related to the provision of traditional medical services provided by medical centers. However, the
top needs identified in this assessment do “translate” into a wide variety of health‐related issues that
may ultimately require hospital services. Each health need identified has an impact on population
health outcomes and ultimately the cost of healthcare in the region. For example: unmet behavioral
health and substance abuse needs lead to increased use of emergency health services, increased death
rates due to suicide, and higher consumption of other human service resources (e.g., the penal
system).
Ochsner St. Anne General Hospital, working closely with community partners, understands that the
CHNA document is only a first step in an ongoing process. It is vital that ongoing communication and a
strategic process follow the assessment – with a clear focus on addressing health priorities for the
most vulnerable residents in the hospital service area.
The hospital service area contains populations with higher socio‐economic needs (e.g., low‐income,
residents with a behavioral health history, unemployed, uninsured, Residents with limited English
speaking skills, residents that can not read, seniors, etc.); which presents a unique challenge for
hospital leadership when planning to meet the needs of all residents. With one of the lowest FQHC
ratios in Southeast Louisiana, and approximately 1 in 4 residents uninsured, it will be important to
continue to strive to address the primary care needs of the under/uninsured residents in Lafourche
Parish in a way that takes into consideration, the rural nature of the region, and the lack of
transportation. It is important to expand existing partnerships and build additional partnerships with
multiple community organizations when developing strategies to address the top identified needs.
Implementation strategies will need to consider the higher need areas (i.e., Houma, Golden Meadow,
and Gray) and health disparities among Native American residents, Asian residents, and African
American residents in the study area and address the multiple barriers to healthcare. It will be
necessary to review evidence based practices prior to planning to address any of the needs identified
in this assessment due to the complex interaction of the underlying factors at work driving the need in
local communities.
Tripp Umbach recommends the following actions be taken by the hospital sponsors in close
partnership with community organizations over the next five months.
76
Community Health Needs Assessment Ochsner St. Anne General Hospital Tripp Umbach
Recommended Action Steps:
Widely communicate the results of the CHNA document to Ochsner St. Anne General Hospital
staff, providers, leadership and boards.
Review the CHNA findings with a decision making body (e.g., a Board of Directors) for approval.
Make the CHNA widely available to community residents, as well as through multiple outlets
such as: the hospital website, neighborhood associations, stakeholders, community‐based
organizations, and employers.
Review relevant evidence‐based practices that the community has the capacity to implement.
Develop “Working Groups” to focus on specific strategies to address the top needs identified in
the CHNA. The working groups should meet for a period of four to six weeks to review
evidence‐based practices and develop action plans for each health priority which should include
the following:
Objectives
Anticipated impact
Target population
Planned action steps
Planned resource commitment
Collaborating organizations
Evaluation methods and metrics
Annual progress
77
Community Health Needs Assessment Ochsner St. Anne General Hospital Tripp Umbach
APPENDIX A
Community Resource Inventory OCHSNER ST. ANNE GENERAL HOSPITAL September, 2015
78

Organization/Provider Counties Served Contact Information Zip Code Column1 Internet Information Population Served Services Provided ACCE
SS T
O H
EALT
HCA
RE A
ND
MED
ICAL
SER
VICE
S
Lim
ited
avai
labi
lity
of a
ffor
dabl
e pr
even
tive
care
Lim
ited
avai
labi
lity
of m
edic
al p
rofe
ssio
nals
Cost
ly fe
es th
at m
ay b
e un
affo
rdab
le fo
r som
e re
side
nts
Cost
of h
ealth
insu
ranc
e
Tran
spor
tatio
n av
aila
bilit
y
Coor
dina
tion
of h
ealth
care
Pedi
atric
Hea
lth C
are
BEH
AVIO
RAL
HEA
LTH
AN
D S
UBS
TAN
CE A
BUSE
Men
tal h
ealth
Subs
tanc
e ab
use
Pedi
atric
Beh
avio
ral h
ealth
(psy
chia
try,
cou
nsel
ing,
et
c.)
RESO
URC
E AW
AREN
ESS
AND
HEA
LTH
LIT
ERAC
Y
Lim
ited
info
rmat
ion
diss
emin
atio
n
Serv
ices
for L
atin
o/Vi
etna
mes
e re
side
nts (
incl
udin
g tr
ansl
atio
n se
rvic
es)
Colla
bora
tion
of b
usin
ess,
hos
pita
ls a
nd c
omm
uniti
es
Lim
ited
outr
each
serv
ice
prov
isio
n
ACCE
SS T
O H
EALT
HY
OPT
ION
S
Hea
lthy
nutr
ition
Recr
eatio
nal a
ctiv
ities
ava
ilabi
lity
Publ
ic tr
ansp
orta
tion
avai
labi
lity
Supe
rvis
ion
of y
oung
peo
ple
BEH
AVIO
RS T
HAT
IMPA
CT H
EALT
H
AGENDA FOR CHILDREN No restrictions 1340 West Tunnel Blvd, Suite 550Houma, LA 70360P: (985) 446-8330
70360 Terrebonne www.agendaforchildren.org Children and families Supports community programs that promote and support children. Raises awareness for children's issues.
* X X X X * X *Assisi Bridge House No restrictions 600 Bull Run Road
Schriever, LA 70395Phone: (985) 872-5529
70395 Terrebonne More Information No restrictions Provides substance abuse services.
* X
BEACON BEHAVIORAL HOSPITAL No restrictions 5789 Highway 311, Suite 2Houma, LA 70360985-346-0436
70360 Terrebonne http://beaconbh.com.kntrl2.com/about-us
No restrictions Provides behavioral and mental health care.
* X X X X X * X * X X X X *BERGERON MOBILE HEALTH SERVICE
St. Charles, St. John the Baptist
101 Regency Lane Houma, LA 70360Phone: (985) 637-3957
70360 Terrebonne No restrictions Provides non-emergency medical transportation.
* X
DICKERSON TRANSPORTATION St. Charles, St. John the Baptist
116 NOTRE DAME ST THIBODAUX , LA 70301 (985) 448-1314
70301 Lafourche No restrictions Provides non-emergency medical transportation.
* X
FAMILIES HELPING FAMILIES BAYOU LAND
St. Charles, St. John the Baptist
286 Highway 3185Thibodaux, LA 70301985-447-4461
70301 Lafourche www.blfhf.org Residents of St. Charles and St. John the Baptist Parishes that are disabled and their families.
Provides individualized services, information, resources and support to positively enhance the independence, productivity and inclusion of individuals with disabilities.
* X X X X
GOOD EARTH TRANSIT Terrebonne 137 Intracoastal DriveHouma LA 70361(985) 850-4616
70361 Terrebonne http://www.tpcg.org/index.php?f=public_transit&p=bus_schedule
City of Houma, City of Thibodaux
Provides public transportation services.
* X * X
GULF COAST SOCIAL SERVICES St. John the Baptist, St. Charles
2509 Petroleum DriveHouma, LA 70363(985) 853-1445
70363 Terrebonne http://www.gctfs.org/about_us.php Persons with disabilites Provides services and access to resources for people with disabilities. * X X X X X X * X X X * X X *
GULF COAST SOCIAL SERVICES St. John the Baptist, St. Charles
320 Progressive BoulevardHouma, LA 70360(985) 851-4488
70360 Terrebonne http://www.gctfs.org/about_us.php Persons with disabilites Provides services and access to resources for people with disabilities. * X X X X X X * X X X * X X *
GULF COAST SOCIAL SERVICES St. John the Baptist, St. Charles
320 Progressive BoulevardHouma, LA 70360(985) 851-4488
70360 Terrebonne http://www.gctfs.org/about_us.php Persons with disabilites Provides services and access to resources for people with disabilities. * X X X X X X * X X X * X X *
LAFOURCHE ARC Lafourche P. O. Box 269, 100 West MainThibodaux LA 70302Phone: 985 447-6214
70302 Lafourche http://www.lafourchearc.com/Default.aspx?p=Services
Individuals with intellectual disabilities and their families.
Arc provides various services throughout the entire community including Family Services Coordination, Respite, Personal Care, Employment/Habitation and Supported Living Assistance.
* X X X X X * X X * X X X X * X X X *LAFOURCHE COUNCIL ON AGING Lafourche 4876 Highway 1
Mathews, LA 70375Phone: (985) 532-0457
70375 Lafourche http://lafourchecoa.org/html/contact.html
Seniors of Lafourche Parish Provides programs for seniors including access to social services, wellness, transportation, nutrition, recreation, physical activity and social opportunities.
* X X X X X X * X X * X X X X * X X X *Lafourche Parish Drug Treatment Court
Lafourche 201 Green StreetThibodaux, LA 70301Phone: (985) 446-1970
70301 Lafourche More Information No restrictions Provides substance abuse services.
* X
LAFOURCHE PARISH HEAD START
Lafourche Thibodaux Head Start2555 Veterans BlvdThibodaux, LA 70301PHONE:(985) 447-3665
70301 Lafourche http://www.lafourchegov.org/Home/Components/FacilityDirectory/FacilityDirectory/159/327
Children The program establishes a supportive learning environment for children, parents, and staff; giving them enhanced awareness, refined skills, and increased understanding of values. Head Start embraces a comprehensive vision of healthcare for children and families.
* X X X X X X * X X X X * X X X *
LAFOURCHE PARISH HEAD START
Lafourche Marydale Head Start102 W Park AveThibodaux, LA 70301PHONE:(985) 448-1050
70301 Lafourche http://www.lafourchegov.org/Home/Components/FacilityDirectory/FacilityDirectory/161/327
Children The program establishes a supportive learning environment for children, parents, and staff; giving them enhanced awareness, refined skills, and increased understanding of values. Head Start embraces a comprehensive vision of healthcare for children and families.
* X X X X X X * X X X X * X X X *
LAFOURCHE PARISH HEAD START
Lafourche Martin Luther King Head Start1445 Martin Luther King DrThibodaux, LA 70301PHONE:(985) 449-0888
70301 Lafourche http://www.lafourchegov.org/Home/Components/FacilityDirectory/FacilityDirectory/163/327
Children The program establishes a supportive learning environment for children, parents, and staff; giving them enhanced awareness, refined skills, and increased understanding of values. Head Start embraces a comprehensive vision of healthcare for children and families.
* X X X X X X * X X X X * X X X *
LAFOURCHE PARISH HEAD START
Lafourche Bayou Blue Head Start197 Mazerac StHouma, LA 70364PHONE:(985) 857-8370
70364 Lafourche http://www.lafourchegov.org/Home/Components/FacilityDirectory/FacilityDirectory/165/327
Children The program establishes a supportive learning environment for children, parents, and staff; giving them enhanced awareness, refined skills, and increased understanding of values. Head Start embraces a comprehensive vision of healthcare for children and families.
* X X X X X X * X X X X * X X X *
LAFOURCHE PARISH HEAD START
Lafourche Myra G. Champagne Head Start203 E Fontinelle StLockport, LA 70374PHONE:(985) 532-3911
70374 Lafourche http://www.lafourchegov.org/Home/Components/FacilityDirectory/FacilityDirectory/167/327
Children The program establishes a supportive learning environment for children, parents, and staff; giving them enhanced awareness, refined skills, and increased understanding of values. Head Start embraces a comprehensive vision of healthcare for children and families.
* X X X X X X * X X X X * X X X *
LAFOURCHE PARISH HEAD START
Lafourche South Lafourche Head Start16241 E Main StCut Off, LA 70345PHONE:(985) 632-1260
70345 Lafourche http://www.lafourchegov.org/Home/Components/FacilityDirectory/FacilityDirectory/169/327
Children The program establishes a supportive learning environment for children, parents, and staff; giving them enhanced awareness, refined skills, and increased understanding of values. Head Start embraces a comprehensive vision of healthcare for children and families.
* X X X X X X * X X X X * X X X *
INVENTORY OF COMMUNITY RESOURCES AVAILABLE TO ADDRESS COMMUNITY HEALTH NEEDS IDENTIFIED IN THE MHCNO CHNA
Tripp Umbach completed an inventory of community resources available in the Ochsner St. Anne General Hospital service area using resources identified by the hospital leadership, internet research and United Way’s 211 First Call for Help community resource database. Using the zip codes which define the Ochsner St. Anne General Hospital community (70030, 70070, 70080, 70301, 70345, 70354, 70355, 70357, 70359, 70360, 70363, 70364, 70373, 70374, 70375, and 70394) more than 65 community resources were identified with the capacity to meet the three community health needs identified in the Ochsner St. Anne General Hospital CHNA. (Please refer to the Community Health Needs Assessment Report to review the detailed community needs.)
79

Organization/Provider Counties Served Contact Information Zip Code Column1 Internet Information Population Served Services Provided ACCE
SS T
O H
EALT
HCA
RE A
ND
MED
ICAL
SER
VICE
S
Lim
ited
avai
labi
lity
of a
ffor
dabl
e pr
even
tive
care
Lim
ited
avai
labi
lity
of m
edic
al p
rofe
ssio
nals
Cost
ly fe
es th
at m
ay b
e un
affo
rdab
le fo
r som
e re
side
nts
Cost
of h
ealth
insu
ranc
e
Tran
spor
tatio
n av
aila
bilit
y
Coor
dina
tion
of h
ealth
care
Pedi
atric
Hea
lth C
are
BEH
AVIO
RAL
HEA
LTH
AN
D S
UBS
TAN
CE A
BUSE
Men
tal h
ealth
Subs
tanc
e ab
use
Pedi
atric
Beh
avio
ral h
ealth
(psy
chia
try,
cou
nsel
ing,
et
c.)
RESO
URC
E AW
AREN
ESS
AND
HEA
LTH
LIT
ERAC
Y
Lim
ited
info
rmat
ion
diss
emin
atio
n
Serv
ices
for L
atin
o/Vi
etna
mes
e re
side
nts (
incl
udin
g tr
ansl
atio
n se
rvic
es)
Colla
bora
tion
of b
usin
ess,
hos
pita
ls a
nd c
omm
uniti
es
Lim
ited
outr
each
serv
ice
prov
isio
n
ACCE
SS T
O H
EALT
HY
OPT
ION
S
Hea
lthy
nutr
ition
Recr
eatio
nal a
ctiv
ities
ava
ilabi
lity
Publ
ic tr
ansp
orta
tion
avai
labi
lity
Supe
rvis
ion
of y
oung
peo
ple
BEH
AVIO
RS T
HAT
IMPA
CT H
EALT
H
LAFOURCHE PARISH HEAD START
Lafourche Rev. Lloyd Wallace Head Start & Community Center3603 LA-308Raceland, LA 70394PHONE:(985) 537-3402
70394 Lafourche http://www.lafourchegov.org/Home/Components/FacilityDirectory/FacilityDirectory/377/327
Children The program establishes a supportive learning environment for children, parents, and staff; giving them enhanced awareness, refined skills, and increased understanding of values. Head Start embraces a comprehensive vision of healthcare for children and families.
* X X X X X X * X X X X * X X X *
LAFOURCHE PARISH OFFICE OF COMMUNITY ACTION
Lafourche 16241 East Main Street - Suite B10Galliano, LA 70354tel:9856323989
70354 Lafourche http://www.lafourchegov.org/government/departments/office-of-community-action/about-lafourche-parish-office-of-community-action-oca-
Residents of Lafourche Parish
Provides community assistance programs, food pantry, and access to social services.
* X X X X * X X X X * X
LAFOURCHE PARISH OFFICE OF COMMUNITY ACTION
Lafourche 2535 Veterans BlvdThibodaux, LA 70301tel:9854466731
70301 Lafourche http://www.lafourchegov.org/government/departments/office-of-community-action/about-lafourche-parish-office-of-community-action-oca-
Residents of Lafourche Parish
Provides community assistance programs, food pantry, and access to social services.
* X X X X * X X X X * X
LAFOURCHE PARISH OFFICE OF COMMUNITY ACTION
Lafourche 4876 Hwy 1Mathews, LA 70375tel:9855377603
70375 Lafourche http://www.lafourchegov.org/government/departments/office-of-community-action/about-lafourche-parish-office-of-community-action-oca-
Residents of Lafourche Parish
Provides community assistance programs, food pantry, and access to social services.
* X X X X * X X X X * X
LAFOURCHE PARISH PUBLIC LIBRARY
Lafourche 1403 North Bayou DriveGolden Meadow, LA 70357Telephone/Fax 985-475-5660
70357 Lafourche http://www.lafourche.org/ Residents of Lafourche Parish
Provides educational programing for all ages, community activities, meeting rooms, internet access, and health awareness.
* X X X X * X *LAFOURCHE PARISH PUBLIC LIBRARY
Lafourche 153 North Leon DriveGheens, LA 70355Telephone/Fax 985-532-2288
70355 Lafourche http://www.lafourche.org/ Residents of Lafourche Parish
Provides educational programing for all ages, community activities, meeting rooms, internet access, and health awareness.
* X X X X * X *LAFOURCHE PARISH PUBLIC LIBRARY
Lafourche 16241 East Main St.Cut Off, LA 70345Telephone 985-632-7140
70345 Lafourche http://www.lafourche.org/ Residents of Lafourche Parish
Provides educational programing for all ages, community activities, meeting rooms, internet access, and health awareness.
* X X X X * X *LAFOURCHE PARISH PUBLIC LIBRARY
Lafourche 177 Recreation Dr.Raceland, LA 70394Telephone/Fax 985-537-6875
70394 Lafourche http://www.lafourche.org/ Residents of Lafourche Parish
Provides educational programing for all ages, community activities, meeting rooms, internet access, and health awareness.
* X X X X * X *LAFOURCHE PARISH PUBLIC LIBRARY
Lafourche 1887 Choctaw Rd.Thibodaux, LA 70301Telephone/Fax 985-633-6453
70301 Lafourche http://www.lafourche.org/ Residents of Lafourche Parish
Provides educational programing for all ages, community activities, meeting rooms, internet access, and health awareness.
* X X X X * X *LAFOURCHE PARISH PUBLIC LIBRARY
Lafourche 198 Mazerac St.Houma, LA 70364Telephone/Fax 985-580-0634
70364 Lafourche http://www.lafourche.org/ Residents of Lafourche Parish
Provides educational programing for all ages, community activities, meeting rooms, internet access, and health awareness.
* X X X X * X *LAFOURCHE PARISH PUBLIC LIBRARY
Lafourche 305 East Fifth StreetLarose, LA 70373Telephone/Fax 985-693-3336
70373 Lafourche http://www.lafourche.org/ Residents of Lafourche Parish
Provides educational programing for all ages, community activities, meeting rooms, internet access, and health awareness.
* X X X X * X *LAFOURCHE PARISH PUBLIC LIBRARY
Lafourche 314 Saint Mary St.Thibodaux, LA 70301Telephone 985-446-1163
70301 Lafourche http://www.lafourche.org/ Residents of Lafourche Parish
Provides educational programing for all ages, community activities, meeting rooms, internet access, and health awareness.
* X X X X * X *LAFOURCHE PARISH PUBLIC LIBRARY
Lafourche 705 West Fifth StreetThibodaux, LA 70301Telephone 985-447-4119
70301 Lafourche http://www.lafourche.org/ Residents of Lafourche Parish
Provides educational programing for all ages, community activities, meeting rooms, internet access, and health awareness.
* X X X X * X *LAFOURCHE PARISH PUBLIC LIBRARY
Lafourche 720 Crescent Ave.Lockport, LA 70374Telephone 985-532-3158
70374 Lafourche http://www.lafourche.org/ Residents of Lafourche Parish
Provides educational programing for all ages, community activities, meeting rooms, internet access, and health awareness.
* X X X X * X *OCHSNER HEALTH SYSTEM No restrictions Leonard J. Chabert Medical Center
1978 Industrial Blvd.Houma, LA 70363Phone: 985-873-2200
70363 Terrebonne More Information No restrictions Provides primary, preventive, specialty, and emergency health care services. * X X X X X X X * X X X * X X X X * X X X X *
OCHSNER HEALTH SYSTEM No restrictions Ochsner Family Doctor Clinic - Mathews111 Acadia DriveRaceland, LA 70394
70394 Lafourche More Information No restrictions Provides primary and preventive health care.
* X X X X X X X * X X X * X X X X * X X X X *OCHSNER HEALTH SYSTEM No restrictions Ochsner Health Center - Raceland
106 Cypress StreetRaceland, LA 70394Phone: 985-537-2273
70394 Lafourche More Information No restrictions Provides primary, preventive and specialty health care. * X X X X X X X * X X X * X X X X * X X X X *
OCHSNER HEALTH SYSTEM No restrictions Ochsner Specialty Health Center - Raceland141 Twin OaksRaceland, LA 70394Phone: 985-537-2666
70394 Lafourche More Information No restrictions Provides primary, preventive, specialty, and pediatric specialty health care. * X X X X X X X * X X X * X X X X * X X X X *
OCHSNER HEALTH SYSTEM No restrictions Ochsner St. Anne Hospital4608 Highway 1Raceland, LA 70394Phone: 985-537-6841
70394 Lafourche More Information No restrictions Provides primary, preventive, specialty, and emergency health care. * X X X X X X X * X X X * X X X X * X X X X *
OCHSNER HEALTH SYSTEM No restrictions Ochsner Women's Health Center - Raceland104 Acadia Park DriveRaceland, LA 70394Phone: 985-537-3211
70394 Lafourche More Information No restrictions Provides women's health care.
* X X X X X X X * X X X * X X X X * X X X X *Options for Independence No restrictions 8326 Main Street, Building #3
Houma, Louisiana 70363-4871Phone:(985) 868-2620
70363 Terrebonne http://optionsforindependence.com/ No restrictions Provides behavioral health, mental health, and substance abuse services. * X X X *
RIVER PARISHES TRANSIT AUTHORITY
St. Charles, St. John the Baptist
149 Woodland Dr.LaPlace, LA 70068Phone: (504) 304-2000
70068 http://rptarolls.org/ Residents of St. Charles and St. John the Baptist Parishes
Provides public transportation services.
* X * X
SOUTH CENTRAL LOUISIANNA HUMAN SERVICES AUTHORITY
Lafourche, St. Charles, St. John, and Terrebonne
521 Legion AvenueHouma, LA 70364985.858.2931
70364 Lafourche http://www.sclhsa.org/ Residents of Lafourche, St. Charles, St. John, and Terrebonne Parishes
Provides primary health care, addictive disorder, developmental disability and mental health services for adults and children. * X X X X X * X X X * X X X * X X *
SOUTH CENTRAL LOUISIANNA HUMAN SERVICES AUTHORITY
Lafourche, St. Charles, St. John, and Terrebonne
Lafourche Behavioral Health Center157 Twin Oaks DriveRaceland, LA 70394Phone: 985.537.6823
70394 Lafourche http://www.sclhsa.org/ Residents of Lafourche, St. Charles, St. John, and Terrebonne Parishes
Provides primary health care, addictive disorder, developmental disability and mental health services for adults and children. * X X X X X * X X X * X X X * X X *
80

Organization/Provider Counties Served Contact Information Zip Code Column1 Internet Information Population Served Services Provided ACCE
SS T
O H
EALT
HCA
RE A
ND
MED
ICAL
SER
VICE
S
Lim
ited
avai
labi
lity
of a
ffor
dabl
e pr
even
tive
care
Lim
ited
avai
labi
lity
of m
edic
al p
rofe
ssio
nals
Cost
ly fe
es th
at m
ay b
e un
affo
rdab
le fo
r som
e re
side
nts
Cost
of h
ealth
insu
ranc
e
Tran
spor
tatio
n av
aila
bilit
y
Coor
dina
tion
of h
ealth
care
Pedi
atric
Hea
lth C
are
BEH
AVIO
RAL
HEA
LTH
AN
D S
UBS
TAN
CE A
BUSE
Men
tal h
ealth
Subs
tanc
e ab
use
Pedi
atric
Beh
avio
ral h
ealth
(psy
chia
try,
cou
nsel
ing,
et
c.)
RESO
URC
E AW
AREN
ESS
AND
HEA
LTH
LIT
ERAC
Y
Lim
ited
info
rmat
ion
diss
emin
atio
n
Serv
ices
for L
atin
o/Vi
etna
mes
e re
side
nts (
incl
udin
g tr
ansl
atio
n se
rvic
es)
Colla
bora
tion
of b
usin
ess,
hos
pita
ls a
nd c
omm
uniti
es
Lim
ited
outr
each
serv
ice
prov
isio
n
ACCE
SS T
O H
EALT
HY
OPT
ION
S
Hea
lthy
nutr
ition
Recr
eatio
nal a
ctiv
ities
ava
ilabi
lity
Publ
ic tr
ansp
orta
tion
avai
labi
lity
Supe
rvis
ion
of y
oung
peo
ple
BEH
AVIO
RS T
HAT
IMPA
CT H
EALT
H
SOUTH CENTRAL LOUISIANNA HUMAN SERVICES AUTHORITY
Lafourche, St. Charles, St. John, and Terrebonne
Terrebonne Behavioral Health Center5599 Highway 311Houma, LA 70360Phone: 985.857.3615
70360 Terrebonne http://www.sclhsa.org/ Residents of Lafourche, St. Charles, St. John, and Terrebonne Parishes
Provides primary health care, addictive disorder, developmental disability and mental health services for adults and children. * X X X X X * X X X * X X X * X X *
TECHE ACTION CLINIC No restrictions 1014 West Tunnel Blvd.Houma, LA 70360Ph: (985) 851-1717
70360 Terrebonne http://www.tabhealth.org/services No restrictions Provides primary, preventive, behavioral, and women's health care, health education, nutrition education, and access to WIC and Medicaid. * X X X X X X X * X X * X X X X * X *
TECHE ACTION CLINIC No restrictions 1709 Ridgefield Rd.Thibodaux, LA 70301Ph: (985) 446-7341
70301 Lafourche http://www.tabhealth.org/services No restrictions Provides primary, preventive, behavioral, and women's health care, health education, nutrition education, and access to WIC and Medicaid. * X X X X X X X * X X * X X X X * X *
TECHE ACTION CLINIC No restrictions 189 Mozart DriveHouma, LA 70363Ph: (985) 868-3700
70363 Terrebonne http://www.tabhealth.org/services No restrictions Provides primary, preventive, behavioral, and women's health care, health education, nutrition education, and access to WIC and Medicaid. * X X X X X X X * X X * X X X X * X *
Terrebonne Arc (TARC) Terrebonne No. 1 McCord RoadHouma, LA 70363Office: 985-876-4465
70363 Terrebonne http://www.terrebonnearc.org/contact-us/
Individuals with intellectual disabilities and their families.
Arc provides various services throughout the entire community including transportation, Family Services Coordination, Respite, Personal Care, Employment/Habitation and Supported Living Assistance.
* X X X X X X X * X X * X X X X * X X X *TERREBONNE COUNCIL ON AGING, INC.
Terrebonne 995 West Tunnel BlvdHouma LA 70360-5557Phone: (985) 868-8411
70360 Terrebonne http://louisianacouncilsonaging.com/Terrebonne_Parish.html
Seniors Provides programs for seniors including access to social services, wellness, transportation, nutrition, recreation, physical activity and social opportunities.
* X X X X X X * X X * X X X X * X X X *TERREBONNE GENERAL MEDICAL CENTER
No restrictions 8166 Main StreetHouma, LA 70360Phone: 9858735292
70360 Terrebonne http://www.tgmc.com/contact/ No restrictions Provides primary, preventive, specialty, and women's health care. South Central Application Center for Medicaid.
* X X X X X X * X X X X * X *Terrebonne Parish Drug Court Treatment
Terrebonne 118 Armour DriveHouma, LA 70364Phone: (985) 876-2554
70364 Lafourche More Information No restrictions Provides substance abuse services.
* X
TERREBONNE PARISH LIBRARY Terrebonne 1135 Highway 55Montegut, LA 70377Phone: 985.594.4390
70377 Terrebonne http://mytpl.org/ Residents of Terrebonne Parish
Provides educational programing for all ages, community activities, meeting rooms, internet access, and health awareness.
* X X X X * X *TERREBONNE PARISH LIBRARY Terrebonne 151 Library Drive
Houma, LA 70360Phone: 985.876.5861
70360 Terrebonne http://mytpl.org/ Residents of Terrebonne Parish
Provides educational programing for all ages, community activities, meeting rooms, internet access, and health awareness.
* X X X X * X *TERREBONNE PARISH LIBRARY Terrebonne 200 Badou Drive
Dulac, LA 70353Phone: 985.563.2014
70353 Terrebonne http://mytpl.org/ Residents of Terrebonne Parish
Provides educational programing for all ages, community activities, meeting rooms, internet access, and health awareness.
* X X X X * X *TERREBONNE PARISH LIBRARY Terrebonne 4130 West Park Ave.
Gray, LA 70359Phone: 985.868.3050
70359 Terrebonne http://mytpl.org/ Residents of Terrebonne Parish
Provides educational programing for all ages, community activities, meeting rooms, internet access, and health awareness.
* X X X X * X *TERREBONNE PARISH LIBRARY Terrebonne 4405 St. Andrew Street
Bourg, LA 70343Phone: 985.594.4717
70343 Terrebonne http://mytpl.org/ Residents of Terrebonne Parish
Provides educational programing for all ages, community activities, meeting rooms, internet access, and health awareness.
* X X X X * X *TERREBONNE PARISH LIBRARY Terrebonne 5500 Highway 56
Chauvin, LA 70344Phone: 985.594.9771
70344 Terrebonne http://mytpl.org/ Residents of Terrebonne Parish
Provides educational programing for all ages, community activities, meeting rooms, internet access, and health awareness.
* X X X X * X *TERREBONNE PARISH LIBRARY Terrebonne 6363 S. Bayou Black Drive
Gibson, LA 70356Phone: 985.575.2639
70356 Terrebonne http://mytpl.org/ Residents of Terrebonne Parish
Provides educational programing for all ages, community activities, meeting rooms, internet access, and health awareness.
* X X X X * X *TERREBONNE PARISH LIBRARY Terrebonne 778 Grand Caillou Road
Houma, LA 70363Phone: 985.876.7072
70363 Terrebonne http://mytpl.org/ Residents of Terrebonne Parish
Provides educational programing for all ages, community activities, meeting rooms, internet access, and health awareness.
* X X X X * X *TERREBONNE PARISH LIBRARY Terrebonne 837 Bayou Dularge Road
Houma, LA 70363Phone: 985.851.1752
70363 Terrebonne http://mytpl.org/ Residents of Terrebonne Parish
Provides educational programing for all ages, community activities, meeting rooms, internet access, and health awareness.
* X X X X * X *THIBODAUX REGIONAL MEDICAL CENTER
No restrictions 602 N. Acadia RoadThibodaux, LA 70301Phone: 9854934772
70301 Lafourche http://www.thibodaux.com/Centers-and-Services.aspx
No restrictions Provides primary, preventive, specialty, behavioral, pediatric, and women's health care and health education services. South Central Application Center for Medicaid.
* X X X X X X * X X * X X X X * X *TOWNSEND No restrictions 1340 W. Tunnel Blvd. Ste 310
Houma, LA 70360985-746-3946
70360 Terrebonne http://townsendla.com/locations/houma-la/
No restrictions Provides substance abuse services.
* X
YOUTH SERVICE BUREAU No restrictions 150 Cleveland Avenue Slidell, LA 70438Client Services: 985-643-5746
70438 http://www.ysbworks.com/contact.php
Youth Provides substance abuse services.
* X X X
YOUTH SERVICE BUREAU No restrictions 314 & 316 Austin Street Bogalusa, LA 70427Client Services: 985-735-1687
70427 http://www.ysbworks.com/contact.php
Youth Provides substance abuse services.
* X X X
YOUTH SERVICE BUREAU No restrictions 911 Washington Street Franklinton, LA 70438Office: 985-839-4090
70438 http://www.ysbworks.com/contact.php
Youth Provides substance abuse services.
* X X X
81
Community Health Needs Assessment Ochsner St. Anne General Hospital Tripp Umbach
APPENDIX B
SecondaryData Profile OCHSNER ST. ANNE GENERAL HOSPITAL August, 2015
82

Community Health Needs Assessment Ochsner St. Anne General Hospital Tripp Umbach
Ochsner St. Anne General Hospital Study Area Definition
While community can be defined in many ways, for the purposes of this report, the Ochsner St. Anne
General Hospital (Ochsner St. Anne) community is defined as 16 zip codes – including 3
parishes/counties that hold a large majority (80%) of the inpatient discharges for the hospital (See
Table 1 and Figure 1).
Table 1. Ochsner St. Anne Study Area Definition – Zip Codes
City Zip Code Parish/County City Zip Code Parish/County Thibodaux 70301 Lafourche Parish Raceland 70394 Lafourche Parish
Cut Off 70345 Lafourche Parish Des Allemands 70030 St. Charles Parish
Galliano 70354 Lafourche Parish Luling 70070 St. Charles Parish
Gheens 70355 Lafourche Parish Paradis 70080 St. Charles Parish
Golden Meadow 70357 Lafourche Parish Gray 70359 Terrebonne Parish
Larose 70373 Lafourche Parish Houma 70360 Terrebonne Parish
Lockport 70374 Lafourche Parish Houma 70363 Terrebonne Parish
Mathews 70375 Lafourche Parish Houma 70364 Terrebonne Parish
Figure 1. Map of Ochsner St. Anne General Hospital Study Area
83

Community Health Needs Assessment Ochsner St. Anne General Hospital Tripp Umbach
Demographic Data
Tripp Umbach gathered data from Truven Health Analytics, Inc. to assess the demographics of the
Ochsner St. Anne General Hospital (Ochsner St. Anne) study area. Information pertaining to
population change, gender, age, race, ethnicity, education level, housing, income, and poverty data are
presented below.
Population Change
• The Ochsner St. Anne study area encompasses more than 203,000 residents.
• In 2015, the largest parish in the study area is Terrebonne Parish with 119,649 residents.
• From 2015 to 2020, Terrebonne Parish is projected to experience the largest percentage
change in population with a 2.9% increase and the largest rise in number of residents (3,518
people).
Table 2. Population Size and Change Projections 2015, 2020
Ochsner
St. Anne
Study Area
Lafourche
Parish
Terrebonne
Parish Louisiana USA
2015 Total
Population 203,398 91,499 119,649 4,662,874 319,459,991
2020 Projected
Population 207,924 92,778 123,167 4,800,027 330,689,265
# Change 4,526 1,279 3,518 137,153 11,229,374
% Change 2.2% 1.4% 2.9% 2.9% 3.5%
84
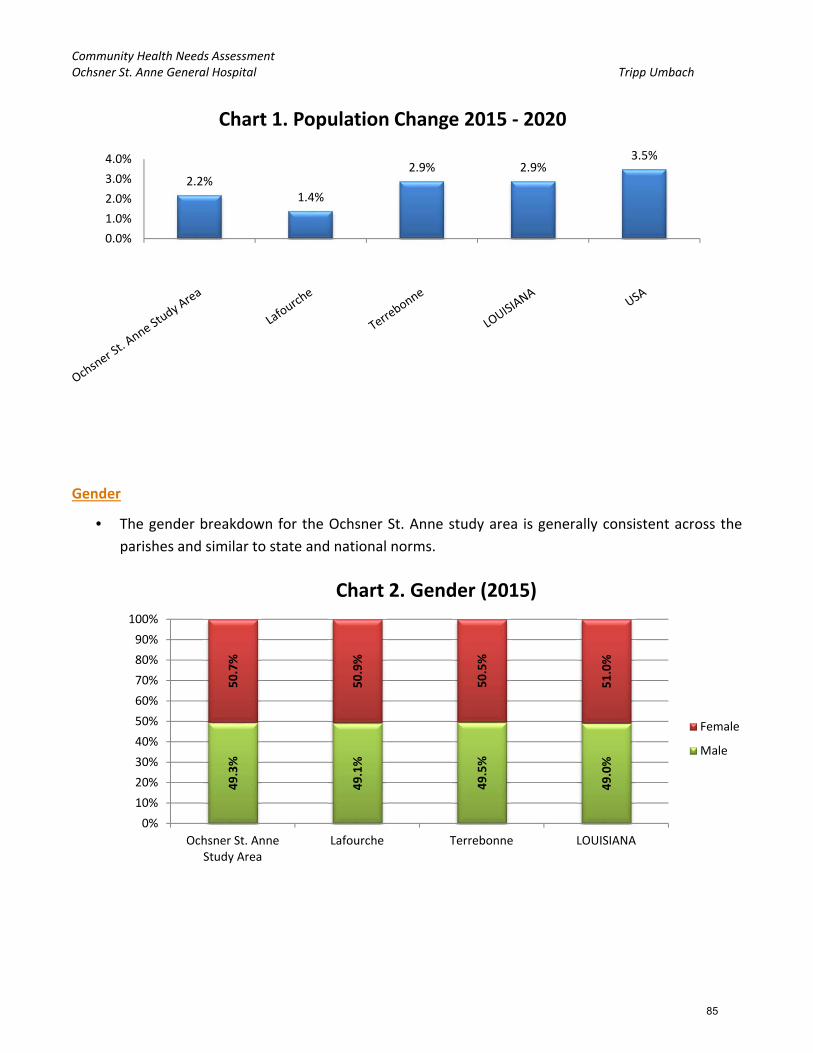
Community Health Needs Assessment Ochsner St. Anne General Hospital Tripp Umbach
Gender
• The gender breakdown for the Ochsner St. Anne study area is generally consistent across the
parishes and similar to state and national norms.
49.3%
49.1%
49.5%
49.0%
50.7%
50.9%
50.5%
51.0%
0%
10%
20%
30%
40%
50%
60%
70%
80%
90%
100%
Ochsner St. AnneStudy Area
Lafourche Terrebonne LOUISIANA
Chart 2. Gender (2015)
Female
Male
2.2%1.4%
2.9% 2.9%3.5%
0.0%
1.0%
2.0%
3.0%
4.0%
Chart 1. Population Change 2015 ‐ 2020
85

Community Health Needs Assessment Ochsner St. Anne General Hospital Tripp Umbach
Age
• Lafourche Parish reports the largest population of residents aged 65 and older (14.3%) followed
by Terrebonne Parish (12.7%).
Race
• Lafourche Parish reports the highest White, Non‐Hispanic population percentage at 75.8%, this
is higher than state (59.1%) and national norms (61.8%).
• Terrebonne Parish reports the highest Black, Non‐Hispanic population across the study area at
69.1%.
• Both Terrebonne and Lafourche Parishes report lower rates of Hispanic residents as compared
with the country (17.6%). Terrebonne Parish reports 4.8% while, Lafourche Parish reports 4.5%.
Terrebonne Parish reports the highest percentage of Asian or Pacific Islander residents (1.2%)
as compared with Lafourche Parish.
20.6% 19.6% 21.5% 20.1% 19.1%
4.1% 4.0% 4.1% 4.1% 4.0%
9.5% 10.0% 9.3% 10.0% 9.9%
13.9% 13.7% 14.2% 14.1% 13.3%
26.3% 26.1% 26.0% 25.3% 26.3%
12.3% 12.3% 12.2% 12.6% 12.7%
13.3% 14.3% 12.7% 13.9% 14.7%
0%
10%
20%
30%
40%
50%
60%
70%
80%
90%
100%
Ochsner St. AnneStudy Area
Lafourche Terrebonne LOUISIANA USA
Chart 3. Age (2015)
65+
55‐64
35‐54
25‐34
18‐24
15‐17
0‐14
86
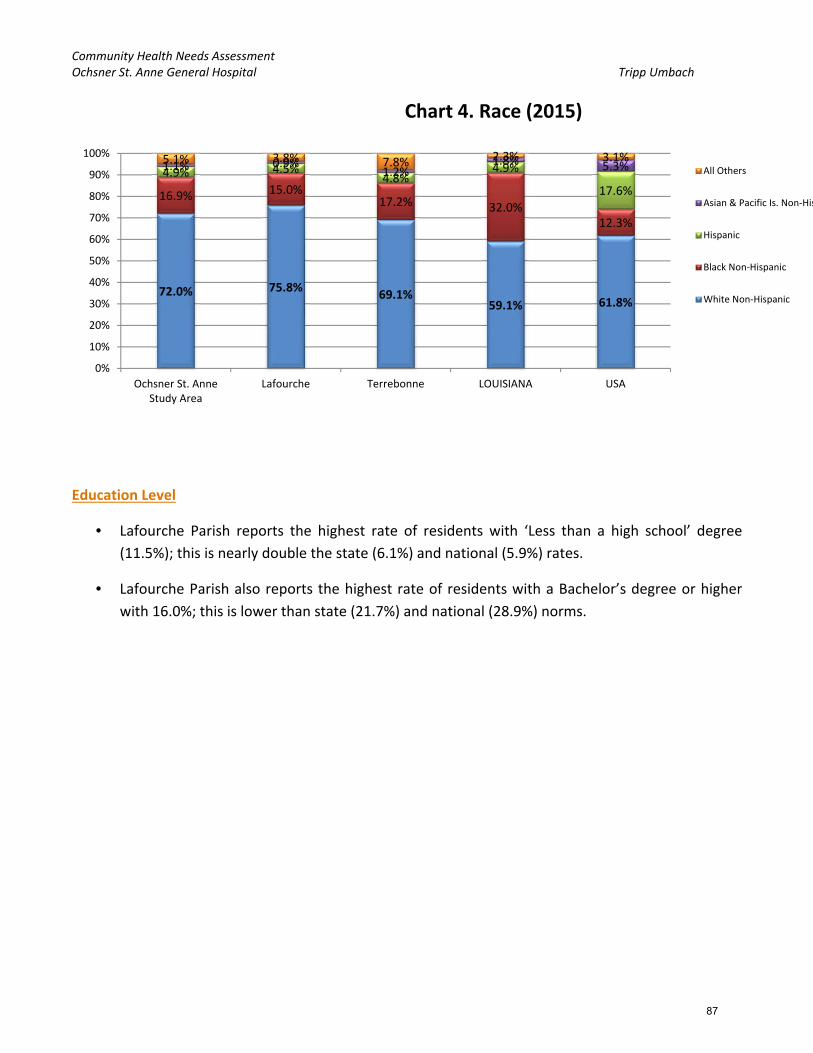
Community Health Needs Assessment Ochsner St. Anne General Hospital Tripp Umbach
Education Level
• Lafourche Parish reports the highest rate of residents with ‘Less than a high school’ degree
(11.5%); this is nearly double the state (6.1%) and national (5.9%) rates.
• Lafourche Parish also reports the highest rate of residents with a Bachelor’s degree or higher
with 16.0%; this is lower than state (21.7%) and national (28.9%) norms.
72.0% 75.8%69.1%
59.1% 61.8%
16.9% 15.0%17.2% 32.0%
12.3%
4.9% 4.5%4.8%
4.9%
17.6%
1.1% 0.9%1.2%
1.8% 5.3%5.1% 3.8% 7.8% 2.3% 3.1%
0%
10%
20%
30%
40%
50%
60%
70%
80%
90%
100%
Ochsner St. AnneStudy Area
Lafourche Terrebonne LOUISIANA USA
Chart 4. Race (2015)
All Others
Asian & Pacific Is. Non‐His
Hispanic
Black Non‐Hispanic
White Non‐Hispanic
87

Community Health Needs Assessment Ochsner St. Anne General Hospital Tripp Umbach
Income
• Both parishes in the study area report an average annual household income above the state
average. Lafourche Parish reports an average annual household income of $64,405; which is
only slightly above the state average of $64,209. Terrebonne Parish, also close to the state
average, reports $67,512. However, both parishes fall below the national rate of $74,165.
• Terrebonne Parish reports the highest rate of households that earn less than $15,000 per year
at 14.2%; Lafourche follows with 12.8%. Lafourche Parish’s rate is in line with the national rate
of 12.7%.
9.9% 11.5% 10.7% 6.1% 5.9%
13.1% 13.9% 13.4%11.1% 8.0%
38.9%39.7% 39.6%
34.3%
28.1%
22.3% 18.9% 22.9%
26.7%
29.1%
15.7% 16.0% 13.5%21.7%
28.9%
0%
10%
20%
30%
40%
50%
60%
70%
80%
90%
100%
Ochsner St. AnneStudy Area
Lafourche Terrebonne LOUISIANA USA
Chart 5. Education Level (2015)
Bachelor's Degree or Greater
Some College/Assoc. Degree
High School Degree
Some High School
Less than High School
88

Community Health Needs Assessment Ochsner St. Anne General Hospital Tripp Umbach
$67,005
$64,405
$67,512
$64,209
$74,165
$58,000
$60,000
$62,000
$64,000
$66,000
$68,000
$70,000
$72,000
$74,000
$76,000
Ochsner St. AnneStudy Area
Lafourche Terrebonne LOUISIANA USA
Chart 6. Average Annual Household Income (2015)
13.1% 12.8% 14.2% 16.9% 12.7%
11.9% 11.7% 12.8% 12.6%10.8%
24.3% 25.7% 22.9%24.5%
23.9%
17.7% 19.1% 16.6%16.3%
17.8%
12.3% 11.5% 12.8%11.1%
12.0%
20.8% 19.1% 20.7% 18.6% 22.8%
0%
10%
20%
30%
40%
50%
60%
70%
80%
90%
100%
Ochsner St. AnneStudy Area
Lafourche Terrebonne LOUISIANA USA
Chart 7. Annual Household Income Detail (2015)
Over $100K
$75‐100K
$50‐75K
$25‐50K
$15‐25K
<$15K
89

Community Health Needs Assessment Ochsner St. Anne General Hospital Tripp Umbach
Community Needs Index (CNI)
In 2005 Catholic Healthcare West, in partnership with Thomson Reuters, pioneered the nation’s first
standardized Community Need Index (CNI).14 CNI was applied to quantify the severity of health
disparity for every zip code in the study area based on specific barriers to health care access. Because
the CNI considers multiple factors that are known to limit health care access, the tool may be more
accurate and useful than other existing assessment methods in identifying and addressing the
disproportionate unmet health‐related needs of neighborhoods or zip code areas.
The CNI score is an average of five different barrier scores that measure various socio‐economic
indicators of each community using the 2015 source data. The five barriers are listed below along with
the individual 2015 statistics that are analyzed for each barrier. These barriers, and the statistics that
comprise them, were carefully chosen and tested individually by both Dignity Health and Truven
Health:
6. Income Barrier
a. Percentage of households below poverty line, with head of household age 65 or more
b. Percentage of families with children under 18 below poverty line
c. Percentage of single female‐headed families with children under 18 below poverty line
7. Cultural Barrier
a. Percentage of population that is minority (including Hispanic ethnicity)
b. Percentage of population over age 5 that speaks English poorly or not at all
8. Education Barrier
a. Percentage of population over 25 without a high school diploma
9. Insurance Barrier
a. Percentage of population in the labor force, aged 16 or more, without employment
b. Percentage of population without health insurance
10. Housing Barrier
a. Percentage of households renting their home
Every populated zip code in the United States is assigned a barrier score of 1,2,3,4, or 5 depending
upon the zip code’s national rank (quintile). A score of 1 represents the lowest rank nationally for the
statistics listed, while a score of 5 indicates the highest rank nationally. For example, zip codes that
score a 1 for the Education Barrier contain highly educated populations; zip codes with a score of 5
have a very small percentage of high school graduates.
14 Truven Health Analytics, Inc. 2015 Community Need Index.
90

Community Health Needs Assessment Ochsner St. Anne General Hospital Tripp Umbach
Table 3. Ochsner St. Anne General Hospital – 2011 to 2015 CNI Comparison
Zip Community Name
County Income Rank
Culture Rank
Education Rank
Insurance Rank
Housing Rank
2015 CNI Score
2011 CNI Score
Diff. 2011 – 2015
70363 Houma Terrebonne Parish 4 5 5 5 4 4.6 4.4 + 0.2
70357 Golden Meadow Lafourche Parish 5 4 5 4 4 4.4 3.6 + 0.8
70359 Gray Terrebonne Parish 4 4 5 5 3 4.2 4.0 + 0.2
70364 Houma Terrebonne Parish 4 4 5 4 4 4.2 3.6 + 0.6
70301 Thibodaux Lafourche Parish 3 4 5 4 4 4.0 4.2 ‐ 0.2
70354 Galliano Lafourche Parish 3 4 5 4 3 3.8 3.4 + 0.4
70373 Larose Lafourche Parish 4 4 5 4 2 3.8 3.2 + 0.6
70394 Raceland Lafourche Parish 3 4 5 4 3 3.8 3.8 0.0
70080 Paradis St. Charles Parish 3 4 4 4 4 3.8 3.0 + 0.8
70345 Cut Off Lafourche Parish 2 4 5 4 2 3.4 3.0 + 0.4
70374 Lockport Lafourche Parish 2 3 5 4 3 3.4 3.6 ‐ 0.2
70360 Houma Terrebonne Parish 3 4 3 3 4 3.4 3.4 0.0
70375 Mathews Lafourche Parish 2 3 5 4 2 3.2 3.2 0.0
70355 Gheens Lafourche Parish 2 2 5 4 2 3.0 2.8 + 0.2
70030 Des Allemands St. Charles Parish 3 3 4 4 1 3.0 3.0 0.0
70070 Luling St. Charles Parish 2 4 3 3 2 2.8 2.2 + 0.6
A total of 13 of the 16 zip code areas (81.3%) for the Ochsner St. Anne study area fall above the median
score for the scale (3.0), two fall at the median, and one falls below the median. Being above the
median for the scale indicates that these zip code areas have more than average the number of
barriers to health care access.
Figure 2. Ochsner St. Anne General Hospital Study Area 2015 CNI Map
91

Community Health Needs Assessment Ochsner St. Anne General Hospital Tripp Umbach
Figure 3. Ochsner St. Anne Study Area 2011 ‐ 2015 CNI Difference Map
Across the 16 Ochsner St. Anne study area zip codes:
2 experienced a decline in their CNI score from 2011 to 2015, indicating a shift to fewer barriers
to health care access (green, negative values)
4 remained the same from 2011 to 2015
10 experienced a rise in their CNI score from 2011 to 2015, indicating a shift to more barriers to
health care access (red, positive values)
Zip code areas 70357 – Golden Meadow and 70080 – Paradis experienced a 0.8 increase, the largest
rise, in CNI score (going from 3.6 to 4.4 for Golden Meadow; and going from 3.0 to 3.8 for Paradis).
92

Community Health Needs Assessment Ochsner St. Anne General Hospital Tripp Umbach
70301 – Thibodaux and 70347 – Lockport (both located in Lafourche Parish) were the only two zip
codes to improve their CNI score and both by 0.2 points. Thibodaux went from 4.2 in 2011 to 4.0 in
2015. Lockport went from 3.6 to 3.4.
The available data behind the rankings illustrates the supporting data for each CNI ranking.
Table 4. Ochsner St. Anne – 2015 CNI Detailed Data
Zip City 2015 CNI Score
Poverty 65+
Poverty Married w/ kids
Poverty Single w/kids
Limited English
Minority No High School Diploma
Un‐employed
Un‐insured
Renting
70363 Houma 4.6 7.0% 29.2% 48.8% 0.8% 47.1% 32.6% 9.0% 16.3% 28.7%
70357 Golden Meadow 4.4 15.4% 19.1% 64.4% 1.9% 21.2% 40.1% 10.8% 12.4% 27.5%
70359 Gray 4.2 11.1% 24.6% 51.4% 1.7% 36.2% 25.2% 10.2% 17.9% 20.3%
70364 Houma 4.2 10.6% 23.9% 53.5% 1.3% 27.2% 22.0% 6.3% 14.4% 33.0%
70301 Thibodaux 4.0 13.4% 17.1% 37.9% 0.7% 27.5% 22.1% 6.5% 10.7% 29.9%
70354 Galliano 3.8 22.5% 20.3% 34.5% 3.0% 19.6% 35.7% 12.7% 13.0% 21.8%
70373 Larose 3.8 14.4% 18.4% 47.7% 1.9% 21.7% 28.8% 7.9% 12.2% 18.0%
70394 Raceland 3.8 11.7% 18.8% 34.5% 0.9% 27.3% 24.9% 7.2% 10.9% 20.2%
70080 Paradis 3.8 12.2% 16.5% 44.6% 0.4% 20.7% 17.3% 5.5% 11.9% 27.8%
70345 Cut Off 3.4 11.4% 9.9% 25.5% 2.8% 19.7% 29.3% 10.7% 10.4% 19.6%
70374 Lockport 3.4 17.8% 15.6% 31.3% 4.5% 13.7% 25.1% 4.7% 11.2% 24.6%
70360 Houma 3.4 7.7% 14.1% 40.2% 0.6% 24.9% 14.0% 5.7% 10.0% 29.6%
70375 Mathews 3.2 1.5% 16.7% 26.7% 0.6% 10.4% 26.2% 5.3% 12.2% 18.0%
70355 Gheens 3.0 0.0% 19.5% 23.3% 0.7% 5.1% 30.0% 4.8% 13.1% 16.3%
70030 Des Allemands 3.0 7.7% 15.5% 33.7% 0.5% 14.1% 15.6% 5.6% 12.0% 13.9%
70070 Luling 2.8 7.7% 13.0% 27.9% 1.1% 23.9% 10.7% 4.7% 8.0% 16.8%
For the Ochsner St. Anne study area there are 5 zip code areas with CNI scores of 4.0 or greater,
indicating significant barriers to health care access. These zip code areas are: 70363, 70364 – Houma;
70357 – Golden Meadow; 70359 – Gray; and 70301 – Thibodaux.
70357 – Golden Meadow reports the highest rates in the study area for: single parents living
in poverty with children (64.4%) and residents without a high school diploma (40.1%).
Zip code area 70354 in Galliano reports the highest rates of residents aged 65 and older
living in poverty (22.5%) and residents who are unemployed (12.7%); this is much higher
than state (6.6%) and national (5.5%) unemployment rates.15
70363 – Houma reports the highest rates for the study area for: married parents living in
poverty with children (29.2%) and residents identifying themselves as minority (47.1%). Zip
code area 70364, also in Houma, shows the highest percentage of people renting (33%).
15 March 2015 state and national statistics. U.S. Bureau of Labor Statistics.
93

Community Health Needs Assessment Ochsner St. Anne General Hospital Tripp Umbach
17.9% of the residents in zip code area 70359 (Gray) are uninsured; the highest in the study
area.
4.5% of residents living in zip code area 70374 – Lockport have limited English proficiency;
the highest in the study area.
On the other end of the spectrum, the lowest CNI score for the study area is 2.8 in 70070 – Luling.
Along with the lowest CNI score, zip code area 70070 (Luling) reports the lowest rates in the
study area for: residents without a high school diploma (10.7%); unemployed residents
(4.7%); and uninsured residents (8.0%). 70374 – Lockport also reports an unemployment
rate of 4.7%.
Zip code area 70355 (Gheens) reports 0.0% of their population as aged 65 and older living in
poverty. This zip code also reports the lowest rates in the study area for: single parents
living in poverty with children (23.3%) and residents identifying as minority (5.1%).
70030 – Des Allemands reports the lowest rate of renters across the study area at only
13.9%.
Only 0.4% of residents in 70080 – Paradis have limited English proficiency; the lowest in the
study area.
Cut Off (70345) reports the lowest rate of married parents living in poverty with children at
9.9%.
3.93.7
4.0
0
1
2
3
4
5
Chart 8. Overall CNI Values ‐ Ochsner St. Anne, Parishes
94

Community Health Needs Assessment Ochsner St. Anne General Hospital Tripp Umbach
Prevention Quality Indicators (PQI) and
Pediatric Quality Indicators (PDI)
Prevention Quality Indicators (PQI)
The Prevention Quality Indicators index (PQI) was developed by the Agency for Healthcare Research
and Quality (AHRQ). PQI is similarly referred to as Ambulatory Care Sensitive Hospitalizations. The
quality indicator rates are derived from inpatient discharges by zip code using ICD diagnosis and
procedure codes. There are 14 quality indicators.
The PQI index identifies potentially avoidable hospitalizations for the benefit of targeting priorities and
overall community health. Lower index scores represent fewer admissions for each of the PQIs.
PQI Subgroups:
1. Chronic Lung Conditions
PQI 5 Chronic Obstructive Pulmonary Disease (COPD) or Asthma in Older Adults (40+)
Admission Rate
PQI 15 Asthma in Younger Adults Admission Rate
2. Diabetes
PQI 1 Diabetes Short‐Term Complications Admission Rate
PQI 3 Diabetes Long‐Term Complications Admission Rate
PQI 14 Uncontrolled Diabetes Admission Rate
PQI 16 Lower Extremity Amputation Rate Among Diabetic Patients
3. Heart Conditions
PQI 7 Hypertension Admission Rate
PQI 8 Congestive Heart Failure Admission Rate
PQI 13 Angina Without Procedure Admission Rate
4. Other Conditions
PQI 2 Perforated Appendix Admission Rate
PQI 9 Low Birth Weight Rate
PQI 10 Dehydration Admission Rate
PQI 11 Bacterial Pneumonia Admission Rate
PQI 12 Urinary Tract Infection Admission Rate
95

Community Health Needs Assessment Ochsner St. Anne General Hospital Tripp Umbach
Table 5. Prevention Quality Indicators (PQI) Ochsner St. Anne / LA / U.S.A. 2015
Prevention Quality Indicators (PQI)
Ochsner St. Anne
Study Area 2015 PQI
LA 2015 PQI
U.S.A. 2015 PQI
Ochsner St. Anne Study
Area – LA Diff.
Ochsner St. Anne Study
Area – U.S.A.Diff.
Chronic Lung Conditions
COPD or Adult Asthma (PQI5) 621.00 531.03 495.71 + 89.97 + 125.29
Asthma in Younger Adults (PQI15) 40.00 42.83 46.02 ‐ 2.83 ‐ 6.02
Diabetes
Diabetes Short‐Term Complications (PQI1) 92.08 98.10 63.86 ‐ 6.02 + 28.22
Diabetes Long‐Term Complications (PQI3) 103.18 126.06 105.72 ‐ 22.88 ‐ 2.54
Uncontrolled Diabetes (PQI14) 14.31 15.57 15.72 ‐ 1.26 ‐ 1.41
Lower Extremity Amputation Among Diabetics (PQI16) 10.97 12.74 16.50 ‐ 1.77 ‐ 5.53
Heart Conditions35.26
Hypertension (PQI7) 35.26 46.06 54.27 ‐ 10.80 ‐ 19.01
Congestive Heart Failure (PQI8) 392.52 404.11 321.38 ‐ 11.59 + 71.14
Angina Without Procedure (PQI13) 19.59 13.74 13.34 + 5.85 + 6.25
Other Conditions
Perforated Appendix (PQI2) 388.89 322.43 323.43 + 66.46 + 65.46
Low Birth Weight (PQI9) 69.78 86.51 62.14 ‐ 16.73 + 7.64
Dehydration (PQI10) 163.42 124.53 135.70 + 38.89 + 27.72
Bacterial Pneumonia (PQI11) 311.77 305.80 248.19 + 5.97 + 63.58
Urinary Tract Infection (PQI12) 240.38 209.39 167.01 + 30.99 + 73.37
Key Findings from 2015 PQI Data:
The Ochsner St. Anne study area reports higher preventable admission rates than the State of
Louisiana for six of the 14 PQI measures as depicted by the red values in the corresponding
column of Table 5 (above). The greatest difference (89.97 preventable admissions) is seen with
PQI5 – COPD or Adult Asthma. The study area reports a rate of 621.00 preventable admissions
per 1,000 admissions versus the state rate of 531.03.
When comparing the Ochsner St. Anne PQI data to the national rates, the study area reports
higher preventable hospital admissions for:
o Diabetes, Short‐Term
Complications
o Perforated Appendix
o COPD or Adult Asthma
o Congestive Heart Failure
o Low Birth Weight
o Dehydration
o Bacterial Pneumonia
o Urinary Tract Infection
o Angina without Procedure
96

1
There are also a number of PQI measures in which the Ochsner St. Anne Study Area reports
lower values than the nation (indicating areas in which there are fewer preventable hospital
admissions than the national norm), these include:
o Diabetes, Long‐Term Complications
o Hypertension
o Uncontrolled Diabetes
o Asthma in Younger Adults
o Lower Extremity Amputation among Diabetics
Chronic Lung Conditions:
621.00
617.93
676.18
531.03
495.71
0.00
100.00
200.00
300.00
400.00
500.00
600.00
700.00
800.00
COPD or Adult Asthma (PQI 5)
Ochsner St. AnneStudy Area
Lafourche
Terrebonne
LOUISIANA
U.S.A.
40.00
25.37
41.97
42.83
46.02
0.00
5.00
10.00
15.00
20.00
25.00
30.00
35.00
40.00
45.00
50.00
Asthma in Younger Adults (PQI 15)
Ochsner St. AnneStudy Area
Lafourche
Terrebonne
LOUISIANA
U.S.A.
97

Community Health Needs Assessment Ochsner St. Anne General Hospital Tripp Umbach
Diabetes:
92.08
98.68
78.64
98.10
63.86
0.00
20.00
40.00
60.00
80.00
100.00
120.00
Diabetes, Short‐Term Complications (PQI 1)
Ochsner St. AnneStudy Area
Lafourche
Terrebonne
LOUISIANA
U.S.A.
103.18
107.26
123.58
126.06
105.72
0.00
20.00
40.00
60.00
80.00
100.00
120.00
140.00
Diabetes, Long‐Term Complications (PQI 3)
Ochsner St. AnneStudy Area
Lafourche
Terrebonne
LOUISIANA
U.S.A.
14.31
15.84
9.42
15.57
15.72
0.00
2.00
4.00
6.00
8.00
10.00
12.00
14.00
16.00
18.00
Uncontrolled Diabetes (PQI 14)
Ochsner St. AnneStudy Area
Lafourche
Terrebonne
LOUISIANA
U.S.A.
98

Community Health Needs Assessment Ochsner St. Anne General Hospital Tripp Umbach
Heart Conditions:
10.97
7.79
12.92
12.74 15.50
0.00
2.00
4.00
6.00
8.00
10.00
12.00
14.00
16.00
18.00
Lower Extremity Amputation Among Diabetics (PQI 16)
Ochsner St. AnneStudy Area
Lafourche
Terrebonne
LOUISIANA
U.S.A.
35.26
44.34
29.21
46.06 54.27
0.00
10.00
20.00
30.00
40.00
50.00
60.00
Hypertension (PQI 7)
Ochsner St. AnneStudy Area
Lafourche
Terrebonne
LOUISIANA
U.S.A.
392.52
365.27
412.67
404.11
321.38
0.00
50.00
100.00
150.00
200.00
250.00
300.00
350.00
400.00
450.00
Congestive Heart Failure (PQI 8)
Ochsner St. AnneStudy Area
Lafourche
Terrebonne
LOUISIANA
U.S.A.
99

Community Health Needs Assessment Ochsner St. Anne General Hospital Tripp Umbach
Other Conditions:
19.59
22.88
16.85
13.74
13.34
0.00
5.00
10.00
15.00
20.00
25.00
Angina Without Procedure (PQI 13)
Ochsner St. AnneStudy Area
Lafourche
Terrebonne
LOUISIANA
U.S.A.
388.89
270.27
444.44
322.43
323.43
0.00
50.00
100.00
150.00
200.00
250.00
300.00
350.00
400.00
450.00
500.00
Perforated Appendix (PQI 2)
Ochsner St. AnneStudy Area
Lafourche
Terrebonne
LOUISIANA
U.S.A.
69.78
71.75
74.67 86.51
62.14
0.00
10.00
20.00
30.00
40.00
50.00
60.00
70.00
80.00
90.00
100.00
Low Birth Weight (PQI 9)
Ochsner St. AnneStudy Area
Lafourche
Terrebonne
LOUISIANA
U.S.A.
100
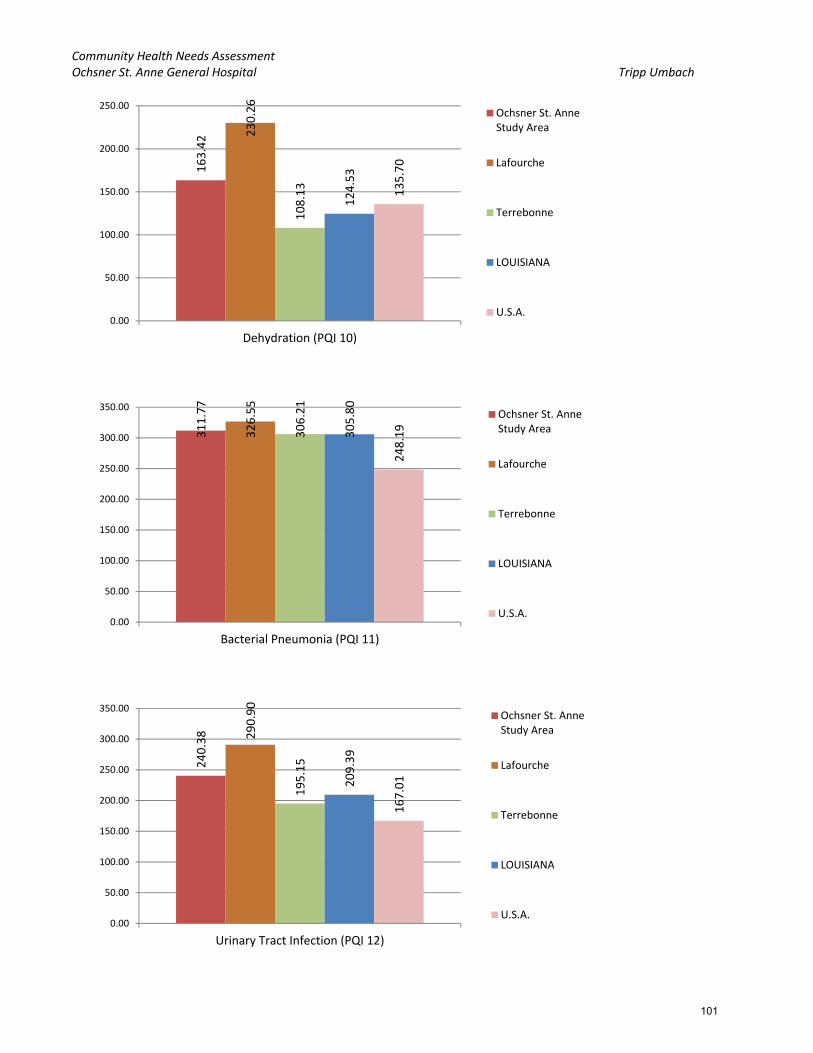
Community Health Needs Assessment Ochsner St. Anne General Hospital Tripp Umbach
163.42 230.26
108.13
124.53
135.70
0.00
50.00
100.00
150.00
200.00
250.00
Dehydration (PQI 10)
Ochsner St. AnneStudy Area
Lafourche
Terrebonne
LOUISIANA
U.S.A.
311.77
326.55
306.21
305.80
248.19
0.00
50.00
100.00
150.00
200.00
250.00
300.00
350.00
Bacterial Pneumonia (PQI 11)
Ochsner St. AnneStudy Area
Lafourche
Terrebonne
LOUISIANA
U.S.A.
240.38 290.90
195.15
209.39
167.01
0.00
50.00
100.00
150.00
200.00
250.00
300.00
350.00
Urinary Tract Infection (PQI 12)
Ochsner St. AnneStudy Area
Lafourche
Terrebonne
LOUISIANA
U.S.A.
101

Community Health Needs Assessment Ochsner St. Anne General Hospital Tripp Umbach
Pediatric Quality Indicators Overview
The Pediatric Quality Indicators (PDIs) are a set of measures that can be used with hospital inpatient
discharge data to provide a perspective on the quality of pediatric health care. Specifically, PDIs screen
for problems that pediatric patients experience as a result of exposure to the health care system and
that may be amenable to prevention by changes at the system or provider level.
Development of quality indicators for the pediatric population involves many of the same challenges
associated with the development of quality indicators for the adult population. These challenges
include the need to carefully define indicators using administrative data, establish validity and
reliability, detect bias and design appropriate risk adjustment, and overcome challenges of
implementation and use. However, the special population of children invokes additional, special
challenges. Four factors—differential epidemiology of child health care relative to adult health care,
dependency, demographics, and development—can pervade all aspects of children’s health care;
simply applying adult indicators to younger age ranges is insufficient.
This PDIs focus on potentially preventable complications and iatrogenic events for pediatric patients
treated in hospitals, and on preventable hospitalizations among pediatric patients.
The PDIs apply to the special characteristics of the pediatric population; screen for problems that
pediatric patients experience as a result of exposure to the health care system and that may be
amenable to prevention by changes at the provider level or area level; and, help to evaluate preventive
care for children in an outpatient setting, and most children are rarely hospitalized.
PDI Subgroups:
PDI 14 Asthma Admission Rate (per 100,000 population ages 2 – 17)
PDI 15 Diabetes, Short‐Term Complications Admission Rate (per 100,000 population ages 6 – 17)
PDI 16 Gastroenteritis Admission Rate (per 100,000 population ages 3 months – 17 years)
PDI 17 Perforated Appendix Admission Rate (per 1,000 admissions ages 1 – 17)
PDI 18 Urinary Tract Infection Admission Rate (per 100,000 population ages 3
months – 17 years)
102

Community Health Needs Assessment Ochsner St. Anne General Hospital Tripp Umbach
79.58
60.25
88.12
117.52
117.37
0.00
20.00
40.00
60.00
80.00
100.00
120.00
140.00
Asthma ‐ Ages 2 ‐ 17 years (PDI 14)
Ochsner St. AnneStudy Area
Lafourche
Terrebonne
LOUISIANA
U.S.A.
46.35
18.00
60.39
36.00
23.89
0.00
10.00
20.00
30.00
40.00
50.00
60.00
70.00
Diabetes, Short‐Term Complications ‐ Ages 6 ‐ 17 years (PDI 15)
Ochsner St. AnneStudy Area
Lafourche
Terrebonne
LOUISIANA
U.S.A.
22.88
37.31
15.01
32.48
47.28
0.00
5.00
10.00
15.00
20.00
25.00
30.00
35.00
40.00
45.00
50.00
Gastroenteritis ‐ Ages 3 months ‐ 17 years (PDI 16)
Ochsner St. AnneStudy Area
Lafourche
Terrebonne
LOUISIANA
U.S.A.
103

Community Health Needs Assessment Ochsner St. Anne General Hospital Tripp Umbach
Key Findings from PDI Data:
The Ochsner St. Anne study area reports preventable hospitalization rates lower than the
national rate in all but one of the Pediatric Quality Indicators (PDIs) measures.
Terrebonne Parish reports the highest rate of preventable hospitalizations due to Asthma for
children aged 2 to 17 at 88.12 per 100,000 population; less than the national rate of 117.37 and
the state rate of 117.52. Lafourche Parish reports a rate of 60.25 per 100,000 population;
almost half the state and national rates.
Terrebonne Parish and Lafourche Parishes are at opposite ends of the spectrum for rates of
diabetes, short‐term complications for those aged 6 to 17 years old for the study area (60.39
272.73
294.12
307.69
322.09
344.22
0.00
50.00
100.00
150.00
200.00
250.00
300.00
350.00
400.00
Perforated Appendix ‐ Ages 1 ‐ 17 years (PDI 17)
Ochsner St. AnneStudy Area
Lafourche
Terrebonne
LOUISIANA
U.S.A.
9.95
4.63
13.06
23.89
29.64
0.00
5.00
10.00
15.00
20.00
25.00
30.00
35.00
Urinary Tract Infection ‐ Ages 3 months ‐ 17 years (PDI 18)
Ochsner St. AnneStudy Area
Lafourche
Terrebonne
LOUISIANA
U.S.A.
104
Community Health Needs Assessment Ochsner St. Anne General Hospital Tripp Umbach
and 18.00, respectively). Terrebonne’s rates are nearly double the state rate of 36.00 and triple
the national rate of 23.89; while Lafourche’s rate is half that of the state and lower than the
national rate. This is the only measure where a parish in the study area reports a higher rate
than the nation.
Lafourche Parish reports the highest rate of gastroenteritis for the Ochsner St. Anne study area
at 37.31 per 100,000 population aged 3 months to 17 years. However, both Lafourche and
Terrebonne Parishes fall below the national rate of 47.28.
Terrebonne Parish reports the highest rate of preventable hospitalizations due to perforated
appendix for ages 1 to 17 years old with 307.69 per 1,000 admissions. Lafourche Parish reports
294.12 per 1,000 admissions.
Terrebonne reports the higher rate of preventable hospital admissions due to urinary tract
infections for those aged 3 months to 17 years in the study area with 13.06 per 100,000
population being admitted while the national rate stands at 29.64.
105

Community Health Needs Assessment Ochsner St. Anne General Hospital Tripp Umbach
Community Commons Data
Tripp Umbach gathered data from Community Commons related to social and economic factors,
physical environment, clinical care, and health behaviors for the parishes of interest for the Ochsner St.
Anne CHNA.16 The data is presented in the aforementioned categories below.
Social and Economic Factors
Free/Reduced Price Lunch Eligible
Terrebonne Parish reports the highest rate of public school students who are eligible for free or
reduced lunch (66.28%).
16 Community Commons. http://www.communitycommons.org/ Accessed 06/08/2015.
2009‐10 2010‐11 2011‐12 2012‐13
Lafourche 59.99% 59.79% 60.79% 60.26%
Terrebonne 64.94% 65.75% 66.92% 66.28%
LOUISIANA 65.78% 66.20% 67.12% 66.23%
USA 47.76% 49.24% 48.29% 51.77%
0.00%
10.00%
20.00%
30.00%
40.00%
50.00%
60.00%
70.00%
80.00%
Percent Population Free/Reduced Price Lunch Eligible, 2012‐2013
Lafourche
Terrebonne
LOUISIANA
USA
106

Community Health Needs Assessment Ochsner St. Anne General Hospital Tripp Umbach
Food Insecure Population
This indicator reports the estimated percentage of the population that experienced food
insecurity at some point during the report year. Food insecurity is the household‐level
economic and social condition of limited or uncertain access to adequate food.
Lafourche and Terrebonne Parishes report lower food insecurity rates than the State of
Louisiana and the nation, with Terrebonne Parish reporting the highest at 11.92% of the
population.
Graduation Rate
This indicator is relevant because research suggests education is one the strongest predictors of
health (Freudenberg & Ruglis, 2007).
Terrebonne Parish reports the lowest overall graduation rate as well as the lowest on‐time
graduation rate throughout the study area parishes (77.0% overall graduation, 65.6% on‐time
graduation).
The Healthy People 2020 Target for on‐time graduation is 82.4% – all of the study area parishes
and the State of Louisiana fall below this goal. However, Lafourche Parish reports very close to
the on‐time graduation rate for the nation with only a 3.5% difference.
10.42%
11.92%
16.91%
15.94%
0.00%
2.00%
4.00%
6.00%
8.00%
10.00%
12.00%
14.00%
16.00%
18.00%
Food Insecure Population, Percent, 2012
Lafourche
Terrebonne
LOUISIANA
USA
107

Community Health Needs Assessment Ochsner St. Anne General Hospital Tripp Umbach
Households with No Motor Vehicle
Lafourche and Terrebonne Parishes both report similar rates of households with no motor
vehicle (7.35% and 7.21%, respectively).
81.0%
72.0%
77.0%
65.6%73.4%
67.3%
82.2%
75.5%
0.0%
10.0%
20.0%
30.0%
40.0%
50.0%
60.0%
70.0%
80.0%
90.0%
Cohort Graduation Rate(2001‐2012)
On‐Time Graduation Rate(2008‐2009)
Lafourche
Terrebonne
LOUISIANA
USA
7.35%
7.21% 8.48%
9.07%
0.00%
1.00%
2.00%
3.00%
4.00%
5.00%
6.00%
7.00%
8.00%
9.00%
10.00%
Percentage of Households with No Motor Vehicle, 2009‐2013
Lafourche
Terrebonne
LOUISIANA
USA
108
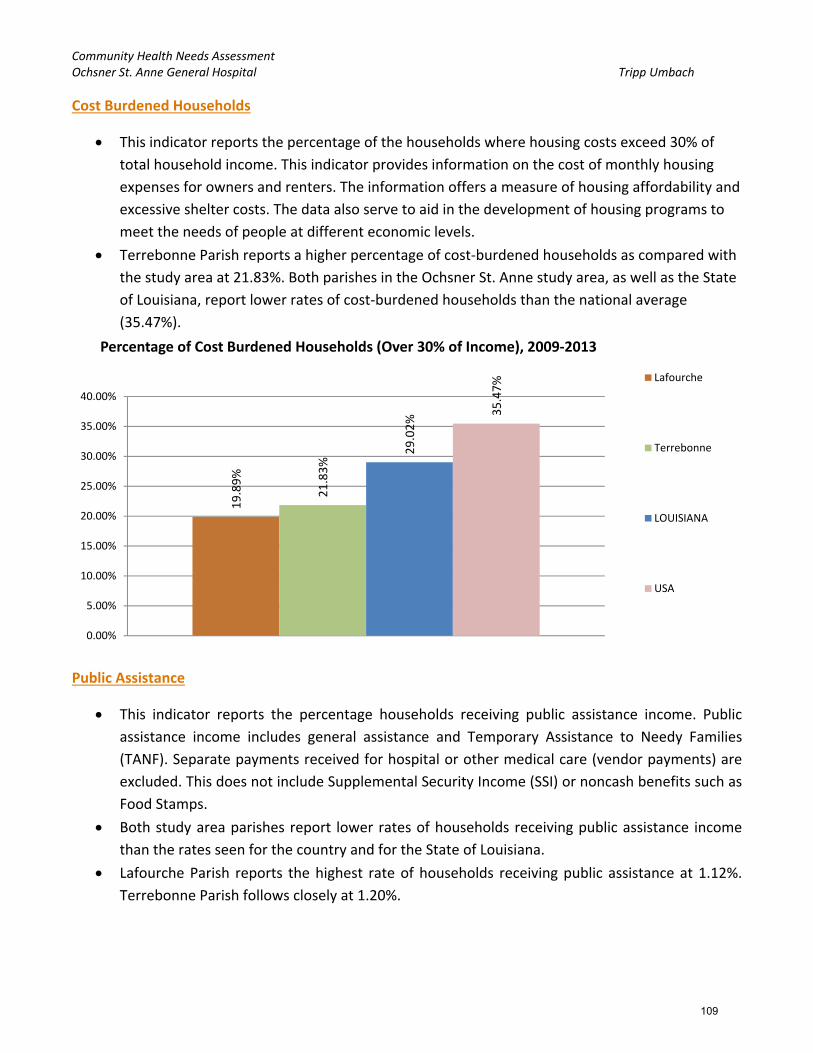
Community Health Needs Assessment Ochsner St. Anne General Hospital Tripp Umbach
Cost Burdened Households
This indicator reports the percentage of the households where housing costs exceed 30% of
total household income. This indicator provides information on the cost of monthly housing
expenses for owners and renters. The information offers a measure of housing affordability and
excessive shelter costs. The data also serve to aid in the development of housing programs to
meet the needs of people at different economic levels.
Terrebonne Parish reports a higher percentage of cost‐burdened households as compared with
the study area at 21.83%. Both parishes in the Ochsner St. Anne study area, as well as the State
of Louisiana, report lower rates of cost‐burdened households than the national average
(35.47%).
Public Assistance
This indicator reports the percentage households receiving public assistance income. Public
assistance income includes general assistance and Temporary Assistance to Needy Families
(TANF). Separate payments received for hospital or other medical care (vendor payments) are
excluded. This does not include Supplemental Security Income (SSI) or noncash benefits such as
Food Stamps.
Both study area parishes report lower rates of households receiving public assistance income
than the rates seen for the country and for the State of Louisiana.
Lafourche Parish reports the highest rate of households receiving public assistance at 1.12%.
Terrebonne Parish follows closely at 1.20%.
19.89%
21.83%
29.02%
35.47%
0.00%
5.00%
10.00%
15.00%
20.00%
25.00%
30.00%
35.00%
40.00%
Percentage of Cost Burdened Households (Over 30% of Income), 2009‐2013
Lafourche
Terrebonne
LOUISIANA
USA
109
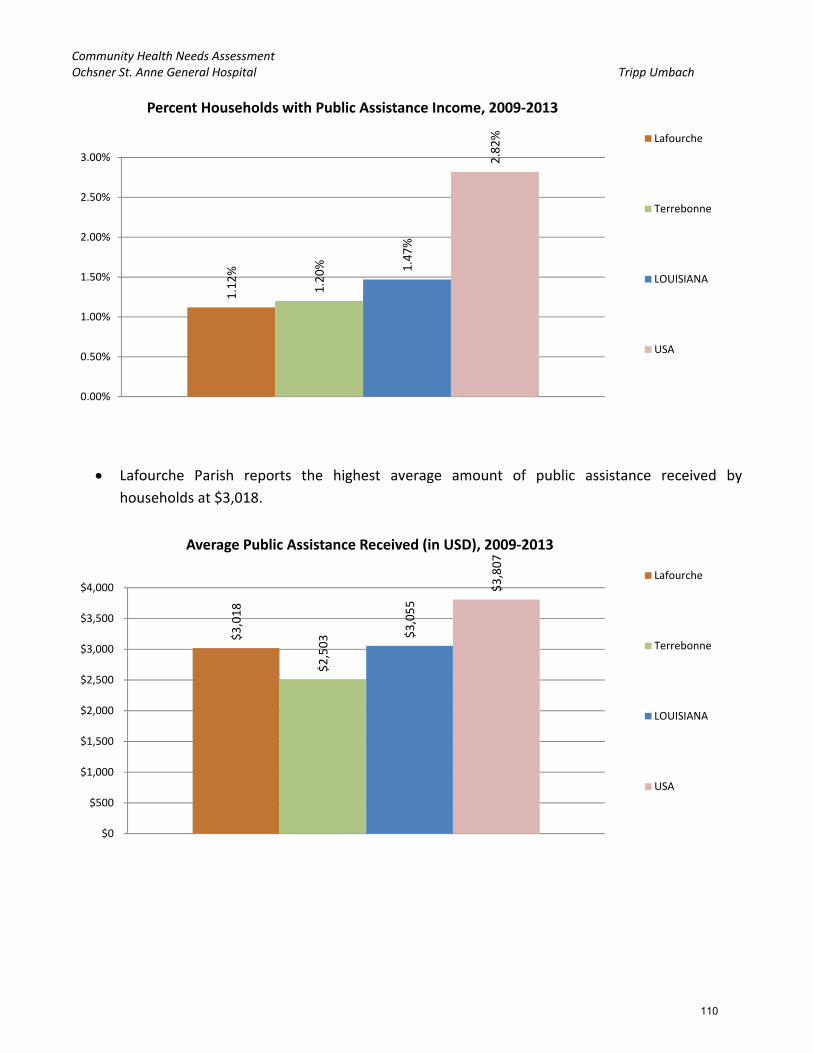
Community Health Needs Assessment Ochsner St. Anne General Hospital Tripp Umbach
Lafourche Parish reports the highest average amount of public assistance received by
households at $3,018.
1.12%
1.20% 1.47%
2.82%
0.00%
0.50%
1.00%
1.50%
2.00%
2.50%
3.00%
Percent Households with Public Assistance Income, 2009‐2013
Lafourche
Terrebonne
LOUISIANA
USA
$3,018
$2,503 $3,055
$3,807
$0
$500
$1,000
$1,500
$2,000
$2,500
$3,000
$3,500
$4,000
Average Public Assistance Received (in USD), 2009‐2013
Lafourche
Terrebonne
LOUISIANA
USA
110

Community Health Needs Assessment Ochsner St. Anne General Hospital Tripp Umbach
SNAP Benefits
Terrebonne Parish reports the highest rate of households receiving SNAP benefits across the
Ochsner St. Anne study area at 16.92%.
Lafourche Parish reports the highest rates of households receiving SNAP benefits for
populations identifying as: Multiple Race (48.44%), Black (40.32%), American Indian/Alaskan
Native (32.28%), and Asian (15.38%).
The American Indian/Alaska Native, African‐American/Black, and Multiple race populations of
the Ochsner St. Anne study area see some of the highest rates of receiving SNAP benefits. The
Non‐Hispanic White, Asian, and Hispanic/Latino populations report some of the lowest rates of
receiving SNAP benefits for the Ochsner St. Anne study area.
16.03%
16.92%
16.63%
12.40%
0.00%
2.00%
4.00%
6.00%
8.00%
10.00%
12.00%
14.00%
16.00%
18.00%
Percent Households Receiving SNAP Benefits, 2009‐2013
Lafourche
Terrebonne
LOUISIANA
USA
0.00%
10.00%
20.00%
30.00%
40.00%
50.00%
60.00%
Non‐HispanicWhite
Black Asian AmericanIndian / Alaska
Native
Other Race Multiple Race Hispanic /Latino
Percent Households Receiving SNAP Benefits, by Race, 2009‐2013
Lafourche
Terrebonne
LOUISIANA
USA
111

Community Health Needs Assessment Ochsner St. Anne General Hospital Tripp Umbach
Households Receiving SNAP Benefits, Disparity Index
The Index of Disparity (ID) measures the magnitude of variation in indicator percentages across
population groups. Specifically, the index of disparity is defined as "the average of the absolute
differences between rates for specific groups within a population and the overall population
rate, divided by the rate for the overall population and expressed as a percentage".
Both Terrebonne Parish and Lafourche Parish report an index score reflecting “High Disparity”
when it comes to SNAP benefits.
Lafourche Parish reports the highest SNAP Benefits Disparity Index score for the study area at
66.02. Terrebonne Parish reports an index score only slightly above the “High Disparity”
threshold.
66.02
40.94
37.12
62.62
0.00
10.00
20.00
30.00
40.00
50.00
60.00
70.00
Households Receiving SNAP Benefits, Disparity Index Score(0 = No Disparity; 1 ‐ 40 = Some Disparity; Over 40 = High Disparity)
Households Receiving SNAP Benefits,Disparity Index Score
2009‐2013 Lafourche
Terrebonne
LOUISIANA
USA
112

Community Health Needs Assessment Ochsner St. Anne General Hospital Tripp Umbach
Medicaid
Terrebonne Parish reports the highest rate of Insured Residents Receiving Medicaid at 25.65%;
this rate is higher than the national (20.21%) rate.
The population under the age of 18 receives the highest rates of Medicaid assistance across all
of the study area parishes.
Terrebonne Parish reports the highest rate among the study area parishes of residents aged 65
and older receiving Medicaid (17.82%).
23.64%
25.65%
25.70%
20.21%
0.00%
5.00%
10.00%
15.00%
20.00%
25.00%
30.00%
Percent of Insured Population Receiving Medicaid, 2009‐2013
Lafourche
Terrebonne
LOUISIANA
USA
0.00%
10.00%
20.00%
30.00%
40.00%
50.00%
60.00%
Under Age 18 Age 18 ‐ 64 Age 65 and Older
Percent of Insured Population Receiving Medicaid, by Age Group,2009‐2013 Lafourche
Terrebonne
LOUISIANA
USA
113

Community Health Needs Assessment Ochsner St. Anne General Hospital Tripp Umbach
Insurance
Terrebonne Parish reports the highest rate of uninsured adults for the Ochsner St. Anne study
area at 27.7%. Lafourche Parish is a close second at 26.8%. These rates are higher than state
(25.0%) and national (20.8%) norms.
Lafourche Parish shows the most drastic decline in it’s rates of uninsured adults going from a
high of 29.10% in 2009 down to 26.80% in the most recent data year of 2012. After an increase
from 25.90% in 2009 to 27.70% in 2010, Terrebonne Parish shows very little change between
2010 and 2012 rates.
73.2% 72.3% 75.0% 79.2%
26.8% 27.7% 25.0% 20.8%
0%
10%
20%
30%
40%
50%
60%
70%
80%
90%
100%
Lafourche Terrebonne LOUISIANA USA
Percent Population Without Medical Insurance (Uninsured Adults) ‐ 2012
Percent Population With Medical Insurance (Uninsured Adults) ‐ 2012
114

Community Health Needs Assessment Ochsner St. Anne General Hospital Tripp Umbach
Similar to uninsured adults, Terrebonne Parish reports the highest rate of uninsured children
for the study area (second in the region) at 7.2%.
The State of Louisiana reports lower rates of uninsured children as compared with the country
(7.5%)
10.00%
15.00%
20.00%
25.00%
30.00%
35.00%
2008 2009 2010 2011 2012
Percent Population without Medical Insurance (Uninsured Adults)
Lafourche
Terrebonne
LOUISIANA
USA
93.7% 92.8% 94.4% 92.5%
6.3% 7.2% 5.6% 7.5%
0%
10%
20%
30%
40%
50%
60%
70%
80%
90%
100%
Lafourche Terrebonne LOUISIANA USA
Percent Population Without Medical Insurance (Uninsured Children) ‐ 2012
Percent Population With Medical Insurance (Uninsured Children) ‐ 2012
115
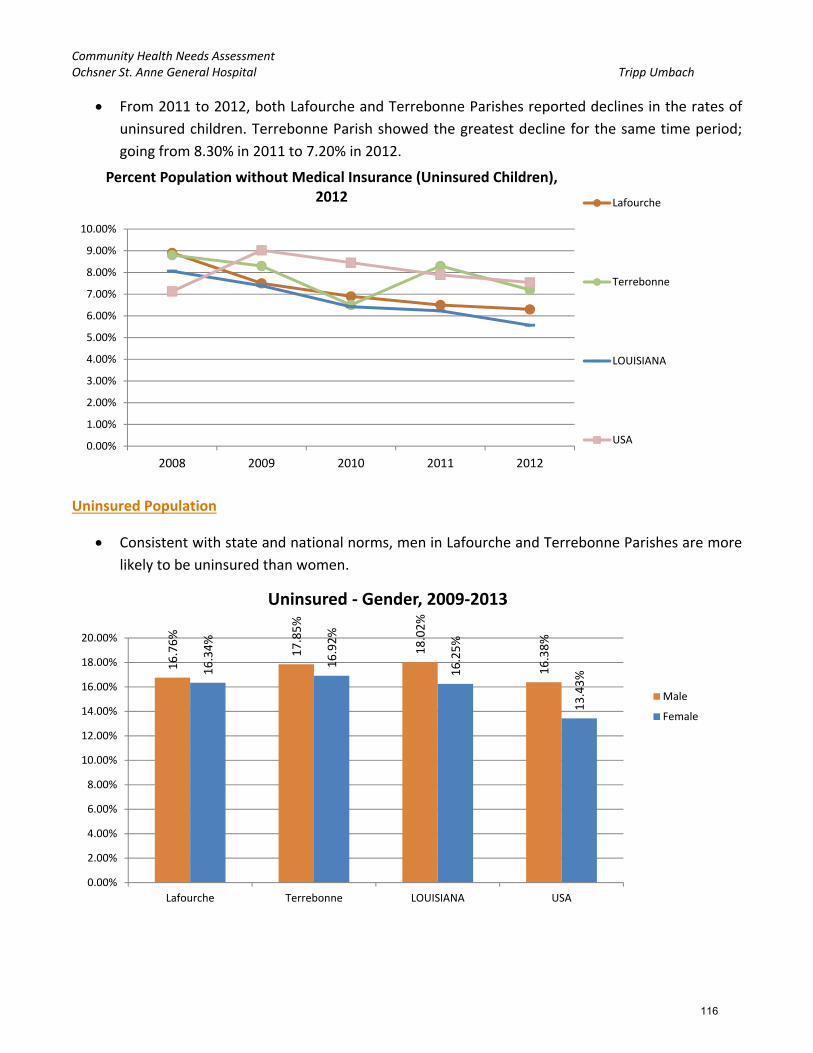
Community Health Needs Assessment Ochsner St. Anne General Hospital Tripp Umbach
From 2011 to 2012, both Lafourche and Terrebonne Parishes reported declines in the rates of
uninsured children. Terrebonne Parish showed the greatest decline for the same time period;
going from 8.30% in 2011 to 7.20% in 2012.
Uninsured Population
Consistent with state and national norms, men in Lafourche and Terrebonne Parishes are more
likely to be uninsured than women.
0.00%
1.00%
2.00%
3.00%
4.00%
5.00%
6.00%
7.00%
8.00%
9.00%
10.00%
2008 2009 2010 2011 2012
Percent Population without Medical Insurance (Uninsured Children), 2012 Lafourche
Terrebonne
LOUISIANA
USA
16.76%
17.85%
18.02%
16.38%
16.34%
16.92%
16.25%
13.43%
0.00%
2.00%
4.00%
6.00%
8.00%
10.00%
12.00%
14.00%
16.00%
18.00%
20.00%
Lafourche Terrebonne LOUISIANA USA
Uninsured ‐ Gender, 2009‐2013
Male
Female
116

Community Health Needs Assessment Ochsner St. Anne General Hospital Tripp Umbach
Those aged 18 – 64 are more likely to be uninsured as compared with those under 18 or those
65 and older.
Residents of Hispanic or Latino ethnicity are more likely to be uninsured than their
counterparts.
3.39% 6.64%
5.81%
7.61%
24.86%
24.84%
24.87%
20.59%
0.64%
0.96%
0.74%
0.97%
0.00%
5.00%
10.00%
15.00%
20.00%
25.00%
30.00%
Lafourche Terrebonne LOUISIANA USA
Uninsured ‐ Age, 2009‐2013
Under Age 18
Age 18 ‐ 64
Age 65
47.33%
51.92%
36.66%
29.62%
15.29%
15.89%
16.21%
11.92%
0.00%
10.00%
20.00%
30.00%
40.00%
50.00%
60.00%
Lafourche Terrebonne LOUISIANA USA
Uninsured ‐ Ethnicity, 2009‐2013
Hispanic/Latino
Not Hispanic or Latino
117

Community Health Needs Assessment Ochsner St. Anne General Hospital Tripp Umbach
0.00%
10.00%
20.00%
30.00%
40.00%
50.00%
60.00%
70.00%
80.00%
90.00%
100.00%
Lafourche Terrebonne LOUISIANA USA
Uninsured ‐ Race, 2009‐2013
Non‐Hispanic White
Black or African American
Native American / Alaska Native
Asian
Native Hawaiian / Pacific Islander
Some Other Race
Multiple Race
26.19% of the Native American/Alaskan Native population in Lafourche Parish is uninsured.
Residents reporting “Some other race”, across the study area, have the highest rates of being
uninsured.
More than 30% of the Asian population of Terrebonne Parish report being uninsured.
Social Support
Terrebonne Parish exhibits the highest rate of residents with a lack of social or emotional
support at 24.9% of the population; this is higher than state (21.7%) and national (20.68%)
norms.
20.90% 24.90%
21.70%
20.68%
0.00%
5.00%
10.00%
15.00%
20.00%
25.00%
30.00%
Lack of Social or Emotional Support (Age‐Adjusted Percentage), 2006‐2012 Lafourche
Terrebonne
LOUISIANA
USA
118

Community Health Needs Assessment Ochsner St. Anne General Hospital Tripp Umbach
Poverty
Terrebonne Parish shows the highest rate of population that is living below the federal poverty
level (100% FPL) at 17.06% of the population. This rate is lower than the state (19.08%) but
above the national rate (15.37%).
Lafourche Parish’s reports a lower rate with 14.08% of its population living below the federal
poverty level (100% FPL).
Across all of the study area parishes, women are more likely than men to be living in poverty.
19.95% of female residents of Terrebonne Parish are living in poverty (the highest rate across
the study area).
14.08% 17.06%
19.08%
15.37%
0.00%
5.00%
10.00%
15.00%
20.00%
25.00%
Percent Population in Poverty (Below 100% FPL), 2009‐2013
Lafourche
Terrebonne
LOUISIANA
USA
11.35%
14.11%
16.65%
14.11%
16.71% 19.95%
21.35%
16.57%
0.00%
5.00%
10.00%
15.00%
20.00%
25.00%
Lafourche Terrebonne LOUISIANA USA
Poverty ‐ Gender, 2009‐2013
Male
Female
119

Community Health Needs Assessment Ochsner St. Anne General Hospital Tripp Umbach
In general, the Hispanic/Latino population of the study area is living in poverty at higher rates
than their counterparts.
In Terrebonne Parish, 22.04% of the Hispanic/Latino population is living below the federal
poverty level (the highest for the study area).
The Native Hawaiian or Pacific Islander populations of Terrebonne Parish experience some of
the highest rates of living in poverty as compared with the other study area parishes (82.76%).
15.68%
22.04%
21.35%
24.66%
14.02%
16.85%
18.97%
13.50%
0.00%
5.00%
10.00%
15.00%
20.00%
25.00%
30.00%
Lafourche Terrebonne LOUISIANA USA
Poverty ‐ Ethnicity, 2009‐2013
Hispanic / Latino
Not Hispanic / Latino
0.00%
10.00%
20.00%
30.00%
40.00%
50.00%
60.00%
70.00%
80.00%
90.00%
Lafourche Terrebonne LOUISIANA USA
Poverty ‐ Race, 2009‐2013
White
Black or African American
Native American / AlaskaNativeAsian
Native Hawaiian / PacificIslanderSome Other Race
Multiple Race
120

Community Health Needs Assessment Ochsner St. Anne General Hospital Tripp Umbach
For populations living below 200% of the federal poverty level, Terrebonne Parish reported the
highest rate at 36.26%; this is consistent with the population living below 100% FPL.
Children in Poverty
One in four of the children and adolescents (under 18) in Terrebonne Parish are living in
poverty (below 100% FPL).
34.91% 36.26%
39.56%
34.23%
31.00%
32.00%
33.00%
34.00%
35.00%
36.00%
37.00%
38.00%
39.00%
40.00%
Percent Population with Income at or Below 200% FPL,2009‐2013
Lafourche
Terrebonne
LOUISIANA
USA
18.47%
25.01%
27%
21.58%
0.00%
5.00%
10.00%
15.00%
20.00%
25.00%
30.00%
Children in Poverty ‐ Below 100% FPL, 2009‐2013Lafourche
Terrebonne
LOUISIANA
USA
121

Community Health Needs Assessment Ochsner St. Anne General Hospital Tripp Umbach
Male and female children tend to live in poverty at similar rates in the Ochsner St. Anne study
area; however, Terrebonne Parish reports more female children living in poverty than male
children (26.48% for females compared to 23.61% for males).
Similar to gender, the ethnicity of a child varies in whether or not it is related to living in
poverty or not. For adults, the Hispanic/Latino population is more likely to live in poverty than
their counterparts; however, for children, Lafourche Parish reports higher rates of poverty in
the Non‐Hispanic population.
Terrebonne Parish reports the highest rate of Hispanic/Latino children living in poverty at
30.54%.
18.56%
23.61% 26.59%
21.45%
18.36%
26.48%
27.43%
21.72%
0.00%
5.00%
10.00%
15.00%
20.00%
25.00%
30.00%
Lafourche Terrebonne LOUISIANA USA
Children in Poverty ‐ Gender, 2009‐2013
Male
Female
122

Community Health Needs Assessment Ochsner St. Anne General Hospital Tripp Umbach
100% of the children identifying as Native Hawaiian or Pacific Islander in Terrebonne Parish are
living in poverty.
After Native Hawaiian/Pacific Islander and Native American/Alaska Native populations, the
African‐American/Black population sees some of the highest rates of poverty across the
Ochsner St. Anne study area.
o Terrebonne Parish reports higher rates than Lafourche Parish across all races.
12.56%
30.54%
25.89%
32.39%
18.75% 24.70%
27.06%
18.27%
0.00%
5.00%
10.00%
15.00%
20.00%
25.00%
30.00%
35.00%
Lafourche Terrebonne LOUISIANA USA
Children in Poverty ‐ Ethnicity, 2009‐2013
Hispanic / Latino
Not Hispanic orLatino
0.00%
10.00%
20.00%
30.00%
40.00%
50.00%
60.00%
70.00%
80.00%
90.00%
100.00%
Lafourche Terrebonne LOUISIANA USA
Children in Poverty ‐ Race, 2009‐2013
Non‐Hispanic White
Black or African American
Native American / AlaskaNative
Asian
Native Hawaiian / PacificIslander
Some Other Race
Multiple Race
123
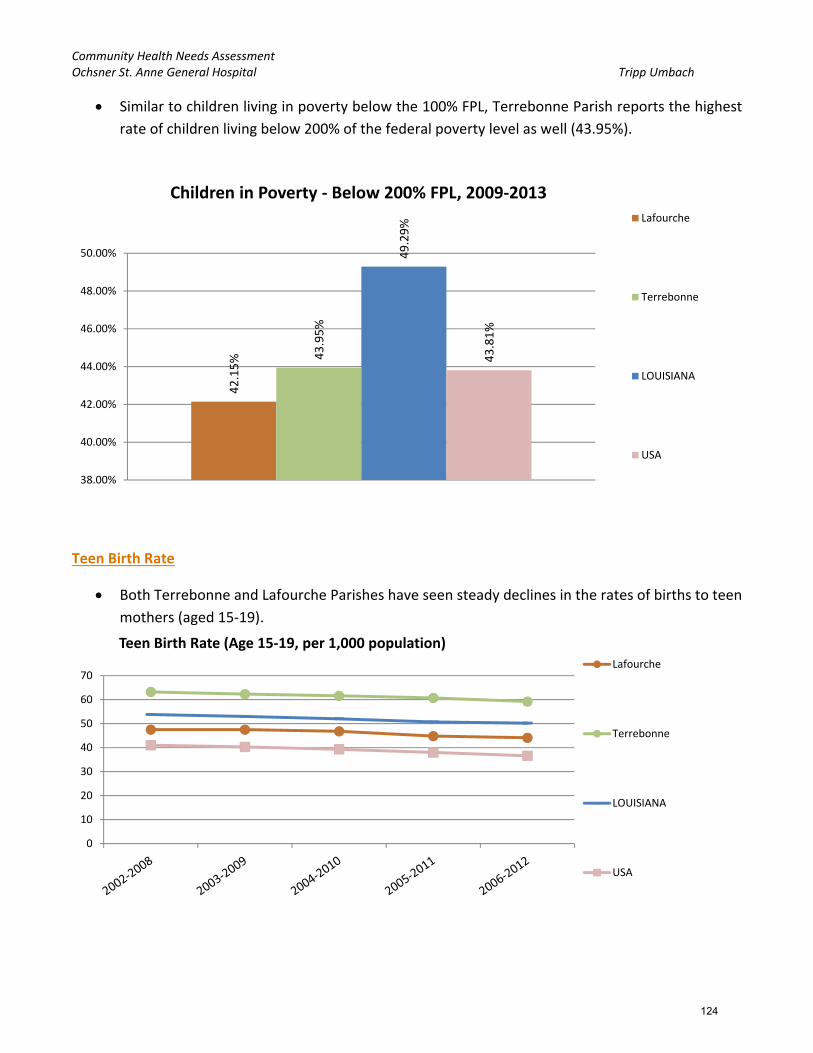
Community Health Needs Assessment Ochsner St. Anne General Hospital Tripp Umbach
Similar to children living in poverty below the 100% FPL, Terrebonne Parish reports the highest
rate of children living below 200% of the federal poverty level as well (43.95%).
Teen Birth Rate
Both Terrebonne and Lafourche Parishes have seen steady declines in the rates of births to teen
mothers (aged 15‐19).
42.15% 43.95%
49.29%
43.81%
38.00%
40.00%
42.00%
44.00%
46.00%
48.00%
50.00%
Children in Poverty ‐ Below 200% FPL, 2009‐2013Lafourche
Terrebonne
LOUISIANA
USA
0
10
20
30
40
50
60
70
Teen Birth Rate (Age 15‐19, per 1,000 population)Lafourche
Terrebonne
LOUISIANA
USA
124

Community Health Needs Assessment Ochsner St. Anne General Hospital Tripp Umbach
Across the study area, Terrebonne Parish reports the highest teen birth rates per 1,000
population in each category; Non‐Hispanic White (51.5), Non‐Hispanic Black (73.8), and
Hispanic/Latino (107).
Unemployment Rate
In 2013; Terrebonne and Lafourche Parishes report similar unemployment rates (5.1% and
5.0%, respectively). Unemployment rates, in both parishes, show a downward trend since 2010.
0
20
40
60
80
100
120
Non‐Hispanic White Non‐Hispanic Black Hispanic or Latino
Teen Birth Rate (Age 15‐19, per 1,000 population) ‐ By Race/Ethnicity,2006‐2012 Lafourche
Terrebonne
LOUISIANA
USA
0.0%
2.0%
4.0%
6.0%
8.0%
10.0%
12.0%
Unemployment Rate by Year
Lafourche
Terrebonne
LOUISIANA
USA
125

Community Health Needs Assessment Ochsner St. Anne General Hospital Tripp Umbach
For the most current reported data, Lafourche Parish reports an unemployment rate of 5.2;
Terrebonne Parish reports a higher rate of 5.8%. Both rates are lower than the State of
Louisiana (6.4%) and very close to the national rate of 5.6%
Violent Crime
Terrebonne Parish reports the highest violent crime rate at 467.76 per 100,000 population.
While Terrebonne Parish’s violent crime rate is lower than Louisiana (532.9 per 100,000
population), it is higher than the national rate of 395.5 per 100,000 population.
Lafourche Parish reports a lower rate of violent crime at only 171.28 per 100,000 population.
Lafourche Parish’s violent crime rate is substantially lower than Terrebonne Parish, Louisiana
and the nation.
171.28
462.76
532.9
395.5
0
100
200
300
400
500
600
Violent Crime Rate (Per 100,000 Pop.), 2010‐2012Lafourche
Terrebonne
LOUISIANA
USA
0.0%
1.0%
2.0%
3.0%
4.0%
5.0%
6.0%
7.0%
8.0%
Unemployment Rate by Month
Lafourche
Terrebonne
LOUISIANA
USA
126

Community Health Needs Assessment Ochsner St. Anne General Hospital Tripp Umbach
Physical Environment
Fast Food
In 2013, Terrebonne Parish reported the highest rate of fast food restaurants per population at
67.05 per 100,000 pop.; Lafourche follows at 51.91; these rates are lower than state (71.56)
and national (72.74) norms.
Grocery Stores
In 2013, Lafourche Parish reported the lowest rate of grocery stores per population at 14.54 per
100,000 pop.; Terrebonne Parish follows at 16.99 per 100,000 pop.; both are lower than state
(21.88) and national (21.2) norms.
0
10
20
30
40
50
60
70
80
Fast Food Establishments, Rate per 100,000 populationLafourche
Terrebonne
LOUISIANA
USA
0
5
10
15
20
25
Grocery Store Establishments, Rate per 100,000 population
Lafourche
Terrebonne
LOUISIANA
USA
127

Community Health Needs Assessment Ochsner St. Anne General Hospital Tripp Umbach
Recreation and Fitness Facilities
In 2013, Terrebonne Parish reported the lower rate of recreation and fitness facilities per
population at 10.73 per 100,000 pop.; Lafourche Parish follows at 11.42 per 100,000 pop.; both
are higher than state (9.6) and national (9.72) norms.
Housing
Both of the Ochsner St. Anne study area parishes have markedly lower rates of HUD‐Assisted
housing units per 10,000 units than the state and nation.
Lafourche Parish reports the highest rate for the study area at 289.25 per 10,000 units;
Terrebonne Parish follows closely with 267.96.
0
2
4
6
8
10
12
Recreation and Fitness Facility Access, Establishment Rate per 100,000 population
Lafourche
Terrebonne
LOUISIANA
USA
289.25
267.96
1,959.58
1,468.19
0
500
1000
1500
2000
2500
HUD‐Assisted Units, Rate per 10,000 Housing Units, 2013
Lafourche
Terrebonne
LOUISIANA
USA
128

Community Health Needs Assessment Ochsner St. Anne General Hospital Tripp Umbach
Housing Unit Age (below) – This indicator reports, for a given geographic area, the median year
in which all housing units (vacant and occupied) were first constructed.
Lafourche Parish has the highest median housing age, and matches the state rate, at 38 years
old.
Terrebonne Parish reports the highest rate of overcrowded housing at 5.66%; this is higher than
state (3.96%) and national (4.21%) norms.
38
36
38
39
34.5
35
35.5
36
36.5
37
37.5
38
38.5
39
39.5
Housing Unit Age ‐ Years Old, 2013
Lafourche
Terrebonne
LOUISIANA
USA
3.78%
5.66%
3.96%
4.21%
0.00%
1.00%
2.00%
3.00%
4.00%
5.00%
6.00%
Percentage of Housing Units Overcrowded, 2008‐2012
Lafourche
Terrebonne
LOUISIANA
USA
129

Community Health Needs Assessment Ochsner St. Anne General Hospital Tripp Umbach
Terrebonne Parish reports the highest rate, for the Ochsner St. Anne study area, of housing
units with substandard conditions (23.77%). The state rate is 30.09% and the national rate is
36.11%.
Lafourche Parish reports the highest rate of housing units lacking complete plumbing facilities
at 0.69% (LA = 0.54%, USA = 0.49%).
Terrebonne Parish reports the highest rate of housing units lacking complete kitchen facilities
at 4.16% (LA = 4.66%, USA = 3%).
Terrebonne Parish also reports the highest rate of housing units lacking telephone facilities at
3.02% (LA = 2.91%, USA = 2.44%).
21.97%
23.77%
30.09% 36.11%
0.00%
5.00%
10.00%
15.00%
20.00%
25.00%
30.00%
35.00%
40.00%
Percent Occupied Housing Units with One or More Substandard Conditions2009‐2013
Lafourche
Terrebonne
LOUISIANA
USA
130

Community Health Needs Assessment Ochsner St. Anne General Hospital Tripp Umbach
Terrebonne Parish reports the highest rate of vacant housing for the study area at 10.60%;
Lafourche follows at 9.66%; these are lower than state (13.5%) and national (12.45%) norms.
9.66%
10.60%
13.50%
12.45%
0.00%
2.00%
4.00%
6.00%
8.00%
10.00%
12.00%
14.00%
16.00%
Vacant Housing Units, Percent, 2009‐2013
Lafourche
Terrebonne
LOUISIANA
USA
0.69%
4.10%
2.81%
0.53%
4.16%
3.02%
0.54%
4.66%
2.91%
0.49%
3%
2.44%
0.00%
0.50%
1.00%
1.50%
2.00%
2.50%
3.00%
3.50%
4.00%
4.50%
5.00%
Housing Units LackingComplete Plumbing Facilities
Housing Units LackingComplete Kitchen Facilities
Total Housing Units LackingTelephone Service
2009‐2013
Lafourche
Terrebonne
LOUISIANA
USA
131

Community Health Needs Assessment Ochsner St. Anne General Hospital Tripp Umbach
Low Food Access
The low‐income populations of Lafourche and Terrebonne Parishes experience similar rates of
low food access (11.01% and 10.90%, respectively) to each other and the state (10.82%). Both
parishes, along with Louisiana, report rates much higher than the nation (6.27%).
Lafourche Parish experiences the highest rate of population with low or no healthy food access;
this parish has a disparity index of 37.88 compared to 19.31 for the State of Louisiana and a
national rate of 16.59.
11.01%
10.90%
10.82%
6.27%
0.00%
2.00%
4.00%
6.00%
8.00%
10.00%
12.00%
Percent Low Income Population with Low Food Access, 2010
Lafourche
Terrebonne
LOUISIANA
USA
37.88
14.47 19.31
16.59
0
5
10
15
20
25
30
35
40
Population with Low or No Healthy Food Access, Racial Disparity Index(0 = No Disparity; 1 ‐ 15 = Some Disparity; Over 15 = High Disparity)
Population with Low or No Healthy Food Access,Racial Disparity Index, 2010 Lafourche
Terrebonne
LOUISIANA
USA
132

Community Health Needs Assessment Ochsner St. Anne General Hospital Tripp Umbach
More than 67% of the Non‐Hispanic Black population, in both Lafourche and Terrebonne
Parishes, experiences low food access.
56.8% of the Non‐Hispanic Other population, in Lafourche Parish, experience low food access.
Terrebonne Parish reports higher rates of low food access than Lafourche Parish across all but
two groups. Lafourche Parish reports a higher rate for the Non‐Hispanic Other population and is
about equal with the Non‐Hispanic Black population.
Terrebonne Parish has the highest rate of SNAP‐Authorized retailers for the Ochsner St. Anne
study area at 105.49 per 100,000 population.
Lafourche Parish reports the fewest SNAP‐Authorized retailers for the study area at only 83.06
per 100,000 population.
Both parishes are above state (104.62) and national (78.44) norms.
0.0%
10.0%
20.0%
30.0%
40.0%
50.0%
60.0%
70.0%
80.0%
90.0%
100.0%
Lafourche Terrebonne LOUISIANA USA
Low Food Access ‐ Race, 2010
Non‐Hispanic White
Non‐Hispanic Black
Non‐Hispanic Asian
Non‐Hispanic American Indian/ Alaska Native
Non‐Hispanic Other
Multiple Race
Hispanic or Latino
133

Community Health Needs Assessment Ochsner St. Anne General Hospital Tripp Umbach
Lafourche Parish has the highest rate of WIC‐Authorized retailers at 25.46 per 100,000
population.
Terrebonne Parish reports the fewest WIC‐Authorized retailers for the study area with 13.4 per
100,000 population. The State of Louisiana has an overall rate of WIC‐Authorized retailers of
only 15.7 per 100,000 population; the national rate being 15.6 per 100,000 pop.
83.06
105.49
104.62
78.44
0
20
40
60
80
100
120
SNAP‐Authorized Retailers, Rate per 100,000 population, 2014
Lafourche
Terrebonne
LOUISIANA
USA
14.48
13.4
15.7
15.6
12
12.5
13
13.5
14
14.5
15
15.5
16
WIC‐Authorized Food Store Rate (Per 100,000 Population), 2011
Lafourche
Terrebonne
LOUISIANA
USA
134
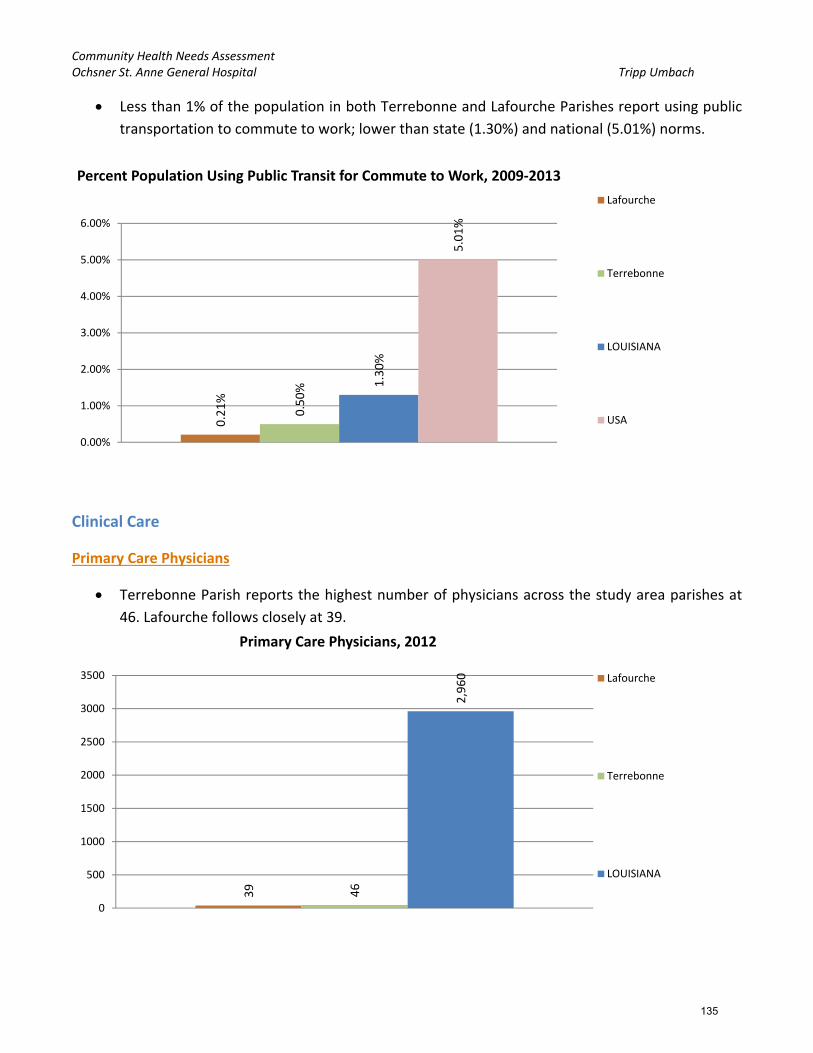
Community Health Needs Assessment Ochsner St. Anne General Hospital Tripp Umbach
Less than 1% of the population in both Terrebonne and Lafourche Parishes report using public
transportation to commute to work; lower than state (1.30%) and national (5.01%) norms.
Clinical Care
Primary Care Physicians
Terrebonne Parish reports the highest number of physicians across the study area parishes at
46. Lafourche follows closely at 39.
0.21%
0.50% 1.30%
5.01%
0.00%
1.00%
2.00%
3.00%
4.00%
5.00%
6.00%
Percent Population Using Public Transit for Commute to Work, 2009‐2013
Lafourche
Terrebonne
LOUISIANA
USA
39 46
2,960
0
500
1000
1500
2000
2500
3000
3500
Primary Care Physicians, 2012
Lafourche
Terrebonne
LOUISIANA
135

Community Health Needs Assessment Ochsner St. Anne General Hospital Tripp Umbach
Of the two parishes in the study area, Terrebonne Parish has the higher primary care physician
(PCP) rate per 100,000 population at 62.56 in 2012.
Lafourche Parish reports a lower rate of PCPs per 100,000 population at 42.6 in 2012.
Dentists
Terrebonne Parish reports the highest number of dentists across the study area
parishes/counties at 47; Lafourche Parish reports slightly less at 41.
0
10
20
30
40
50
60
70
80
90
100
Primary Care Physicians, Rate per 100,000 population
Lafourche
Terrebonne
LOUISIANA
USA
41 47
2,341
0
500
1000
1500
2000
2500
Dentists, 2013
Lafourche
Terrebonne
LOUISIANA
136

Community Health Needs Assessment Ochsner St. Anne General Hospital Tripp Umbach
Lafourche and Terrebonne Parishes reported similar rates for dentists per 100,000 population
in 2013 (42.21 and 41.69, respectively).
Both parishes fall short of the state rate of 50.61 and the national rate of 63.18.
Mammogram – Medicare Enrollees
Lafourche Parish has seen about a 1% decline in the rates of women with Medicare receiving a
mammogram; going from 60.36% in 2011 down to 59.28% in 2012.
The percentage of women with Medicare receiving a mammogram in Terrebonne Parish increased by
about 0.5%; going from 61.35% in 2011 to 61.90% in 2012.
42.21
41.69 50.61
63.18
0
10
20
30
40
50
60
70
Dentists, Rate per 100,000 population, 2013
Lafourche
Terrebonne
LOUISIANA
USA
54.00%
56.00%
58.00%
60.00%
62.00%
64.00%
66.00%
68.00%
Female Medicare Enrollees with Mammogram in Past 2 years
Lafourche
Terrebonne
LOUISIANA
USA
137

Community Health Needs Assessment Ochsner St. Anne General Hospital Tripp Umbach
Cancer Screening – Pap Test
Both parishes, Lafourche and Terrebonne, report about 80% of their populations as having
received a Pap Test; this rate is slightly higher than the national rate of 78.48%.
Cancer Screening – Sigmoidoscopy or Colonoscopy
61.34% of the national age‐appropriate population (aged 50 and older) receives a
sigmoidoscopy or colonoscopy; across the State of Louisiana only 54.5% receive this screening.
Terrebonne Parish reports the lowest rate of residents receiving a sigmoidoscopy or
colonoscopy at only 44.50%; Lafourche Parish reports 52.20%. Both are lower than state and
national norms.
79.90%
80.90%
78.10%
78.48%
35.00%
40.00%
45.00%
50.00%
55.00%
60.00%
65.00%
70.00%
75.00%
80.00%
85.00%
Cancer Screening ‐ Pap Test (Age‐Adjusted Percentage), 2006‐2012
Lafourche
Terrebonne
LOUISIANA
USA
52.20%
44.50%
54.50%
61.34%
35.00%
40.00%
45.00%
50.00%
55.00%
60.00%
65.00%
Cancer Screening ‐ Sigmoidoscopy or Colonoscopy (Age‐Adjusted Percentage)2006‐2012 Lafourche
Terrebonne
LOUISIANA
USA
138
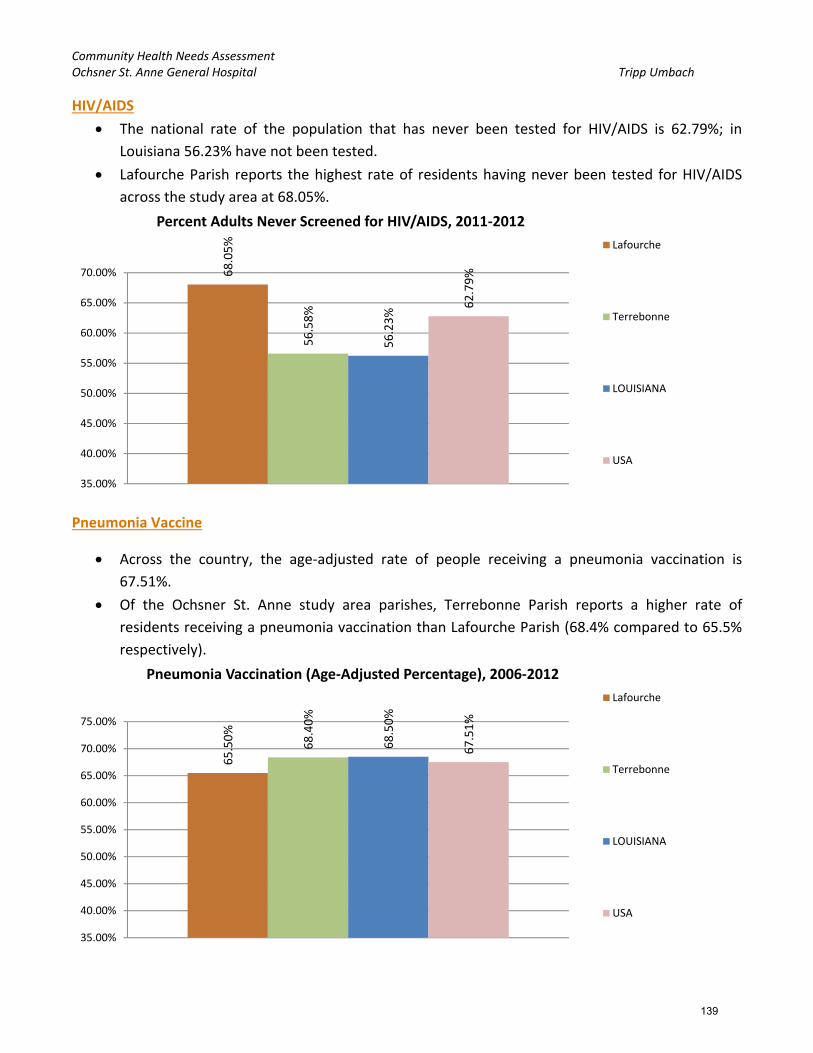
Community Health Needs Assessment Ochsner St. Anne General Hospital Tripp Umbach
HIV/AIDS
The national rate of the population that has never been tested for HIV/AIDS is 62.79%; in
Louisiana 56.23% have not been tested.
Lafourche Parish reports the highest rate of residents having never been tested for HIV/AIDS
across the study area at 68.05%.
Pneumonia Vaccine
Across the country, the age‐adjusted rate of people receiving a pneumonia vaccination is
67.51%.
Of the Ochsner St. Anne study area parishes, Terrebonne Parish reports a higher rate of
residents receiving a pneumonia vaccination than Lafourche Parish (68.4% compared to 65.5%
respectively).
68.05%
56.58%
56.23%
62.79%
35.00%
40.00%
45.00%
50.00%
55.00%
60.00%
65.00%
70.00%
Percent Adults Never Screened for HIV/AIDS, 2011‐2012
Lafourche
Terrebonne
LOUISIANA
USA
65.50%
68.40%
68.50%
67.51%
35.00%
40.00%
45.00%
50.00%
55.00%
60.00%
65.00%
70.00%
75.00%
Pneumonia Vaccination (Age‐Adjusted Percentage), 2006‐2012
Lafourche
Terrebonne
LOUISIANA
USA
139

Community Health Needs Assessment Ochsner St. Anne General Hospital Tripp Umbach
Diabetes Screening
The national rate of diabetes screening in 2012 was 84.57% of the diabetic Medicare
population. Lafourche Parish reports above the nation at 85.34% while Terrebonne falls below
at 83.16%.
High Blood Pressure
Both parishes in the Ochsner St. Anne study area report lower rates of adult residents with high
blood pressure who are not taking their medication than the national average; the national rate
being 21.74%.
Terrebonne Parish has the higher rate at 14.63%. Lafourche reports a lower rate of 8.74%.
70.00%
72.00%
74.00%
76.00%
78.00%
80.00%
82.00%
84.00%
86.00%
88.00%
90.00%
Diabetes Management ‐ Hemoglobin A1c Test, Percent Medicare Enrollees with Diabetes with Annual Exam Lafourche
Terrebonne
LOUISIANA
USA
8.74%
14.63%
16.29%
21.74%
0.00%
5.00%
10.00%
15.00%
20.00%
25.00%
High Blood Pressure, Percent Adults Not Taking Medication, 2006‐2010
Lafourche
Terrebonne
LOUISIANA
USA
140

Community Health Needs Assessment Ochsner St. Anne General Hospital Tripp Umbach
Dental Exam
36.91% of the adult population in Terrebonne Parish have not had a dental exam; 30.67% in
Lafourche. The national rate is 30.15%.
Federally Qualified Health Centers (FQHCs)
Terrebonne Parish has the higher rate, in the study area, of federally qualified health centers
per 100,000 population at 1.79 (similar to the national rate of 1.92).
Lafourche Parish reports 0 FQHCs per 100,000 population.
30.67%
36.91%
34.28%
30.15%
0.00%
5.00%
10.00%
15.00%
20.00%
25.00%
30.00%
35.00%
40.00%
Percent Adults with No Dental Exam, 2006‐2010
Lafourche
Terrebonne
LOUISIANA
USA
0
1.79
2.1
1.92
0
0.5
1
1.5
2
2.5
Rate of Federally Qualified Health Centers per 100,000 population,2014 Lafourche
Terrebonne
LOUISIANA
USA
141

Community Health Needs Assessment Ochsner St. Anne General Hospital Tripp Umbach
Regular Doctor
Across the country, 22.07% of residents report not having a regular doctor (77.93% have a
regular doctor); in Louisiana the rate is 24.09%.
Lafourche Parish reports the highest rate of residents who do not have a regular doctor at
20.20%.
Population Living in an HPSA (Health Professional Shortage Area)
The parishes of Lafourche and Terrebonne are both health care professional shortage areas
(HPSA) designated parishes/counties; therefore 100% of their populations live in an HPSA
designated area.
20.20%
19.61% 24.09%
22.07%
0.00%
5.00%
10.00%
15.00%
20.00%
25.00%
30.00%
Percent Adults Without Any Regular Doctor, 2011‐2012
Lafourche
Terrebonne
LOUISIANA
USA
100%
100%
74.13%
34.07%
0%
10%
20%
30%
40%
50%
60%
70%
80%
90%
100%
Percentage of Population Living in a HPSA, March 2015
Lafourche
Terrebonne
LOUISIANA
USA
142

Community Health Needs Assessment Ochsner St. Anne General Hospital Tripp Umbach
Health Behaviors
Leisure Time Physical Activity
Lafourche and Terrebonne Parishes report nearly identical rates of population with no leisure
time activity (33.50% and 33.60%, respectively) for the study area; higher than state (29.8%)
and national (22.64%) norms.
Men consistently report lower rates of not partaking in leisure time physical activity than
women; this may be a reporting difference or that women do not actually partake in leisure
time physical activity as men.
33.50%
33.60%
29.80%
22.64%
0.00%
5.00%
10.00%
15.00%
20.00%
25.00%
30.00%
35.00%
40.00%
Percent Population with No Leisure Time Physical Activity, 2012Lafourche
Terrebonne
LOUISIANA
USA
30.50%
29.60%
26.45%
21.20%
36.20%
37.30%
32.87%
23.94%
0.00%
5.00%
10.00%
15.00%
20.00%
25.00%
30.00%
35.00%
40.00%
Percent Population with No Leisure Time Physical Activity ‐ Gender, 2012
Males
Females
143

Community Health Needs Assessment Ochsner St. Anne General Hospital Tripp Umbach
As with the rates for 2012, Terrebonne and Lafourche Parishes show similarities in the trending
of rates of population with no leisure time physical activity from 2004 to the most recent data
of 2012.
Fruit/Vegetable Consumption
Both parishes in the Ochsner St. Anne study area report higher rates than the national rate
(75.6%) for adults not eating enough fruits and vegetables.
20.00%
22.00%
24.00%
26.00%
28.00%
30.00%
32.00%
34.00%
36.00%
38.00%
40.00%
Percent Population with No Leisure Time Physical Activity ‐ Time
Lafourche
Terrebonne
LOUISIANA
USA
81.40%
84.50%
81.10%
75.67%
70.00%
72.00%
74.00%
76.00%
78.00%
80.00%
82.00%
84.00%
86.00%
Percent Adults with Inadequate Fruit/Vegetable Consumption, 2005‐2009
Lafourche
Terrebonne
LOUISIANA
USA
144
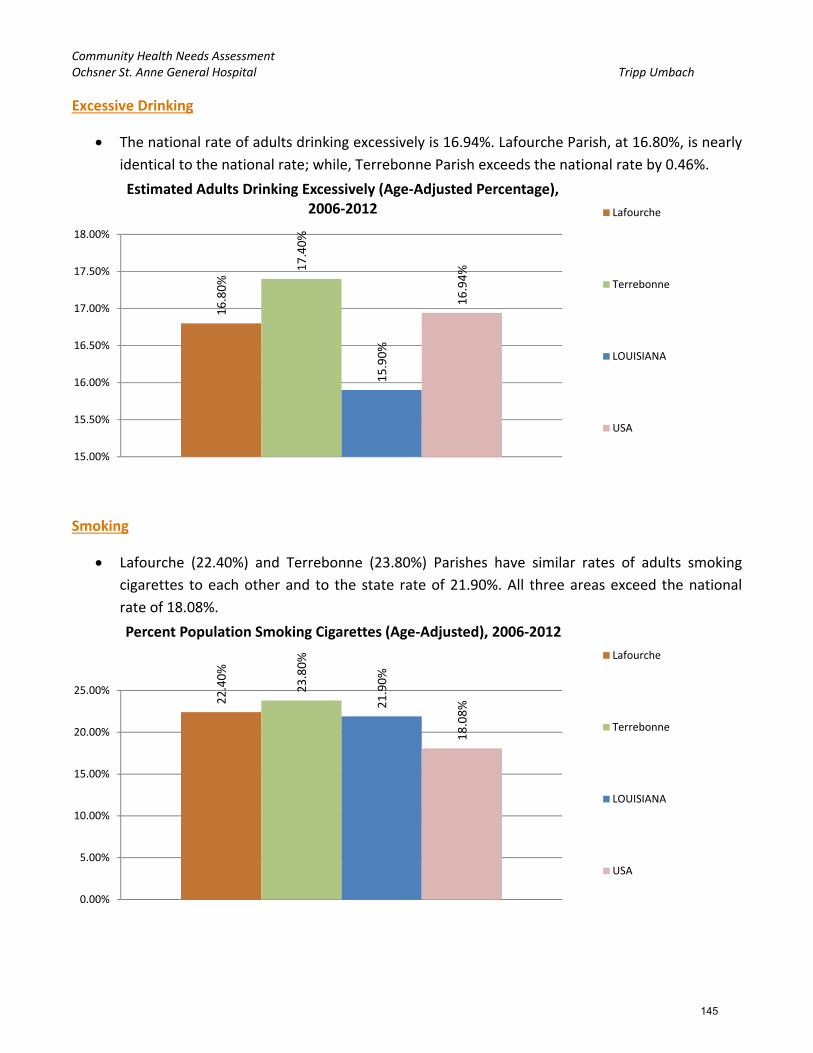
Community Health Needs Assessment Ochsner St. Anne General Hospital Tripp Umbach
Excessive Drinking
The national rate of adults drinking excessively is 16.94%. Lafourche Parish, at 16.80%, is nearly
identical to the national rate; while, Terrebonne Parish exceeds the national rate by 0.46%.
Smoking
Lafourche (22.40%) and Terrebonne (23.80%) Parishes have similar rates of adults smoking
cigarettes to each other and to the state rate of 21.90%. All three areas exceed the national
rate of 18.08%.
16.80%
17.40%
15.90%
16.94%
15.00%
15.50%
16.00%
16.50%
17.00%
17.50%
18.00%
Estimated Adults Drinking Excessively (Age‐Adjusted Percentage),2006‐2012 Lafourche
Terrebonne
LOUISIANA
USA
22.40%
23.80%
21.90%
18.08%
0.00%
5.00%
10.00%
15.00%
20.00%
25.00%
Percent Population Smoking Cigarettes (Age‐Adjusted), 2006‐2012
Lafourche
Terrebonne
LOUISIANA
USA
145

Community Health Needs Assessment Ochsner St. Anne General Hospital Tripp Umbach
Terrebonne Parish reports the highest rate of adults trying to quit smoking in the past 12
months at 53.30%; while, only 45.17% of adults in Lafourche Parish are trying to quit smoking.
Both parishes fall below state (60.22%) and national (60.02%) rates.
Health Outcomes
Depression
The State of Louisiana reports a higher rate of residents with depression (15.66%) than the
country (15.45%).
Both parishes in the study area report lower rates than the state and the nation.
45.17% 53.30%
60.22%
60.02%
0.00%
10.00%
20.00%
30.00%
40.00%
50.00%
60.00%
70.00%
Percent Smokers with Quit Attempts in Past 12 Months, 2011‐2012
Lafourche
Terrebonne
LOUISIANA
USA
14.94%
14.73%
15.66%
15.45%
14.20%
14.40%
14.60%
14.80%
15.00%
15.20%
15.40%
15.60%
15.80%
Percent Population with Depression, 2012Lafourche
Terrebonne
LOUISIANA
USA
146
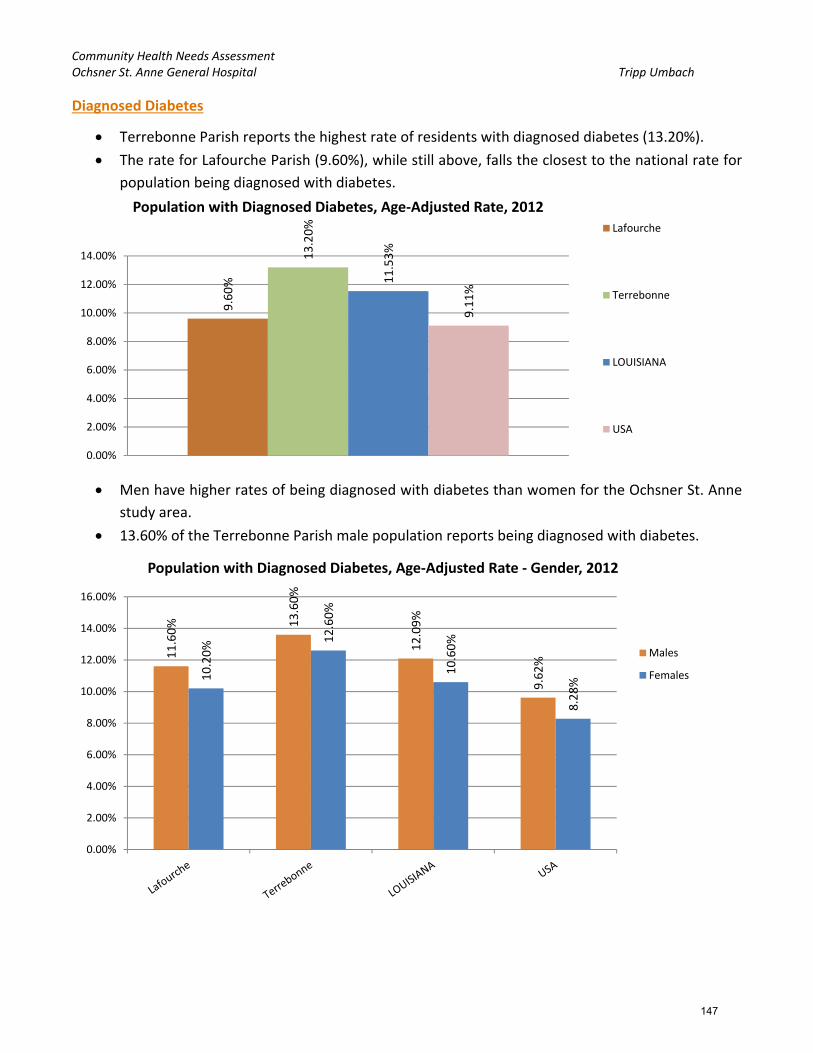
Community Health Needs Assessment Ochsner St. Anne General Hospital Tripp Umbach
Diagnosed Diabetes
Terrebonne Parish reports the highest rate of residents with diagnosed diabetes (13.20%).
The rate for Lafourche Parish (9.60%), while still above, falls the closest to the national rate for
population being diagnosed with diabetes.
Men have higher rates of being diagnosed with diabetes than women for the Ochsner St. Anne
study area.
13.60% of the Terrebonne Parish male population reports being diagnosed with diabetes.
9.60%
13.20%
11.53%
9.11%
0.00%
2.00%
4.00%
6.00%
8.00%
10.00%
12.00%
14.00%
Population with Diagnosed Diabetes, Age‐Adjusted Rate, 2012Lafourche
Terrebonne
LOUISIANA
USA
11.60% 13.60%
12.09%
9.62%
10.20%
12.60%
10.60%
8.28%
0.00%
2.00%
4.00%
6.00%
8.00%
10.00%
12.00%
14.00%
16.00%
Population with Diagnosed Diabetes, Age‐Adjusted Rate ‐ Gender, 2012
Males
Females
147

Community Health Needs Assessment Ochsner St. Anne General Hospital Tripp Umbach
The rate of diagnosed diabetes cases has seen steady and marked rises from 2004 to 2009 for
the Ochsner St. Anne study area parishes. The rate for Lafourche Parish has seen a decline (by
more than 2% since 2009) to 9.80% in 2011.
Looking specifically at the Medicare population, Lafourche Parish reports the highest rate of
diagnosed diabetes at 30.12%; the national rate being 27.03%.
6.00%
8.00%
10.00%
12.00%
14.00%
16.00%
Population with Diagnosed Diabetes, Age‐Adjusted Rate ‐ Time
Lafourche
Terrebonne
LOUISIANA
USA
30.12%
29.52%
29.05%
27.03%
25.00%
25.50%
26.00%
26.50%
27.00%
27.50%
28.00%
28.50%
29.00%
29.50%
30.00%
30.50%
Percent Adults with Diabetes (Medicare Population), 2012
Lafourche
Terrebonne
LOUISIANA
USA
148
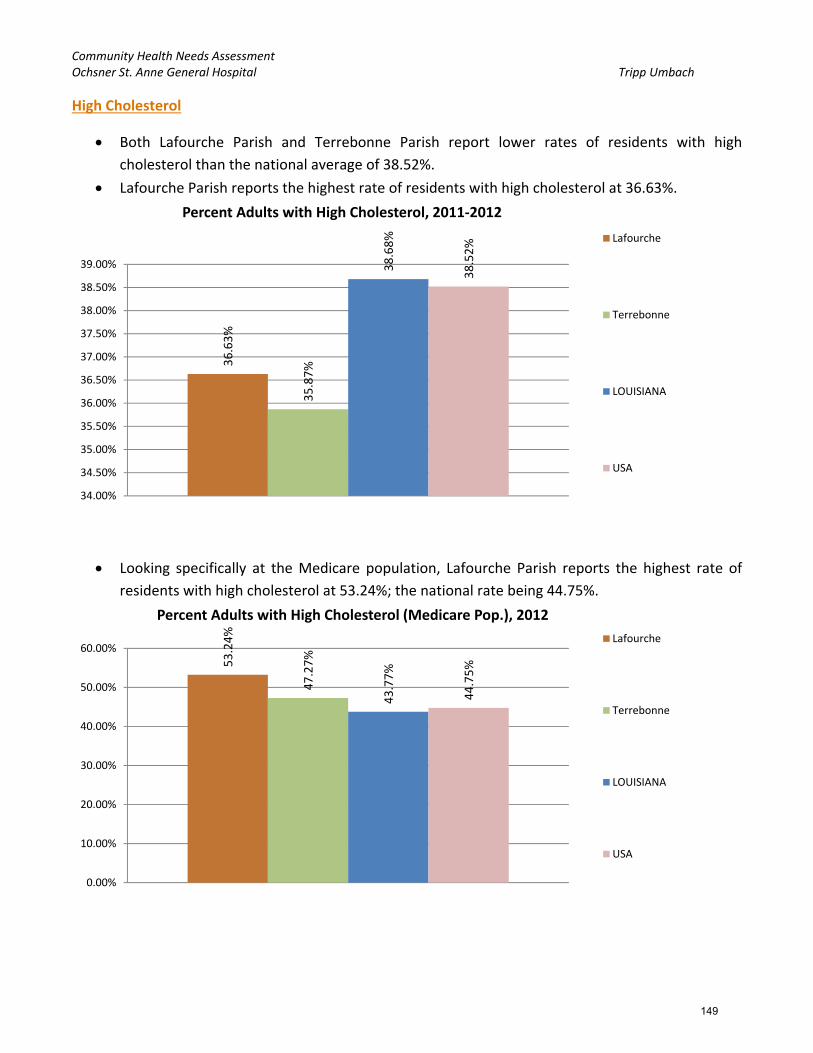
Community Health Needs Assessment Ochsner St. Anne General Hospital Tripp Umbach
High Cholesterol
Both Lafourche Parish and Terrebonne Parish report lower rates of residents with high
cholesterol than the national average of 38.52%.
Lafourche Parish reports the highest rate of residents with high cholesterol at 36.63%.
Looking specifically at the Medicare population, Lafourche Parish reports the highest rate of
residents with high cholesterol at 53.24%; the national rate being 44.75%.
36.63%
35.87%
38.68%
38.52%
34.00%
34.50%
35.00%
35.50%
36.00%
36.50%
37.00%
37.50%
38.00%
38.50%
39.00%
Percent Adults with High Cholesterol, 2011‐2012
Lafourche
Terrebonne
LOUISIANA
USA
53.24%
47.27%
43.77%
44.75%
0.00%
10.00%
20.00%
30.00%
40.00%
50.00%
60.00%
Percent Adults with High Cholesterol (Medicare Pop.), 2012
Lafourche
Terrebonne
LOUISIANA
USA
149

Community Health Needs Assessment Ochsner St. Anne General Hospital Tripp Umbach
Heart Disease
Terrebonne Parish reports the highest rate of residents who have heart disease (6.11%); higher
than the national rate of 4.40%.
Looking specifically at the Medicare population, Lafourche and Terrebonne Parishes report
similar rates of residents with heart disease (36.96% and 36.31%, respectively); the national
rate being 28.55%.
3.66%
6.11%
4.91%
4.40%
0.00%
1.00%
2.00%
3.00%
4.00%
5.00%
6.00%
7.00%
Percent Adults with Heart Disease, 2011‐2012
Lafourche
Terrebonne
LOUISIANA
USA
36.96%
36.31%
32.24%
28.55%
0.00%
5.00%
10.00%
15.00%
20.00%
25.00%
30.00%
35.00%
40.00%
Percent Adults with Heart Disease (Medicare Pop.), 2012
Lafourche
Terrebonne
LOUISIANA
USA
150

Community Health Needs Assessment Ochsner St. Anne General Hospital Tripp Umbach
High Blood Pressure
Lafourche and Terrebonne Parishes report similar rates of residents with high blood pressure
(35.30% and 35.10%, respectively); both are higher than the national rate of 28.16%.
Looking specifically at the Medicare population, Lafourche Parish reports the highest rate of
residents with high blood pressure at 67.71%; the national rate being 55.49%.
35.30%
35.10%
34.10%
28.16%
0.00%
5.00%
10.00%
15.00%
20.00%
25.00%
30.00%
35.00%
40.00%
Percent Adults with High Blood Pressure, 2006‐2012
Lafourche
Terrebonne
LOUISIANA
USA
67.71%
62.51%
61.83%
55.49%
0.00%
10.00%
20.00%
30.00%
40.00%
50.00%
60.00%
70.00%
80.00%
Percent Adults with High Blood Pressure (Medicare Pop.), 2012
Lafourche
Terrebonne
LOUISIANA
USA
151

Community Health Needs Assessment Ochsner St. Anne General Hospital Tripp Umbach
Overweight and Obese
Lafourche Parish reports the highest rate of residents who are overweight (34.45%); this rate is
lower than the national rate of 35.78%. Terrebonne Parish is lower still, than the state, at
30.52%.
Terrebonne Parish reports the highest rate of residents who are obese (39.40%); Lafourche
Parish is not too far behind at 36%. Both parishes exceed the state rate (34.14%) and the
national rate (27.14%).
34.45%
30.52%
34.48% 35.78%
27.00%
28.00%
29.00%
30.00%
31.00%
32.00%
33.00%
34.00%
35.00%
36.00%
37.00%
Percent Adults Overweight, 2011‐2012
Lafourche
Terrebonne
LOUISIANA
USA
36% 39.40%
34.14%
27.14%
0%
5%
10%
15%
20%
25%
30%
35%
40%
45%
Percent Adults with BMI > 30.0 (Obese), 2012
Lafourche
Terrebonne
LOUISIANA
USA
152

Community Health Needs Assessment Ochsner St. Anne General Hospital Tripp Umbach
There are not significant differences in males and females in terms of obesity; men show higher
rates of obesity than women.
On a national level, men are more likely to be obese than women (27.7% vs. 26.59%).
The rates of obesity in the Ochsner St. Anne study area and nationally have seen steady rises
over the years. Lafourche Parish is the lowest in the study area but, still almost 10% above the
U.S. rates for obesity.
38.10%
39.60%
34.17%
27.70%33.90% 39.20%
34.08%
26.59%
0.00%
5.00%
10.00%
15.00%
20.00%
25.00%
30.00%
35.00%
40.00%
45.00%
Percent Adults with BMI > 30.0 (Obese) ‐ Gender, 2012
Males
Females
20.00%
25.00%
30.00%
35.00%
40.00%
45.00%
50.00%
Percent Adults with BMI > 30.0 (Obese) ‐ Time
Lafourche
Terrebonne
LOUISIANA
USA
153

Community Health Needs Assessment Ochsner St. Anne General Hospital Tripp Umbach
Asthma
Terrebonne Parish reports the highest rate of adults with asthma for the study area at 11.46%;
this is lower than both the state rate (11.65%) and the national rate of 13.36%.
Dental Health
Lafourche Parish reports the highest rate of adults with poor dental health for the Ochsner St.
Anne study area at 19.10%; this is higher than the national rate of 15.65%.
While Terrebonne Parish reports a lower rate of 16.65%, it is still above the nation.
8.94%
11.46%
11.65% 13.36%
0.00%
2.00%
4.00%
6.00%
8.00%
10.00%
12.00%
14.00%
16.00%
Percent Adults with Asthma, 2011‐2012
Lafourche
Terrebonne
LOUISIANA
USA
19.10%
16.65%
18.70%
15.65%
0.00%
5.00%
10.00%
15.00%
20.00%
25.00%
Percentage Adults with Poor Dental Health, 2006‐2010
Lafourche
Terrebonne
LOUISIANA
USA
154

Community Health Needs Assessment Ochsner St. Anne General Hospital Tripp Umbach
Poor Health
Lafourche Parish reports a higher rate of poor general health than Terrebonne Parish (23% and
19.60% respectively).
Both parishes, along with Louisiana, exceed the national rate of 15.74%.
Chlamydia Infection
Terrebonne Parish reports 134.5 per 100,000 population more cases of chlamydia infection
than Lafourche Parish (721.1 and 586.6, respectively). The national chlamydia rate is 454.1 per
100,000 population.
19.60% 23%
19.60%
15.74%
0.00%
5.00%
10.00%
15.00%
20.00%
25.00%
Poor General Health, Age‐Adjusted Percentage, 2006‐2012
Lafourche
Terrebonne
LOUISIANA
USA
0.0
100.0
200.0
300.0
400.0
500.0
600.0
700.0
800.0
Chlamydia Infection Rate (Per 100,000 Pop.)
Lafourche
Terrebonne
LOUISIANA
USA
155

Community Health Needs Assessment Ochsner St. Anne General Hospital Tripp Umbach
Gonorrhea Infection
Lafourche and Terrebonne Parishes report similar rates of gonorrhea infection; 133.4 and 130.5
per population, respectively. The national chlamydia rate is 103.09 per 100,000 population.
HIV/AIDS
The Non‐Hispanic Black population is the population that sees some of the highest rates of
HIV/AIDS.
Terrebonne Parish sees the highest rates of HIV/AIDS for the study area; 397.26 per 100,000
Non‐Hispanic Black population has HIV/AIDS, 124.31 per 100,000 Non‐Hispanic White, and
177.88 per 100,000 Hispanic/Latino population.
0.0
50.0
100.0
150.0
200.0
250.0
300.0
Gonorrhea Infection Rate (Per 100,000 Pop.)
Lafourche
Terrebonne
LOUISIANA
USA
0
200
400
600
800
1000
1200
1400
Non‐Hispanic White Non‐Hispanic Black Hispanic / Latino
Population with HIV/AIDS, Rate (Per 1,000 population) ‐ By Race/Ethnicity2010 Lafourche
Terrebonne
LOUISIANA
USA
156
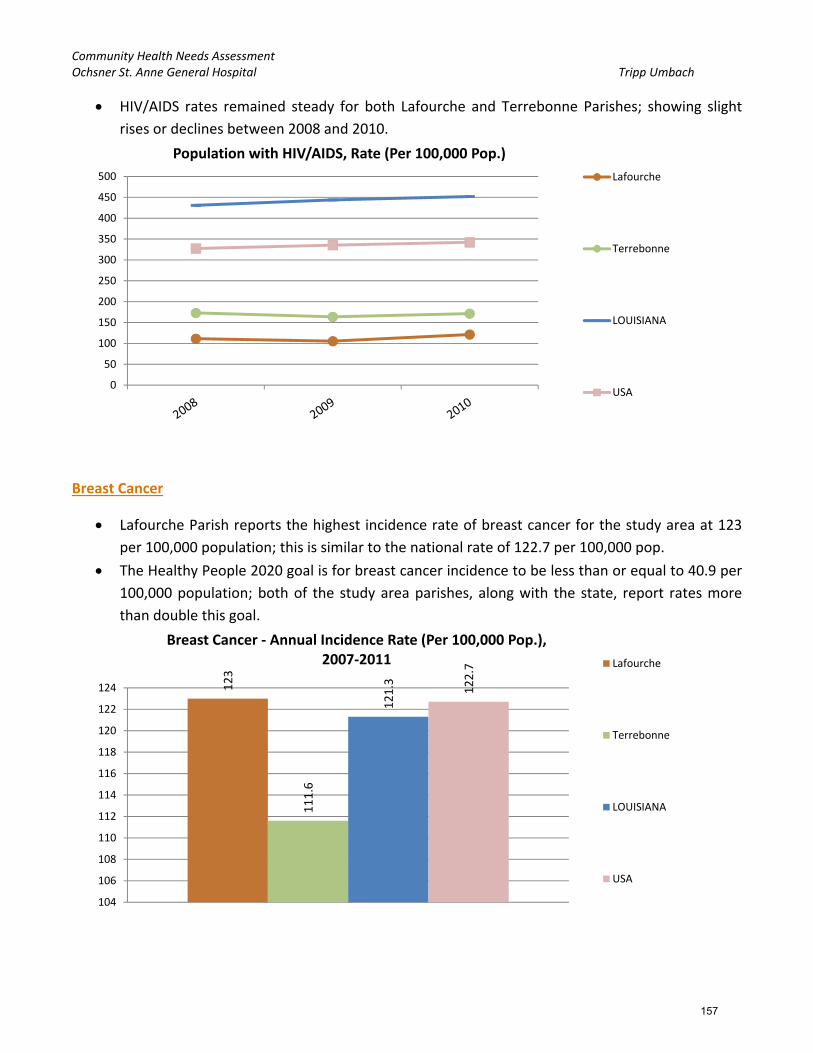
Community Health Needs Assessment Ochsner St. Anne General Hospital Tripp Umbach
HIV/AIDS rates remained steady for both Lafourche and Terrebonne Parishes; showing slight
rises or declines between 2008 and 2010.
Breast Cancer
Lafourche Parish reports the highest incidence rate of breast cancer for the study area at 123
per 100,000 population; this is similar to the national rate of 122.7 per 100,000 pop.
The Healthy People 2020 goal is for breast cancer incidence to be less than or equal to 40.9 per
100,000 population; both of the study area parishes, along with the state, report rates more
than double this goal.
0
50
100
150
200
250
300
350
400
450
500
Population with HIV/AIDS, Rate (Per 100,000 Pop.)
Lafourche
Terrebonne
LOUISIANA
USA
123
111.6
121.3 122.7
104
106
108
110
112
114
116
118
120
122
124
Breast Cancer ‐ Annual Incidence Rate (Per 100,000 Pop.),2007‐2011 Lafourche
Terrebonne
LOUISIANA
USA
157

Community Health Needs Assessment Ochsner St. Anne General Hospital Tripp Umbach
The White population of Lafourche Parish reports the highest rate of breast cancer incidence
when looking at incidence by race/ethnicity (123.2 per 100,000 pop.). Followed closely by its
Black population (122.6 per 100,000 pop.).
Cervical Cancer
Lafourche Parish reports the highest incidence rate of cervical cancer for the study area at 10
per 100,000 population; this is higher than the national rate of 7.8 per 100,000 pop.
The Healthy People 2020 goal is for cervical cancer incidence to be less than or equal to 7.1 per
100,000 population; both of the study area parishes, Louisiana, and the nation report rates
higher than this goal.
0
20
40
60
80
100
120
140
White Black Asian / PacificIslander
American Indian /Alaskan Native
Hispanic or Latino
Breast Cancer ‐ Annual Incidence Rate (Per 100,000 pop.) ‐By Race/Ethnicity, 2007‐2011 Lafourche
Terrebonne
LOUISIANA
USA
10
8.9 9.4
7.8
0
2
4
6
8
10
12
Cervical Cancer ‐ Annual Incidence Rate (Per 100,000 Pop.)2007‐2011 Lafourche
Terrebonne
LOUISIANA
USA
158

Community Health Needs Assessment Ochsner St. Anne General Hospital Tripp Umbach
Colon and Rectum Cancer
Terrebonne Parish reports the highest incidence rate of colon and rectum cancer for the
Ochsner St. Anne study area at 50.3 per 100,000 population; this is higher than the national
rate of 43.3 per 100,000 pop.
The Healthy People 2020 goal is for colon and rectum cancer incidence to be less than or equal
to 38.7 per 100,000 population; both of the study area parishes, Louisiana, and the nation
report rates higher than this goal.
The African‐American/Black population reports higher rates of colon and rectum cancer
incidence as compared with other racial groups for the study area, the state, and nationally.
48.3
50.3 51
43.3
38
40
42
44
46
48
50
52
Colon and Rectum Cancer ‐ Annual Incidence Rate (Per 100,000 Pop.)2007‐2011 Lafourche
Terrebonne
LOUISIANA
USA
0
10
20
30
40
50
60
70
White Black Asian / PacificIslander
American Indian /Alaskan Native
Hispanic or Latino
Colon and Rectum Cancer ‐ Annual Incidence Rate (Per 100,000 pop.) ‐By Race/Ethnicity, 2007‐2011 Lafourche
Terrebonne
LOUISIANA
USA
159
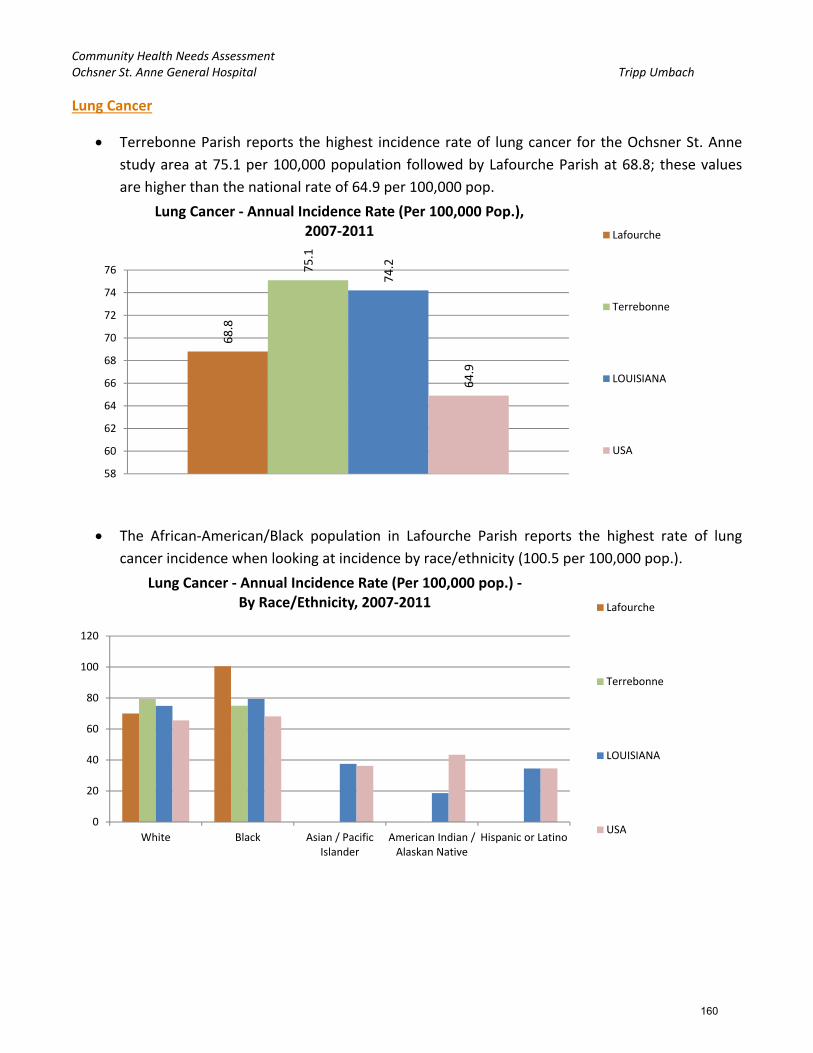
Community Health Needs Assessment Ochsner St. Anne General Hospital Tripp Umbach
Lung Cancer
Terrebonne Parish reports the highest incidence rate of lung cancer for the Ochsner St. Anne
study area at 75.1 per 100,000 population followed by Lafourche Parish at 68.8; these values
are higher than the national rate of 64.9 per 100,000 pop.
The African‐American/Black population in Lafourche Parish reports the highest rate of lung
cancer incidence when looking at incidence by race/ethnicity (100.5 per 100,000 pop.).
68.8
75.1
74.2
64.9
58
60
62
64
66
68
70
72
74
76
Lung Cancer ‐ Annual Incidence Rate (Per 100,000 Pop.),2007‐2011 Lafourche
Terrebonne
LOUISIANA
USA
0
20
40
60
80
100
120
White Black Asian / PacificIslander
American Indian /Alaskan Native
Hispanic or Latino
Lung Cancer ‐ Annual Incidence Rate (Per 100,000 pop.) ‐By Race/Ethnicity, 2007‐2011 Lafourche
Terrebonne
LOUISIANA
USA
160

Community Health Needs Assessment Ochsner St. Anne General Hospital Tripp Umbach
Prostate Cancer
Both parishes in the study area report similar incidence rates of prostate cancer per 100,000
population for the Ochsner St. Anne study area (Lafourche = 147.3; Terrebonne = 135.6); these
values are close to the national rate of 142.3 per 100,000 pop.
The African‐American/Black population reports higher rates of prostate cancer incidence as
compared with other racial groups for the study area, the states, and nationally.
147.3
135.6
168.9
142.3
0
20
40
60
80
100
120
140
160
180
Prostate Cancer ‐ Annual Incidence Rate (Per 100,000 Pop.)2007‐2011 Lafourche
Terrebonne
LOUISIANA
USA
0
50
100
150
200
250
White Black Asian / PacificIslander
American Indian /Alaskan Native
Hispanic or Latino
Prostate Cancer ‐ Annual Incidence Rate (Per 100,000 pop.) ‐By Race/Ethnicity, 2007‐2011 Lafourche
Terrebonne
LOUISIANA
USA
161

Community Health Needs Assessment Ochsner St. Anne General Hospital Tripp Umbach
Low Birth Weight
Terrebonne Parish reports the highest rate of low‐weight births for the study area at 10%
followed closely by Lafourche Parish with 9.20%.
Both parishes and Louisiana report higher rates of low‐weight births than the national rate of
8.2%.
The Healthy People 2020 goal is for low – weight births to be less than or equal to 7.8%; both
parishes and state report rates higher than this goal.
The Non‐Hispanic African‐American/Black population sees higher rates of low‐weight births as
compared with other racial groups for the Ochsner St. Anne study area, the state, and
nationally.
9.20%
10% 10.90%
8.20%
0.00%
2.00%
4.00%
6.00%
8.00%
10.00%
12.00%
Low Birth Weight, Percent of Total, 2006‐2012
Lafourche
Terrebonne
LOUISIANA
USA
0.00%
2.00%
4.00%
6.00%
8.00%
10.00%
12.00%
14.00%
16.00%
18.00%
Non‐Hispanic White Non‐Hispanic Black Non‐Hispanic Asian orPacific Islander
Hispanic or Latino
Low Birth Weight, Percent of Total ‐ By Race/Ethnicity, 2006‐2012
Lafourche
Terrebonne
LOUISIANA
USA
162

Community Health Needs Assessment Ochsner St. Anne General Hospital Tripp Umbach
Terrebonne Parish reports the highest rate of low‐weight births for the study area in 2006‐2012
(10%), but this rate has been steadily declining since 2002‐2008.
Mortality ‐ Cancer
Terrebonne Parish reports the highest rate of age‐adjusted mortality due to cancer for the
Ochsner St. Anne study area at 216.94 per 100,000 population.
Both parishes in the study area report higher rates of mortality due to cancer than the national
rate of 174.08 per 100,000 population.
The Healthy People 2020 goal is for mortality due to cancer to be less than or equal to 160.6
per 100,000 population; both of the study area parishes and state report rates higher than this
goal.
5.00%
6.00%
7.00%
8.00%
9.00%
10.00%
11.00%
12.00%
13.00%
14.00%
15.00%
Low Birth Weight, Percent of Total ‐ By Year
Lafourche
Terrebonne
LOUISIANA
USA
189.65
216.94
198.92
174.08
0
50
100
150
200
250
Mortality ‐ Cancer ‐ Age‐Adjusted Death Rate, (Per 100,000 Pop.),2007‐2011 Lafourche
Terrebonne
LOUISIANA
USA
163

Community Health Needs Assessment Ochsner St. Anne General Hospital Tripp Umbach
Across the Ochsner St. Anne study area, both of the parishes, state, and nationally; men have
higher mortality rates due to cancer than women.
The Non‐Hispanic Asian population of Terrebonne Parish reports the highest rate of mortality
due to cancer for the study area with 289.51 per 100,000 population.
239.48
277.21250.54
211.52
157.67171.55 162.56
147.92
0
50
100
150
200
250
300
Mortality ‐ Cancer ‐ Age‐Adjusted Death Rate, (Per 100,000 Pop.) ‐ By Gender, 2007‐2011
Male
Female
0
50
100
150
200
250
300
350
Non‐HispanicWhite
Non‐HispanicBlack
Non‐HispanicAsian
Non‐HispanicAmerican Indian /Alaskan Native
Hispanic or Latino
Mortality ‐ Cancer ‐ Age‐Adjusted Death Rate, (Per 100,000 Pop.) ‐By Race/Ethnicity, 2007‐2011
Lafourche
Terrebonne
LOUISIANA
USA
164

Community Health Needs Assessment Ochsner St. Anne General Hospital Tripp Umbach
Mortality – Heart Disease
Terrebonne Parish reports the highest rate of age‐adjusted mortality due to heart disease for
the Ochsner St. Anne study area at 227.55 per 100,000 population.
On a national level and for all of the Ochsner St. Anne study area, men are more likely to die as
a result of heart disease than women.
205.58
227.55
228.79
184.55
0
50
100
150
200
250
Mortality ‐ Heart Disease ‐ Age‐Adjusted Death Rate, (Per 100,000 Pop.)2007‐2011 Lafourche
Terrebonne
LOUISIANA
USA
268.03285.11 283.02
230.61
159.38178.53 186.54
148.54
0
50
100
150
200
250
300
Mortality ‐ Heart Disease ‐ Age‐Adjusted Death Rate, (Per 100,000 Pop.) ‐By Gender, 2007‐2011
Male
Female
165
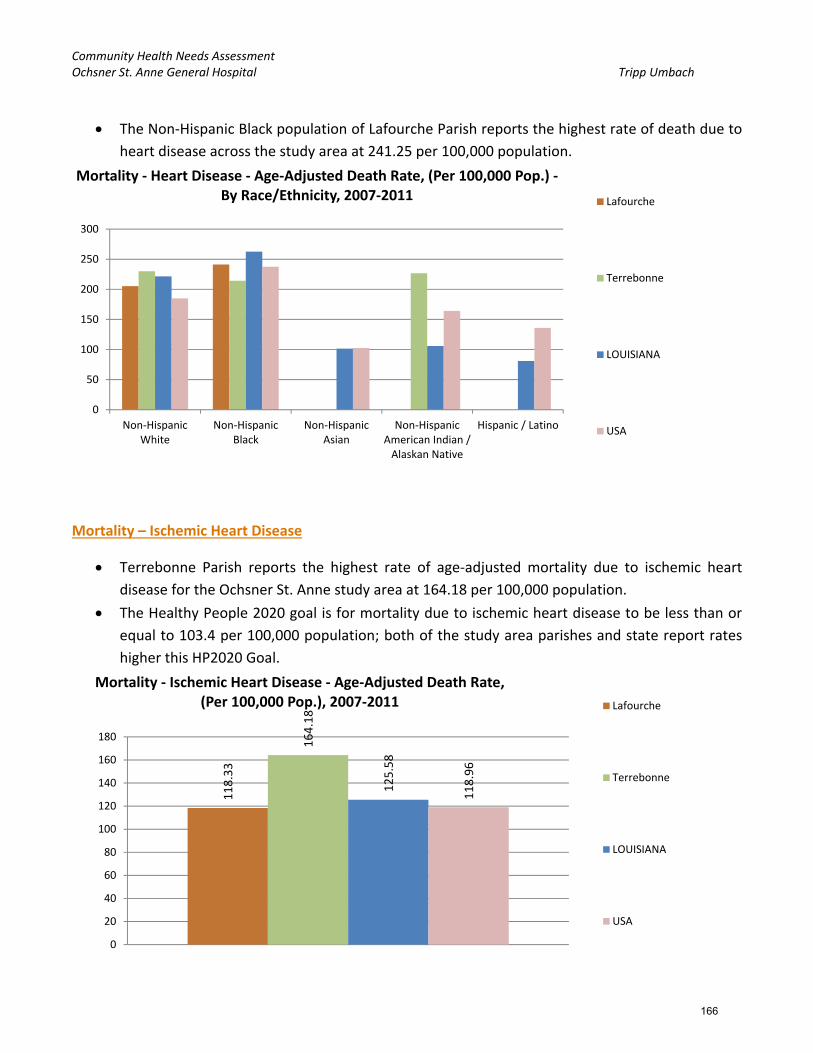
Community Health Needs Assessment Ochsner St. Anne General Hospital Tripp Umbach
The Non‐Hispanic Black population of Lafourche Parish reports the highest rate of death due to
heart disease across the study area at 241.25 per 100,000 population.
Mortality – Ischemic Heart Disease
Terrebonne Parish reports the highest rate of age‐adjusted mortality due to ischemic heart
disease for the Ochsner St. Anne study area at 164.18 per 100,000 population.
The Healthy People 2020 goal is for mortality due to ischemic heart disease to be less than or
equal to 103.4 per 100,000 population; both of the study area parishes and state report rates
higher this HP2020 Goal.
0
50
100
150
200
250
300
Non‐HispanicWhite
Non‐HispanicBlack
Non‐HispanicAsian
Non‐HispanicAmerican Indian /Alaskan Native
Hispanic / Latino
Mortality ‐ Heart Disease ‐ Age‐Adjusted Death Rate, (Per 100,000 Pop.) ‐By Race/Ethnicity, 2007‐2011 Lafourche
Terrebonne
LOUISIANA
USA
118.33
164.18
125.58
118.96
0
20
40
60
80
100
120
140
160
180
Mortality ‐ Ischemic Heart Disease ‐ Age‐Adjusted Death Rate, (Per 100,000 Pop.), 2007‐2011 Lafourche
Terrebonne
LOUISIANA
USA
166
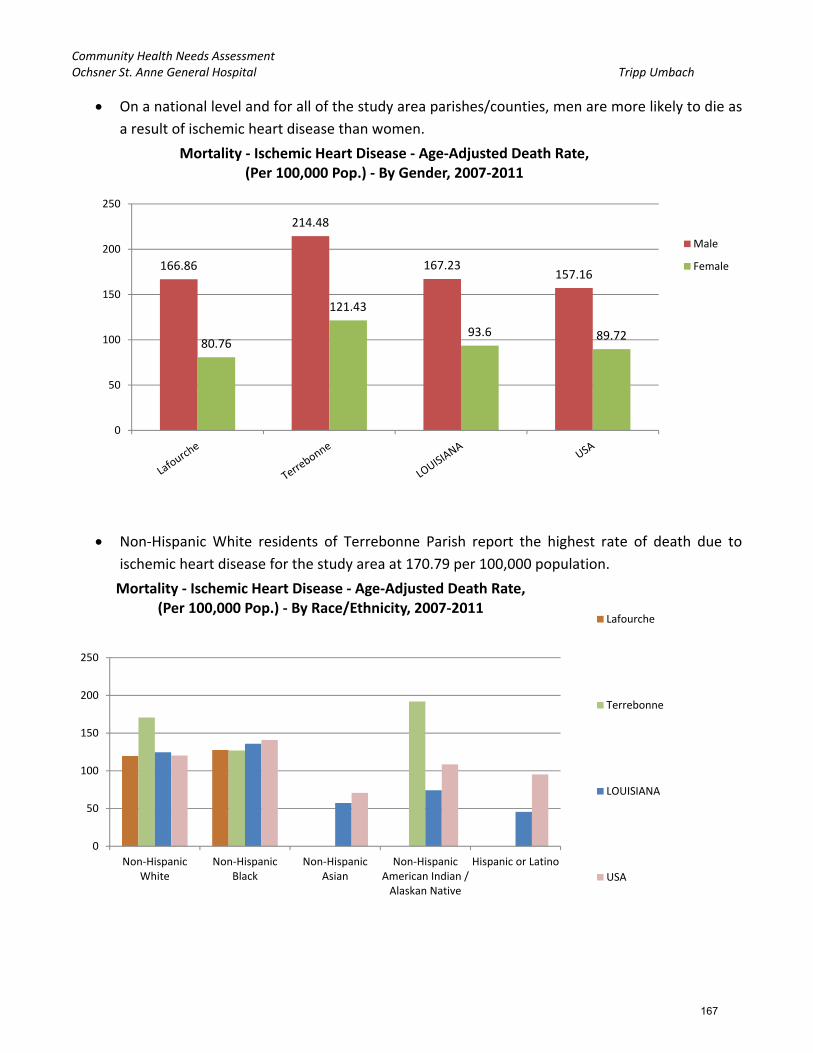
Community Health Needs Assessment Ochsner St. Anne General Hospital Tripp Umbach
On a national level and for all of the study area parishes/counties, men are more likely to die as
a result of ischemic heart disease than women.
Non‐Hispanic White residents of Terrebonne Parish report the highest rate of death due to
ischemic heart disease for the study area at 170.79 per 100,000 population.
166.86
214.48
167.23157.16
80.76
121.43
93.6 89.72
0
50
100
150
200
250
Mortality ‐ Ischemic Heart Disease ‐ Age‐Adjusted Death Rate, (Per 100,000 Pop.) ‐ By Gender, 2007‐2011
Male
Female
0
50
100
150
200
250
Non‐HispanicWhite
Non‐HispanicBlack
Non‐HispanicAsian
Non‐HispanicAmerican Indian /Alaskan Native
Hispanic or Latino
Mortality ‐ Ischemic Heart Disease ‐ Age‐Adjusted Death Rate, (Per 100,000 Pop.) ‐ By Race/Ethnicity, 2007‐2011
Lafourche
Terrebonne
LOUISIANA
USA
167

Community Health Needs Assessment Ochsner St. Anne General Hospital Tripp Umbach
Mortality – Lung Disease
Terrebonne Parish reports the highest rate of mortality due to lung disease for the study area at
45.82 per 100,000 population; this is higher than the national rate of 42.67.
On a national level and for all of the study area parishes, men are more likely to die as a result
of lung disease than women.
30.65
45.82
42.36
42.67
0
5
10
15
20
25
30
35
40
45
50
Mortality ‐ Lung Disease ‐ Age‐Adjusted Death Rate, (Per 100,000 Pop.), 2007‐2011 Lafourche
Terrebonne
LOUISIANA
USA
36.57
50.31 50.64 49.57
27.79
44.06
37.14 38.24
0
10
20
30
40
50
60
Mortality ‐ Lung Disease ‐ Age‐Adjusted Death Rate, (Per 100,000 Pop.) ‐ By Gender, 2007‐2011
Male
Female
168

Community Health Needs Assessment Ochsner St. Anne General Hospital Tripp Umbach
The Non‐Hispanic Black population of Terrebonne Parish reports the highest rate of death as a
result of lung disease for the Ochsner St. Anne study area at 47.48 per 100,000 population.
Mortality – Stroke
Terrebonne Parish reports the highest rate of age‐adjusted mortality due to stroke for the study
area at 49.33 per 100,000 population.
The Healthy People 2020 goal is for mortality due to stroke to be less than or equal to 33.8 per
100,000 population; both of the study area parishes and state report rates higher this HP2020
Goal.
0
5
10
15
20
25
30
35
40
45
50
Non‐HispanicWhite
Non‐HispanicBlack
Non‐HispanicAsian
Non‐HispanicAmerican Indian /Alaskan Native
Hispanic / Latino
Mortality ‐ Lung Disease ‐ Age‐Adjusted Death Rate, (Per 100,000 Pop.) ‐ By Race/Ethnicity, 2007‐2011
Lafourche
Terrebonne
LOUISIANA
USA
44.25 49.33
47.53
40.39
0
10
20
30
40
50
60
Mortality ‐ Stroke ‐ Age‐Adjusted Death Rate, (Per 100,000 Pop.), 2007‐2011 Lafourche
Terrebonne
LOUISIANA
USA
169

Community Health Needs Assessment Ochsner St. Anne General Hospital Tripp Umbach
On a national level, men are more likely to die as a result of stroke than women (40.51 per
100,000 pop. vs. 39.62); the same is true for the Ochsner St. Anne study area.
The Non‐Hispanic Black population of Terrebonne Parish reports the highest rate of death as a
result of stroke for the study area at 92.56 per 100,000 population.
46.17
57.55
48.36
40.5142.35 43.8945.97
39.62
0
10
20
30
40
50
60
70
Mortality ‐ Stroke ‐ Age‐Adjusted Death Rate, (Per 100,000 Pop.) ‐ By Gender, 2007‐2011
Male
Female
0
10
20
30
40
50
60
70
80
90
100
Non‐HispanicWhite
Non‐HispanicBlack
Non‐HispanicAsian
Non‐HispanicAmerican Indian /Alaskan Native
Hispanic or Latino
Mortality ‐ Stroke ‐ Age‐Adjusted Death Rate, (Per 100,000 Pop.) ‐ By Race/Ethnicity, 2007‐2011
Lafourche
Terrebonne
LOUISIANA
USA
170

Community Health Needs Assessment Ochsner St. Anne General Hospital Tripp Umbach
Mortality – Unintentional Injury
Terrebonne Parish reports the highest rate of age‐adjusted mortality due to unintentional
injury for the Ochsner St. Anne study area at 62.51 per 100,000 population.
The Healthy People 2020 goal is for mortality due to unintentional injury to be less than or
equal to 36.0 per 100,000 population; both parishes in the study area and the state report rates
higher than this goal.
On a national level and across all of the study area parishes, men are more likely to die as a
result of unintentional injury than women.
52.63 62.51
49.92
38.85
0
10
20
30
40
50
60
70
Mortality ‐ Unintentional Injury ‐ Age‐Adjusted Death Rate, (Per 100,000 Pop.), 2007‐2011 Lafourche
Terrebonne
LOUISIANA
USA
75.58
83.97
70.41
53.19
30.59
41.19
30.8125.67
0
10
20
30
40
50
60
70
80
90
Mortality ‐ Unintentional Injury ‐ Age‐Adjusted Death Rate, (Per 100,000 Pop.) ‐ By Gender, 2007‐2011
Male
Female
171
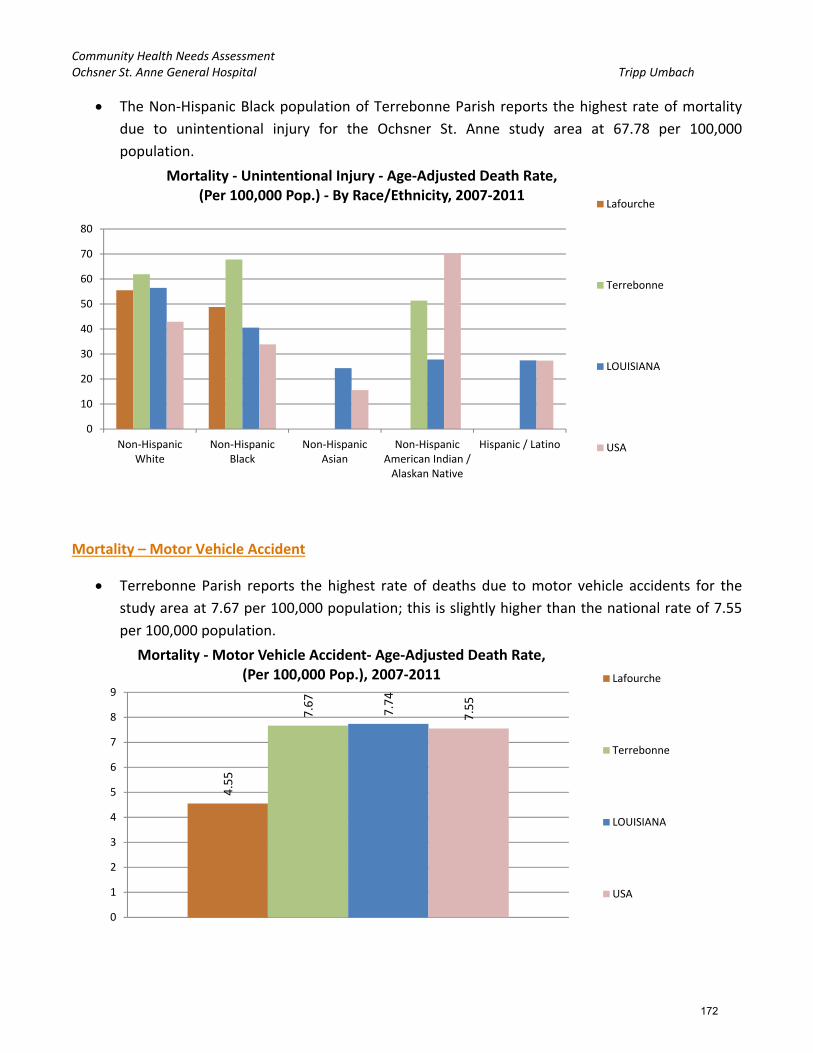
Community Health Needs Assessment Ochsner St. Anne General Hospital Tripp Umbach
The Non‐Hispanic Black population of Terrebonne Parish reports the highest rate of mortality
due to unintentional injury for the Ochsner St. Anne study area at 67.78 per 100,000
population.
Mortality – Motor Vehicle Accident
Terrebonne Parish reports the highest rate of deaths due to motor vehicle accidents for the
study area at 7.67 per 100,000 population; this is slightly higher than the national rate of 7.55
per 100,000 population.
0
10
20
30
40
50
60
70
80
Non‐HispanicWhite
Non‐HispanicBlack
Non‐HispanicAsian
Non‐HispanicAmerican Indian /Alaskan Native
Hispanic / Latino
Mortality ‐ Unintentional Injury ‐ Age‐Adjusted Death Rate, (Per 100,000 Pop.) ‐ By Race/Ethnicity, 2007‐2011
Lafourche
Terrebonne
LOUISIANA
USA
4.55
7.67
7.74
7.55
0
1
2
3
4
5
6
7
8
9
Mortality ‐Motor Vehicle Accident‐ Age‐Adjusted Death Rate, (Per 100,000 Pop.), 2007‐2011 Lafourche
Terrebonne
LOUISIANA
USA
172

Community Health Needs Assessment Ochsner St. Anne General Hospital Tripp Umbach
Men are more likely to die as a result of a motor vehicle accident than women.
The Non‐Hispanic Black population of Terrebonne reports the highest rate of death due to
motor vehicle accident at 13.12 per 100,000 population.
8.27
10.77
11.9811.3
0
5.35
3.72 4.02
0
2
4
6
8
10
12
14
Mortality ‐Motor Vehicle Accident‐ Age‐Adjusted Death Rate, (Per 100,000 Pop.) ‐ By Gender, 2007‐2011
Male
Female
0
2
4
6
8
10
12
14
16
18
Non‐HispanicWhite
Non‐HispanicBlack
Non‐HispanicAsian
Non‐HispanicAmerican Indian /Alaskan Native
Hispanic or Latino
Mortality ‐Motor Vehicle Accident‐ Age‐Adjusted Death Rate, (Per 100,000 Pop.) ‐ By Race/Ethnicity
Lafourche
Terrebonne
LOUISIANA
USA
173

Community Health Needs Assessment Ochsner St. Anne General Hospital Tripp Umbach
Mortality – Pedestrian Accident
Terrebonne Parish reports the highest rate of age‐adjusted mortality due to pedestrian accident
for the study area at 3.28 per 100,000 population.
The Healthy People 2020 goal is for mortality due to pedestrian accident to be less than or
equal to 1.3 per 100,000 population; both parishes and the state report rates higher than this
HP2020 Goal.
Mortality – Homicide
Terrebonne Parish reports the highest rate of age‐adjusted mortality due to homicide for the
study area at 8.79 per 100,000 population; this rate is higher than the national rate (5.63) and
Lafourche Parish.
The Healthy People 2020 goal is for mortality due to homicide to be less than or equal to 5.5
per 100,000 population; Lafourche Parish reports a rate already lower than this HP2020 Goal.
2.08
3.28
2.1
1.38
0
0.5
1
1.5
2
2.5
3
3.5
Mortality ‐ Pedestrian Accident‐ Age‐Adjusted Death Rate, (Per 100,000 Pop.), 2008‐2010 Lafourche
Terrebonne
LOUISIANA
USA
4.57
8.79
12.69
5.63
0
2
4
6
8
10
12
14
Mortality ‐ Homicide‐ Age‐Adjusted Death Rate, (Per 100,000 Pop.), 2007‐2011 Lafourche
Terrebonne
LOUISIANA
USA
174

Community Health Needs Assessment Ochsner St. Anne General Hospital Tripp Umbach
Men are more likely to die as a result of homicide than women.
The Non‐Hispanic Black population of Terrebonne Parish reports the highest rate of death as a
result of homicide across the Ochsner St. Anne study area at 22.14 per 100,000 population.
7.11
12.53
20.92
8.87
0
5.564.62
2.36
0
5
10
15
20
25
Mortality ‐ Homicide‐ Age‐Adjusted Death Rate, (Per 100,000 Pop.) ‐ By Gender, 2007‐2011
Male
Female
0
5
10
15
20
25
30
Non‐HispanicWhite
Non‐HispanicBlack
Non‐HispanicAsian
Non‐HispanicAmerican Indian /Alaskan Native
Hispanic or Latino
Mortality ‐ Homicide‐ Age‐Adjusted Death Rate, (Per 100,000 Pop.) ‐ By Race/Ethnicity, 2007‐2011
Lafourche
Terrebonne
LOUISIANA
USA
175

Community Health Needs Assessment Ochsner St. Anne General Hospital Tripp Umbach
Mortality – Suicide
Lafourche Parish reports the highest rate of age‐adjusted mortality due to suicide for the
Ochsner St. Anne study area at 13.09 per 100,000 population; this rate is higher than the
national rate (11.82) and Lafourche Parish.
The Healthy People 2020 goal is for mortality due to suicide to be less than or equal to 10.2 per
100,000 population; both parishes in the study area and Louisiana report rates higher than this
HP2020 Goal.
Men are more likely than women to die as a result of a suicide.
13.09
11.93
11.94
11.82
11
11.5
12
12.5
13
13.5
Mortality ‐ Suicide‐ Age‐Adjusted Death Rate, (Per 100,000 Pop.), 2007‐2011 Lafourche
Terrebonne
LOUISIANA
USA
21.63
19.0120.19
19.35
6.19 5.854.43 4.89
0
5
10
15
20
25
Mortality ‐ Suicide‐ Age‐Adjusted Death Rate, (Per 100,000 Pop.) ‐ By Gender, 2007‐2011
Male
Female
176

Community Health Needs Assessment Ochsner St. Anne General Hospital Tripp Umbach
The Hispanic/Latino population of the U.S. reports the highest rate of suicide at 32.88 per
100,000 population.
For the study area, the Non‐Hispanic White population of Lafourche Parish reports the highest
rate of suicide at 15.51 per 100,000 population.
Infant Mortality Rate
Terrebonne Parishes reports the highest rate of infant mortality due for the Ochsner St. Anne
study area at 8 per 1,000 births; this rate is higher than the national rate of 6.52 per 1,000
births. Lafourche follows closely with 7 per 1,000 births.
The Healthy People 2020 goal is for infant mortality to be less than or equal to 6.0 per 1,000
births; both parishes report rates higher than this HP2020 Goal.
0
5
10
15
20
25
30
35
Non‐HispanicWhite
Non‐HispanicBlack
Non‐HispanicAsian
Non‐HispanicAmerican Indian /Alaskan Native
Hispanic or Latino
Mortality ‐ Suicide‐ Age‐Adjusted Death Rate, (Per 100,000 Pop.) ‐ By Race/Ethnicity, 2007‐2011
Lafourche
Terrebonne
LOUISIANA
USA
7
8
8.9
6.52
0
1
2
3
4
5
6
7
8
9
10
Infant Mortality Rate, (Per 1,000 Births), 2006‐2010 Lafourche
Terrebonne
LOUISIANA
USA
177

Community Health Needs Assessment Ochsner St. Anne General Hospital Tripp Umbach
The Non‐Hispanic Black population of Terrebonne Parish reports the highest rate of infant
mortality for the study area at 13.1 per 1,000 births.
0
2
4
6
8
10
12
14
Non‐HispanicWhite
Non‐HispanicBlack
Non‐HispanicAsian
Non‐HispanicAmerican Indian /Alaskan Native
Hispanic or Latino
Infant Mortality Rate, (Per 1,000 Pop.) ‐ By Race/Ethnicity, 2006‐2010 Lafourche
Terrebonne
LOUISIANA
USA
178
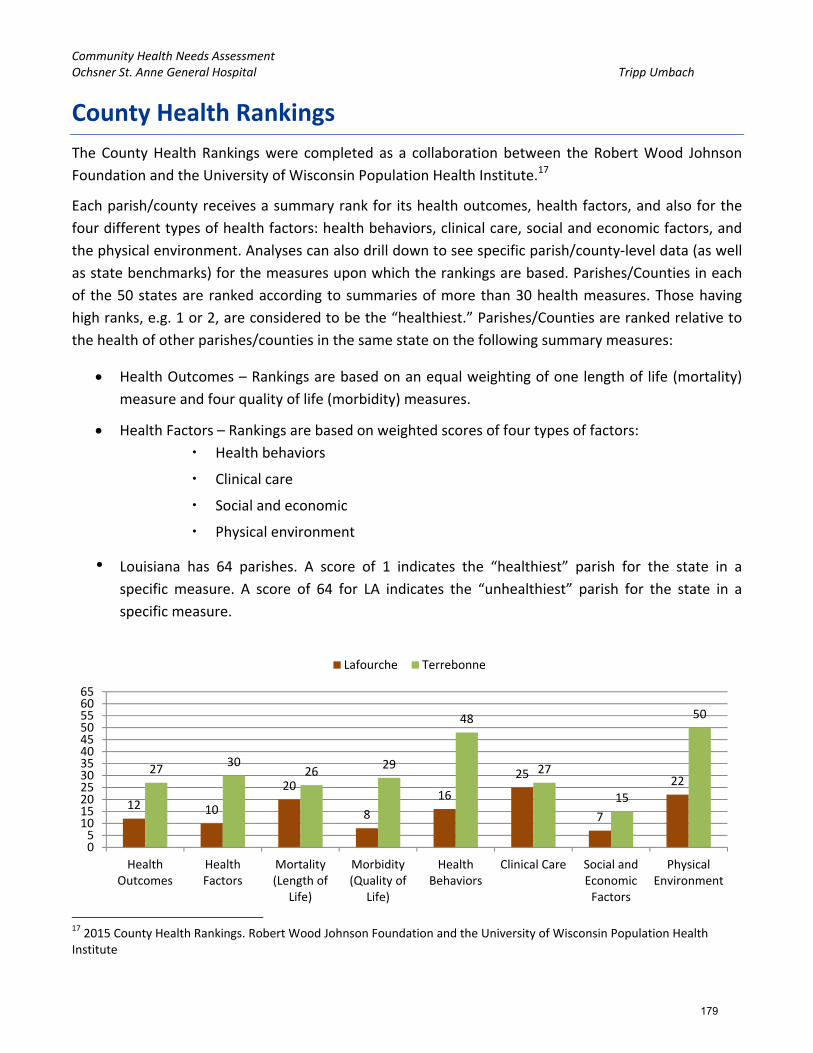
Community Health Needs Assessment Ochsner St. Anne General Hospital Tripp Umbach
County Health Rankings
The County Health Rankings were completed as a collaboration between the Robert Wood Johnson
Foundation and the University of Wisconsin Population Health Institute.17
Each parish/county receives a summary rank for its health outcomes, health factors, and also for the
four different types of health factors: health behaviors, clinical care, social and economic factors, and
the physical environment. Analyses can also drill down to see specific parish/county‐level data (as well
as state benchmarks) for the measures upon which the rankings are based. Parishes/Counties in each
of the 50 states are ranked according to summaries of more than 30 health measures. Those having
high ranks, e.g. 1 or 2, are considered to be the “healthiest.” Parishes/Counties are ranked relative to
the health of other parishes/counties in the same state on the following summary measures:
Health Outcomes – Rankings are based on an equal weighting of one length of life (mortality)
measure and four quality of life (morbidity) measures.
Health Factors – Rankings are based on weighted scores of four types of factors:
Health behaviors
Clinical care
Social and economic
Physical environment
• Louisiana has 64 parishes. A score of 1 indicates the “healthiest” parish for the state in a
specific measure. A score of 64 for LA indicates the “unhealthiest” parish for the state in a
specific measure.
17 2015 County Health Rankings. Robert Wood Johnson Foundation and the University of Wisconsin Population Health Institute
12 10
20
8
16
25
7
2227
3026
29
48
27
15
50
05
101520253035404550556065
HealthOutcomes
HealthFactors
Mortality(Length of
Life)
Morbidity(Quality of
Life)
HealthBehaviors
Clinical Care Social andEconomicFactors
PhysicalEnvironment
Lafourche Terrebonne
179

Community Health Needs Assessment Ochsner St. Anne General Hospital Tripp Umbach
Key Findings from County Health Rankings:
Terrebonne Parish reports higher County Health Rankings than Lafourche across all of the
measures.
Terrebonne Parish reports relatively unhealthy county health rankings for:
o Physical Environment – Rank of 50 (15th worst parish in the state)
o Health Behaviors ‐ Rank of 48 out of worst possible 64
Lafourche Parish ranks above average (average for the State of Louisiana being 32, the median
between 1 and 64)for all of the County Health Ranking measures indicating generally healthier than
a majority of the other parishes in the state.
o It is important to note that both Lafourche and Terrebonne parishes report many
“healthier” than average county health rankings for the state (better than the median).
180
Community Health Needs Assessment Ochsner St. Anne General Hospital Tripp Umbach
Substance Abuse and Mental Health
The Substance Abuse and Mental Health Services Administration (SAMHSA) gathers region specific
data from the entire United States in relation to substance use (alcohol and illicit drugs) and mental
health.
Every state is parceled into regions defined by SAMHSA. The regions are defined in the ‘Substate
Estimates from the 2010‐2012 National Surveys on Drug Use and Health’. Data is provided at the first
defined region (i.e., those that are grouped).
The Substate Regions for Louisiana are defined as such:
• Regions 1 and 10 (Data for Regions 1 and 10 provided separately for this grouping only)
o Region 1 – Orleans, Plaquemines, St. Bernard
o Region 10 – Jefferson
• Regions 2 and 9
o Region 2 – Ascension, East Baton Rouge, East Feliciana, Iberville, Pointe Coupee, West
Baton Rouge, West Feliciana
o Region 9 – Livingston, St. Helena, St. Tammany, Tangipahoa, Washington
• Region 3
o Region 3 – Assumption, Lafourche, St. Charles, St. James, St. John the Baptist, St. Mary,
Terrebonne
• Regions 4, 5, and 6
o Region 4 – Acadia, Evangeline, Iberia, Lafayette, St. Landry, St. Martin, Vermilion
o Region 5 – Allen, Beauregard, Calcasieu, Cameron, Jefferson Davis
o Region 6 – Avoyelles, Catahoula, Concordia, Grant, La Salle, Rapides, Vernon, Winn
• Regions 7 and 8
o Region 7 – Bienville, Bossier, Caddo, Claiborne, De Soto, Natchitoches, Red River,
Sabine, Webster
o Region 8 – Caldwell, East Carroll, Franklin, Jackson, Lincoln, Madison, Morehouse,
Ouachita, Richland, Tensas, Union, West Carroll
Data concerning alcohol use, illicit drug use, and psychological distress for the various regions of the
study area are shown here.
181

Community Health Needs Assessment Ochsner St. Anne General Hospital Tripp Umbach
Alcohol Use in the Past Month
Both Region 3 (which includes Lafourche and Terrebonne parishes) and the State of Louisiana
have seen rises in the rates of alcohol use in the past month from the 2002‐2004 study to the
2010‐2012 study.
Binge Alcohol Use in the Past Month
Region 3 has seen a decline in binge alcohol use from 25.57% in 2002‐2004 to 24.23% in 2010‐
2012.
46.42%
46.78%
47.01%
47.70%
45.50%
46.00%
46.50%
47.00%
47.50%
48.00%
2002‐2004 2010‐2012
Alcohol Use in the Past Month
Region 3
LA
25.57%
24.23%24.37%
23.77%
22.50%
23.00%
23.50%
24.00%
24.50%
25.00%
25.50%
26.00%
2002‐2004 2010‐2012
Binge Alcohol Use in the Past Month
Region 3
LA
182

Community Health Needs Assessment Ochsner St. Anne General Hospital Tripp Umbach
Perceptions of Great Rick of Having Five or More Alcoholic Drinks Once or Twice a Week
Both Region 3 (which includes Lafourche and Terrebonne parishes) and the State of Louisiana
have seen rises in the rate of perception of great risk of drinking five or more alcoholic drinks
once or twice a week from the 2002‐2004 study to the 2010‐2012 study.
Needing but Not Receiving Treatment for Alcohol Use in the Past Year
Region 3 reports lower rates than the state and a declining rate of residents who report
needing but not receiving treatment for alcohol use in the past year.
39.36%
44.36%
42.35%
43.31%
36.00%
37.00%
38.00%
39.00%
40.00%
41.00%
42.00%
43.00%
44.00%
45.00%
2002‐2004 2010‐2012
Perceptions of Great Risk of Drinking Five or More Alcoholic Drinks
Region 3
LA
7.35%
5.44%
7.66%
6.10%
5.00%
5.50%
6.00%
6.50%
7.00%
7.50%
8.00%
2002‐2004 2010‐2012
Needing but Not Receiving Treatment for Alcohol Use in the Past Year
Region 3
LA
183

Community Health Needs Assessment Ochsner St. Anne General Hospital Tripp Umbach
Tobacco Use in the Past Month
Region 3 reports the highest currently and in the past (with little difference from 2002‐2004 to
2010‐2012) of tobacco use in the past month at 34.61%.
Cigarette Use in the Past Month
Cigarette use in the past month is highest for Region 3 and was for the 2002‐2004 analysis as
well; it has seen a slight decline in rate over the years going from 30.13% to 29.63%.
34.73% 34.61%
32.76%31.98%
25.00%
27.00%
29.00%
31.00%
33.00%
35.00%
2002‐2004 2010‐2012
Tobacco Use in the Past Month
Region 3
LA
30.13%29.63%
28.49%
26.71%
22.00%
24.00%
26.00%
28.00%
30.00%
32.00%
2002‐2004 2010‐2012
Cigarette Use in the Past Month
Region 3
LA
184

Community Health Needs Assessment Ochsner St. Anne General Hospital Tripp Umbach
Perceptions of Great Rick of Smoking One or More Packs of Cigarettes per Day
Region 3 reports the lowest rate (correlating to the higher usage) of perceptions of great risk of
smoking one or more packs of cigarettes per day;.
Illicit Drug Use in the Past Month
Both Region 3 and the state have seen declines in the rates of illicit drug use; both going from
around 8% to now around 7%.
66.87%
69.54%69.08%
71.55%
64.00%
65.00%
66.00%
67.00%
68.00%
69.00%
70.00%
71.00%
72.00%
2002‐2004 2010‐2012
Perceptions of Great Risk of Smoking One or More Packs of Cigarettes per Day
Region 3
LA
7.57%
7.04%
7.98%
6.85%
6.00%
6.50%
7.00%
7.50%
8.00%
8.50%
9.00%
9.50%
10.00%
2002‐2004 2010‐2012
Illicit Drug Use in the Past Month
Region 3
LA
185

Community Health Needs Assessment Ochsner St. Anne General Hospital Tripp Umbach
Marijuana Use in the Past Month
In the most recent analysis, 2010‐2012, both Region 3 and the state report 4.5% of the relevant
population (age 12 and older), have used marijuana in the past month.
Cocaine Use in the Past Year
In 2010‐2012, Region 3 reported 1.39% of the relevant population having used cocaine in the
past year. This is down from 2.69% in 2002‐2004 and has fallen below the rate seen across the
state (1.5%).
5.15%
4.50%
5.56%
4.50%
0.00%
1.00%
2.00%
3.00%
4.00%
5.00%
6.00%
2002‐2004 2010‐2012
Marijuana Use in the Past Month
Region 3
LA
2.69%
1.39%
2.58%
1.50%
1.00%
1.50%
2.00%
2.50%
3.00%
3.50%
4.00%
2002‐2004 2010‐2012
Cocaine Use in the Past Year
Region 3
LA
186

Community Health Needs Assessment Ochsner St. Anne General Hospital Tripp Umbach
Nonmedical Use of Pain Relievers in the Past Year
Region 3 experienced a decline in the rate of nonmedical use of pain relievers in the past year
from 5.49% in 2002‐2004 to 5.08% in 2010‐2012. The state rate remained relatively consistent,
going from 5.06% to 5.03%
Needing but Not Receiving Treatment for Illicit Drug Use in the Past Year
Both region 3 and the state have seen declines in the rates of residents reporting that they
needed but did not receive treatment for illicit drug use in the past year from 2002‐2004 to
2010‐2012.
5.49%
5.08%5.06% 5.03%
4.00%
4.50%
5.00%
5.50%
6.00%
2002‐2004 2010‐2012
Nonmedical Use of Pain Relievers in the Past Year
Region 3
LA
3.16%
2.09%
3.07%
2.36%
2.00%
2.50%
3.00%
3.50%
4.00%
2002‐2004 2010‐2012
Needing but Not Receiving Treatment for Illicit Drug Use in the Past Year
Region 3
LA
187

Community Health Needs Assessment Ochsner St. Anne General Hospital Tripp Umbach
America’s Health Rankings
America’s Health Rankings® is the longest‐running annual assessment of the nation’s health on a state‐
by‐state basis. For the past 25 years, America’s Health Rankings® has provided a holistic view of the
health of the nation. America’s Health Rankings® is the result of a partnership between United Health
Foundation, American Public Health Association, and Partnership for Prevention™.
For this study, the Louisiana State report was reviewed. The following were the key findings/rankings
for Louisiana:
- Louisiana Ranks:
o 48th overall in terms of health rankings
o 44th for smoking
o 45th for diabetes
o 45th in obesity
- Louisiana Strengths:
o Low incidence of pertussis
o High immunization coverage among teens
o Small disparity in health status by educational attainment
- Louisiana Challenges:
o High incidence of infectious disease
o High prevalence of low birthweight
o High rate of preventable hospitalizations
- Louisiana Highlights:
o In the past year, children in poverty decreased by 15 percent from 31.0 percent to 26.5
percent of children.
o In the past 2 years, physical inactivity decreased by 10 percent from 33.8 percent to 30.3
percent of adults.
o In the past 20 years, low birthweight increased by 15 percent from 9.4 percent to 10.8
percent of births. Louisiana ranks 49th for low birthweight infants.
o In the past 2 years, drug deaths decreased by 25 percent from 17.1 to 12.9 deaths per
100,000 population.
o Since 1990, infant mortality decreased by 32 percent from 11.8 to 8.2 deaths per 1,000
live births. Louisiana now ranks 47th in infant mortality among states.
188

Community Health Needs Assessment Ochsner St. Anne General Hospital Tripp Umbach
Table 7. America’s Health Rankings ‐ Louisiana
Measure Rank Value Measure Rank Value
Air Pollution 26 9.2 Infectious Disease 48
All Determinants 48 ‐0.53 Insufficient Sleep 34 37
All Outcomes 44 ‐0.273 Lack of Health Insurance 39 16.7
Binge Drinking 21 16.3 Low Birthweight 49 10.8
Cancer Deaths 47 217.4 Median Household Income 50 39,622
Cardiovascular Deaths 46 307.5 Obesity 45 33.1
Children in Poverty 44 26.5 Obesity – Youth 13.5
Chlamydia 47 597.9 Occupational Fatalities 47 8.2
Cholesterol Check 26 76.2 Overall 48 ‐0.803
Colorectal Cancer Screening 39 61.5 Personal Income, Per Capita 29 41,204
Dental Visit, Annual 48 56.1 Pertussis 1 1.6
Dentists 39 49.6 Physical Activity 46 67.8
Diabetes 45 11.6 Physical Inactivity 46 32.2
Disparity in Health Status 16 26.5 Poor Mental Health Days 43 4.2
Drug Deaths 27 12.9 Poor Physical Health Days 38 4.2
Excessive Drinking 22 17.7 Premature Death 45 9625
Fruits 44 1.18 Preterm Birth 49 15.3
Heart Attack 41 5.3 Preventable Hospitalizations 48 80.3
Heart Disease 40 5 Primary Care Physicians 20 123.7
High Blood Pressure 47 39.8 Public Health Funding 27 69.01
High Cholesterol 41 40.7 Salmonella 47 33.7
High Health Status 47 44.4 Smoking 44 23.5
High School Graduation 46 72 Stroke 45 4
Immunization ‐ Adolescents 11 72.6 Suicide 12 12.5
Immunization – Children 31 69.1 Teen Birth Rate 44 43.1
Immunization Dtap 16 87.9 Teeth Extractions 48 9.6
Immunization HPV female 12 42.1 Underemployment Rate 23 12.7
Immunization MCV4 9 87.7 Unemployment Rate, Annual 15 6.2
Income Disparity 48 0.491 Vegetables 49 1.64
Income Disparity Ratio 1 5.68 Violent Crime 44 496.9
Infant Mortality 47 8.2 Youth Smoking 12.1
189

Community Health Needs Assessment Ochsner St. Anne General Hospital Tripp Umbach
Figure 4. Louisiana Health Rankings Bubble Chart
190