oci n.v. roadshow presentation n.v. roadshow presenta… · oci n.v. roadshow presentation 30...
TRANSCRIPT
OCI N.V. Roadshow Presentation 30 September – 3 October 2013
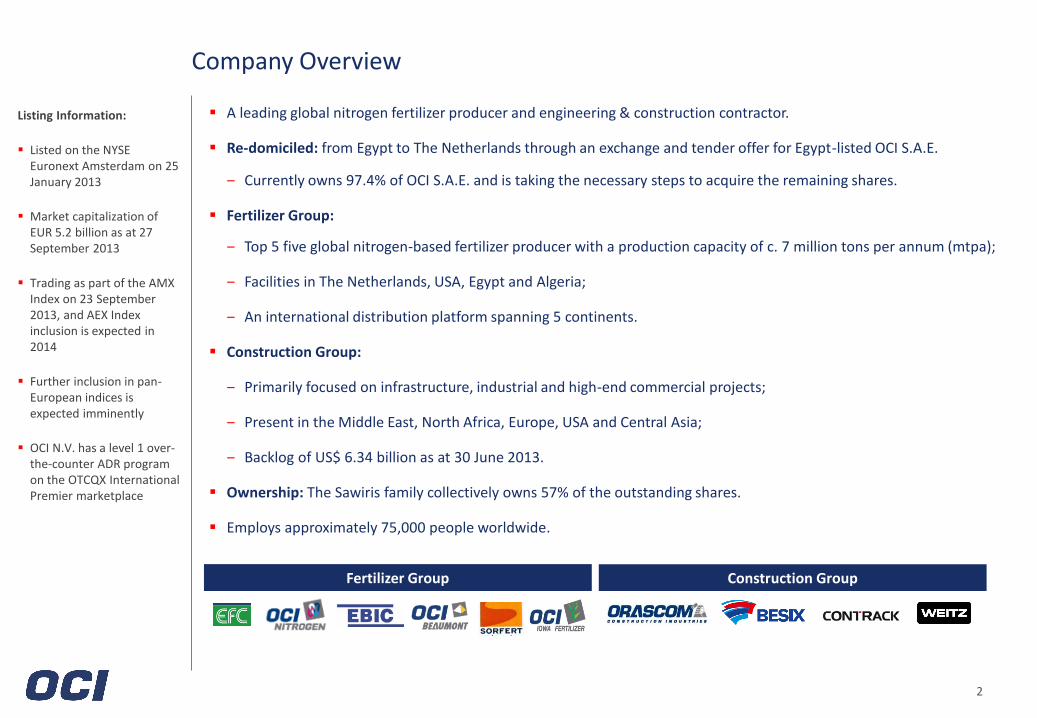
A leading global nitrogen fertilizer producer and engineering & construction contractor.
Re-domiciled: from Egypt to The Netherlands through an exchange and tender offer for Egypt-listed OCI S.A.E.
‒ Currently owns 97.4% of OCI S.A.E. and is taking the necessary steps to acquire the remaining shares.
Fertilizer Group:
‒ Top 5 five global nitrogen-based fertilizer producer with a production capacity of c. 7 million tons per annum (mtpa);
‒ Facilities in The Netherlands, USA, Egypt and Algeria;
‒ An international distribution platform spanning 5 continents.
Construction Group:
‒ Primarily focused on infrastructure, industrial and high-end commercial projects;
‒ Present in the Middle East, North Africa, Europe, USA and Central Asia;
‒ Backlog of US$ 6.34 billion as at 30 June 2013.
Ownership: The Sawiris family collectively owns 57% of the outstanding shares.
Employs approximately 75,000 people worldwide.
Listing Information:
Listed on the NYSE Euronext Amsterdam on 25 January 2013
Market capitalization of EUR 5.2 billion as at 27 September 2013
Trading as part of the AMX Index on 23 September 2013, and AEX Index inclusion is expected in 2014
Further inclusion in pan-European indices is expected imminently
OCI N.V. has a level 1 over-the-counter ADR program on the OTCQX International Premier marketplace
Construction Group Fertilizer Group
Company Overview
2
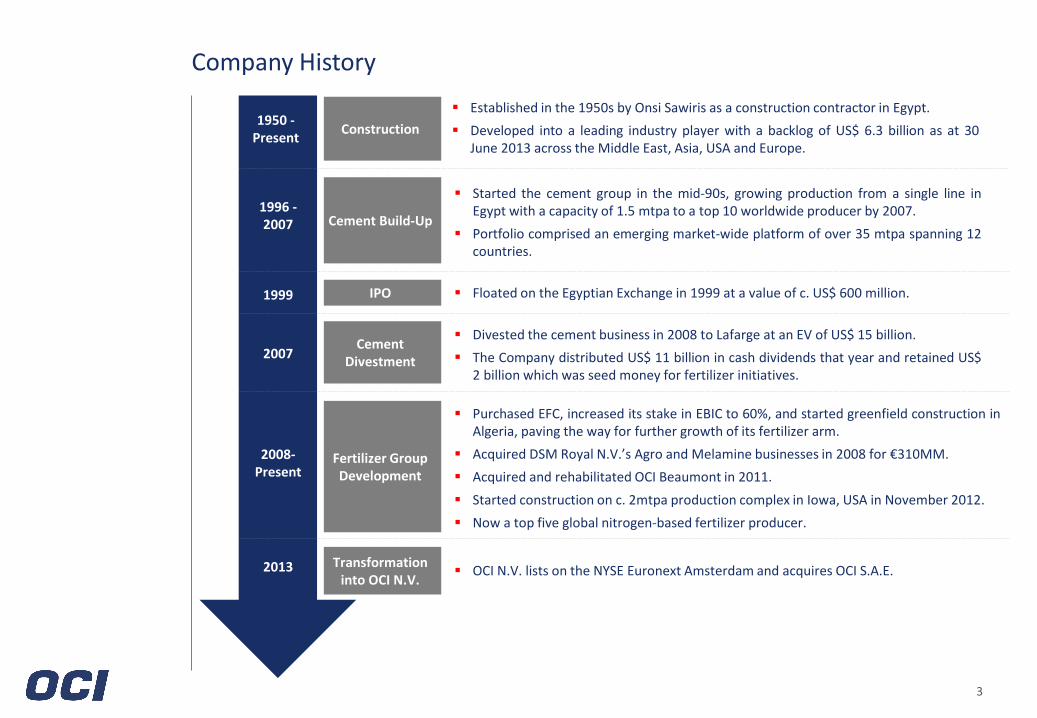
Company History
3
Construction
Established in the 1950s by Onsi Sawiris as a construction contractor in Egypt.
Developed into a leading industry player with a backlog of US$ 6.3 billion as at 30 June 2013 across the Middle East, Asia, USA and Europe.
1950 -Present
Cement Build-Up
Started the cement group in the mid-90s, growing production from a single line in Egypt with a capacity of 1.5 mtpa to a top 10 worldwide producer by 2007.
Portfolio comprised an emerging market-wide platform of over 35 mtpa spanning 12 countries.
1996 - 2007
IPO Floated on the Egyptian Exchange in 1999 at a value of c. US$ 600 million. 1999
Cement Divestment
Divested the cement business in 2008 to Lafarge at an EV of US$ 15 billion.
The Company distributed US$ 11 billion in cash dividends that year and retained US$ 2 billion which was seed money for fertilizer initiatives.
2007
Fertilizer Group Development
Purchased EFC, increased its stake in EBIC to 60%, and started greenfield construction in Algeria, paving the way for further growth of its fertilizer arm.
Acquired DSM Royal N.V.’s Agro and Melamine businesses in 2008 for €310MM.
Acquired and rehabilitated OCI Beaumont in 2011.
Started construction on c. 2mtpa production complex in Iowa, USA in November 2012.
Now a top five global nitrogen-based fertilizer producer.
2008-Present
Transformation into OCI N.V.
OCI N.V. lists on the NYSE Euronext Amsterdam and acquires OCI S.A.E. 2013
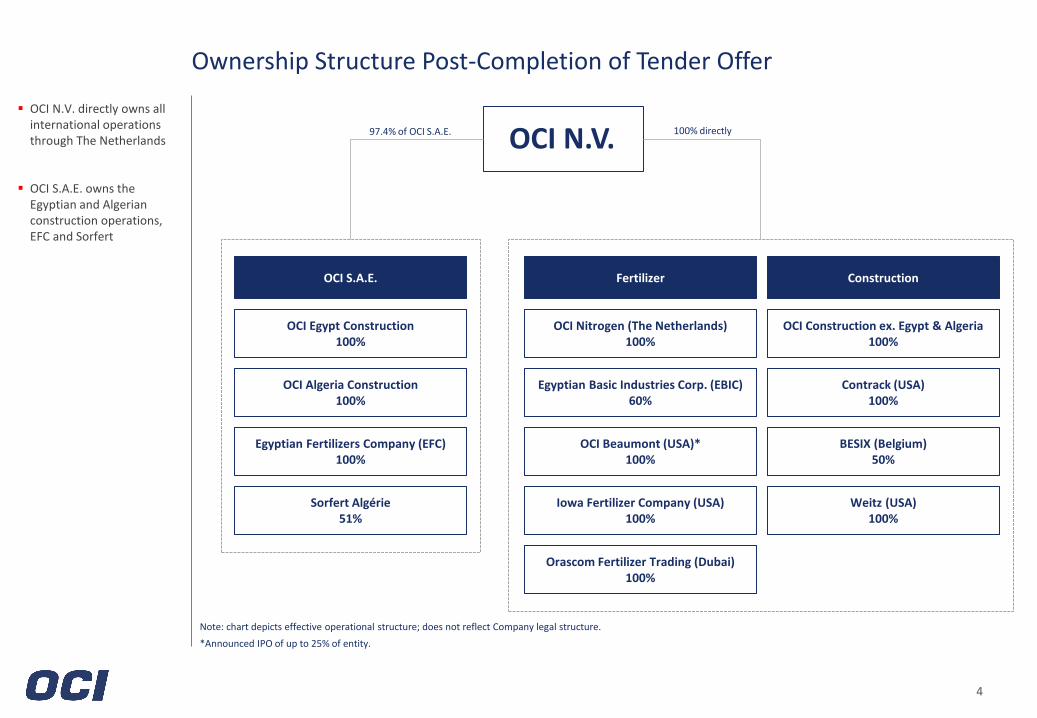
Ownership Structure Post-Completion of Tender Offer
4
OCI N.V. directly owns all international operations through The Netherlands
OCI S.A.E. owns the Egyptian and Algerian construction operations, EFC and Sorfert
Egyptian Fertilizers Company (EFC) 100%
Sorfert Algérie 51%
OCI Egypt Construction 100%
OCI Algeria Construction 100%
OCI S.A.E.
Orascom Fertilizer Trading (Dubai) 100%
OCI Beaumont (USA)* 100%
OCI Nitrogen (The Netherlands) 100%
Egyptian Basic Industries Corp. (EBIC) 60%
BESIX (Belgium) 50%
Weitz (USA) 100%
OCI Construction ex. Egypt & Algeria 100%
Contrack (USA) 100%
Note: chart depicts effective operational structure; does not reflect Company legal structure.
*Announced IPO of up to 25% of entity.
Iowa Fertilizer Company (USA) 100%
97.4% of OCI S.A.E. 100% directly
Fertilizer Construction
OCI N.V.
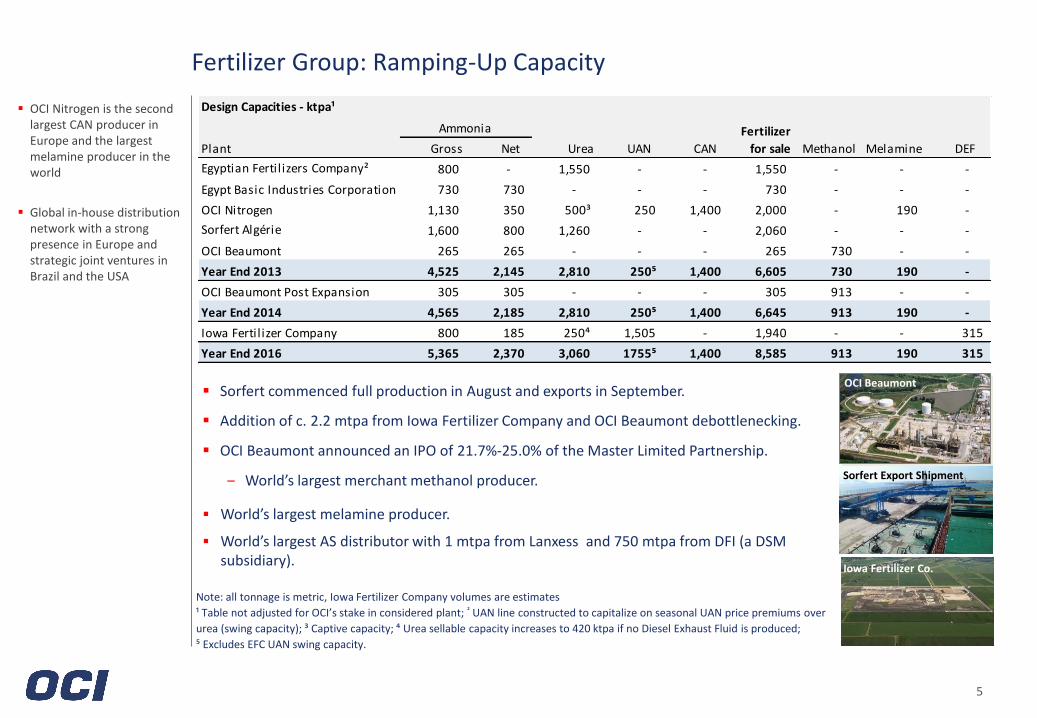
Sorfert commenced full production in August and exports in September.
Addition of c. 2.2 mtpa from Iowa Fertilizer Company and OCI Beaumont debottlenecking.
OCI Beaumont announced an IPO of 21.7%-25.0% of the Master Limited Partnership.
‒ World’s largest merchant methanol producer.
World’s largest melamine producer.
World’s largest AS distributor with 1 mtpa from Lanxess and 750 mtpa from DFI (a DSM subsidiary).
Note: all tonnage is metric, Iowa Fertilizer Company volumes are estimates
¹ Table not adjusted for OCI’s stake in considered plant; ² UAN line constructed to capitalize on seasonal UAN price premiums over
urea (swing capacity); ³ Captive capacity; ⁴ Urea sellable capacity increases to 420 ktpa if no Diesel Exhaust Fluid is produced;
⁵ Excludes EFC UAN swing capacity.
Fertilizer Group: Ramping-Up Capacity
5
OCI Nitrogen is the second largest CAN producer in Europe and the largest melamine producer in the world
Global in-house distribution network with a strong presence in Europe and strategic joint ventures in Brazil and the USA
OCI Beaumont
Iowa Fertilizer Co.
Sorfert Export Shipment
Design Capacities - ktpa¹
Plant Gross Net Urea UAN CAN Methanol Melamine DEF
Egyptian Fertil izers Company² 800 - 1,550 - - 1,550 - - -
Egypt Basic Industries Corporation 730 730 - - - 730 - - -
OCI Nitrogen 1,130 350 500³ 250 1,400 2,000 - 190 -
Sorfert Algérie 1,600 800 1,260 - - 2,060 - - -
OCI Beaumont 265 265 - - - 265 730 - -
Year End 2013 4,525 2,145 2,810 250⁵ 1,400 6,605 730 190 -
OCI Beaumont Post Expansion 305 305 - - - 305 913 - -
Year End 2014 4,565 2,185 2,810 250⁵ 1,400 6,645 913 190 -
Iowa Fertil izer Company 800 185 250⁴ 1,505 - 1,940 - - 315
Year End 2016 5,365 2,370 3,060 1755⁵ 1,400 8,585 913 190 315
Ammonia Fertilizer
for sale
6.87 7.00
7.61
6.937.20 7.21 7.21
6.65 6.50 6.28
6.02 5.62
5.11 5.23
5.95
6.40 6.49
5.895.64
7.046.83
6.34
2.90
0.971.16
0.45
0.931.17
0.71 0.36 0.79 0.68 0.60 0.55
0.33
1.00 1.42 1.58
0.84
0.29 0.36
1.84
0.70 0.54
0.00
1.00
2.00
3.00
4.00
5.00
6.00
7.00
8.00
Q1
20
08
Q2
20
08
Q3
20
08
Q4
20
08
Q1
20
09
Q2
20
09
Q3
20
09
Q4
20
09
Q1
20
10
Q2
20
10
Q3
20
10
Q4
20
10
Q1
20
11
Q2
20
11
Q3
20
11
Q4
20
11
Q1
20
12
Q2
20
12
Q3
20
12
Q4
20
12
Q1
20
13
Q2
20
13
US$
bill
ion
s
Backlog New Awards
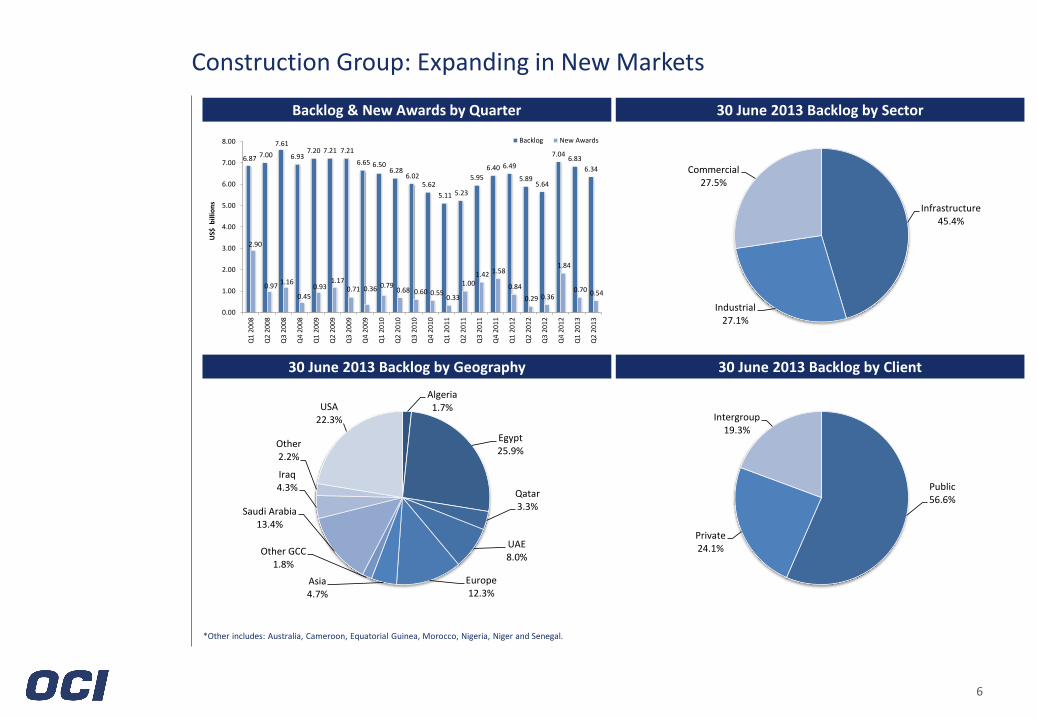
Algeria1.7%
Egypt25.9%
Qatar3.3%
UAE8.0%
Europe12.3%
Asia4.7%
Other GCC1.8%
Saudi Arabia13.4%
Iraq4.3%
Other2.2%
USA22.3%
Public56.6%
Private24.1%
Intergroup19.3%
Infrastructure45.4%
Industrial27.1%
Commercial27.5%
6
Construction Group: Expanding in New Markets
*Other includes: Australia, Cameroon, Equatorial Guinea, Morocco, Nigeria, Niger and Senegal.
30 June 2013 Backlog by Sector Backlog & New Awards by Quarter
30 June 2013 Backlog by Geography 30 June 2013 Backlog by Client
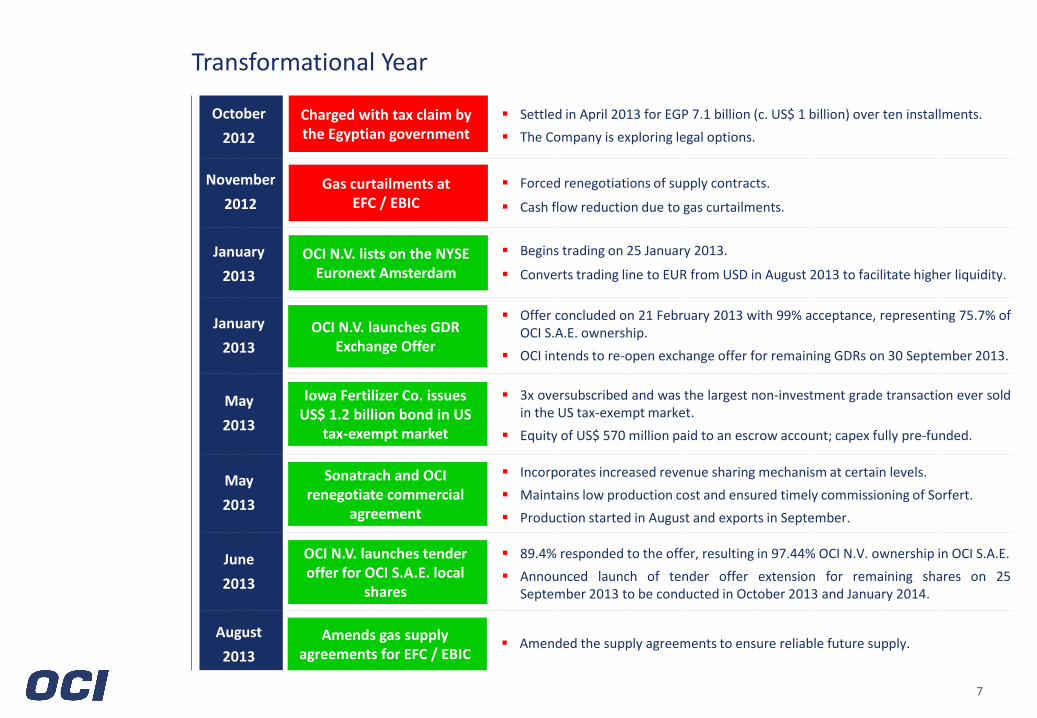
Begins trading on 25 January 2013.
Converts trading line to EUR from USD in August 2013 to facilitate higher liquidity.
Transformational Year
7
Charged with tax claim by the Egyptian government
Settled in April 2013 for EGP 7.1 billion (c. US$ 1 billion) over ten installments.
The Company is exploring legal options.
October
2012
Gas curtailments at EFC / EBIC
November
2012
Forced renegotiations of supply contracts.
Cash flow reduction due to gas curtailments.
OCI N.V. lists on the NYSE Euronext Amsterdam
January
2013
OCI N.V. launches GDR Exchange Offer
Offer concluded on 21 February 2013 with 99% acceptance, representing 75.7% of OCI S.A.E. ownership.
OCI intends to re-open exchange offer for remaining GDRs on 30 September 2013.
January
2013
Iowa Fertilizer Co. issues US$ 1.2 billion bond in US
tax-exempt market
3x oversubscribed and was the largest non-investment grade transaction ever sold in the US tax-exempt market.
Equity of US$ 570 million paid to an escrow account; capex fully pre-funded.
May
2013
OCI N.V. launches tender offer for OCI S.A.E. local
shares
89.4% responded to the offer, resulting in 97.44% OCI N.V. ownership in OCI S.A.E.
Announced launch of tender offer extension for remaining shares on 25 September 2013 to be conducted in October 2013 and January 2014.
June
2013
Sonatrach and OCI renegotiate commercial
agreement
Incorporates increased revenue sharing mechanism at certain levels.
Maintains low production cost and ensured timely commissioning of Sorfert.
Production started in August and exports in September.
May
2013
Amends gas supply agreements for EFC / EBIC
Amended the supply agreements to ensure reliable future supply. August
2013
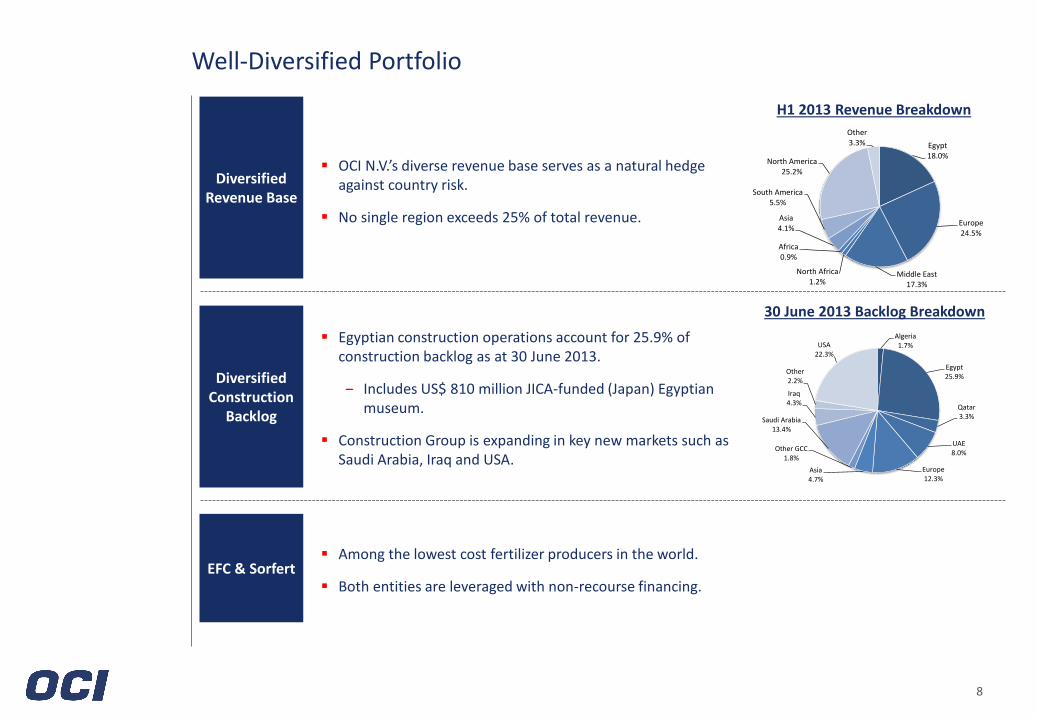
Well-Diversified Portfolio
8
Egypt18.0%
Europe24.5%
Middle East17.3%
North Africa1.2%
Africa0.9%
Asia4.1%
South America5.5%
North America25.2%
Other3.3%
Algeria1.7%
Egypt25.9%
Qatar3.3%
UAE8.0%
Europe12.3%
Asia4.7%
Other GCC1.8%
Saudi Arabia13.4%
Iraq4.3%
Other2.2%
USA22.3%
Diversified Revenue Base
Diversified Construction
Backlog
OCI N.V.’s diverse revenue base serves as a natural hedge against country risk.
No single region exceeds 25% of total revenue.
Egyptian construction operations account for 25.9% of construction backlog as at 30 June 2013.
‒ Includes US$ 810 million JICA-funded (Japan) Egyptian museum.
Construction Group is expanding in key new markets such as Saudi Arabia, Iraq and USA.
H1 2013 Revenue Breakdown
30 June 2013 Backlog Breakdown
Among the lowest cost fertilizer producers in the world.
Both entities are leveraged with non-recourse financing. EFC & Sorfert
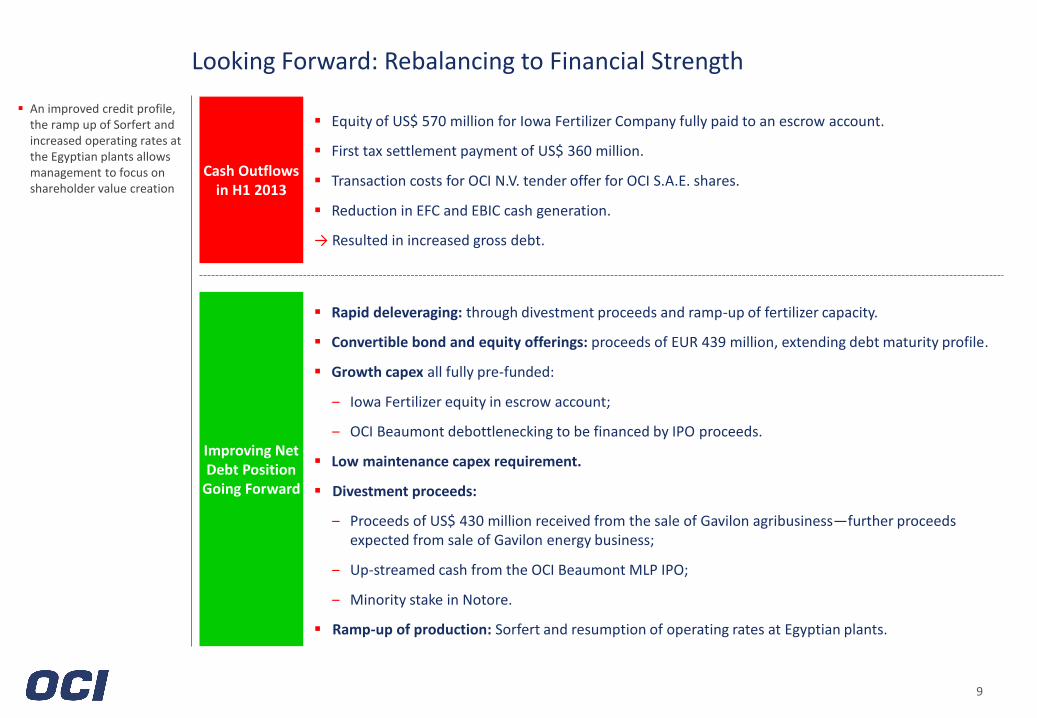
Looking Forward: Rebalancing to Financial Strength
9
Equity of US$ 570 million for Iowa Fertilizer Company fully paid to an escrow account.
First tax settlement payment of US$ 360 million.
Transaction costs for OCI N.V. tender offer for OCI S.A.E. shares.
Reduction in EFC and EBIC cash generation.
→ Resulted in increased gross debt.
Cash Outflows in H1 2013
Improving Net Debt Position
Going Forward
Rapid deleveraging: through divestment proceeds and ramp-up of fertilizer capacity.
Convertible bond and equity offerings: proceeds of EUR 439 million, extending debt maturity profile.
Growth capex all fully pre-funded:
‒ Iowa Fertilizer equity in escrow account;
‒ OCI Beaumont debottlenecking to be financed by IPO proceeds.
Low maintenance capex requirement.
Divestment proceeds:
‒ Proceeds of US$ 430 million received from the sale of Gavilon agribusiness—further proceeds expected from sale of Gavilon energy business;
‒ Up-streamed cash from the OCI Beaumont MLP IPO;
‒ Minority stake in Notore.
Ramp-up of production: Sorfert and resumption of operating rates at Egyptian plants.
An improved credit profile, the ramp up of Sorfert and increased operating rates at the Egyptian plants allows management to focus on shareholder value creation
Appendix
11
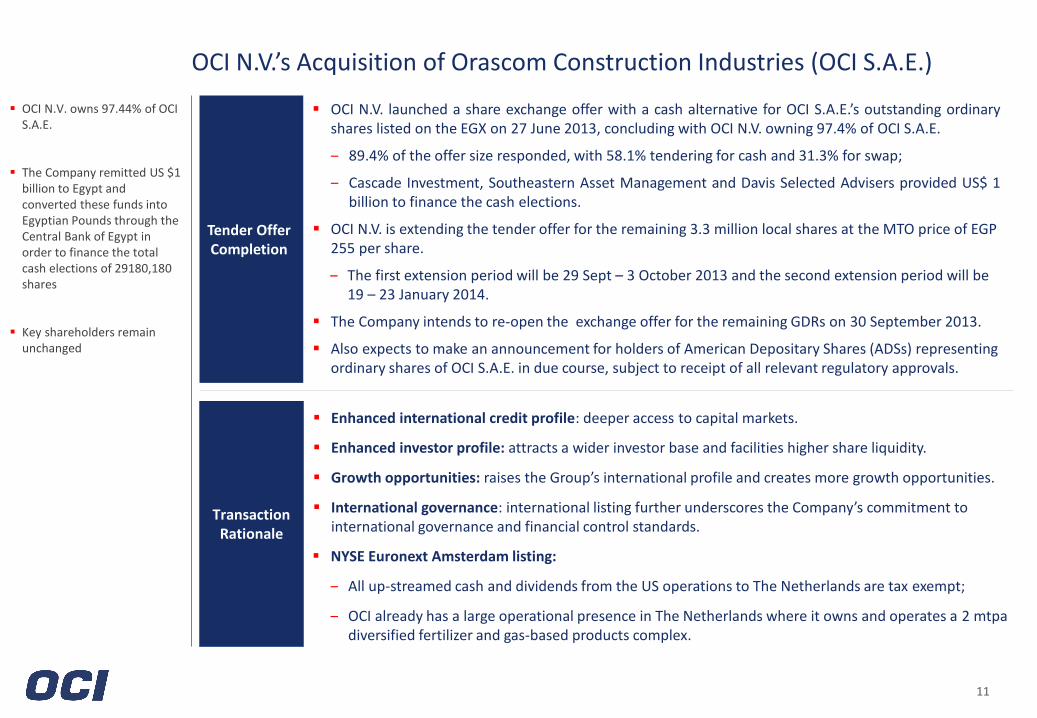
OCI N.V.’s Acquisition of Orascom Construction Industries (OCI S.A.E.)
Tender Offer Completion
OCI N.V. owns 97.44% of OCI S.A.E.
The Company remitted US $1 billion to Egypt and converted these funds into Egyptian Pounds through the Central Bank of Egypt in order to finance the total cash elections of 29180,180 shares
Key shareholders remain unchanged
OCI N.V. launched a share exchange offer with a cash alternative for OCI S.A.E.’s outstanding ordinary shares listed on the EGX on 27 June 2013, concluding with OCI N.V. owning 97.4% of OCI S.A.E.
‒ 89.4% of the offer size responded, with 58.1% tendering for cash and 31.3% for swap;
‒ Cascade Investment, Southeastern Asset Management and Davis Selected Advisers provided US$ 1 billion to finance the cash elections.
OCI N.V. is extending the tender offer for the remaining 3.3 million local shares at the MTO price of EGP 255 per share.
‒ The first extension period will be 29 Sept – 3 October 2013 and the second extension period will be 19 – 23 January 2014.
The Company intends to re-open the exchange offer for the remaining GDRs on 30 September 2013.
Also expects to make an announcement for holders of American Depositary Shares (ADSs) representing ordinary shares of OCI S.A.E. in due course, subject to receipt of all relevant regulatory approvals.
Enhanced international credit profile: deeper access to capital markets.
Enhanced investor profile: attracts a wider investor base and facilities higher share liquidity.
Growth opportunities: raises the Group’s international profile and creates more growth opportunities.
International governance: international listing further underscores the Company’s commitment to international governance and financial control standards.
NYSE Euronext Amsterdam listing:
‒ All up-streamed cash and dividends from the US operations to The Netherlands are tax exempt;
‒ OCI already has a large operational presence in The Netherlands where it owns and operates a 2 mtpa diversified fertilizer and gas-based products complex.
Transaction Rationale
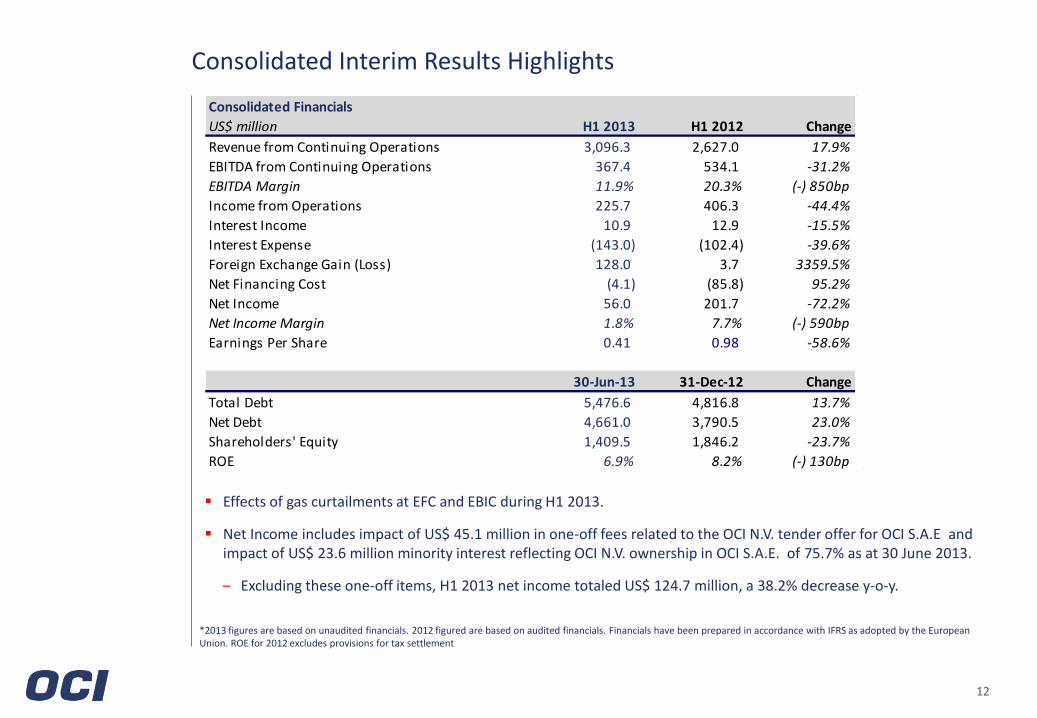
Consolidated Interim Results Highlights
12
Consolidated Financials
US$ million H1 2013 H1 2012 Change
Revenue from Continuing Operations 3,096.3 2,627.0 17.9%
EBITDA from Continuing Operations 367.4 534.1 -31.2%
EBITDA Margin 11.9% 20.3% (-) 850bp
Income from Operations 225.7 406.3 -44.4%
Interest Income 10.9 12.9 -15.5%
Interest Expense (143.0) (102.4) -39.6%
Foreign Exchange Gain (Loss) 128.0 3.7 3359.5%
Net Financing Cost (4.1) (85.8) 95.2%
Net Income 56.0 201.7 -72.2%
Net Income Margin 1.8% 7.7% (-) 590bp
Earnings Per Share 0.41 0.98 -58.6%
30-Jun-13 31-Dec-12 Change
Total Debt 5,476.6 4,816.8 13.7%
Net Debt 4,661.0 3,790.5 23.0%
Shareholders' Equity 1,409.5 1,846.2 -23.7%
ROE 6.9% 8.2% (-) 130bp
Effects of gas curtailments at EFC and EBIC during H1 2013.
Net Income includes impact of US$ 45.1 million in one-off fees related to the OCI N.V. tender offer for OCI S.A.E and impact of US$ 23.6 million minority interest reflecting OCI N.V. ownership in OCI S.A.E. of 75.7% as at 30 June 2013.
‒ Excluding these one-off items, H1 2013 net income totaled US$ 124.7 million, a 38.2% decrease y-o-y.
*2013 figures are based on unaudited financials. 2012 figured are based on audited financials. Financials have been prepared in accordance with IFRS as adopted by the European Union. ROE for 2012 excludes provisions for tax settlement
Fertilizer Group
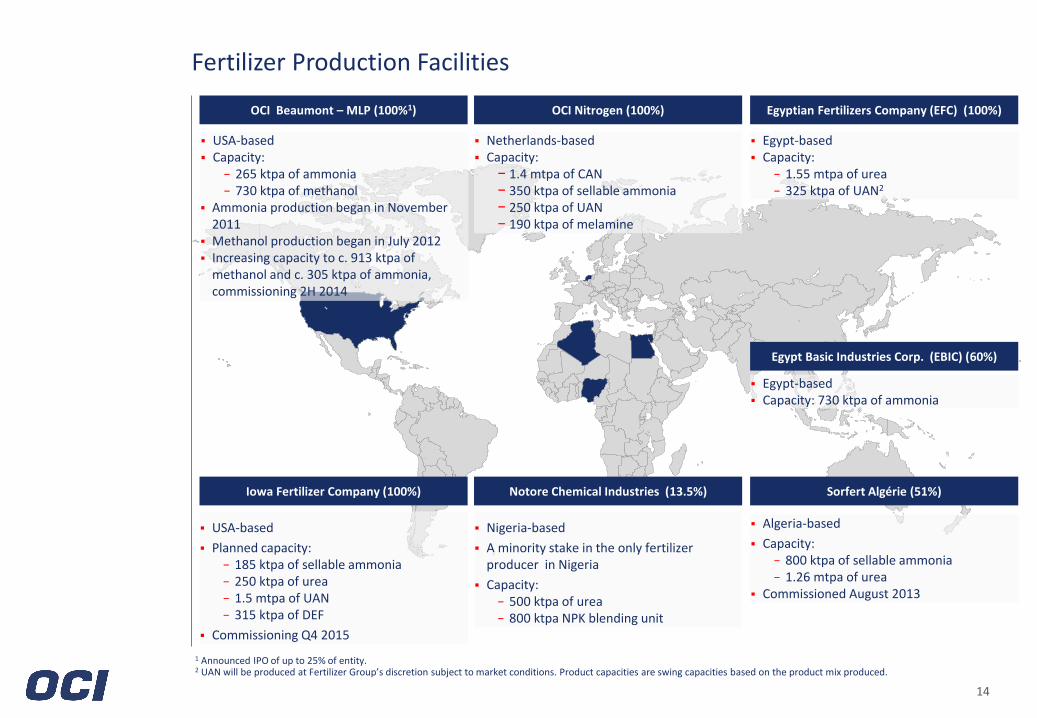
OCI Nitrogen (100%)
Netherlands-based Capacity:
− 1.4 mtpa of CAN − 350 ktpa of sellable ammonia − 250 ktpa of UAN − 190 ktpa of melamine
Notore Chemical Industries (13.5%)
Nigeria-based
A minority stake in the only fertilizer producer in Nigeria
Capacity: − 500 ktpa of urea − 800 ktpa NPK blending unit
Sorfert Algérie (51%)
Algeria-based
Capacity: − 800 ktpa of sellable ammonia − 1.26 mtpa of urea
Commissioned August 2013
Egyptian Fertilizers Company (EFC) (100%)
Egypt-based Capacity:
− 1.55 mtpa of urea − 325 ktpa of UAN2
Egypt Basic Industries Corp. (EBIC) (60%)
Egypt-based Capacity: 730 ktpa of ammonia
Fertilizer Production Facilities
14
OCI Beaumont – MLP (100%1)
USA-based Capacity:
− 265 ktpa of ammonia − 730 ktpa of methanol
Ammonia production began in November 2011
Methanol production began in July 2012 Increasing capacity to c. 913 ktpa of
methanol and c. 305 ktpa of ammonia, commissioning 2H 2014
1 Announced IPO of up to 25% of entity. 2 UAN will be produced at Fertilizer Group’s discretion subject to market conditions. Product capacities are swing capacities based on the product mix produced.
Iowa Fertilizer Company (100%)
USA-based
Planned capacity: − 185 ktpa of sellable ammonia − 250 ktpa of urea − 1.5 mtpa of UAN − 315 ktpa of DEF
Commissioning Q4 2015
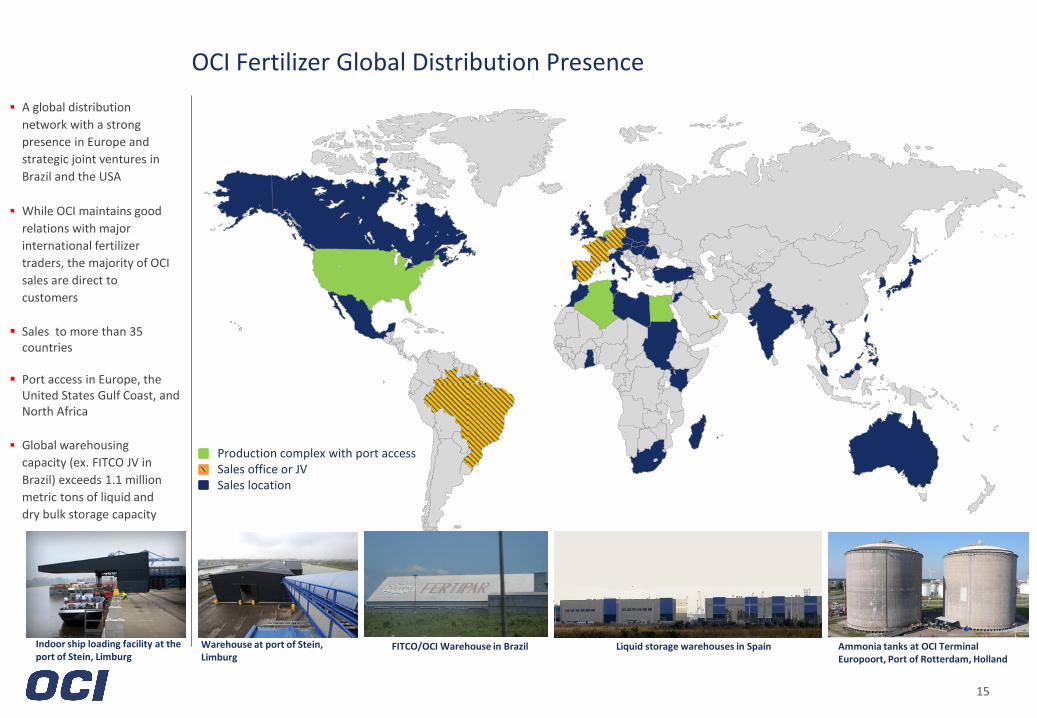
OCI Fertilizer Global Distribution Presence
15
A global distribution
network with a strong
presence in Europe and
strategic joint ventures in
Brazil and the USA
While OCI maintains good
relations with major
international fertilizer
traders, the majority of OCI
sales are direct to
customers
Sales to more than 35 countries
Port access in Europe, the United States Gulf Coast, and North Africa
Global warehousing
capacity (ex. FITCO JV in
Brazil) exceeds 1.1 million
metric tons of liquid and
dry bulk storage capacity
Production complex with port access Sales office or JV Sales location
Indoor ship loading facility at the port of Stein, Limburg
Ammonia tanks at OCI Terminal Europoort, Port of Rotterdam, Holland
Liquid storage warehouses in Spain FITCO/OCI Warehouse in Brazil Warehouse at port of Stein, Limburg
16
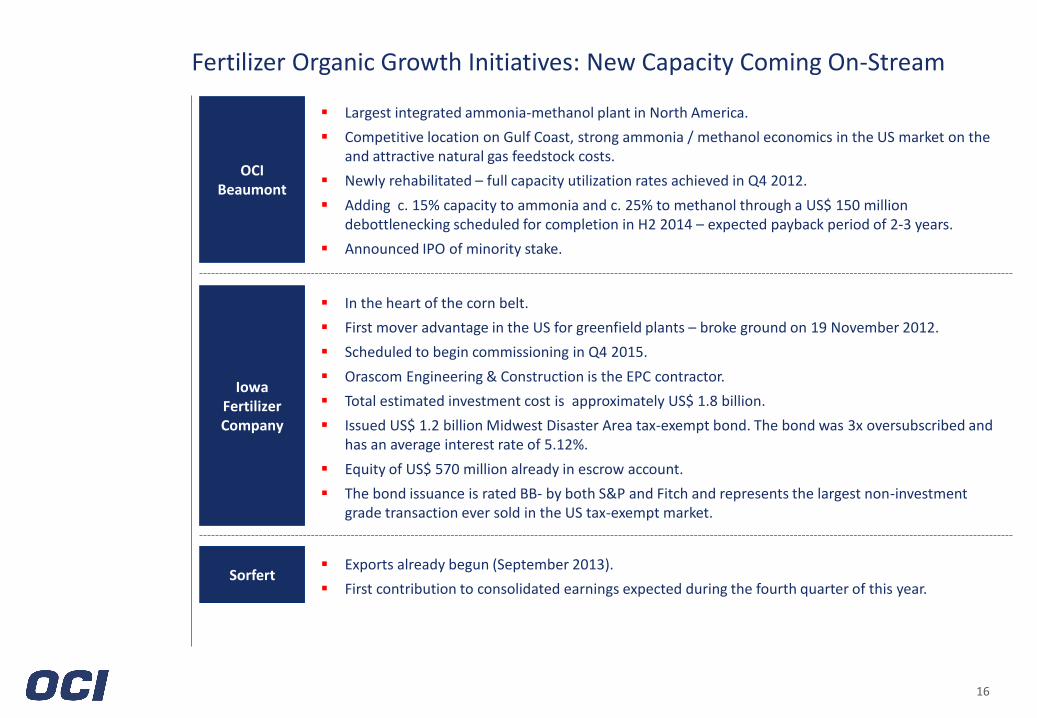
Fertilizer Organic Growth Initiatives: New Capacity Coming On-Stream
Largest integrated ammonia-methanol plant in North America.
Competitive location on Gulf Coast, strong ammonia / methanol economics in the US market on the and attractive natural gas feedstock costs.
Newly rehabilitated – full capacity utilization rates achieved in Q4 2012.
Adding c. 15% capacity to ammonia and c. 25% to methanol through a US$ 150 million debottlenecking scheduled for completion in H2 2014 – expected payback period of 2-3 years.
Announced IPO of minority stake.
OCI Beaumont
Exports already begun (September 2013).
First contribution to consolidated earnings expected during the fourth quarter of this year. Sorfert
In the heart of the corn belt.
First mover advantage in the US for greenfield plants – broke ground on 19 November 2012.
Scheduled to begin commissioning in Q4 2015.
Orascom Engineering & Construction is the EPC contractor.
Total estimated investment cost is approximately US$ 1.8 billion.
Issued US$ 1.2 billion Midwest Disaster Area tax-exempt bond. The bond was 3x oversubscribed and has an average interest rate of 5.12%.
Equity of US$ 570 million already in escrow account.
The bond issuance is rated BB- by both S&P and Fitch and represents the largest non-investment grade transaction ever sold in the US tax-exempt market.
Iowa Fertilizer Company
Construction Group
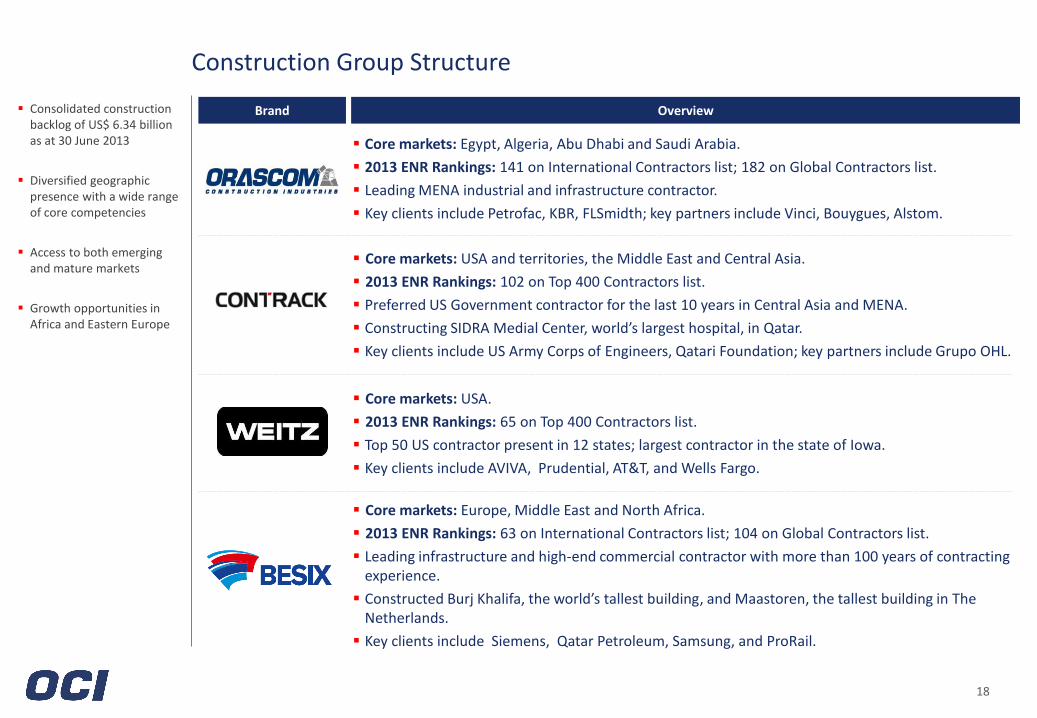
Construction Group Structure
18
Core markets: Egypt, Algeria, Abu Dhabi and Saudi Arabia.
2013 ENR Rankings: 141 on International Contractors list; 182 on Global Contractors list.
Leading MENA industrial and infrastructure contractor.
Key clients include Petrofac, KBR, FLSmidth; key partners include Vinci, Bouygues, Alstom.
Core markets: USA and territories, the Middle East and Central Asia.
2013 ENR Rankings: 102 on Top 400 Contractors list.
Preferred US Government contractor for the last 10 years in Central Asia and MENA.
Constructing SIDRA Medial Center, world’s largest hospital, in Qatar.
Key clients include US Army Corps of Engineers, Qatari Foundation; key partners include Grupo OHL.
Core markets: USA.
2013 ENR Rankings: 65 on Top 400 Contractors list.
Top 50 US contractor present in 12 states; largest contractor in the state of Iowa.
Key clients include AVIVA, Prudential, AT&T, and Wells Fargo.
Core markets: Europe, Middle East and North Africa.
2013 ENR Rankings: 63 on International Contractors list; 104 on Global Contractors list.
Leading infrastructure and high-end commercial contractor with more than 100 years of contracting experience.
Constructed Burj Khalifa, the world’s tallest building, and Maastoren, the tallest building in The Netherlands.
Key clients include Siemens, Qatar Petroleum, Samsung, and ProRail.
Brand Overview Consolidated construction backlog of US$ 6.34 billion as at 30 June 2013
Diversified geographic presence with a wide range of core competencies
Access to both emerging and mature markets
Growth opportunities in Africa and Eastern Europe
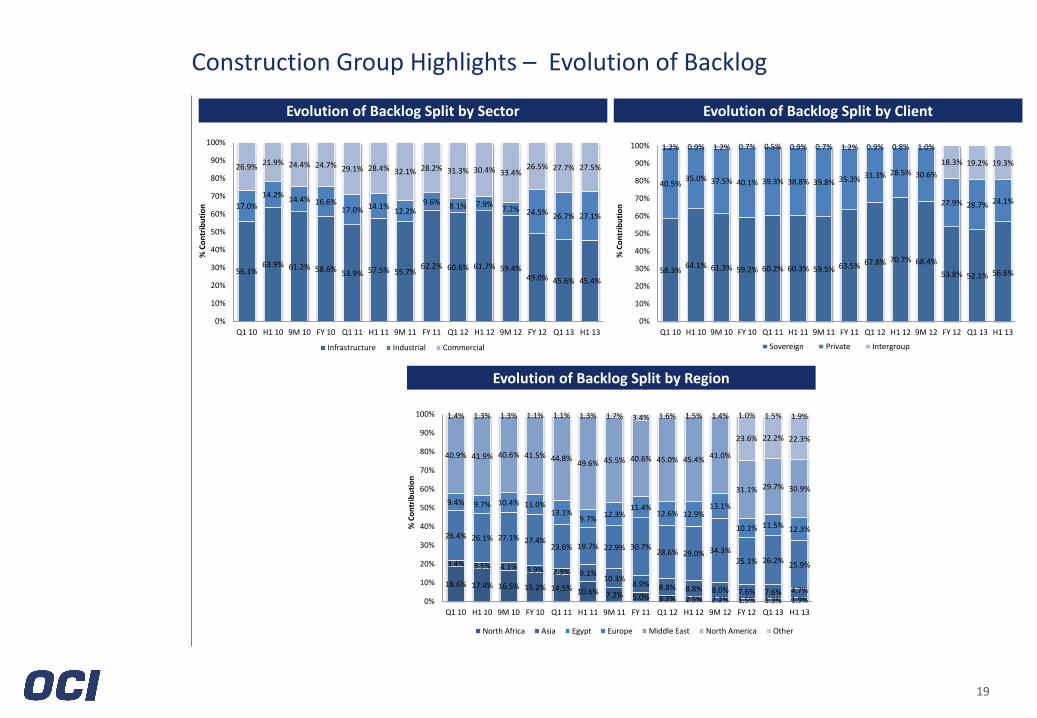
18.6% 17.4% 16.5% 15.2% 14.5% 10.6% 7.2% 5.0% 3.2% 2.5% 2.2% 1.5% 1.3% 1.9%
3.4% 3.5% 4.1% 3.9% 2.9% 9.1%10.3%
8.9% 8.8% 8.8% 8.0% 7.6% 7.6% 4.7%
26.4% 26.1% 27.1% 27.4%23.6% 19.7% 22.9% 30.7%
28.6% 29.0% 34.3%25.1% 26.2%
25.9%
9.4% 9.7% 10.4% 11.0%13.1%
9.7%12.3%
11.4%12.6% 12.9%
13.1%
10.1% 11.5% 12.3%
40.9% 41.9% 40.6% 41.5% 44.8%49.6% 45.5% 40.6% 45.0% 45.4% 41.0%
31.1% 29.7% 30.9%
23.6% 22.2% 22.3%
1.4% 1.3% 1.3% 1.1% 1.1% 1.3% 1.7% 3.4% 1.6% 1.5% 1.4% 1.0% 1.5% 1.9%
0%
10%
20%
30%
40%
50%
60%
70%
80%
90%
100%
Q1 10 H1 10 9M 10 FY 10 Q1 11 H1 11 9M 11 FY 11 Q1 12 H1 12 9M 12 FY 12 Q1 13 H1 13
% C
on
trib
uti
on
North Africa Asia Egypt Europe Middle East North America Other
56.1%63.9% 61.2% 58.6% 53.9% 57.5% 55.7%
62.2% 60.6% 61.7% 59.4%49.0% 45.6% 45.4%
17.0%
14.2%14.4% 16.6%
17.0% 14.1%12.2%
9.6% 8.1% 7.9%7.2% 24.5% 26.7% 27.1%
26.9%21.9% 24.4% 24.7% 29.1% 28.4% 32.1% 28.2% 31.3% 30.4% 33.4%
26.5% 27.7% 27.5%
0%
10%
20%
30%
40%
50%
60%
70%
80%
90%
100%
Q1 10 H1 10 9M 10 FY 10 Q1 11 H1 11 9M 11 FY 11 Q1 12 H1 12 9M 12 FY 12 Q1 13 H1 13
% C
on
trib
uti
on
Infrastructure Industrial Commercial
58.3%64.1% 61.3% 59.2% 60.2% 60.3% 59.5% 63.5% 67.8% 70.7% 68.4%
53.8% 52.1% 56.6%
40.5%35.0% 37.5% 40.1% 39.3% 38.8% 39.8% 35.3% 31.3% 28.5% 30.6%
27.9% 28.7% 24.1%
1.2% 0.9% 1.2% 0.7% 0.5% 0.9% 0.7% 1.2% 0.9% 0.8% 1.0%
18.3% 19.2% 19.3%
0%
10%
20%
30%
40%
50%
60%
70%
80%
90%
100%
Q1 10 H1 10 9M 10 FY 10 Q1 11 H1 11 9M 11 FY 11 Q1 12 H1 12 9M 12 FY 12 Q1 13 H1 13
% C
on
trib
uti
on
Sovereign Private Intergroup
19
Construction Group Highlights – Evolution of Backlog
Evolution of Backlog Split by Sector Evolution of Backlog Split by Client
Evolution of Backlog Split by Region
NOT FOR RELEASE, PUBLICATION OR DISTRIBUTION IN WHOLE OR IN PART, IN, INTO OR FROM ANY JURISDICTION WHERE TO DO SO WOULD CONSTITUTE A VIOLATION OF THE RELEVANT LAWS OF SUCH JURISDICTION. THIS DOCUMENT IS NOT AN EXTENSION INTO THE UNITED STATES OF THE OFFER MENTIONED BELOW AND IS NOT AN OFFER TO SELL SECURITIES OR THE SOLICITATION OF AN OFFER TO BUY SECURITIES IN THE UNITED STATES. This document has been provided to you for information purposes only. This document does not constitute an offer of, or an invitation to invest or deal in, the securities of OCI N.V. Certain statements contained in this document constitute forward-looking statements relating to OCI N.V. (the "Company"), its business, markets and/or industry. These statements are generally identified by words such as "believe," "expect," "anticipate," "intends," "estimate," "forecast," "project," "will," "may," "should" and similar expressions. Forward-looking statements involve known and unknown risks, uncertainties and other factors, many of which are outside of the Company's control and are difficult to predict, that may cause actual results to differ materially from any future results expressed or implied from the forward-looking statements. The forward-looking statements contained herein are based on the Company's current plans, estimates, assumptions and projections. Various factors could cause actual future results, performance or events to differ materially from those described in these statements. The Company does not make any representation as to the future accuracy of the assumptions underlying any of the statements contained herein. The information contained herein is expressed as of the date hereof and may be subject to change. Neither the Company nor any of its controlling shareholders, directors or executive officers or anyone else has any duty or obligation to supplement, amend, update or revise any of the forward-looking statements contained in this document. The Company’s backlog or orderbook is based on management’s estimates of awarded, signed and ongoing contracts which have not yet completed, and serves as an indication of total size of contracts to be executed.
Disclaimer
For OCI N.V. investor relations enquiries contact: Hassan Badrawi [email protected] T: +44 207 439 4801 Omar Darwazah [email protected] M +20 12 681 7970 Erika Wakid [email protected] M +20 12 855 8779 OCI N.V. corporate website: www.ocinv.nl