oct 14, 2009 i.savings and investment a.the savings and investment identity ii.deficits and debt...
TRANSCRIPT
Oct 14, 2009
I. Savings and InvestmentA. The Savings and Investment Identity
II. Deficits and DebtIII. Problems with the debt


The Algebra of Savings and Investment
1. GDP = C+I+G+NX expenditures = output= income
2. Ignore ROW, so Y = C+I+G3. Y – C – G = I4. Y – C – G = S5. S = Y (– T + T) – C – G6. S = (Y – T – C) + (T – G)7. Total Savings = Private Savings +
Public Savings

Where does the Federal government get its
revenues?1. Income Taxes
____%2. Social Security Taxes
____%3. Corporate Taxes
____%4. Sales Taxes
____%5. Property Taxes
____%6. Excise Taxes (gas, tobacco, alcohol)
____%7. Tariffs
____%8. Estate Taxes
____%9. How much tax revenue did the federal
government collect in FY08? $ ____
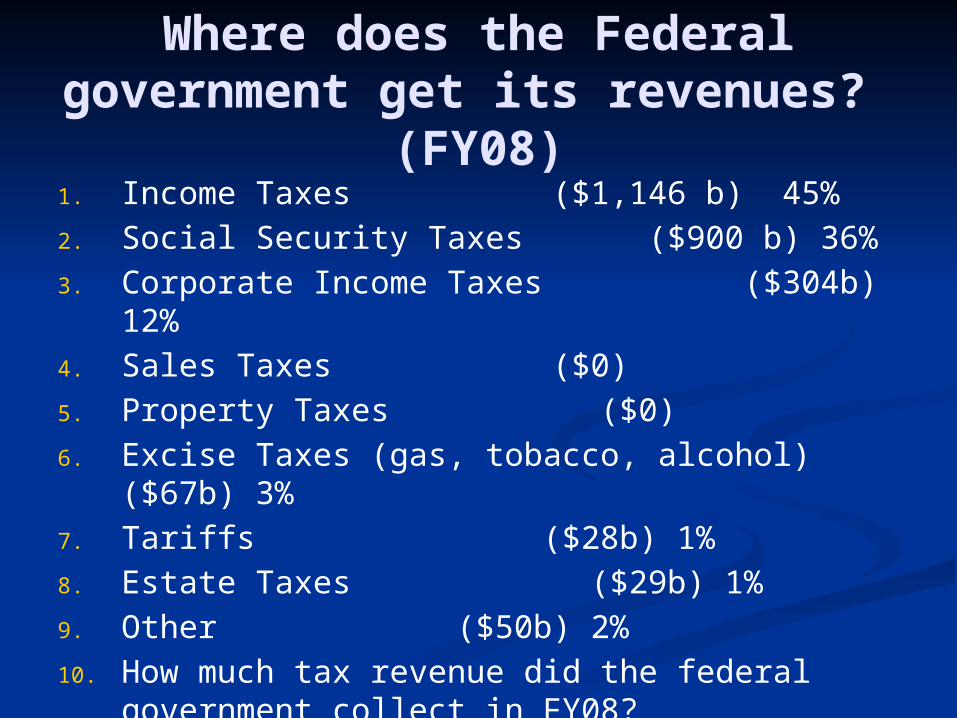
Where does the Federal government get its revenues?
(FY08)1. Income Taxes ($1,146 b)
45%2. Social Security Taxes ($900 b)
36%3. Corporate Income Taxes
($304b) 12%4. Sales Taxes ($0)5. Property Taxes ($0)6. Excise Taxes (gas, tobacco, alcohol) ($67b)
3%7. Tariffs ($28b) 1%8. Estate Taxes ($29b) 1%9. Other ($50b) 2%10. How much tax revenue did the federal
government collect in FY08? ($2,524 billion)
(Source: http://www.gpoaccess.gov/usbudget/browse.html


Where does the Federal government spend its
money?$ Amount Percent of Total
Defense
Social Security
Medicare
Medicaid
Interest
Income security
Other retirement
International
Other
Total 100%
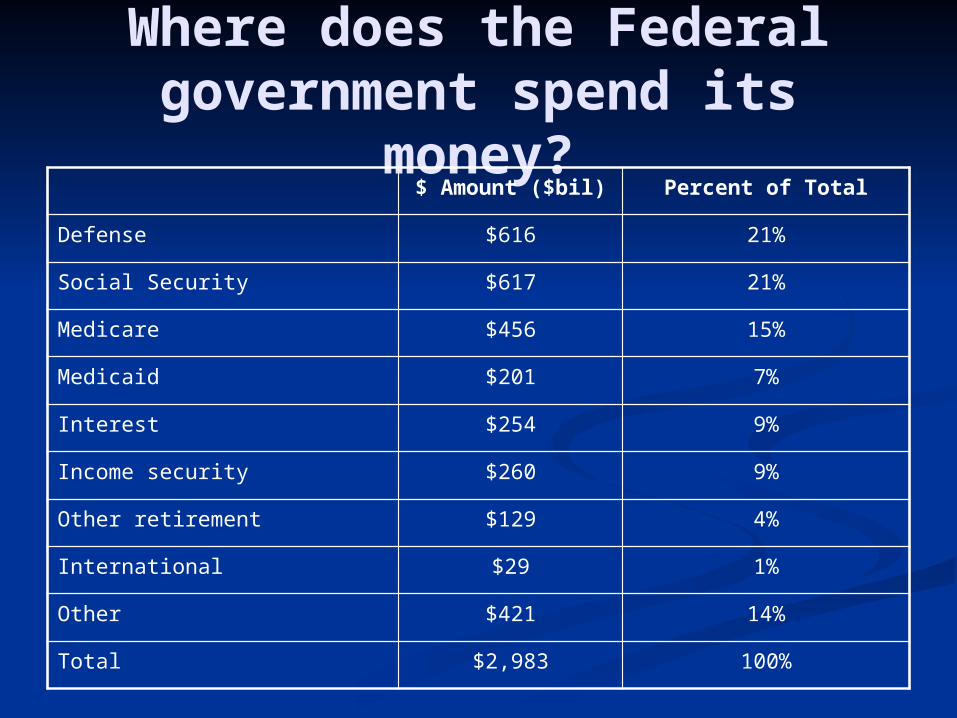
Where does the Federal government spend its
money?$ Amount ($bil) Percent of Total
Defense $616 21%
Social Security $617 21%
Medicare $456 15%
Medicaid $201 7%
Interest $254 9%
Income security $260 9%
Other retirement $129 4%
International $29 1%
Other $421 14%
Total $2,983 100%
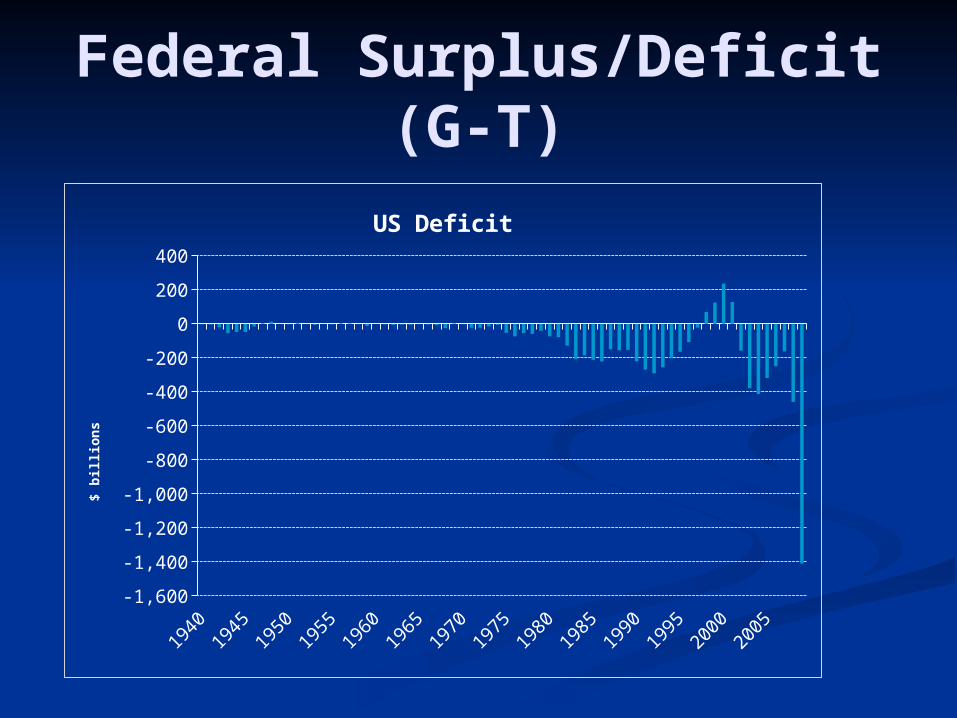
Federal Surplus/Deficit (G-T)
1940
1944
1948
1952
1956
1960
1964
1968
1972
1976
1980
1984
1988
1992
1996
2000
2004
2008
-1,600
-1,400
-1,200
-1,000
-800
-600
-400
-200
0
200
400
US Deficit
$ b
illi
ons
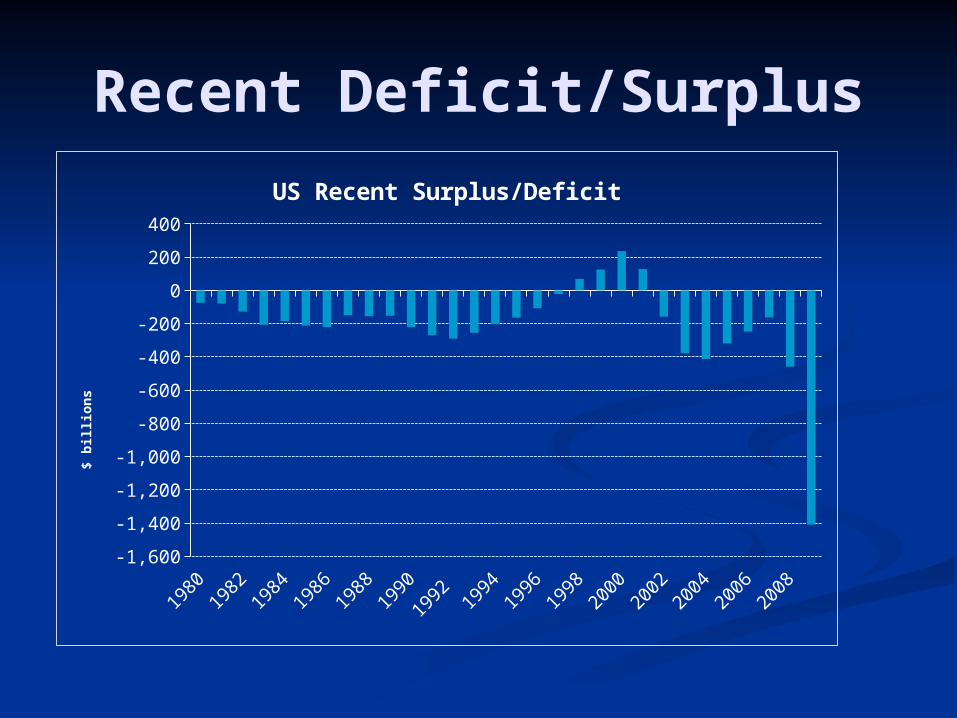
Recent Deficit/Surplus
1980
1982
1984
1986
1988
1990
1992
1994
1996
1998
2000
2002
2004
2006
2008
-1,600
-1,400
-1,200
-1,000
-800
-600
-400
-200
0
200
400
US Recent Surplus/Deficit
$ b
illi
ons
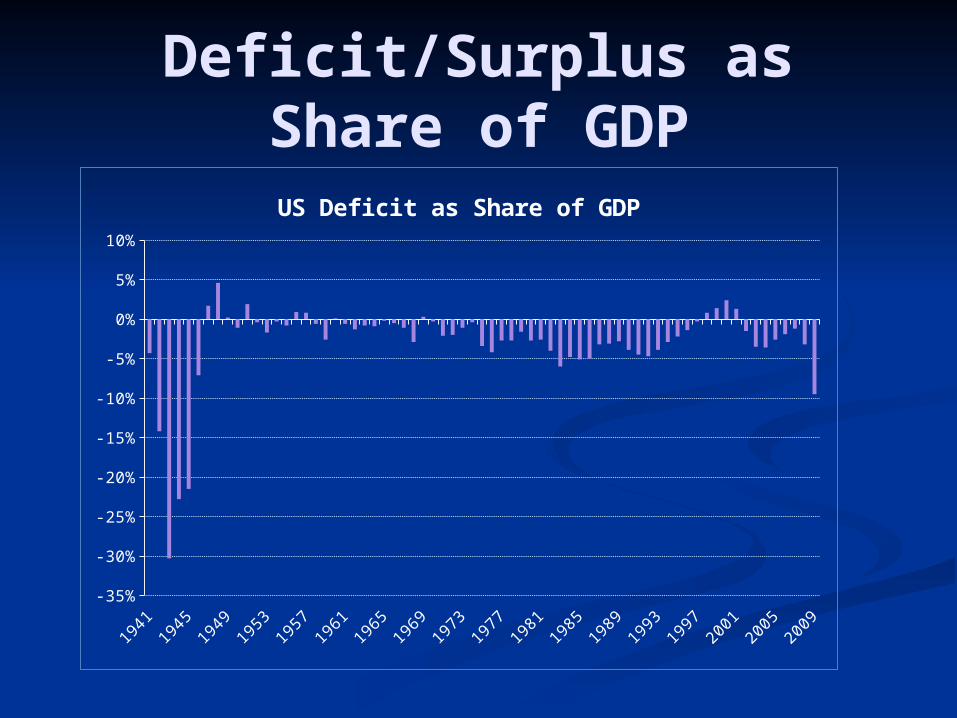
Deficit/Surplus as Share of GDP
1941
1944
1947
1950
1953
1956
1959
1962
1965
1968
1971
1974
1977
1980
1983
1986
1989
1992
1995
1998
2001
2004
2007
-35%
-30%
-25%
-20%
-15%
-10%
-5%
0%
5%
10%
US Deficit as Share of GDP

Recent History1
98
01
98
11
98
21
98
31
98
41
98
51
98
61
98
71
98
81
98
91
99
01
99
11
99
2
19
93
19
94
19
95
19
96
19
97
19
98
19
99
20
00
20
01
20
02
20
03
20
04
20
05
20
06
20
07
20
08
20
09
-12%
-10%
-8%
-6%
-4%
-2%
0%
2%
4%
US Deficit as Share of GDP
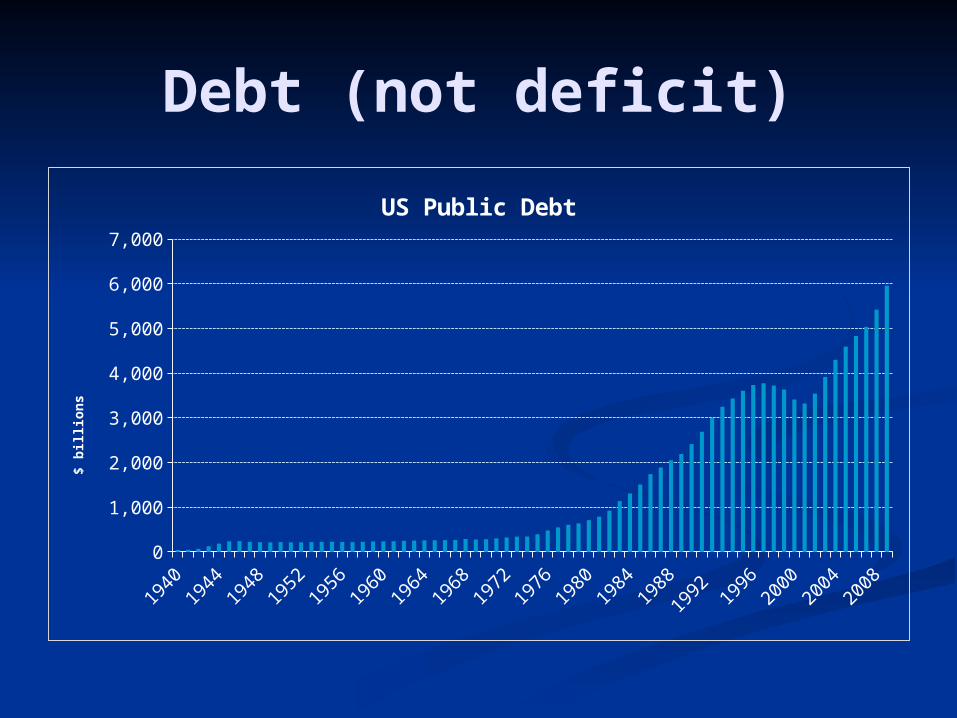
Debt (not deficit)
1940
1944
1948
1952
1956
1960
1964
1968
1972
1976
1980
1984
1988
1992
1996
2000
2004
2008
0
1,000
2,000
3,000
4,000
5,000
6,000
7,000
US Public Debt
$ b
illi
ons
1941
1943
1945
1947
1949
1951
1953
1955
1957
1959
1961
1963
1965
1967
1969
1971
1973
1975
1977
1979
1981
1983
1985
1987
1989
1991
1993
1995
1997
1999
2001
2003
2005
2007
2009
0%
20%
40%
60%
80%
100%
120%
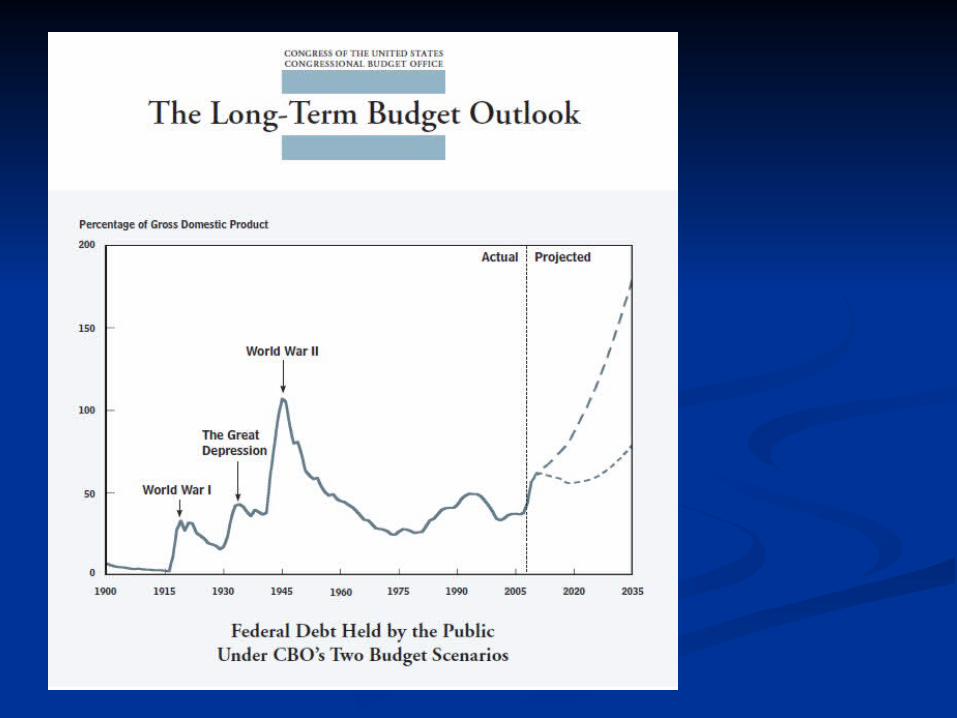
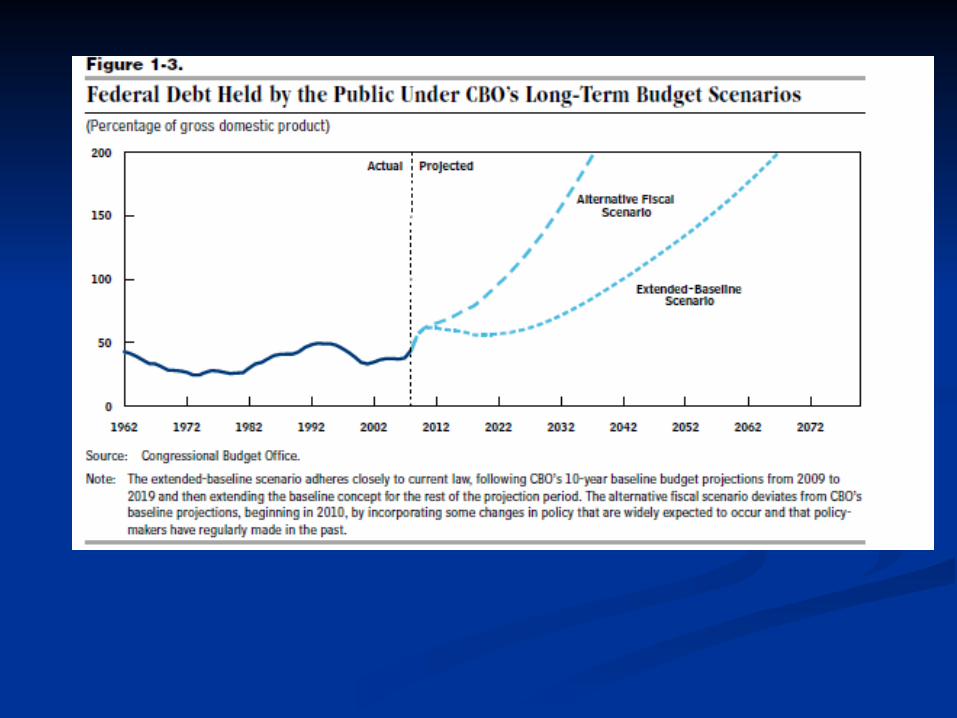
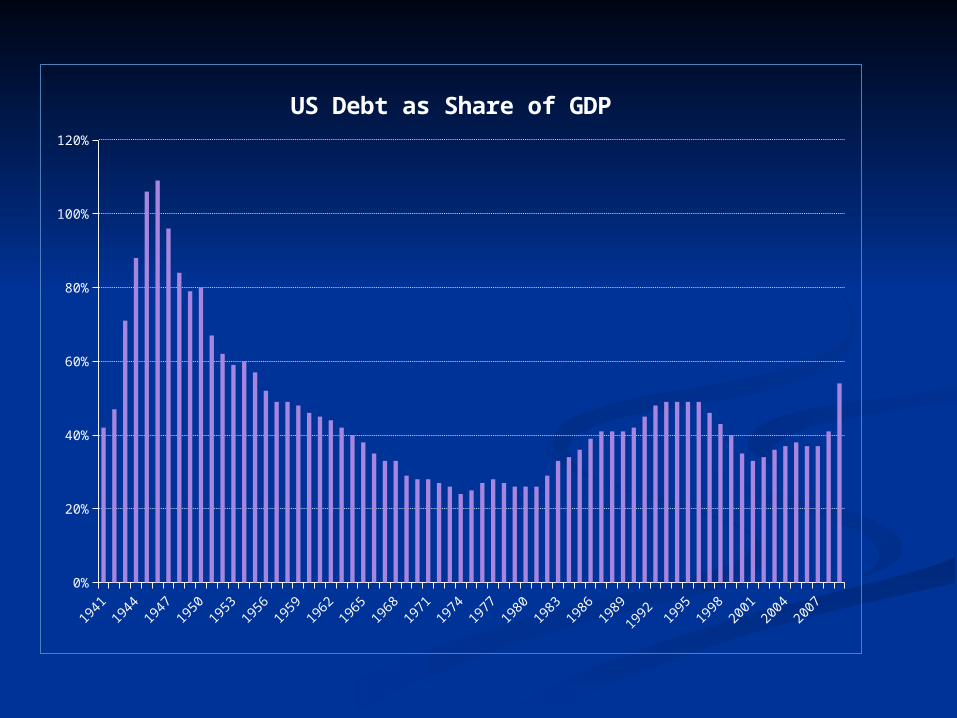
US Debt as Share of GDP
19801982
19841986
19881990
1992
19941996
19982000
20022004
20062008
-10%
-5%
0%
5%
10%
15%
20%
25%
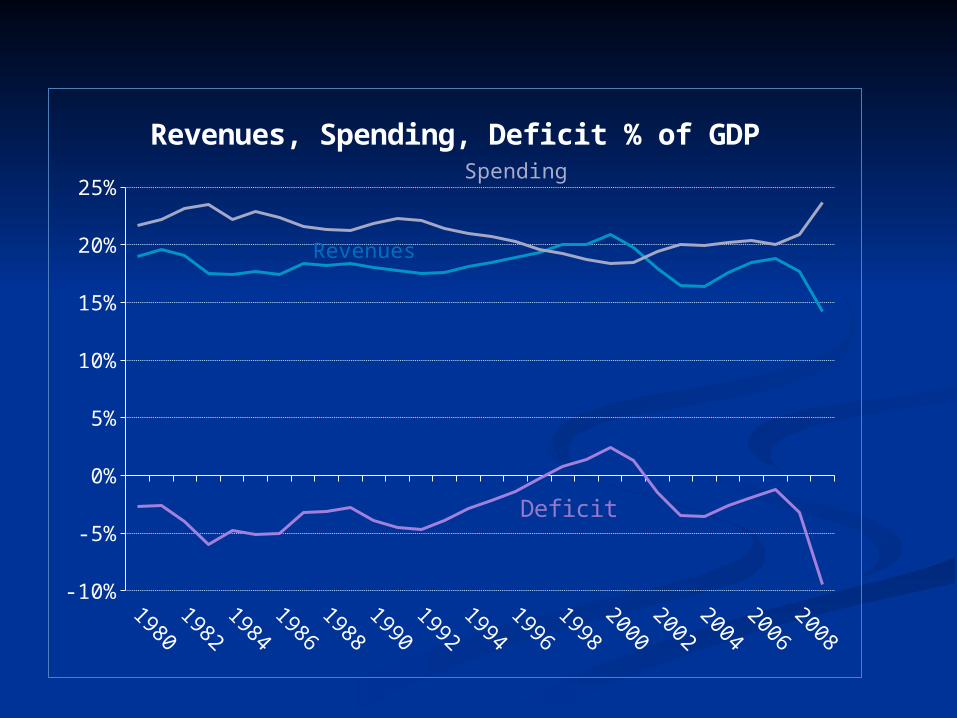
Revenues, Spending, Deficit % of GDPSpending
Revenues
Deficit
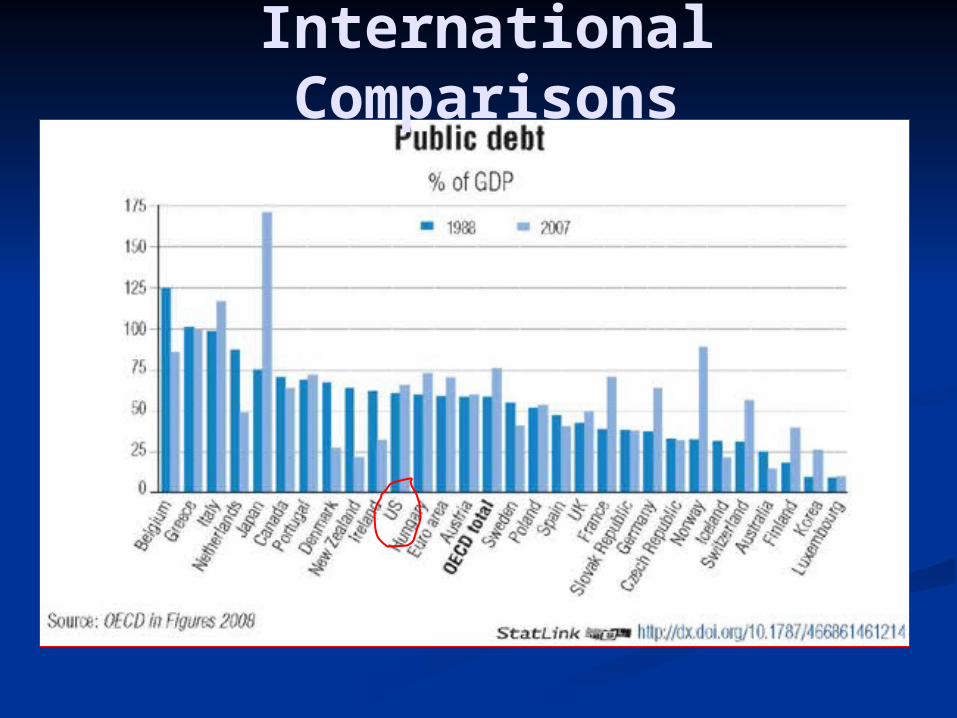
International Comparisons