october 14, 2021 the bond market is finally waking up
TRANSCRIPT

SHORT-TERM ISSUES
• Bonds finally wake up and begin to “smell” inflation.
• Two new trades, one with a 7+% yield!
By Graham Summers, Chief Market Strategist
October 14, 2021
The Bond Market Is Finally Waking Up
One of the biggest critiques of my inflation forecast has been that bond yields have NOT responded to the inflationary pressures I see running throughout the financial system. Historically, the U.S. Treasury market has been one of the best means of predicting inflation or deflation. This is because the Treasury market has been one of the most liquid, sophisticated markets with the yields on these bonds moving based on economic developments, monetary policy, and other items. I say, “has been”, because the bond market doesn’t discount much of anything anymore, courtesy of Fed interventions. Indeed, the Fed is so involved in this market, that it takes something DRAMATIC for the bond markets to “wake up.” Today, the Fed is engaged in $120 billion in QE per month. Of this, $80 billion is spent buying U.S. Treasuries. That’s $960 BILLION, or almost $1 TRILLION per year. Bear in mind, this is NOT a new development. The Fed has already spent some $4 trillion buying these bonds in the last decade. And it’s adding to this mountain at a pace of nearly $1 trillion per year today! So, you can see why I say the bond market doesn’t discount much of anything anymore. Yes, bonds and their yields fluctuate day to day due to various trader games and bond fund moves… but with the Fed so heavily involved in this space, it takes something SERIOUS for bonds to make a significant move. Something like inflation.

PHOENIXCAPITALRESEARCH.COM
PAGE 2 of 12
The official inflation number is called the Consumer Price Index or CPI. I’ve written extensively on how manipulated this number is in the past. And yet, despite all these manipulations, this number is STILL coming in hot. Yesterday’s CPI for the month of September showed inflation at 5.4%, with a month over month increase of 0.4% (0.2% was expected). Put another way, according to “official” data, inflation is now nearly 6% and increasing at an alarming rate. However as bad as the CPI looks… reality is worse. Dissecting all the gimmicks the Bureau of Labor Statistics (BLS) employed to understate September’s inflation numbers would take more pages than we have this week. However, one of the more glaring examples concerns its “Shelter” component which is supposed to measure how much it cost to own or rent property in the U.S. last month. Now, “Shelter” comprises almost 33% of the CPI. So, it’s a MAJOR component of the official inflation number. And as such it is massaged in a MAJOR WAY. The BLS counts “Shelter” via two different measures called “Rent of Primary Residency” and “Owners Equivalent Rent.” Rent of Primary Residence is meant to represent what you would pay to rent a residence including extra charges such as parking or garage facilities. Owner’s Equivalent Rent is meant to replicate your cost of owning a home based on what you could potentially rent it out for. The BLS calculates both measures via public surveys. Setting aside the fact that NO ONE wants to talk to the BLS about their expenses (which renders them highly accurate), the BLS still massages the data it does collect to an absurd degree. Case in point, according to the BLS, Rent of Primary Residence is up only 2.4% over the last 12 months while Owner’s Equivalent Rent is up only 2.9%. In the REAL world, apartment rental costs are up 8% to 20% depending on the specific market. And Home Prices are up 20% in the last 12 months. Even if you already own a home, meaning that you don’t need to buy one so the rise in home prices doesn’t hit you right now, you’re still paying more in property taxes and other items related to the spike in home prices. Put simply, unless you live in a cave, your real-world Shelter expenses are up triple if not quadruple the BLS’s claim of ~3%. And remember, Shelter comprises almost 33% of CPI!

PHOENIXCAPITALRESEARCH.COM
PAGE 3 of 12
Add it all up, and the REAL rate of inflation for Shelter should be 8% or higher over the last 12
months. But because the BLS claims Shelter inflation at the ridiculously low level of ~3%, the official CPI comes in at just 5.4%. If the BLS were to use accurate data here, CPI would have hit 9% or even 10% in September. And bear in mind, we’re just talking about the “Shelter” component of CPI here. There are many other gimmicks employed to understand the other components. So, what does this have to do with the bond market? Bond Yields trade based on inflation. And between the Fed’s interventions and the BLS’s careful understating of CPI, bond yields have been suppressed, which has allowed deflationists and others to claim inflation is not a real problem. Not anymore. The yield on the all-important 10-year U.S. Treasury looks to have bottomed in July of this year. And it began to spike last month, the month in which even the understated CPI showed inflation is a real problem.
The picture is even worse in the longer-term. Depending on how you look at the yield on the 10-year U.S. Treasury over the last two years, we have either an inverse Head and Shoulders which predicts the yield hitting 2.6%+…

PHOENIXCAPITALRESEARCH.COM
PAGE 4 of 12
…or a Cup and Handle formation with a similar target of 2.6%.
Why does this matter? Because if the yield on this bond were to rise to those levels, it would have broken its 30+ year downtrend.

PHOENIXCAPITALRESEARCH.COM
PAGE 5 of 12
You’ll note that the yield has only done this ONCE in the last 40 years (in 2018 to be precise). The reason that happened was because the Fed was RAISING interest rates at a pace of four times per year while also SHRINKING its balance sheet by $500 billion. Put simply, at that time the Fed was tightening monetary policy. This time around, if the 10-Year Treasury yield breaks upwards from current levels, it will have happened at a time when the Fed has interest rates at ZERO and is GROWING its balance sheet by over $1.4 TRILLION per year. Put another way, if the 10-Year Treasury’s yield rises to 2.6% due to inflation, breaking their 30+ year downtrend, they will be doing so at a time when the Fed is engaged in EXTRAORDINARY levels of easing. You can see why this would be a MAJOR problem. The only way the Fed can slow or stop inflation is by raising interest rates and ending its QE program. But doing that would only make bond yields rise HIGHER (yields move based on Fed policy as well as inflation). And that would only make things WORSE. The U.S. has over $28 trillion in debt outstanding. The only way it can remain solvent with this much debt is if bond yields remain low. If yields begin to rise and continue rising, this situation can get ugly. This is the biggest concern I have for the markets right now. Thus far inflation has been “good” for stocks, but if bond yields begin to rise and the Fed is forced to aggressively raise rates, it could be GAME OVER for the bull market. Perhaps this is what the market has been reacting to in the last few weeks?
PHOENIXCAPITALRESEARCH.COM
PAGE 6 of 12
This is the big picture situation for the financial system right now.
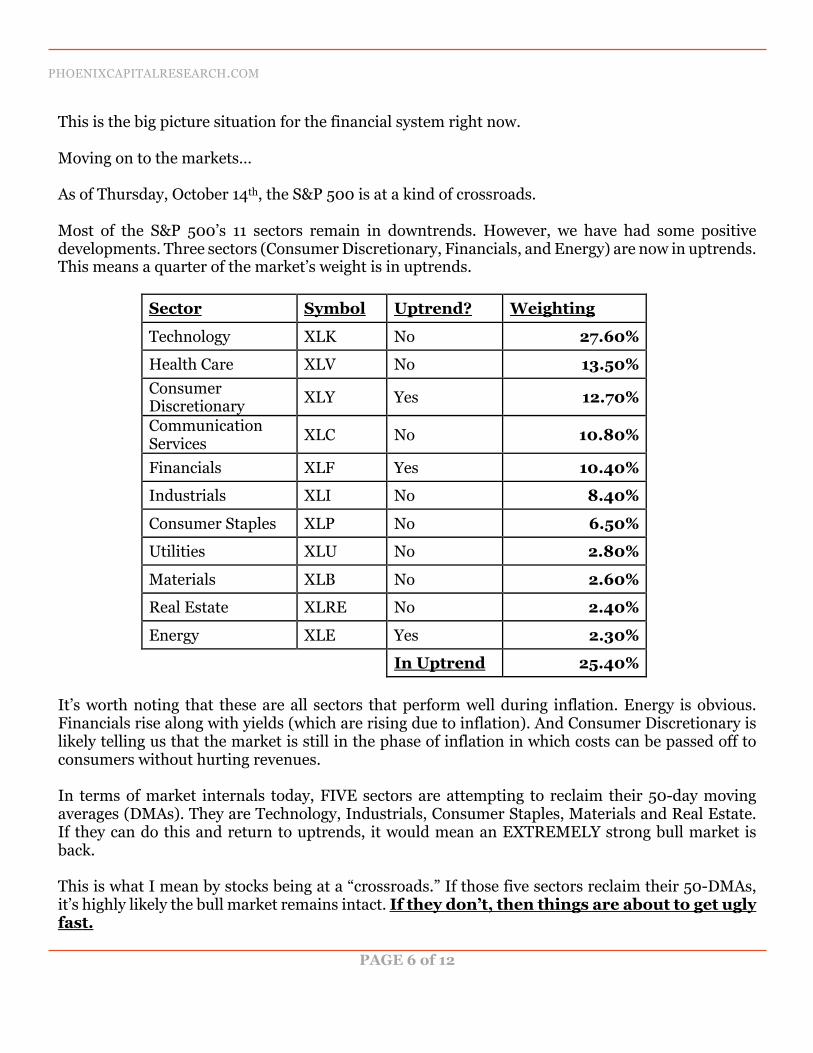
Moving on to the markets… As of Thursday, October 14th, the S&P 500 is at a kind of crossroads. Most of the S&P 500’s 11 sectors remain in downtrends. However, we have had some positive developments. Three sectors (Consumer Discretionary, Financials, and Energy) are now in uptrends. This means a quarter of the market’s weight is in uptrends.
Sector Symbol Uptrend? Weighting
Technology XLK No 27.60%
Health Care XLV No 13.50% Consumer Discretionary XLY Yes 12.70%
Communication Services XLC No 10.80%
Financials XLF Yes 10.40%
Industrials XLI No 8.40%
Consumer Staples XLP No 6.50%
Utilities XLU No 2.80%
Materials XLB No 2.60%
Real Estate XLRE No 2.40%
Energy XLE Yes 2.30%
In Uptrend 25.40% It’s worth noting that these are all sectors that perform well during inflation. Energy is obvious. Financials rise along with yields (which are rising due to inflation). And Consumer Discretionary is likely telling us that the market is still in the phase of inflation in which costs can be passed off to consumers without hurting revenues. In terms of market internals today, FIVE sectors are attempting to reclaim their 50-day moving averages (DMAs). They are Technology, Industrials, Consumer Staples, Materials and Real Estate. If they can do this and return to uptrends, it would mean an EXTREMELY strong bull market is back. This is what I mean by stocks being at a “crossroads.” If those five sectors reclaim their 50-DMAs, it’s highly likely the bull market remains intact. If they don’t, then things are about to get ugly fast.

PHOENIXCAPITALRESEARCH.COM
PAGE 7 of 12
We’ll know the answer tomorrow evening when we get our new set of weekly candles to work with. But for now, the market’s internals are improving, but stocks are not out of the woods just yet. In terms of new positions, copper has caught a major bid on inflationary fears. Copper producer Freeport McMoRan (FCX) has broken out of a bull flag, with its share price breaking above both its 50-and its 200-DMAs. It is just a few days away from triggering a “Buy” on its weekly MACD.
Action to Take: Buy Freeport McMoran (FCX). I also like Master Limited Partnerships with exposure to energy/ natural gas/ pipelines. Individual plays that are not up to their eyeballs in debt are hard to find. So, I like a diversified approach here via the Alerian MLP ETF (AMLP). This ETF gives diversified exposure to the energy pipeline space with 80% of its holdings spread out over 10 positions.

PHOENIXCAPITALRESEARCH.COM
PAGE 8 of 12
Name Symbol % Assets
MPLX LP Partnership Units MPLX 10.23%
Enterprise Products Partners LP EPD 10.05%
Energy Transfer LP ET 10.04%
Western Midstream Partners LP WES 9.85%
Plains All American Pipeline LP PAA 9.79%
Magellan Midstream Partners LP MMP 9.53%
Phillips 66 Partners LP PSXP 6.57%
DCP Midstream LP DCP 6.32%
Shell Midstream Partners LP SHLX 4.21%
Cheniere Energy Partners LP CQP 4.17%
Its price to earnings is 13. Its price to cash flow is even more incredible (less than six). And it yields 7.75% Even better the chart is triggering a “Buy” on the weekly MACD, while shares ripping higher.
PHOENIXCAPITALRESEARCH.COM
PAGE 9 of 12
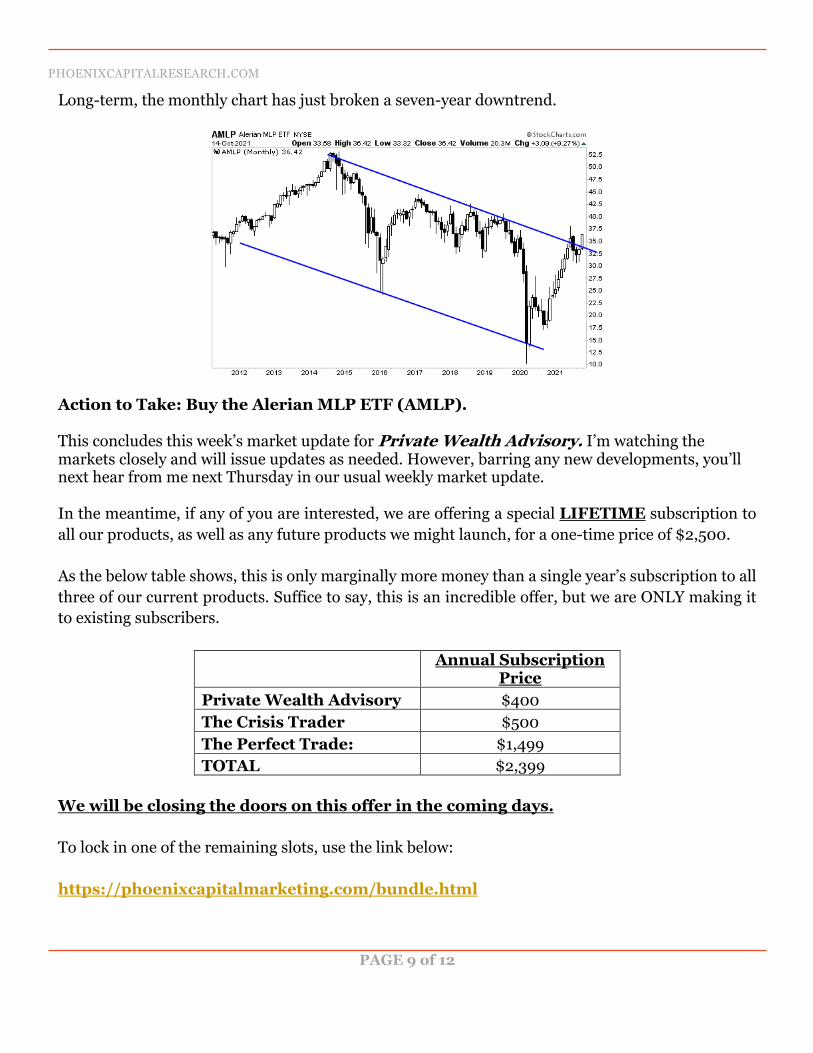
Long-term, the monthly chart has just broken a seven-year downtrend.
Action to Take: Buy the Alerian MLP ETF (AMLP). This concludes this week’s market update for Private Wealth Advisory. I’m watching the markets closely and will issue updates as needed. However, barring any new developments, you’ll next hear from me next Thursday in our usual weekly market update. In the meantime, if any of you are interested, we are offering a special LIFETIME subscription to all our products, as well as any future products we might launch, for a one-time price of $2,500. As the below table shows, this is only marginally more money than a single year’s subscription to all three of our current products. Suffice to say, this is an incredible offer, but we are ONLY making it to existing subscribers.
Annual Subscription
Price Private Wealth Advisory $400 The Crisis Trader $500 The Perfect Trade: $1,499 TOTAL $2,399
We will be closing the doors on this offer in the coming days. To lock in one of the remaining slots, use the link below: https://phoenixcapitalmarketing.com/bundle.html

PHOENIXCAPITALRESEARCH.COM
PAGE 10 of 12
Best

PHOENIXCAPITALRESEARCH.COM
PAGE 11 of 12
OPEN POSITIONS: STOCKS Position Symbol Buy Date Buy Price Current Price Total Return* General Electric GE 2/25/21 $103.52 $102.74 -1% Boeing BA 2/25/21 $223.68 $217.44 -3% Defense ETF ITA 4/8/21 $104.99 $107.39 2% Deere & Co DE 5/5/21 $383.09 $329.77 -14% Boston Scientific BSX 6/24/21 $43.79 $43.25 -1% Steel Dynamics STLD 7/29/21 $64.65 $61.67 -5% Smith & Wesson SWBI 8/5/21 $24.93 $21.57 -13% Comcast CMCSA 8/19/21 $58.96 $53.99 -8% ABIOMED ABMD 9/2/21 $370.43 $345.07 -7%
Cisco CSCO 9/2/21 $59.29 $55.65 -6% Johnson & Johnson JNJ 9/2/21 $174.66 $160.11 -8% Meg Energy MEG.TO 9/16/21 $8.73 $10.75 23% Devon Energy DVN 9/16/21 $30.31 $39.78 31% Okta OKTA 9/29/21 $234.88 $255.53 -8% TradeDesk TTD 9/29/21 $67.96 $77.09 -12% Square SQ 9/29/21 $236.25 $247.41 -5% NexGen Energy NXE 9/30/21 $4.52 $6.14 36% Cenovus Energy CVE 10/7/21 $10.90 $11.74 8% Freeport McMoran FCX 10/14/21 $37.13 NEW BUY Alerian MLP ETF AMLP 10/14/21 $36.42 NEW BUY Prices as of 10/14/21 at market’s close *all results include dividends and special dividends. **GE did an 8 for 1 split.

PHOENIXCAPITALRESEARCH.COM
PAGE 12 of 12
OPEN POSITIONS: Precious Metals Position Symbol Buy Date Buy Price Current Price Total Return*
Newmont Mining NEM 3/26/20 $64.50 $57.77 -10%
Jervois Mining JRVMF 8/6/20 $0.18 $0.41 133%
Wheaton Precious Metals WPM 1/7/21 $45.40 $41.44 -9%
DISCLAIMER. The information contained on this newsletter is for marketing purposes only. Nothing contained in this newsletter is intended to be, nor shall it be construed as, investment advice by Phoenix Capital Research or any of its affiliates, nor is it to be relied upon in making any investment or other decision. Neither the information nor any opinion expressed on this newsletter constitutes and offer to buy or sell any security or instrument or participate in any particular trading strategy. The information in the newsletter is not a complete description of the securities, markets or developments discussed. Information and opinions regarding individual securities do not mean that a security is recommended or suitable for a particular investor. Prior to making any investment decision, you are advised to consult with your broker, investment advisor or other appropriate tax or financial professional to determine the suitability of any investment. Opinions and estimates expressed on this newsletter constitute Phoenix Capital Research's judgment as of the date appearing on the opinion or estimate and are subject to change without notice. This information may not reflect events occurring after the date or time of publication. Phoenix Capital Research is not obligated to continue to offer information or opinions regarding any security, instrument or service. Information has been obtained from sources considered reliable, but its accuracy and completeness are not guaranteed. Phoenix Capital Research and its officers, directors, employees, agents and/or affiliates may have executed, or may in the future execute, transactions in any of the securities or derivatives of any securities discussed on this newsletter. Past performance is not necessarily a guide to future performance and is no guarantee of future results. Securities products are not FDIC insured, are not guaranteed by any bank and involve investment risk, including possible loss of entire value. Phoenix Capital Research, OmniSans Publishing LLC and Graham Summers shall not be responsible or have any liability for investment decisions based upon, or the results obtained from, the information provided. Phoenix Capital Research is not responsible for the content of other newsletters to which this one may be linked and reserves the right to remove such links. OmniSans Publishing LLC and the Phoenix Capital Research Logo are registered trademarks of Phoenix Capital Research. OmniSans Publishing LLC - PO BOX 6487, Charlottesville, VA 22906