october 1966 - slac.stanford.edu · either vertical or horizontal. shaft encoders on the traverse...
TRANSCRIPT

SLAC-PUB-222 October 1966
SLAC ALIGNMETJT SYSTEM*
W.B. Herrmannsfeldt Stanford Linear Accelerator Center
Stanford University, Stanford, California
This paper presents a review of the operat- ing experiences with the laser alignment system of the two-mile linear accelerator. It includes discussions of some of the special alignment techniques used prior to the initial start up of the accelerator.
Description of the Laser System
The laser system consists of a light source, a detector and 299 targets, one of which is located at each point to be aligned. These basic elements are shown schematically in Figure 1.
The light source is a helium-neon gas laser operated as a point source diverging enough to cover the closest target, which requires a spot of about 30 cm diameter at a distance of about 16 meters. The lasers used have been standard commercial models of low power cw lasers operat- ing at 6330 angstroms. With from 3 to 10 mw output, the resulting images are clearly visible to the observer once his eyes have become dark adapted.
The function of the electronic detector is to accurately determine the center of the image. The typical image from one of the targets is shown in Figure 2. The intense spot at the center of the cross is centered on a line from the laser to the center of the target. The center of the image needs to be located to within * 0.02 mm. The detector operates by mechanically differentiating the center spot. The scheme is shown in Figure 3. A variable amplitude eccentric drives the aperture plate through the center of the spot. The scanning amplitude is adjusted to approximately the width of the spot. The signal from the photo- multiplier corresponds to the derivative of the spot at the center of oscillation of the scanner.
The lens behind the aperture plate focuses the modulated light beam to a single spot on the photomultiplier. This avoids errors which might be caused by different sensitivities from differ- ent parts of the photocathode. The tube is mounted off center so that it can be rotated to let the light hit a fresh part of the photo- cathode.
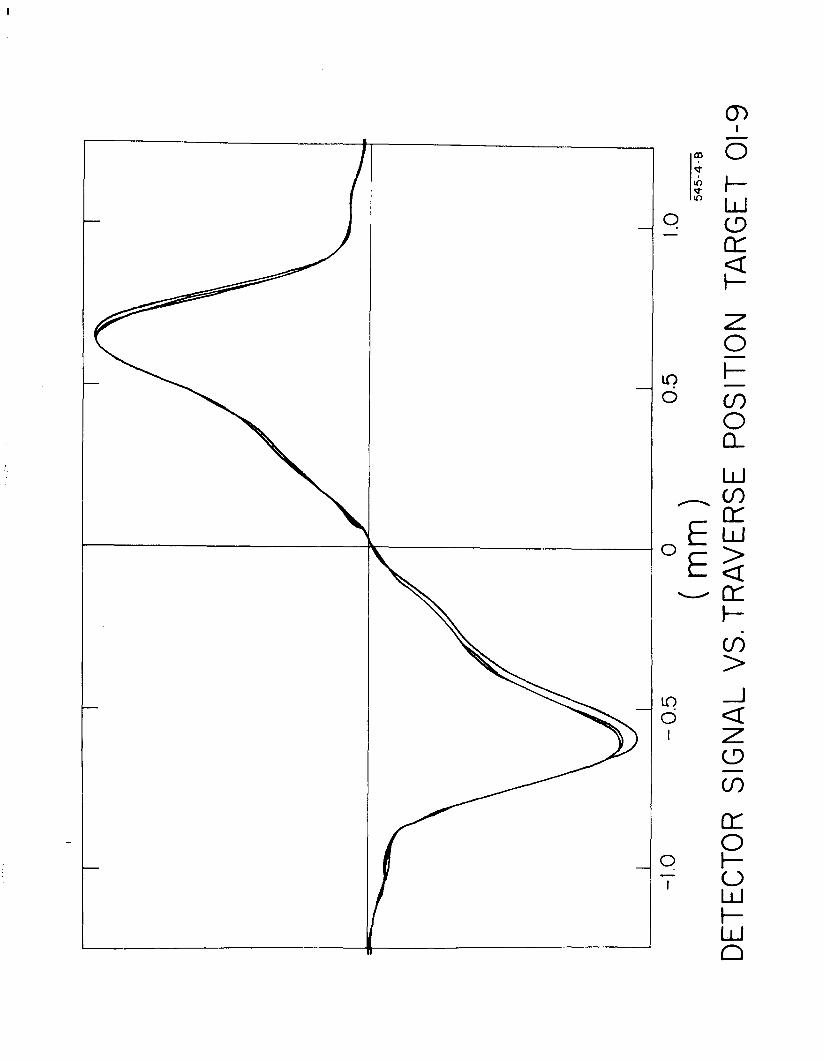
A chart recorder trace of the signal from the detector is shown in Figure 4. The horizon- tal coordinate is the position of the scanner.
* Work supported by the U.S. Atomic Energy Comm.
The scanner may be rotated so that the scan is either vertical or horizontal. Shaft encoders on the traverse mechanism read both coordinates out on counters with a resolution of 0.0025 mm.
The scanner is traversed over the spot until the output signal is zero, indicating that the center of oscillation coincides with the center of the image. A view of the traverse system is shown in Figure 5.
The alignment targets are rectangular Fresnel lenses. A target is made by photore- production of the pattern on a copper sheet. Nickel is then plated on the copper where it is desired to keep an opaque ribbon. Finally the copper is chemically removed frcnn the apertures. Details of theldesign of the target system were given earlier. Each target must focus light from the laser to the detector, so it is necessary that the scale factor be correct for the focal length of that particular target. The spacing of the lines on a target are given by
xn = (hf)l/2(2n + l/2)1/2
where X is the distance from center to the nth ribbon 2nd the * l/2 term gives the outer and inner edges of the nth ribbon, respectively.
The scale factor is the term (hf) 112 where h is the wavelength of the laser source and f is the focal length for the target which is given by
111 -=-+- f r s
where r and s are the distances from the lens to the laser and from the lens to the detector, Since r and s may be interchanged, i.e., the system is reversible, identical lenses may be used in positions equidistant from the middle of the accelerator. By using identical lenses as often as possible, the total number of master patterns required was limited to 122 for the accelerator system which alone has a total of 277 lenses, Another 22 patterns were needed for the beam switchyard extension.
A view of a mounted target is shown in Figure 6. Looking from bottom to top in Figure 6 we see the adjusting jacks connected to the 60 cm diameter light pipe. Within the light pipe we see the F'resnel lens and the wires to the microswitches which indicate whether the
(Presented at 1966 Linear Accelerator Conference, Los Alamos, October 1966)
-l-

lens, or target, is up or down. In the down position, as shown, the target intercepts and focuses the laser beam to the detector at the injector end of the accelerator. On the outer edge of the end plate are two heavy hexagonal pins which will support the downstream end of the next segment. A flat plate with alignment tooling holes is pinned to the top of the end plate. A cover plate for the accelerator pipe is visible directly above the flat plate. Each section of accelerator pipe is 3 meters long. There are four sections mounted on each segment of the support girder, The ends of the four sections are supported by adjustable tooling plates, the first of which is visible further down the girder, Surrounding the accelerator pipe are the degaussing rods used to carry current to cancel the earth's magnetic field. The rectangular waveguide which feeds power into the accelerator segment is shown across the top of the picture. Tne waveguide is connected to the accelerator vacuum manifold at the left side of the picture.
It is necessary to evacuate the light pipe to avoid distortion and translation of the image due to refraction of the light in the atmosphere. A single vacuum pumping station is located at one end of the accelerator to serve the entire light pipe. The pumping system is designed to evacuate the pipe overnight to about 10 torr. Actual performance is slightly better than 10 torr near the pumps with about 25 torr at the detector station two miles away, At operat- ing pressure all the pumping is done by a single 2000 liter/second oil diffusion-ejector pump with a Freon cooled baffle. A pair of 200 liter/ second mechanical rotary oil-sealed pumps are used for roughing.
Installation and Initial Alignment
The segments of the accelerator were assem- bled on stands as shown in Figure 7. Three separate alignment operations were carried out during assembly. First the sections of the accelerator pipe itself were aligned aa mounted to strongbacks. There are about 950 of these sections, each about three meters long. Four sections were then mounted to each segment of the light pipe. The second alignment opera- tion was performed using the telescopes visible at the near end of the pipe in Figure 7. The second step consisted of positioning the nearest section as accurately as possible relative to the support plate to which the target is fasten- ed. The third step consisted of adjusting the positioning screws for the end supports until the four accelerator sections were aligned to each other on a line parallel to the axis of the light pipe.
Several difficulties were encountered in the above operation which are worth reporting. First, the hinge assemblies which support the targets were found to be sensitive to the force required to insert the target. The hinges were
modified after about 20 percent of the installa- tion was complete, but this meant that in those cases in which the hinge had to be replaced by a modified model, the initial position of the target was lost.
Next it was found that temperature stabil- ity in the assembly area was not good enough to permit accurate adjustment of the position of the four accelerator sections on each girder. There are always difficulties in using optical tooling techniques over distances of more than a few meters. This is particularly true of a system which has not come to temperature equili- brium. Refractive effects due to temperature gradients in the air limited the observations to accuracies of from 0.25 to 1.0 mm.
Ihere were also doubts, which were well founded as events turned out, that the align- ment within one segment would remain adequate after the assembly was moved to the accelerator housing and installed. Installation includes connecting the rectangular waveguide which can
put some vertical loading on the girder.
Several times during the assembly process there were difficulties with the tooling jigs which were not found until after a segment had been installed. The problems involved in return- ing a segment to the assembly line were such that in almost all eases the rework was done in the field.
The net results of these and other lesser problems was that a series of setups had to be devised to permit effectively repeating all these operations on the installed accelerator. The largest effort was to determine the dis- placement of the accelerator relative to the target. A ruled ground-glass reticle plate was suspended in a jig from the optical tooling holes at the end of an accelerator segment. In Figure 8 is a view of the jig fixture being installed on a special test and calibration girder. The glass was positioned as close as possible to the target. A light was projected from the other end of the segment against the face of the target. The silhouette of the target thus appeared on the glass plate with the rulings superimposed. A set of five photo- graphs was made of each target with a 35 mm camera and a one-to-one closeup lens. A sample of the one-to-one photography is shown enlarged in Figure 9. When working on the accelerator, the entire operation had to be performed by working through a 7 cm slot between girders. The vacuum bellows were welded in the gap as soon as the photographs were checked. From the first results of the photography system it was apparent that the accuracy with which the targets were located on the accelerator was not as good as it was expected to be. This meant that it was necessary to carry out the photography on every one of the 272 girders. Counting calibration shots and retakes, about 600 sets of pictures were made. The
-2-

I
displacement of the target slot edges from the reticle lines were read on a micrometer micro- scope. Twelve edge readings were made in both the horizontal and vertical directions for each target. The data was analyzed by computer with a program which checked that the data was consis- tent within itself and with the target that was supposed to be installed at that location. It is estimated that the accuracy of determining the target position was about f 0.1 mm. Repeat- ibility was about 5 0.05 mm. No satisfactory explanation was ever found for the failure of the telescope system to yield consistent results. Errors of + 0.5 mm were common for a method which should have been twenty times better.
The accelerator was initially installed along a line determined by conventional survey- ing. Figure 10 shows the observed results when the laser system was first activated. Although the spread in vertical and horizontal alignment is about the same, it is possible to see a pattern in the horizontal alignment while the vertical spread appears random. !The pattern in the horizontal alignment was probably due to errors in locating secondary reference points by sightings from the surveying towers at the ends of the site. The actual placement of girders was made over marks made from these secondary points. The vertical survey used local gravity as a reference and thus was probably better. However, the placement of girders vertically was done with less precision.
The process of aligning the accelerator with the laser system requires that a two-man team actually work along the accelerator while in communication with an operator in the alignment observation room. The alignment of the accelera- tor is dependent on keeping the support girder level in the transverse direction. A precision bubble level is placed between the optical tooling holes (see Figure 6) so that the differ- ential extension of the two floor jacks can be equalized. The alignment procedure is as follows: The operator in the observation room observes and records the position of the laser image. By referring to a table of coordinates he then sets his detector to the correct position and directs the alignment team to level the girder. Then he instructs the team to adjust the position of the girder until the detector reads a null signal. When the girder is set in both translation and elevation the level is rechecked. The procedure requires about 15 minutes per station and is accurate to 0.025 mm. A record of how far the girder was moved is obtained by using the initial readings in a computer program to determine the alignment error at the point in question. The amount moved is recorded and is equal and opposite to the calculated error.
The alignment results from the first use of the system were checked by stretching a wire through the tooling holes on each set of three
girders. Thus if a gross error was made in determining the correction factor on one target it showed in a displacement of that girder relative to its neighbors. The wire is observed both vertically and horizontally by a system which is based on detecting the magnetic field from a 1090 Hz current which is passed through the wire, Modified stereo tape recorder heads are used as pickups for the alternating magnetic field. When the signal is exactly balanced between opposite heads the discriminator reads a null signal. Figure 11 shows the detector assembly with the micrometer screws used to position the heads. The head fits into an optical tooling hole and by means of a cam wheel, expands until it is centered in the hole. The total span of the wire is from 20 to 30 meters. Ike wire is tensioned by a weight over a pulley, A sufficiently high tension is used so that the catenary sag is of the order of 1 mm.
The four accelerator sections on each seg- ment were realigned after all the above opera- tions were complete, By this time the accelera- tor was at its normal operating temperature of 45°C and all waveguides, vacuum manifolds and water lines were connected. The forces from these loads cause some sag in the girder. This
alignment operation could have been done best using the stretched wire method but it was faster to use a pair of conventional alignment telescopes, one on each side of the girder. The telescopes mount in the optical tooling holes at the target end of a girder and are bucked into targets in the corresponding holes in the next girder. The targets are then inserted one at a time on each side in the holes on each section and indicated adjustments are made. When a girder has been raised or lowered more than 2.5 mm it will be necessary to recheck the alignment or alternatively, to adjust the waveguide loads from above in the klystron gallery.
Stability
Information about long term stability is obtained by referring to four monuments which are located along the accelerator. Three of the monuments have targets just like the accel- erator targets but independent of the accelera- tor. Ihe fourth monument is used as the base for the detector. Alignment data taken at any time can be calculated with reference to the straight line determined by any two points along the accelerator. Whenever a pair of the monuments are chosen for this purpose then the results give the total shift since the initial alignment.
For the period of operation since April 1966, an alignment check showed. some areas haa settled by up to 1.7 mm. The results of this survey are shown in Figure 12. The largest settlements occured in areas constructed over filled ground. Ike correspondence with settlement and fill is quite striking. The
-3-
implication is that those parts of the accelera- tor which were built directly on subsurface rock would be quite stable. Fortunately the more critical areas of the beam switchyard and the end stations are all built directly on the underlying sandstone.
Ike proximity of the San Andreas fault is often referred to. Tne fault lies about a kilometer to the west of the accelerator and runs normal to the accelerator. It is too early to tell what effect the presence of the fault may have on the accelerator. There were several very light earth tremblers in Northern California in the past few months. No one in the accelera- tor housing has reported feeling them, however, and beam operation has not been affected. We have not been able to ascribe any motion to the seismic phenomena.
Acknowledgements
The original conception and formulation of the laser system was made by Dr. Kenneth R. Trigger. The design of the scanner and much of the early development of the entire scheme was made by Joe Spranza. Ray Sanakuhle and Dennis Connell were responsible for much of the mechanical design and Rsy Larsen developed the detector electronics. The target calibration system was developed by Oliver Turpen. The calibration photography was done by Jack Higgins and the data reduction was done by Pamela Borges and Margaret Starmer. The contributions of these individuals and the many others who assis- ted them is gratefully acknowledged.
List of References
1. W.B. Herrmannsfeldt, "Linac Alignment Techniques", IED Particle Accelerator Confer- ence, Washington, D.C., March 10-12, 1965. Reprints are available as SLAC PUB-82.
2. SLAC m-65-74, Part I, W.K.H. Panofsky, "The Use of a Magnetic Pickup as an Alignment Indicator with a Stretched-Wire Technique", Part II, W.F. Marshall, "Proposed Systems and Circuits for Magnetic Alignment Pickups", September 1965.
-4-

LIST OF FIGURES
1. Schematic diagram of the laser alignment system.
2. A typical image from the laser targets.
3. Detector with scanner and photomultiplier.
4. Output trace from differentiating scanner.
5. Traverse system at the end of the light pipe.
6. End view of an accelerator segment during installation.
7. Assembly line showing alignment telescope stand.
8. Ground glass screen and jig installed on test girder.
9. lW.larged view of center of target with ground glass screen.
10. Alignment observed after initial installation.
11. Magnetic wire position detector assembly.
12. Alignment shift since April 20, 1966.

T m
--w
,J
\ /
I I
I L
\
-a
1 \
. D
L -
LASE
R
-TAR
GET
TY
PIC
AL
) M
-M
ON
UM
ENT
TAR
GET
D
- D
ETEC
TOR
M I I
I I
233-
5-A
FIG
. I
- TH
E AL
IGN
MEN
T SY
STEM
, SC
HEM
ATIC
D
IAG
RAM


kAR
lABL
E SC
AN
AMPL
ITU
DE
ADJU
STM
ENT
ALIG
NM
ENT
BEAM
SC
ANN
ER
0
(mm
)
0.5
I .o 54
5-4-
0
DET
ECTO
R
SIG
NAL
VS
. TR
AVER
SE
POSI
TIO
N
TAR
GET
01
-9


X
-0.35 r -0.40
HORIZOAKAL 3-5-66 ..‘...
Vi si%7Z)f? 1 2 3 4 5 6 7 8 9 lo 11 12 13 14 15 16 17 18 19 20 21 22 23 24 25 26 27 28 2930
*.. . -
-0.20
.- . . .
* . .- -0.25 - I - . . . . .
-0.30
’ -0.35 - VERTICAL 3 -5-66 -0.40. ’ I I I I I I I I I I I I I I I I I _
5,7-,-c


HORIZONTAL VERTICAL RELATIVE TO RELATIVE
MONUMENTS TO MONUMENTS I
os 1 y (mm>
6 0 I I I I a I
P
x(mm> -