october 2013 memorandum exe item 02 - information ... · web viewplanner test ste item google...
TRANSCRIPT

California Department of EducationExecutive OfficeSBE-002 (REV. 01/2011)
memo-exe-oct13item02
MEMORANDUM
DATE: September 19, 2013
TO: MEMBERS, State Board of Education
FROM: TOM TORLAKSON, State Superintendent of Public Instruction
SUBJECT: Superintendent’s Common Core Systems Implementation Survey Report: Summary Report for Spring 2013 Administration and Comparison of Fall 2012 and Spring 2013 Administrations
Summary of Key Issues
In May 2013, State Superintendent of Public Instruction (SSPI) Tom Torlakson invited each of California’s local educational agencies (LEAs) to participate in a survey designed to gather information regarding the progress of Common Core State Standards (CCSS) systems implementation across the state. The SSPI intends to invite LEAs to participate in this survey twice each year to inform statewide implementation efforts. The survey was first administered in fall 2012. A copy of the survey questions is available for review on the CDE CCSS Implementation Survey Web page at http://www.cde.ca.gov/re/cc/ccsssurvey.asp .
The CDE has collated survey responses and used aggregate data to develop a brief summary of the status of implementation among respondents. This summary report is provided in Attachment 1.
This is not a scientific survey. Although every LEA in California was invited to participate, respondents self-selected and therefore do not necessarily represent the demographics of the state. Further, much of the information provided by respondents is subjective. As such, the survey results do not provide us with definitive information. However, the survey results do give us some information about how the LEAs that chose to respond are progressing with CCSS implementation.
Three hundred eighty-nine LEAs responded to the survey, reflecting a response rate of approximately 20 percent. LEAs responding serve a total of 2,678,924 students out of a total state enrollment of 6,226,989 or 43 percent of the statewide student population.
One hundred thirty of the 389 LEAs who participated in the spring 2013 administration also participated last fall. These 130 LEAs serve 1,043,834 students, or 17 percent of the statewide student population.
Part I of the report provides a summary of the spring administration of the survey. Part II provides a comparison of responses of the 130 LEAs that participated in both the fall 2012 and spring 2013 survey administrations.

memo-exe-oct13item02Page 2 of 2
Attachment(s)
Attachment 1: Superintendent’s Common Core State Standards Systems Implementation Survey: Spring 2013 (28 Pages)
5/9/2023 1:29 PM
memo-exe-oct13item02Attachment 1Page 1 of 28
SUPERINTENDENT’S COMMON CORE STATE STANDARDS SYSTEMS IMPLEMENTATION SURVEY: SPRING 2013
In May 2013, State Superintendent of Public Instruction (SSPI) Tom Torlakson invited each of California’s local educational agencies (LEAs) to participate in a survey designed to gather information regarding the progress of Common Core State Standards (CCSS) systems implementation across the state.
It is important to bear in mind that this is not a scientific survey. Although every LEA in California was invited to participate, respondents self-selected and therefore do not necessarily represent the demographics of the state. Further, much of the information provided by respondents is subjective. As such, the survey results do not provide us with definitive information. However, the survey results do give us some information about how the LEAs that chose to respond are progressing with CCSS implementation.
The survey window opened May 6, 2013, with an e-mail message from the SSPI to 1,824 district superintendents and independent charter school administrators. The survey closed May 23, 2013, with a total of 389 responses. This reflects a response rate of approximately 20 percent. LEAs responding represent a total of 2,678,924 students out of a total state enrollment of 6,226,989 or 43 percent of the statewide student population.
Survey questions were aligned to the seven guiding strategies outlined in the Common Core State Standards Systems Implementation Plan for California:
1. Facilitate high quality professional learning opportunities for educators to ensure that every student has access to teachers who are prepared to teach to the levels of rigor and depth required by the CCSS.
2. Provide CCSS-aligned instructional resources designed to meet the diverse needs of all students.
3. Develop and transition to CCSS-aligned assessment systems to inform instruction, establish priorities for professional learning, and provide tools for accountability.
4. Collaborate with parents, guardians, and the early childhood and expanded learning communities to integrate the CCSS into programs and activities beyond the K–12 school setting.
5. Collaborate with the postsecondary and business communities and additional stakeholders to ensure that all students are prepared for success in career and college.
6. Seek, create, and disseminate resources to support stakeholders as CCSS systems implementation moves forward.
5/9/2023 1:29 PM

memo-exe-oct13item02Attachment 1Page 2 of 28
7. Design and establish systems of effective communication among stakeholders to continuously identify areas of need and disseminate information.
Results were disaggregated by the following LEA characteristics:
District type: elementary, high, unified Size: small (<1,001), medium (1,001–10,000), large (>10,000) District vs. Charter Title I funded: yes, no Significant (25 percent or more) English learner population: yes, no
In general, responses were relatively consistent across these disaggregated groups, with most differences noted among districts of different sizes.
The SSPI intends to invite LEAs to participate in this survey twice each year to track statewide CCSS systems implementation progress and inform the implementation efforts of the California Department of Education (CDE). The survey was first administered in fall 2012. One hundred thirty of the 389 LEAs who participated in the spring 2013 administration also participated last fall. These 130 LEAs serve 1,043,834 students, or 17 percent of the statewide student population.
Part I of this report provides a summary of the spring administration of the survey. Part II provides a comparison of responses of the 130 LEAs that participated in both the fall 2012 and spring 2013 survey administrations.
5/9/2023 1:29 PM

memo-exe-oct13item02Attachment 1Page 3 of 28
Part I: Summary Report for Spring 2013 Administration
General Implementation Questions
Full implementation of CCSS systems will occur over several years and in the context of a continuous learning process.
The Awareness Phase represents an introduction to the CCSS, the initial planning of systems implementation, and establishment of collaborations.
The Transition Phase is the concentration on building foundational resources, implementing needs assessments, establishing new professional learning opportunities, and expanding collaborations between all stakeholders.
The Implementation Phase expands the new professional learning support, fully aligns curriculum, instruction, and assessments, and effectively integrates these elements across the field.
G-1 Based on these descriptions, which phase best describes your district’s current level of CCSS implementation?
District Size
Response Overall Small (<1,001)
Medium (1,001–10,000)
Large (>10,000)
# % # % # % # %Awareness 115 30% 71 39% 31 21% 13 21%Transition 249 64% 99 55% 105 72% 45 71%Implementation 22 6% 9 5% 8 6% 5 8%Other 3 1% 2 1% 1 1% 0 0%Total 389 100% 181 100% 145 100% 63 100%
(# = Number of Respondents, % = Percent of Total Respondents)
Overall, most respondents report that they are in the transition phase of implementation. Seventy-nine percent of large LEAs and 78 percent of medium LEAs report having moved beyond awareness compared to 60 percent of small LEAs.

Part I: Summary Report for Spring 2013 Administration memo-exe-oct13item02Attachment 1Page 4 of 28
G-2 Overall, how knowledgeable are teachers in your district regarding the CCSS?
Response Number of Respondents
Percent of Total
Slightly 74 19%Somewhat 264 68%Very 48 12%No Response 3 1%Total 389 100%
Respondents report that most teachers are somewhat knowledgeable regarding the CCSS.
G-3 Overall, how knowledgeable are site administrators in your district regarding the CCSS?
Response Number of Respondents
Percent of Total
Slightly 36 9%Somewhat 235 60%Very 115 30%No Response 3 1%Total 389 100%
Similarly, most site administrators are somewhat knowledgeable regarding the CCSS.
In general, LEAs report that site administrators have more knowledge about the CCSS than teachers reporting that 80 percent of teachers are somewhat or very knowledgeable while 90 percent of administrators are somewhat or very knowledgeable.
5/9/2023 1:29 PM

Part I: Summary Report for Spring 2013 Administration memo-exe-oct13item02Attachment 1Page 5 of 28
5/9/2023 1:29 PM

Part I: Summary Report for Spring 2013 Administration memo-exe-oct13item02Attachment 1Page 6 of 28
Questions Related to the CCSS Systems Implementation Plan Strategies
Strategy 1: Facilitate high quality professional learning opportunities for educators to ensure that every student has access to teachers who are prepared to teach to the levels of rigor and depth required by the CCSS.
1-1 To what extent has your district provided professional learning opportunities for teachers related to the CCSS?
District Size
Response Overall Small(<1,001)
Medium(1,001–10,000)
Large(>10,000) Charters
# % # % # % # % # %Not Yet Offered 14 4% 13 7% 1 1% 0 0% 10 10%Offered Limited 89 23% 48 27% 34 23% 7 11% 28 27%Offered Some 222 57% 99 55% 82 57% 41 65% 56 53%Offered Extensive 60 15% 20 11% 26 18% 14 22% 11 10%No Response 4 1% 1 1% 1 1% 1 2% 0 0%Total 389 100% 181 100% 144 99% 63 100% 105 100%
(# = Number of Respondents, % = Percent of Total Respondents)
Most LEAs have offered some type of professional learning for teachers related to the CCSS, with 72 percent reporting that they have offered some or extensive opportunities.
Eighty-seven percent of large LEAs, 75 percent of medium LEAs, and 66 percent of small LEAs report that they have offered some or extensive professional learning opportunities (PLOs) for teachers. Sixty-three percent of charter schools report having offered some or extensive opportunities.
5/9/2023 1:29 PM

Part I: Summary Report for Spring 2013 Administration memo-exe-oct13item02Attachment 1Page 7 of 28
1-2 What types of professional learning opportunities are being provided to teachers in your district? Check all that apply.
District Size
Response Overall Small(<1,001)
Medium(1,001–10,000)
Large(>10,000)
# % # % # % # %CDE Professional Learning Modules 54 14% 21 12% 20 14% 13 21%County Office Developed Toolkits 231 59% 99 55% 99 68% 33 52%District-Developed Materials 178 46% 41 23% 98 68% 53 84%School Site-Developed Materials 153 39% 70 39% 93 64% 29 46%District-Wide Trainings 217 56% 62 34% 77 53% 57 90%Site-Level Trainings 233 60% 90 50% 28 19% 50 79%CCSS Integrated Into Existing Professional Learning Communities 183 47% 66 36% 23 16% 40 63%
Online Trainings 69 18% 31 17% 28 19% 10 16%Other 53 14% 26 14% 23 16% 4 6%
(# = Number of Respondents, % = Percent of Total Respondents)
Overall, 56 percent of respondents indicate that they are utilizing district-wide PLOs for teachers. However, large LEAs are well above this average, with 90 percent reporting the use of district-wide trainings. Fifty percent of small LEAs are utilizing district-wide trainings. Similarly, 46 percent of respondents report using district-developed materials while 84 percent of large LEAs report using district-developed materials and 23 percent of small LEAs report the same. Other PLOs include trainings provided by county offices of education and private providers, conference attendance, and collaboration with institutions of higher education.
1-3 To what extent has your district provided professional learning opportunities for site administrators related to the CCSS?
District Size
Response Overall Small(<1,001)
Medium(1,001–10,000)
Large(>10,000)
# % # % # % # %Not yet offered 28 7% 25 14% 2 1% 1 2%Offered Limited 75 19% 42 23% 25 17% 8 13%Offered Some 204 52% 92 51% 81 56% 31 49%Offered Extensive 76 20% 20 11% 34 23% 22 35%No Response 6 2% 2 1% 3 12% 1 1%Total 389 100% 181 100% 145 100% 63 100%
Seventy-two percent of respondents have offered some or extensive CCSS PLOs for site administrators. Eighty-four percent of large LEAs report providing some or extensive PLOs for administrators while 62 percent of small LEAs report the same.
5/9/2023 1:29 PM

Part I: Summary Report for Spring 2013 Administration memo-exe-oct13item02Attachment 1Page 8 of 28
1-4 What types of professional learning opportunities are being offered to site administrators in your district? Check all that apply.
District Size
Response Overall Small(<1,001)
Medium(1,001–10,000)
Large(>10,000)
# % # % # % # %CDE Professional Learning Modules 68 17% 29 16% 25 17% 14 22%County Office Developed Toolkits 244 63% 107 59% 104 72% 33 52%District-Developed Materials 163 42% 34 19% 80 55% 49 78%School Site-Developed Materials 95 24% 40 22% 38 26% 17 27%District-Wide Trainings 199 51% 45 25% 98 68% 56 89%Site-Level Trainings 125 32% 53 29% 51 35% 21 33%CCSS Integrated Into Existing Professional Learning Communities 158 41% 52 29% 69 48% 37 59%
Online Trainings 78 20% 36 20% 33 23% 9 14%Other 54 14% 20 11% 24 17% 10 16%
(# = Number of Respondents, % = Percent of Total Respondents)
Sixty-three percent of respondents report using the county office of education-developed toolkits for CCSS professional learning for administrators. As with teachers, more large LEAs report using district-developed materials (78 percent) and district-wide trainings (89 percent) than do small LEAs (19 percent and 25 percent, respectively). Other PLOs include conference attendance, trainings provided by county offices of education and private providers, and collaboration with institutions of higher education.
5/9/2023 1:29 PM

Part I: Summary Report for Spring 2013 Administration memo-exe-oct13item02Attachment 1Page 9 of 28
Strategy 2: Provide CCSS-aligned instructional resources designed to meet the diverse needs of all students.
2-1 To what extent are CCSS-aligned materials being used in classroom instruction?
Response Number of Respondents
Percent of Total
Not Yet Used 110 28%Few Classrooms 169 43%Most Classrooms 73 19%Every Classroom 28 7%No Response 9 2%Total 389 100%
Most respondents (43 percent) report that CCSS-aligned materials are being used in a few classrooms. Twenty-eight percent of respondents report that CCSS-aligned materials are not yet being used.
2-2 What types of CCSS-aligned materials are you using? Check all that apply.
Response Number of Respondents
Percent of Total
Teacher Developed 224 58%Open Educational 161 41%Free Supplemental Materials Provided by the Publishers of Current Programs 121 31%Purchased Supplemental Materials Provided by Publishers of Current Program 71 18%Free Supplemental Materials Provided by a Publisher Not Directly Affiliated With Current Program 71 18%Purchased Supplemental Materials Provided by a Publisher Not Directly Affiliated With Current Program 49 13%Other 30 8%
Those LEAs that report using CCSS-aligned materials are using mostly teacher developed materials, open educational resources, or free supplemental materials.
5/9/2023 1:29 PM

Part I: Summary Report for Spring 2013 Administration memo-exe-oct13item02Attachment 1
Page 10 of 28
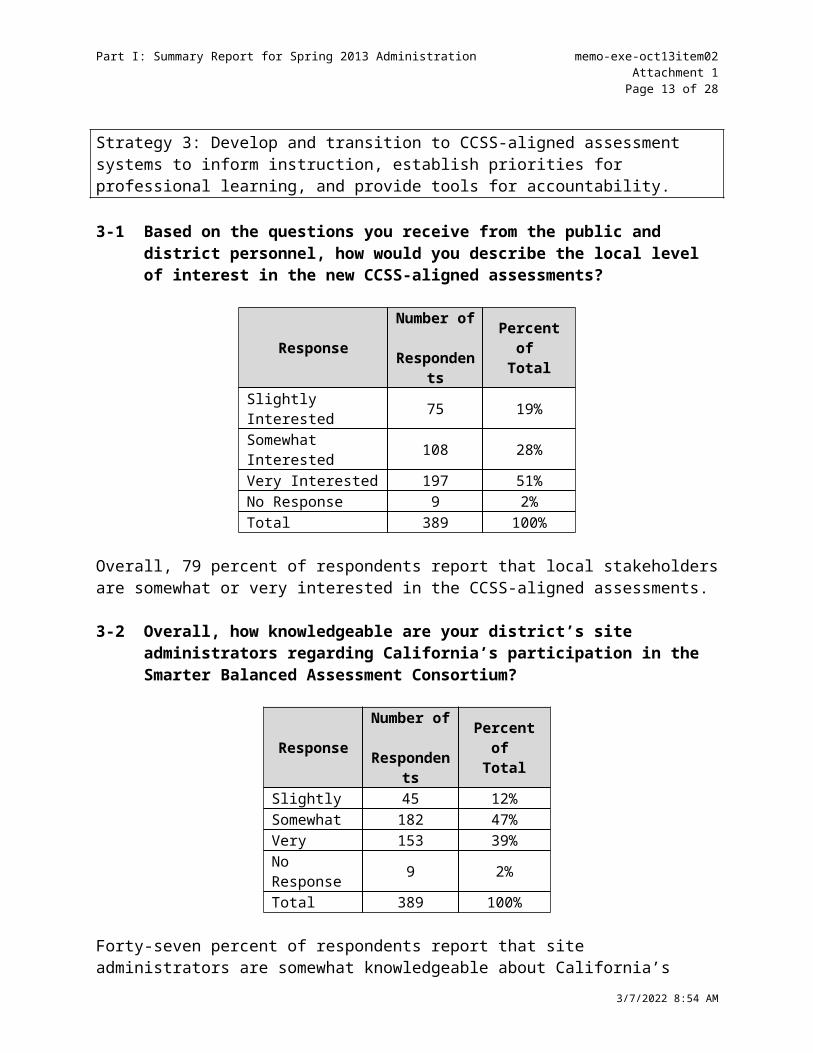
Strategy 3: Develop and transition to CCSS-aligned assessment systems to inform instruction, establish priorities for professional learning, and provide tools for accountability.
3-1 Based on the questions you receive from the public and district personnel, how would you describe the local level of interest in the new CCSS-aligned assessments?
Response Number of Respondents
Percent of Total
Slightly Interested 75 19%Somewhat Interested 108 28%Very Interested 197 51%No Response 9 2%Total 389 100%
Overall, 79 percent of respondents report that local stakeholders are somewhat or very interested in the CCSS-aligned assessments.
3-2 Overall, how knowledgeable are your district’s site administrators regarding California’s participation in the Smarter Balanced Assessment Consortium?
Response Number of Respondents
Percent of Total
Slightly 45 12%Somewhat 182 47%Very 153 39%No Response 9 2%Total 389 100%
Forty-seven percent of respondents report that site administrators are somewhat knowledgeable about California’s participation in the Smarter Balanced Assessment Consortium (Smarter Balanced), with another 39 percent of respondents describing their administrators as being very knowledgeable.
5/9/2023 1:29 PM

Part I: Summary Report for Spring 2013 Administration memo-exe-oct13item02Attachment 1
Page 11 of 28
3-3 Overall, how knowledgeable are your district’s teachers regarding California’s participation in the Smarter Balanced Assessment Consortium?
Response Number of Respondents
Percent of Total
Slightly 84 22%Somewhat 233 60%Very 63 16%No Response 9 2%Total 389 100%
Sixty percent of respondents report that teachers are somewhat knowledgeable about California’s participation in Smarter Balanced, with another sixteen percent of respondents describing their teachers as being very knowledgeable.
Overall, administrators are more knowledgeable regarding California’s participation in Smarter Balanced than teachers. Eighty-six percent report that their administrators are somewhat or very knowledgeable. Seventy-six percent report that their teachers are somewhat or very knowledgeable.
5/9/2023 1:29 PM

Part I: Summary Report for Spring 2013 Administration memo-exe-oct13item02Attachment 1
Page 12 of 28
Strategy 4: Collaborate with parents, guardians and the early childhood and expanded learning communities to integrate the CCSS into programs and activities beyond the K–12 school setting.
4-1 Have teachers and/or staff providing pre-kindergarten or transitional kindergarten programs been engaged in professional learning opportunities designed to support student attainment of the CCSS?
Response Number of Respondents
Percent of Total
No 50 13%Yes 232 60%N/A 89 23%No response 18 5%Total 389 100%
Sixty percent of respondents report that teachers and/or staff in pre-kindergarten and transitional kindergarten programs have been involved in CCSS-related PLOs.
4-2 Have teachers and/or staff providing expanded learning/after school programs been engaged in professional learning opportunities designed to support student attainment of the CCSS?
Response Number of Respondents
Percent of Total
No 156 40%Yes 115 30%N/A 100 26%No response 18 5%Total 389 100%
Thirty percent of respondents report that teachers and/or staff in expanded learning/after school programs have been involved in CCSS-related PLOs.
5/9/2023 1:29 PM

Part I: Summary Report for Spring 2013 Administration memo-exe-oct13item02Attachment 1
Page 13 of 28
4-3 To what extent have you provided information about the CCSS to parents?
Response Number of Respondents
Percent of Total
Not yet shared 43 11%Shared Limited 196 50%Shared Some 130 33%Shared Extensive 11 3%No Response 9 2%Total 389 100%
Fifty percent of respondents report they have shared limited CCSS-related information and an additional 11 percent report they have not yet shared any information with parents.
4-4 How are you communicating with parents about the CCSS? Check all that apply.
Response Number of Respondents
Percent of Total
Back-to School 189 49%School Events 203 52%PTA/PTSO Meetings 164 42%Newsletters 240 62%Letters to the editor 5 1%News Releases 45 12%Other 109 28%
Respondents who have shared information with parents report using newsletters and school events (e.g., back-to-school, Parent Teacher Association/Parent Teacher Student Organization [PTA/PTSO] meetings) to communicate about the CCSS. Other strategies used to communicate with parents include Web sites, parent conferences, and various additional meetings (e.g., school board meetings, School Site Council meetings, English Learner Advisory Committee meetings).
5/9/2023 1:29 PM
Part I: Summary Report for Spring 2013 Administration memo-exe-oct13item02Attachment 1
Page 14 of 28
Strategy 5: Collaborate with the postsecondary and business communities to ensure that all students are prepared for success in career and college.
5-1 How often do district personnel engage local institutions of higher education in discussions regarding career and college readiness as related to the CCSS?
Response Number of Respondents
Percent of Total
Not Yet Engaged 189 49%Occasionally 137 35%Frequently 35 9%N/A 1 0%No Response 27 7%Total 389 100%
Forty-nine percent of respondents report they have not yet engaged with local institutions of higher education.
5-2 To what extent have district personnel engaged local businesses/business organizations in discussions regarding career readiness as related to the CCSS?
Response Number of Respondents
Percent of Total
Not yet engaged 280 72%Occasionally 96 25%Frequently 4 1%No Response 9 2%Total 389 100%
Seventy-two percent of respondents report they have not yet engaged with businesses.
5-3 Based on your discussions, how supportive of CCSS implementation are local businesses and business organizations?
Response Number of Respondents
Percent of Total
Slightly 9 2%Somewhat 51 13%Very 40 10%No Response 289 74%Total 389 100%
Most respondents did not answer this question.
5/9/2023 1:29 PM

Part I: Summary Report for Spring 2013 Administration memo-exe-oct13item02Attachment 1
Page 15 of 28
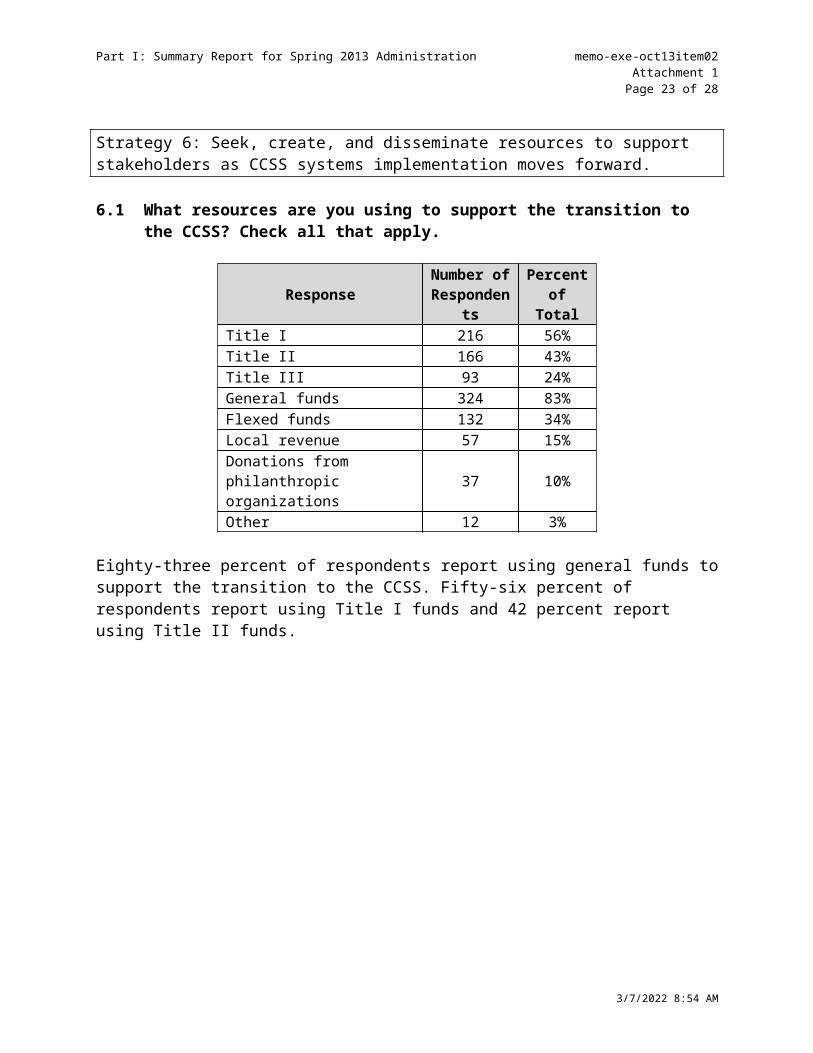
Strategy 6: Seek, create, and disseminate resources to support stakeholders as CCSS systems implementation moves forward.
6.1 What resources are you using to support the transition to the CCSS? Check all that apply.
Response Number of Respondents
Percent of Total
Title I 216 56%Title II 166 43%Title III 93 24%General funds 324 83%Flexed funds 132 34%Local revenue 57 15%Donations from philanthropic organizations 37 10%
Other 12 3%
Eighty-three percent of respondents report using general funds to support the transition to the CCSS. Fifty-six percent of respondents report using Title I funds and 42 percent report using Title II funds.
5/9/2023 1:29 PM

Part I: Summary Report for Spring 2013 Administration memo-exe-oct13item02Attachment 1
Page 16 of 28
Strategy 7: Design and establish systems of effective communication among stakeholders to continuously identify areas of need and disseminate information.
7-1 How familiar are you with the CCSS Systems Implementation Plan for California?
Response Number of Respondents
Percent of Total
Not Familiar 80 21%Somewhat 202 52%Very Familiar 98 25%No Response 9 2%Total 389 100%
Seventy-seven percent of respondents are somewhat or very familiar with the CCSS Systems Implementation Plan for California.
7-2 Has your district developed a plan for implementing the CCSS?
District Size
Response Overall Small (<1,001)
Medium (1,001–10,000)
Large (>10,000)
# % # % # % # %Not Yet Started 32 8% 25 14% 7 5% 0 0%In Process 246 63% 134 74% 85 59% 27 43%Fully Developed 102 26% 18 10% 50 34% 34 54%No Response 9 2% 4 2% 3 2% 2 3%Total 389 100% 181 100% 145 100% 63 100%
(# = Number of Respondents, % = Percent of Total Respondents)
Overall, 63 percent of respondents report they are in the process of developing an implementation plan, and 26 percent of LEAs report they have a fully developed plan. Eight percent of LEAs have not yet started to develop a plan. Ninety-seven percent of respondents from large LEAs report they are either in the process of developing or have a fully developed plan, compared to 93 percent of medium and 84 percent of small LEAs.
5/9/2023 1:29 PM

Part I: Summary Report for Spring 2013 Administration memo-exe-oct13item02Attachment 1
Page 17 of 28
7-3 What strategies are you using to communicate with your district stakeholders about your CCSS implementation plan? Check all that apply.
Response Number of Respondents
Percent of Total
Staff Meetings 99 25%School Site Council Meetings 70 18%PTA/PTSO Meetings 55 14%Newsletters 71 18%Webinars 4 1%Local School Board Meetings 80 21%Letters to the Editor 4 1%News Releases 21 5%Other 21 5%
LEAs that responded to this question report utilizing a number of different strategies to communicate with local stakeholders regarding their implementation plans.
5/9/2023 1:29 PM

memo-exe-oct13item02Attachment 1
Page 18 of 28
Part II: Comparison of Fall 2012 and Spring 2013 Administrations
The Superintendent’s Common Core State Standards Systems Implementation Survey was first administered in fall 2012. One hundred thirty LEAs participated in both the fall 2012 and spring 2013 administrations. These 130 LEAs serve 1,043,834 students, or approximately 17 percent of the statewide student population. The following results have not been disaggregated by LEA characteristics.
General Implementation Questions
Full implementation of CCSS systems will occur over several years and in the context of a continuous learning process.
The Awareness Phase represents an introduction to the CCSS, the initial planning of systems implementation, and establishment of collaborations.
The Transition Phase is the concentration on building foundational resources, implementing needs assessments, establishing new professional learning opportunities, and expanding collaborations between all stakeholders.
The Implementation Phase expands the new professional learning support, fully aligns curriculum, instruction, and assessments, and effectively integrates these elements across the field.
G-1 Based on these descriptions, which phase best describes your district’s current level of CCSS implementation?
Fall Spring ChangeResponse # % # % # %
Awareness 61 47% 34 26% -27 -21%Transition 61 47% 86 66% 25 19%Implementation 7 5% 10 8% 3 2%Other 1 1% 0 0 -1 -1%
(# = Number of Respondents, % = Percent of Total Respondents)
G-2 Overall, how knowledgeable are teachers in your district regarding the CCSS?
Fall Spring ChangeResponse # % # % # %
Slightly 47 36% 25 19% -22 -17%Somewhat 72 55% 88 68% 16 12%Very 11 9% 17 13% 6 5%
(# = Number of Respondents, % = Percent of Total Respondents)
Part II: Comparison of Fall 2012 and Spring 2013 Administrations memo-exe-oct13item02Attachment 1
Page 19 of 28
G-3 Overall, how knowledgeable are site administrators in your district regarding the CCSS?
Fall Spring ChangeResponse # % # % # %
Slightly 16 12% 12 9% -4 -3%Somewhat 78 60% 79 61% 1 1%Very 36 28% 39 30% 3 2%
(# = Number of Respondents, % = Percent of Total Respondents)
There has been a decrease in the number of LEAs that report they are in the awareness phase and an increase in the number of LEAs in the transition phase of CCSS systems implementation. In the fall 2012 administration of the survey, respondents reported that 64 percent of teachers were somewhat or very knowledgeable regarding the CCSS compared to 81 percent in the spring.
5/9/2023 1:29 PM

Part II: Comparison of Fall 2012 and Spring 2013 Administrations memo-exe-oct13item02Attachment 1
Page 20 of 28
Questions Related to the CCSS Systems Implementation Plan Strategies
Strategy 1: Facilitate high quality professional learning opportunities for educators to ensure that every student has access to teachers who are prepared to teach to the levels of rigor and depth required by the CCSS.
1-1 To what extent has your district provided professional learning opportunities for teachers related to the CCSS?
Fall Spring ChangeResponse # % # % # %
Not Yet Offered 6 5% 5 4% -1 -1%Offered Limited 40 31% 24 19% -16 -12%Offered Some 69 53% 77 59% 8 6%Offered Extensive 15 12% 23 18% 8 6%No Response 0 0.0 1 1% 1 1%(# = Number of Respondents, % = Percent of Total Respondents)
1-2 What types of professional learning opportunities are being provided to teachers in your district? Check all that apply.
Fall Spring ChangeResponse # % # % # %
CDE professional learning modules 15 12% 18 14% 3 2%County office-developed toolkits 78 60% 80 62% 2 2%District-developed materials 67 52% 71 55% 4 3%School site-developed materials 42 32% 56 43% 14 11%District-wide trainings 79 61% 87 67% 8 6%Site-level trainings 70 54% 79 61% 9 7%CCSS integrated into existing professional learning communities 63 49% 71 55% 8 6%
Online trainings 23 18% 20 15% -3 -2%Other 18 14% 17 13% -1 -1%
(# = Number of Respondents, % = Percent of Total Respondents)
5/9/2023 1:29 PM

Part II: Comparison of Fall 2012 and Spring 2013 Administrations memo-exe-oct13item02Attachment 1
Page 21 of 28
1-5 To what extent has your district provided professional learning opportunities for site administrators related to the CCSS?
Fall Spring ChangeResponse # % # % # %
Not Yet Offered 5 4% 8 6% 3 2%Offered Extensive 19 15% 35 27% 16 12%Offered Limited 30 23% 21 16% -9 -7%Offered Some 76 59% 63 49% -13 -10%No Response 0 0% 3 2% 3 2%
(# = Number of Respondents, % = Percent of Total Respondents)
1-6 What types of professional learning opportunities are being offered to site administrators in your district? Check all that apply.
Fall Spring ChangeResponse # % # % # %
CDE professional learning modules 23 18% 21 16% -2 -2%County office-developed toolkits 92 71% 86 66% -6 -5%District-developed materials 59 45% 61 47% 2 2%School site-developed materials 28 22% 31 24% 3 2%District-wide trainings 69 53% 79 61% 10 8%Site-level trainings 37 29% 41 32 4 3%CCSS integrated into existing professional learning communities 61 47% 62 48% 1 1%
Online trainings 29 22% 21 16% -8 -6%Other 19 15% 23 18% 4 3%
(# = Number of Respondents, % = Percent of Total Respondents)
More respondents report offering some or extensive professional learning opportunities for teachers, with an increase in the use of most types of professional learning opportunities. In the fall 2012 administration of the survey, 15 percent of respondents reported offering extensive professional learning opportunities for site administrators compared to 27percent of respondents in the spring.
5/9/2023 1:29 PM

Part II: Comparison of Fall 2012 and Spring 2013 Administrations memo-exe-oct13item02Attachment 1
Page 22 of 28
Strategy 2: Provide CCSS-aligned instructional resources designed to meet the diverse needs of all students.
2-1 To what extent are CCSS-aligned materials being used in classroom instruction?
Fall Spring ChangeResponse # % # % # %
Not Yet Used 52 40% 34 26% -18 -14%Few Classrooms 51 39% 63 49% 12 9%Most Classrooms 15 12% 22 17% 7 5%Every Classroom 12 9% 6 5% -6 -5%No Response 0 0.0 5 4% 5 4%
(# = Number of Respondents, % = Percent of Total Respondents)
2-2 What types of CCSS-aligned materials are you using? Check all that apply.
Fall Spring ChangeResponse # % # % # %
Teacher developed materials 53 41% 74 57% 21 16%Open educational resources 37 29% 57 44% 20 15%Free supplemental materials provided by the publishers of your currently adopted programs 32 25% 40 31% 8 6%
Purchased supplemental materials provided by the publishers of your currently adopted programs 27 21% 23 18% -4 -3%
Free supplemental materials provided by a publisher not directly affiliated with your currently adopted programs 17 13% 21 16% 4 3%
Purchased supplemental materials provided by a publisher not directly affiliated with your currently adopted programs 20 15% 15 12% -5 -4%
Other 5 4% 11 9% 6 5%(# = Number of Respondents, % = Percent of Total Respondents)
In the fall 2012 administration, 60 percent of respondents reported that CCSS-aligned materials were being used in classroom instruction. This spring, 71 percent of respondents reported the use of CCSS-aligned materials in classrooms. Respondents report an increase in the use of teacher developed materials, open educational resources, and free supplemental materials.
5/9/2023 1:29 PM

Part II: Comparison of Fall 2012 and Spring 2013 Administrations memo-exe-oct13item02Attachment 1
Page 23 of 28
Strategy 3: Develop and transition to CCSS-aligned assessment systems to inform instruction, establish priorities for professional learning, and provide tools for accountability.
3-1 Based on the questions you receive from the public and district personnel, how would you describe the local level of interest in the new CCSS-aligned assessments?
Fall Spring ChangeResponse # % # % # %
Slightly Interested 23 18% 22 17% -1 -1%Somewhat Interested 47 36% 37 29% -10 -8%Very Interested 60 46% 66 51% 6 5%No Response 0 0% 5 4% 5 4%(# = Number of Respondents, % = Percent of Total Respondents)
3-2 Overall, how knowledgeable are your district’s site administrators regarding California’s participation in the Smarter Balanced Assessment Consortium?
Fall Spring ChangeResponse # % # % # %
Slightly Knowledgeable 23 18% 10 8% -13 -10%Somewhat Knowledgeable 70 54% 64 49% -6 -5%Very Knowledgeable 37 29% 51 39% 14 11%No Response 0 0% 5 4% 5 4%
(# = Number of Respondents, % = Percent of Total Respondents)
3-3 Overall, how knowledgeable are your district’s teachers regarding California’s participation in the Smarter Balanced Assessment Consortium?
Fall Spring ChangeResponse # % # % # %
Slightly Knowledgeable 47 36% 22 17% -25 -19%Somewhat Knowledgeable 78 60% 88 68% 10 8%Very Knowledgeable 5 4% 15 12% 10 8%No Response 0 0% 5 4% 5 4%
(# = Number of Respondents, % = Percent of Total Respondents)
Respondents in the spring report that 80 percent of teachers are somewhat or very knowledgeable regarding Smarter Balanced compared to 64 percent in fall 2012. The number of teachers who are slightly knowledgeable has decreased from 36 percent to 17 percent. The number of site administrators who are slightly knowledgeable has decreased from 18 percent to 8 percent.
5/9/2023 1:29 PM
Part II: Comparison of Fall 2012 and Spring 2013 Administrations memo-exe-oct13item02Attachment 1
Page 24 of 28
Strategy 4: Collaborate with parents, guardians and the early childhood and expanded learning communities to integrate the CCSS into programs and activities beyond the K–12 school setting.
4-1 Have teachers and/or staff providing pre-kindergarten or transitional kindergarten programs been engaged in professional learning opportunities designed to support student attainment of the CCSS?
Fall Spring ChangeResponse # % # % # %
No 20 15% 16 12% -4 -3%Yes 82 63% 87 67% 5 4%N/A 22 17% 21 16% -1 -1%No Response 6 5% 6 5% 0 0%
(# = Number of Respondents, % = Percent of Total Respondents)
4-2 Have teachers and/or staff providing expanded learning/after school programs been engaged in professional learning opportunities designed to support student attainment of the CCSS?
Fall Spring ChangeResponse # % # % # %
No 53 41% 57 44% 4 3%Yes 47 36% 44 34% -3 -2%N/A 24 19% 23 18% -1 -1%No Response 6 5% 6 5% 0 0%
(# = Number of Respondents, % = Percent of Total Respondents)
4-3 To what extent have you provided information about the CCSS to parents?
Fall Spring ChangeResponse # % # % # %
Not Yet Shared 29 22% 9 7% -20 -15%Shared Limited 69 53% 63 49% -6 -5%Shared Some 31 24% 49 38% 18 14%Shared Extensive 1 1% 4 3% 3 2%No Response 0 0% 5 4% 5 4%
(# = Number of Respondents, % = Percent of Total Respondents)
5/9/2023 1:29 PM

Part II: Comparison of Fall 2012 and Spring 2013 Administrations memo-exe-oct13item02Attachment 1
Page 25 of 28
4-4 How are you communicating with parents about the CCSS? Check all that apply.
Fall Spring ChangeResponse # % # % # %
Back-to-school night 59 45% 66 51% 7 5%School events 54 42% 75 58% 21 16%PTA/PTSO meetings 48 37% 65 50% 17 13%Newsletters 71 55% 80 62% 9 7%Letters to the editor 2 2% 4 3% 2 2%News releases 11 9% 24 19% 13 10%Other 32 25% 38 29% 6 5%(# = Number of Respondents, % = Percent of Total Respondents)
More respondents report they have shared some or extensive information with parents regarding the CCSS. In the spring, only 7 percent report they have not yet shared information with parents, compared with 22 percent in fall 2012. Respondents report increased use of all parent communication strategies.
5/9/2023 1:29 PM

Part II: Comparison of Fall 2012 and Spring 2013 Administrations memo-exe-oct13item02Attachment 1
Page 26 of 28
Strategy 5: Collaborate with the postsecondary and business communities to ensure that all students are prepared for success in career and college.
5-1 How often do district personnel engage local institutions of higher education in discussions regarding career and college readiness as related to the CCSS?
Fall Spring ChangeResponse # % # % # %
Not Yet Engaged 76 59% 53 41% -23 -18%Occasionally 40 31% 52 40% 12 9%Frequently 10 8% 15 12% 5 4%N/A 4 3% 5 4% 1 1%No Response 0 0% 5 4% 5 4%
(# = Number of Respondents, % = Percent of Total Respondents)
5-2 To what extent have district personnel engaged local businesses/business organizations in discussions regarding career readiness as related to the CCSS?
Fall Spring ChangeResponse # % # % # %
Not Yet Engaged 101 78% 78 60% -23 -18%Occasionally 29 22% 46 35% 17 13%Frequently 0 0% 1 1% 1 1%No Response 0 0% 5 4% 5 4%
(# = Number of Respondents, % = Percent of Total Respondents)
5-3 Based on your discussions, how supportive of CCSS implementation are local businesses and business organizations?
Fall Spring ChangeResponse # % # % # %
Slightly 6 5% 3 2% -3 -2%Somewhat 11 9% 21 16% 10 8%Very 12 9% 23 18% 11 9%No Response 101 78% 83 64% -18 -14%(# = Number of Respondents, % = Percent of Total Respondents)
Respondents report an increase in discussions with local institutions of higher education and the business community. More respondents indicate that local businesses and business organizations are somewhat or very supportive of the CCSS.
5/9/2023 1:29 PM

Part II: Comparison of Fall 2012 and Spring 2013 Administrations memo-exe-oct13item02Attachment 1
Page 27 of 28
Strategy 6: Seek, create, and disseminate resources to support stakeholders as CCSS systems implementation moves forward.
6.1 What resources are you using to support the transition to the CCSS? Check all that apply.
Fall Spring ChangeResponse # % # % # %
Title I 75 58% 82 63% 7 5%Title II 67 52% 62 48% -5 -4%Title III 30 23% 38 29% 8 6%General funds 96 74% 105 81% 9 7%Flexed funds 39 30% 42 32% 3 2%Local revenue funds 17 13% 17 13% 0 0%Donations from philanthropic organizations 14 11% 14 11% 0 0%Other 11 9% 6 5% -5 -4%
(# = Number of Respondents, % = Percent of Total Respondents)
More respondents report using General funds, Title III and I funds, and flexed funds.
5/9/2023 1:29 PM

Part II: Comparison of Fall 2012 and Spring 2013 Administrations memo-exe-oct13item02Attachment 1
Page 28 of 28
Strategy 7: Design and establish systems of effective communication among stakeholders to continuously identify areas of need and disseminate information.
7-1 How familiar are you with the CCSS Systems Implementation Plan for California?
Fall Spring ChangeResponse # % # % # %
Not Familiar 33 25% 23 18% -10 -8%Somewhat Familiar 70 54% 64 49% -6 -5%Very Familiar 27 21% 38 29% 11 9%No Response 0 0% 5 4% 5 4%
(# = Number of Respondents, % = Percent of Total Respondents)
7-2 Has your district developed a plan for implementing the CCSS?
Fall Spring ChangeResponse # % # % # %
Not Yet Started 16 12% 7 5% -9 -7%In Process 88 68% 81 62% -7 -5%Fully Developed 26 20% 37 29% 11 9%No Response 0 0% 5 4% 5 4%
(# = Number of Respondents, % = Percent of Total Respondents)
7-3 What strategies are you using to communicate with your district stakeholders about your CCSS implementation plan? Check all that apply.
Fall Spring ChangeResponse # % # % # %
Staff meetings 26 20% 37 29% 11 9%School Site Council meetings 20 15% 29 22% 9 7%PTA/PTSO meetings 16 12% 22 17% 6 5%Newsletters 21 16% 30 23% 9 7%Webinars 1 1% 2 2% 1 1%Local school board meetings 22 17% 34 26% 12 9%Letters to the editor 1 1% 3 2% 2 2%News releases 4 3% 9 7% 5 4%Other 5 4% 8 6% 3 2%
(# = Number of Respondents, % = Percent of Total Respondents)
More respondents report that they have a fully developed local implementation plan and fewer report that they have not yet started to develop a plan. The number of respondents that is very familiar with the CCSS Systems Implementation Plan for California has increased.
5/9/2023 1:29 PM