october 2014 - trinidaddrilling.com 2014... · 17 solid capital structure capital structure meets...
TRANSCRIPT
October 2014
IT’S ABOUT PERFORMANCE

Forward Looking Information
Certain information in this document is forward-looking and is subject to
important risks and uncertainties. The results or events predicted in this
information may differ from actual results or events.
Factors which could cause actual results or events to differ materially from
current expectations include, among other things, the ability of Trinidad Drilling
Ltd. to successfully implement its strategic initiatives and whether such strategic
initiatives will yield the expected benefits, the availability and price of energy
commodities, regulatory environment, competitive factors in the natural gas
transportation and natural gas liquids extraction industries and the prevailing
economic conditions in North America.
For additional information on these and other factors, see the reports filed by
Trinidad Drilling Ltd. with Canadian securities regulators. Trinidad Drilling Ltd.
disclaims any intention or obligation to update or revise any forward-looking
statements, whether as a result of new information, future events or otherwise.
2IT'S ABOUT PERFORMANCE

Well Positioned for Growth
IT'S ABOUT PERFORMANCE 3
Trinidad has:
– In-demand asset base
– Proven operational expertise
– Extensive growth opportunities
– Financial flexibility to support growth

Growing Diversification
IT'S ABOUT PERFORMANCE 4
Mexico1
7 rigs
Rig manufacturing
Innovation & design
Canada1
62 rigsUS
5 barges 59 rigs
Mexico1
4 rigs
Saudi1
4 rigs
1 – includes rigs under construction, JV rigs included at 100 percent

More Rigs that Customers Want
5IT'S ABOUT PERFORMANCE
>85% of Trinidad’s Rigs are
Modern, High Performance Rigs

0%
10%
20%
30%
40%
50%
60%
70%
2002 2003 2004 2005 2006 2007 2008 2009 2010 2011 2012 2013-80%
-60%
-40%
-20%
0%
20%
40%
60%
Q208
Q408
Q209
Q409
Q210
Q410
Q211
Q411
Q212
Q412
Q213
Q413
Q214
Trinidad’s Canadian Utilization
Source – Canadian Association of Oil Well Drilling Contractors, to Dec 31st, 2013
Source – Rig Data, Tudor Pickering Holt, at August 15th, 2014
Rig Data considers 10/03/08 the industry peak with 2,374 active rigs
Industry Average
IT'S ABOUT PERFORMANCE6
Consistent Industry Outperformance
TDG
Industry Average
Trinidad’s rigs are more activeCanadian Utilization Rates US Active Rig Count (Change from 10/3/08)

7IT'S ABOUT PERFORMANCE
Solid Canadian Operations
CANADAUSA
Forecasted rig locations post break-upIncludes 2014 rig build program
− Active in key plays
− Broad customer base
− Demand stable
− LNG development drives future growth
Liard2
Montney13 Oil
sands1
Viking 1
Frobisher 5
Duvernay6
Cardium4
AB Bakken
3

Canadian Growth - LNG
IT'S ABOUT PERFORMANCE 8
LNG - a perfect fit for Trinidad
– Existing relationships with key LNG players
– The right equipment and experience
– Constructing Liard new build for LNG
– Expect growth in coming years

IT'S ABOUT PERFORMANCE 9
Stable Operations in United States
ClevelandTonkawa
10
Bakken4
Niobrara2
Permian16
Eagle Ford
8
Barnett4
Eaglebine2
Haynesville6
− US operations less seasonal
− Demand increasing
− US activity and dayratesimproving
Includes rigs under construction.

Demand for Upgraded Equipment
IT'S ABOUT PERFORMANCE 10
Industry shift plays into Trinidad’s strategy
– Strong reputation as a high performance driller
– Upgrades to our fleet maintain market share and marketability
– Five new rigs for US operations, delivery in the first three quarters of 2015
– Additional new build opportunities for 2015 and beyond

Trinidad Drilling International - JV
IT'S ABOUT PERFORMANCE 11
provides
• Customer relationships
• International know-how
• Logistical support
• Infrastructure40% partner
provides
• High-performance rigs
• Innovative technology
• Operational excellence
• Rig manufacturing60% partner

IT'S ABOUT PERFORMANCE 12
Joint Venture – First Steps
CANADA
Drilling(68 Rigs)
93%
Saudi entry; four rigs in 2014 (3 upgraded US rigs and 1 new build)
Four new builds for Mexico to be delivered in late 2014/early 2015

IT'S ABOUT PERFORMANCE 13
JV - Saudi Operations Begin
CANADA
Drilling(68 Rigs)
93%
– First three rigs operating
– Fourth rig in Middle East
– Office space established
– 250 employees hired to date
IT'S ABOUT PERFORMANCE 14
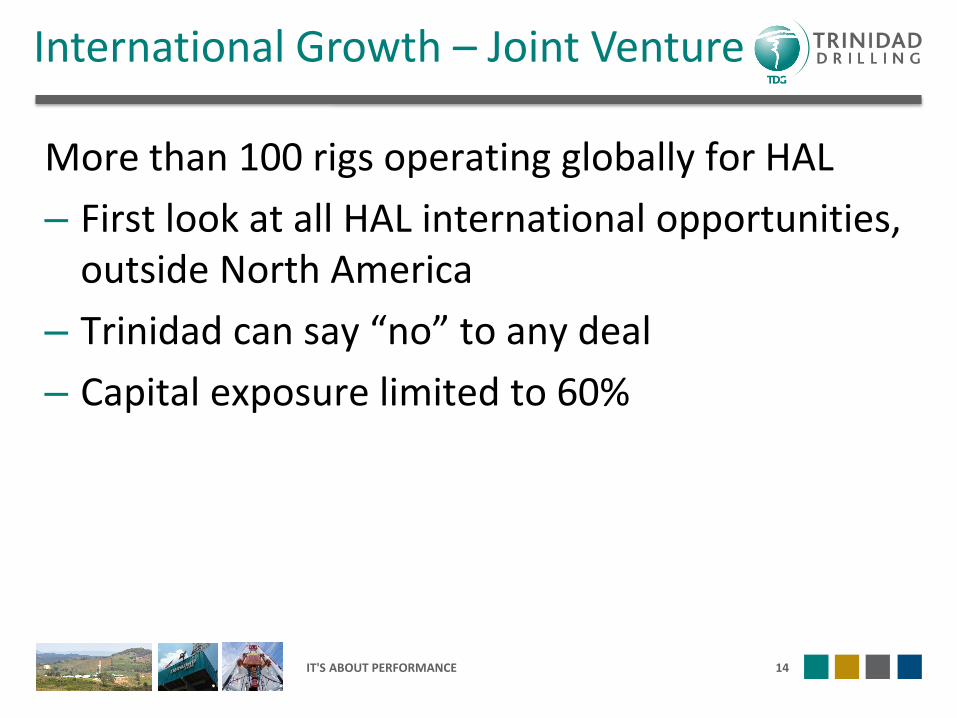
International Growth – Joint Venture
More than 100 rigs operating globally for HAL
– First look at all HAL international opportunities, outside North America
– Trinidad can say “no” to any deal
– Capital exposure limited to 60%

Skilled, Safety Focused Crews
− Our safety performance is better than the industry and keeps improving
− High performance rigs attract the best people
15IT'S ABOUT PERFORMANCE

We lower our risk by only building rigs under
long-term contracts
~50% of fleet on long-term contract
>1.5 years average term remaining
16
Customer Backed Growth
IT'S ABOUT PERFORMANCE

17
Solid Capital Structure
Capital structure meets our needs
• Currency balance, extended maturity and financial flexibility
• Nov 2013 equity offering improves ability to fund growth
IT'S ABOUT PERFORMANCE
Credit Facility Available Outstanding Q2 2014
Expiry
Revolver C$200mUS$100m
C$0mUS$0m
Dec 2017
US$ Senior Notes (7. 785%) US$450m US$450m Jan 2019
Total Long-term Debt(1) C$471m(1) Includes long-term debt and short-term portion of long-term debt, US$ debt is translated to CAD$ at quarter-end exchange rate
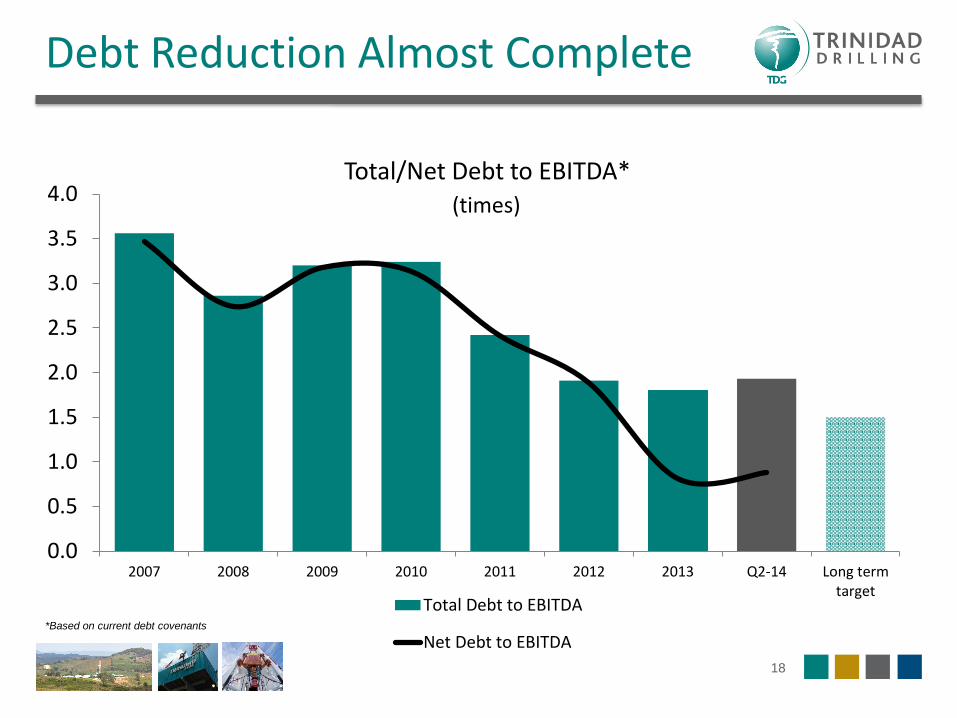
0.0
0.5
1.0
1.5
2.0
2.5
3.0
3.5
4.0
2007 2008 2009 2010 2011 2012 2013 Q2-14 Long termtarget
(times)
Total/Net Debt to EBITDA*
Total Debt to EBITDA
Net Debt to EBITDA
Debt Reduction Almost Complete
18
*Based on current debt covenants

2014 Capital Program
IT'S ABOUT PERFORMANCE 19
Total 2014 capital budget of $315 million
• New builds and JV related(1) - $200 million– LNG new build
– JV related new builds – 5 rigs
– JV related rig upgrades – 3 rigs
– Five US contracted new builds (completed in 2015)
• Upgrades to 30 rigs - $75 million (completed in 2015)
– Improve marketability and maintain market share
– Add moving systems, AC packages, increase pumping capacity
• Maintenance and infrastructure capital - $40 million
(1) This figure is net of the 40% of the value of the rigs Trinidad receives when it transfers rigs into the joint venture

An Exciting New Era for Trinidad
IT'S ABOUT PERFORMANCE 20
Free cash flow provides many opportunities
• Upgrade existing rigs
• Build new rigs, expand operations
• Alignment with HAL opens new doors
• Build cash for future cycles
• Return value to shareholders

21
Invest in Trinidad
Trinidad has:
– The right rigs for today and tomorrow
– Exciting growth opportunities
– Financial flexibility to fund growth
IT'S ABOUT PERFORMANCE

APPENDIX
www.trinidaddrilling.com
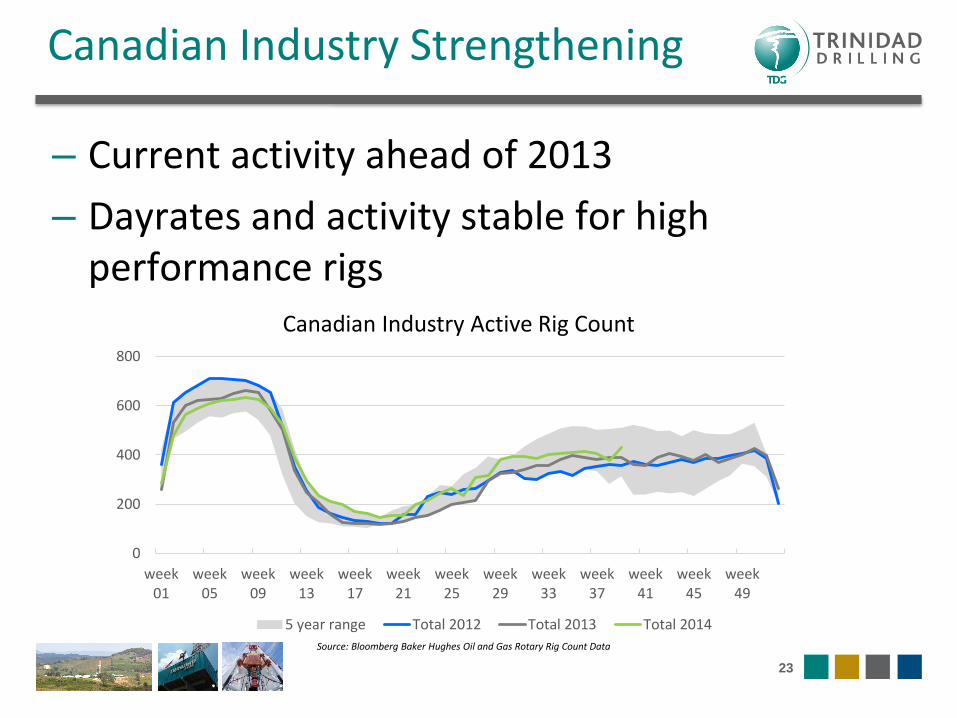
Canadian Industry Strengthening
23
– Current activity ahead of 2013
– Dayrates and activity stable for high performance rigs
0
200
400
600
800
week01
week05
week09
week13
week17
week21
week25
week29
week33
week37
week41
week45
week49
Canadian Industry Active Rig Count
5 year range Total 2012 Total 2013 Total 2014
Source: Bloomberg Baker Hughes Oil and Gas Rotary Rig Count Data

24
US Industry Conditions Improving
– US active rig count increasing
– Rig mix changing, driving improving conditions
0
400
800
1200
1600
2000
2400
week01
week05
week09
week13
week17
week21
week25
week29
week33
week37
week41
week45
week49
US Industry Active Rig Count
5 year range Total 2012 Total 2013 Total 2014Source: Bloomberg Baker Hughes Oil and Gas Rotary Rig Count Data

Summary of Second Quarter Results
IT'S ABOUT PERFORMANCE 25
FINANCIAL HIGHLIGHTS
($ thousands except share and per share data) 2014 2013 % Change 2014 2013 % Change
Revenue 168,945 165,447 2.1 420,450 412,633 1.9
Revenue, net of third party costs 159,644 156,171 2.2 390,662 383,548 1.9
Operating income 45,605 55,651 (18.1) 140,797 154,010 (8.6)
Operating income - net percentage 28.3% 35.6% (20.5) 35.9% 40.2% (10.7)
Adjusted EBITDA 30,644 39,941 (23.3) 110,086 124,777 (11.8)
Per share (di luted) 0.22 0.33 (33.3) 0.79 1.03 (23.3)
Funds provided by operations 30,285 39,124 (22.6) 91,142 104,067 (12.4)
Per share (bas ic / di luted) 0.22 0.32 (31.3) 0.66 0.86 (23.3)
Net (loss ) earnings (24,815) 347 (7,251.3) 947 33,095 (97.1)
Per share (bas ic / di luted) (0.18) 0.00 - 0.01 0.27 (96.3)
Operating days
Canada 1,430 1,434 (0.3) 5,507 5,632 (2.2)
United States and International 4,441 4,578 (3.0) 8,752 9,031 (3.1)
Rate per operating day
Canada (CDN$) 26,338 25,511 3.2 25,655 25,429 0.9
United States and International (US$) 20,819 22,436 (7.2) 21,716 22,461 (3.3)
Utilization rate - operating day
Canada 26% 26% - 50% 52% (3.8)
United States and International 80% 73% 9.6 78% 73% 6.8
As at June 30, December 31,
($ thousands except percentage data) 2014 2013 % Change
Total long-term debt 471,123 468,670 0.5
Three months ended June 30, Six months ended June 30,

Historical Dayrates
IT'S ABOUT PERFORMANCE 26
0%
10%
20%
30%
40%
50%
$0
$5,000
$10,000
$15,000
$20,000
$25,000
$30,000
Q1
-10
Q2
-10
Q3
-10
Q4
-10
Q1
-11
Q2
-11
Q3
-11
Q4
-11
Q1
-12
Q2
-12
Q3
-12
Q4
-12
Q1
-13
Q2
-13
Q3
-13
Q4
-13
Q1
-14
Q2
-14
US Rate Per Operating Day vs Operating Margin
Rate per operating day Operating margin
Dayrates($US)
0%
10%
20%
30%
40%
50%
60%
70%
80%
90%
100%
$0
$5,000
$10,000
$15,000
$20,000
$25,000
$30,000
$35,000
$40,000
Q1
-10
Q2
-10
Q3
-10
Q4
-10
Q1
-11
Q2
-11
Q3
-11
Q4
-11
Q1
-12
Q2
-12
Q3
-12
Q4
-12
Q1
-13
Q2
-13
Q3
-13
Q4
-13
Q1
-14
Q2
-14
Barge Rate Per Operating Day vs Utilization
Rate per operating day Utilization %
Utilization
Dayrate($US)
0%
10%
20%
30%
40%
50%
$0
$5,000
$10,000
$15,000
$20,000
$25,000
$30,000
Q1
-10
Q2
-10
Q3
-10
Q4
-10
Q1
-11
Q2
-11
Q3
-11
Q4
-11
Q1
-12
Q2
-12
Q3
-12
Q4
-12
Q1
-13
Q2
-13
Q3
-13
Q4
-13
Q1
-14
Q2
-14
Canada Rate Per Operating Day vs Operating Margin
Rate per operating day Operating margin
Utilization

IT'S ABOUT PERFORMANCE 27
Consistent Dividend
− Consistently paid a dividend for past 10 years,
throughout industry cycles and economic downturns
− Sustainable payout level at approx. 15% of 2014
consensus cash flow
− Current dividend of $0.05 per share per quarter
provides cash-on-cash yield(1) of 2.3%
(1) Yield at September 29th, 2014

Advanced, Deep and Modern Fleet
28IT'S ABOUT PERFORMANCE
9%6%
84%
0 - 5,999ft
6,000- 7,999ft
8,000ft+
Rig Fleet Depth
Includes rigs under construction, land drilling rigs only
Rig Fleet Age
17%
57%
23%< 5 years
5-10 years
> 10 years
Technically Advanced Fleet
88%
4%12%
High performance, high mobility, advanced drilling controls
Top drive, some automation, horizontal capable
Conventional rig, mechanical controls, predominantely shallow drilling
In-demand rigs generate higher dayrates and margins

29
Contracts Provide Stability
IT'S ABOUT PERFORMANCE
0.0
1.0
2.0
3.0
0%
25%
50%
75%
100%
YE 2008 YE 2009 YE 2010 YE 2011 YE 2012 YE 2013 Current
Average term remaining (years)
Fleet under contract
Contracted rigs - Canada Contracted rigs - US & international
Short term or spot rigs Average term remaining
Typically 40 to 60% of our fleet is under contract
Includes rigs under construction

Trinidad’s experience and high performance saves customers’ time and costs
IT'S ABOUT PERFORMANCE 30
Drilling Efficiency Saves Money
Trinidad's Efficiency Capabilities1
First Entry Current
Days to Drill Typical Well 65 40
Cost of Rig 2 $1,462,500 $900,000
Ancillary Equipment 3 $2,193,750 $1,350,000
Total Well Savings 25 Days | $1,406,250
2 Dayrate at $22,500 per day
3At 60% of day costs
1Example shown for Haynesville Shale

Top Drive
Moving System Integrated Control System
• Automated pipe handling automates
moving drill pipe and other tubulars
to and from drill floor. Improves
efficiency and safety
• Iron roughneck automates making
connections with drill pipe and other
tubulars; keeps rig hands away from
high risk activity and improves
efficiency
• Trinidad’s patented design provides
increased torque and ability to perform
at faster speeds
• Provides improved control and better
drilling results
• Allows rig to skid from one well
location to the next without the use
of trucks
• Vastly reduces downtime between
wells
• Reduces seasonal impact on drilling
and improves utilization levels
• Improved efficiency increases
economics for customers
• Integrates all the pieces of equipment
and allows central control from driller’s
cabin
• Displays real-time graphical information
• Provides enhanced control, focus and
design-making ability
• Increases rig safety and efficiency
IT'S ABOUT PERFORMANCE
Automation – Pipe Handling, Iron Roughneck
31
Key Technological Advances

A Continued Focus on Safety
0.00
1.00
2.00
3.00
4.00
5.00
6.00
Mar
-09
May
-09
Jul-
09
Sep
-09
No
v-0
9
Jan
-10
Mar
-10
May
-10
Jul-
10
Sep
-10
No
v-1
0
Jan
-11
Mar
-11
May
-11
Jul-
11
Sep
-11
No
v-1
1
Jan
-12
Mar
-12
May
-12
Jul-
12
Sep
-12
No
v-1
2
Jan
-13
Mar
-13
May
-13
Jul-
13
Sep
-13
No
v-1
3
Jan
-14
Mar
-14
May
-14
Jul-
14
TRIF – Total Recordable Injury Frequency, 12 month corporate
rolling average
TRIF
32

Non-GAAP Measures definition
This document contains references to certain financial measures and associated per share data that do not have any standardized meaning prescribed by IFRS and may not be comparable to similar measures presented by other companies. These financial measures are computed on a consistent basis for each reporting period and include Adjusted EBITDA, Total Debt to EBITDA, drilling days, operating days, utilization rate - drilling day, utilization rate - operating day, and rate per operating day. These non-GAAP measures are identified and defined as follows:
“Adjusted EBITDA” is used by management and investors to analyze EBITDA (as defined above) prior to the effect of foreign exchange, share-based payment expense, impairment expenses and the sale of assets. Adjusted EBITDA also takes into account the Company’s portion of the principal activities of the joint venture arrangement by removing the loss (gain) from investment in joint venture and including EBITDA from investment in joint venture. Adjusted EBITDA is not intended to represent net earnings as calculated in accordance with IFRS. Adjusted EBITDA provides an indication of the results generated by the Company’s principal business activities prior to how these activities are financed, assets are depreciated, amortized and impaired, the impact of foreign exchange, how the results are taxed in various jurisdictions and effects of share-based payment expenses.
“Total Debt to Bank EBITDA” is defined as the consolidated balance of long-term debt, which includes the Senior Debt, Senior Notes Payable and dividends payable at quarter end, to consolidated Bank EBITDA for the TTM. Bank EBITDA used in this financial ratio is calculated as EBITDA plus impairment expense, loss (gain) on sale of property and equipment, loss (gain) from investment in joint venture, share-based payment expense and unrealized foreign exchange.
“Drilling days” is defined as rig days between spud to rig release.
“Operating days” is defined as moving days (move in, rig up and tear out) plus drilling days (spud to rig release).
“Utilization rate - drilling day” is defined as drilling days divided by total available rig days.
“Utilization rate - operating day” is defined as operating days (drilling days plus moving days) divided by total available rig days.
“Rate per operating day” or “Dayrate” is defined as operating revenue (net of third party costs) divided by operating days (drilling days plus moving days).
“Payout level” is defined as annual dividends declared divided by annual funds provided by operations.
“Cash-on-cash yield” is defined as annual dividends declared per share divided by the current share price.
“Free Cash Flow” is defined as annual funds provided by operations minus the sum of annual dividends declared and annual capital expenditures.
IT'S ABOUT PERFORMANCE 33

Additional GAAP Measures Definitions
The Company refers to certain additional GAAP financial measures within this document that are not defined terms under IFRS to
assess performance. Management believes that these measures provide useful supplemental information to investors. These financial
measures are computed on a consistent basis for each reporting period and include Funds provided by operations, Operating income
and Operating income - net percentage or Operating margin. These additional GAAP measures are identified and defined as follows:
“Funds provided by operations” is used by management and investors to analyze the funds generated by Trinidad’s principal business
activities prior to consideration of working capital, which is primarily made up of highly liquid balances. This balance is reported in the
Consolidated Statements of Cash Flows included in the cash provided by operating activities section.
“Operating income” is used by management and investors to analyze overall and segmented operating performance. Operating
income is not intended to represent an alternative to net earnings or other measures of financial performance calculated in
accordance with IFRS. Operating income is calculated from the consolidated statements of operations and comprehensive income
(loss) and from the segmented information contained in the notes to the consolidated financial statements. Operating income is
defined as revenue less operating expenses.
“Operating income - net percentage” or “operating margin” is used by management and investors to analyze overall and segmented
operating performance excluding third party recovery and third party costs, as well as inter-segment revenue and inter-segment
operating costs, as these revenues and expenses do not have an effect on consolidated net earnings. Operating income - net
percentage is calculated from the consolidated statements of operations and comprehensive income (loss) and from the segmented
information in the notes to the consolidated financial statements. Operating income - net percentage is defined as operating income
less third party G&A expenses divided by revenue net of operating and G&A third party costs.
IT'S ABOUT PERFORMANCE 34

2500, 700 – 9 Avenue S.W.
Calgary, AB, Canada | T2P 3V4
T 403.265.6525
www.trinidaddrilling.com