october 2016 digital technology through the supply chain · digital technology through the supply...
TRANSCRIPT

Digital Technology Through The Supply Chain
Michael Whitehead
October 2016

2
• ANZ And Agri
• Real Time Financing
• Cattle As An Example
• Trust – New Market Entrants
• The Alibaba Effect
AGENDA
2

ANZ AND AGRICULTURE
3

OUR SUPER REGIONAL NETWORK
Note: *GCC - Gulf Cooperation of Council countries **Pacific Islands comprises of Guam, Solomon Islands, Fiji, Kiribati, Samoa, American Samoa, Cook Islands, Timor Leste, Tonga, Vanuatu and New Caledonia. Fiji operations comprises of Commercial/International Banking, Large Corporate & Institutional Banking, and Retail Banking & Wealth Management
KEY: Commercial/ International Banking
Large Corporate & Institutional Banking Private Banking
Retail Banking & Wealth Management
Partner Bank Representative Office
ANZ has an established regional network across 33 markets which include 15 Asian markets and representation in Europe, America and Middle East. ANZ is a leading bank in Australia and the largest bank in New Zealand & the Pacific Islands (12 markets)
GERMANY Frankfurt
LAOS
VIETNAM
THAILAND
MYANMAR
UNITED KINGDOM
London
CHINA
UAE (GCC*)
INDIA
CAMBODIA
SINGAPORE
MALAYSIA
SOUTH KOREA
JAPAN
HONG KONG
TAIWAN
UNITED STATES OF AMERICA New York
PHILIPPINES
INDONESIA
PAPUA NEW GUINEA
AUSTRALIA
PACIFIC ISLANDS**
NEW ZEALAND
4
4

ANZ AGRIBUSINESS
Regional Business Banking Agribusiness Specialists
Corporate Agribusiness
Institutional Banking
Family Farms Agri Value Chain Sub-industry
expertise Lending up to
$10M
Large primary producers, 1st stage processors and services to agri. Industry specialisation Turnover < $500m
Multi-nationals and Listed Australian companies Turnover > $500m
We understand the flow of your
produce through the entire supply chain, from paddock to
plate. Our regional network offers you
access to local industry expertise, valuable connections
and growth opportunities to help take your agribusiness into
the future.
5

6
AND TECHNOLOGY IS CHANGING THE COURSE – EXPONENTIALLY!

REAL TIME FINANCING
7
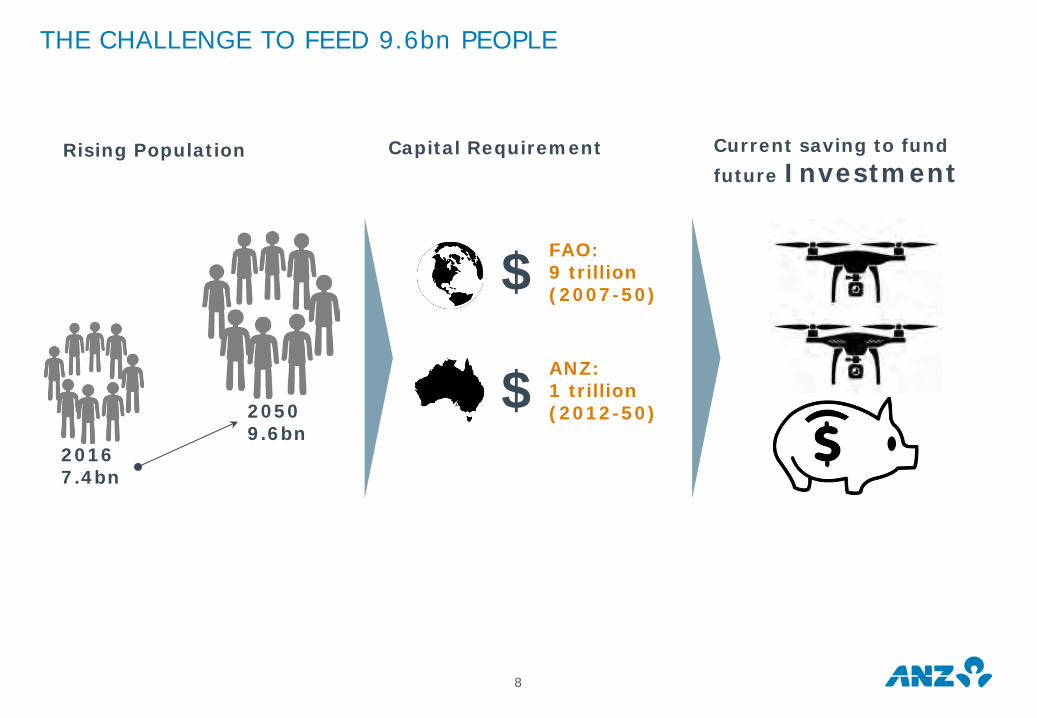
THE CHALLENGE TO FEED 9.6bn PEOPLE
8
2016 7.4bn
2050 9.6bn
FAO: 9 trillion (2007-50) $ ANZ: 1 trillion (2012-50) $
Rising Population Capital Requirement Current saving to fund future Investment

BANKS REMAIN INTEGRAL PART OF SUPPLY CHAIN
9

10
AUSTRALIAN BEEF INDUSTRY
47%
22%
19%
5%4%
3%
QLDNSWVICSAWATAS
29.1 Million
7%
8%
4%
44%
20%
14%
3%
Bee
f
2.7mt cwt
1 m
28 mGrass Fed
Feedlot
Feed
ing
Sys
tem
2.0
1.1Kg/Day
Kg/Day
Grass Fed
Feedlot W
eig
ht
Gai
n

CATTLE AS AN EXAMPLE…
11

12
TRADITIONAL VS REAL TIME FINANCING
Real Time Financing
300 Kg 400 Kg 500 Kg
Day 0 Day 50 Day 100
$ $$$ $$$$$
$ Gained $ Gained
300 Kg 400 Kg 500 Kg
Day 0 Day 50 Day 100
$ $$$ $$$$$
$ Lost $ Lost
Traditional Financing
Funding Against Land
Failure to tap the working capital finance opportunity
Works well with operators with long operation history
Technology provide opportunity to unlock working capital

300
450
600
750
900
1,050
1,200
1.5
2.0
2.5
3.0
3.5
4.0
Jan 15 Feb 15 Mar 15 Apr 15 May 15
AUD
Mill
ion
AUD
Per
Kg
Cattle Price Market Value (RHS) Real Time Model (RHS)
13
An Inventory that Grows: Feedlot
Tap the Market Value: Feedlot1
300
350
400
450
500
550
1.5
2.0
2.5
3.0
3.5
4.0
4.5
Jan 15 Feb 15 Mar 15 Apr 15 May 15
Kg
AUD
Per
Kg
Australia Eastern Young Cattle Indicator Ave Weight (RHS)
Note1: Dressing %=52%, 85% of market value for feed lot with 100 day cycle
DIGITAL FINANCING LEVERAGES ALL AVAILABLE INFORMATION

ABILITY TO ATTRACT NEW CAPITAL IN THE INDUSTRY BY UNLOCKING WORKING CAPITAL
14
20151 20161
0
200
400
600
800
1,000
1,200
Jan 15 Feb 15 Mar 15 Apr 15 May 15
AUD
Mill
ion
Traditional Model Real Time Model
0
200
400
600
800
1,000
1,200
Jan 16 Feb 16 Mar 16 Apr 16 May 16
AUD
Mill
ion
Traditional Model Real Time Model
Works well with operators with long operation history
Note1: Dressing %=52%, 85% of market value for feed lot with 100 day cycle

15 TRADITIONAL VS DIGITAL FINANCING
Additional Capital 0-50 Days (In AUD m) Additional Capital 50-100 Days (In AUD m)
-50
0
50
100
150
200
250
300
0 Day 10 Day 20 Day 30 Day 40 Day
2010 2011 2012 20132014 2015 2016
-50
0
50
100
150
200
250
300
50 Day 60 Day 70 Day 80 Day 90 Day
2010 2011 2012 2013
2014 2015 2016
15

THE WAY AHEAD
16

WHY BLOCKCHAIN?
17
Prohibits digital copies of assets
Individual ownership of data
Ability to uniquely identify each asset
Lower cost of operation
Faster processing
Failure resilience

THE WAY AHEAD
18
Drivers Platform
Cattle in feedlot 2,000
Funding Based on Land AUD 1.0m
Working Capital Opportunity AUD 0.4m
Swipe Right to unlock AUD 400k
2.12.42.73.03.33.63.94.24.54.8
10 11 12 13 14 15 16Australia Eastern Young Cattle Indicator
AU
D /
Kg

ENHANCED TRUST = NEW MARKET ENTRANTS
19

20
LEVERAGE THE INFORMATION TO UNLOCK CAPITAL
Technology to support Real Time financing

THE “ALIBABA” EFFECT
21

CHINA’s “OUTSIZED” AGRI DEMAND – MEAT M
eat
Con
sum
pti
on
CA
GR
(2
01
5-2
0)
GDP (PPP) CAGR (2015-20)
Notes: 1. Meat includes Beef & Veal, Sheep meat, Poultry and Pork
Meat Consumption (million tonnes) vs GDP (PPP)
Bubble Size represent 2020 Meat Consumption
Source: BMI, IMF, ANZ
92.5mt
41.0mt
Brazil, 21.7mt
Russia, 11.0mt
Viet Nam, 6.9mt
Japan, 5.7mt
Korea, 3.5mt
Canada, 3.3mt
2020 Meat Consumption
China
USA
Philippines, 4.0mt
Saudi Arabia, 2.0mt
Thailand, 2.0mt
China
United States
Brazil
Russia
Japan
Korea
Viet Nam
Philippines
Canada
Saudi Arabia
Thailand
-
0.5%
1.0%
1.5%
2.0%
2.5%
1% 3% 5% 7% 9% 11%
22
-
10,000
20,000
30,000
40,000
50,000
60,000
70,000
80,000
1960 1964 1968 1972 1976 1980 1984 1988 1992 1996 2000 2004 2008 2012 2016
China United States
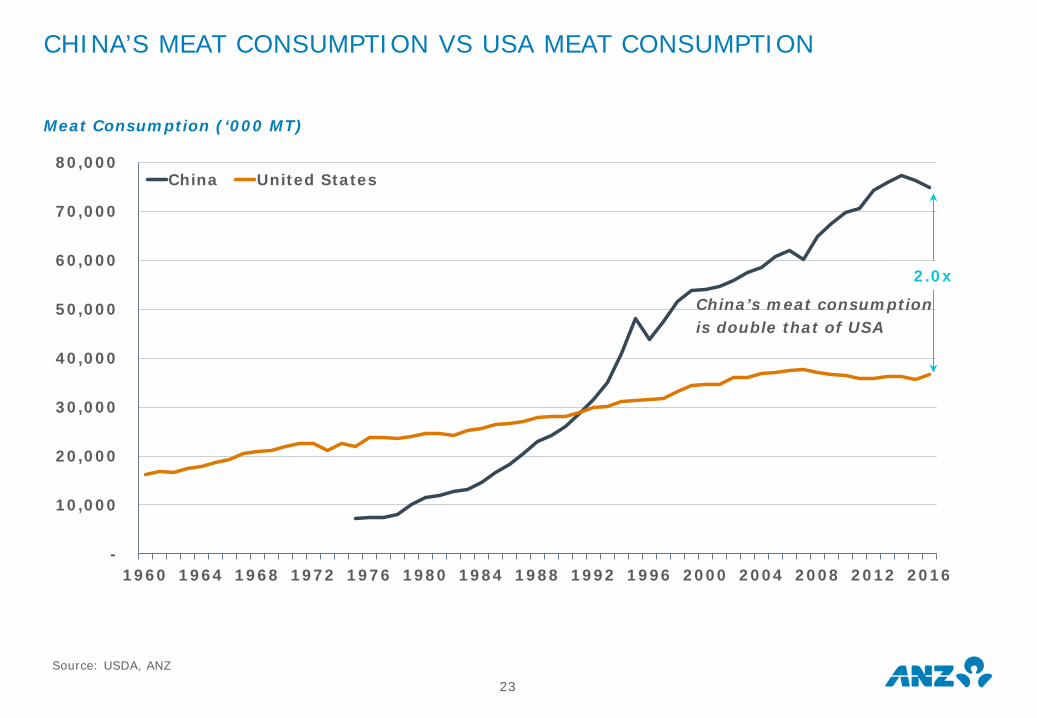
CHINA’S MEAT CONSUMPTION VS USA MEAT CONSUMPTION
China’s meat consumption is double that of USA
Meat Consumption (‘000 MT)
Source: USDA, ANZ
2.0x
23
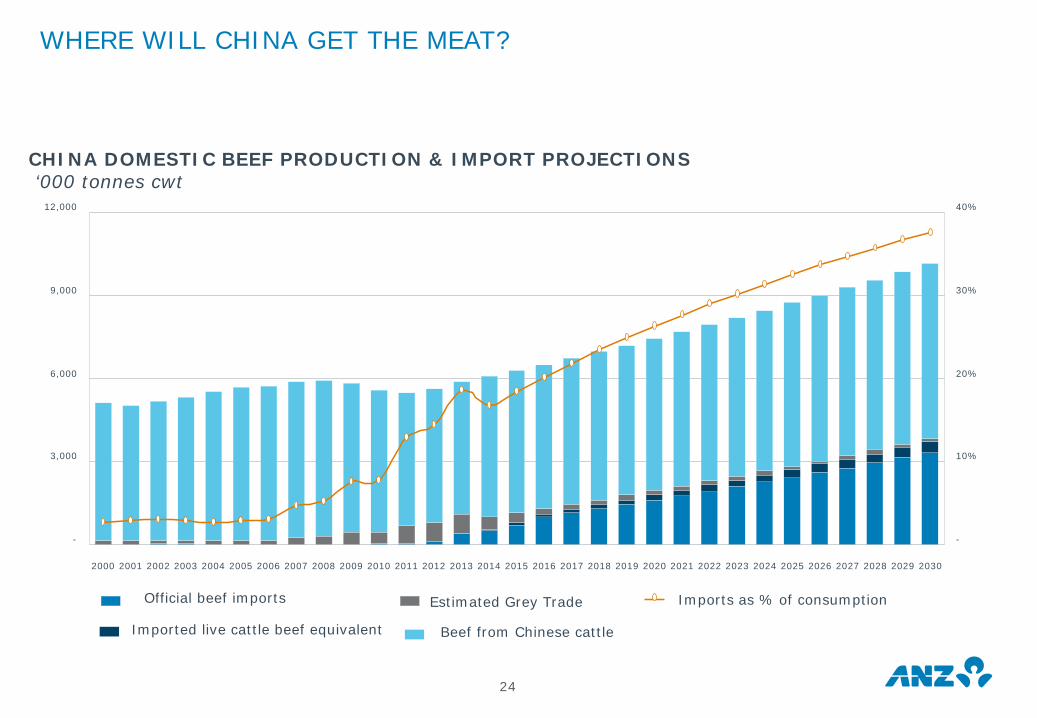
WHERE WILL CHINA GET THE MEAT?
CHINA DOMESTIC BEEF PRODUCTION & IMPORT PROJECTIONS ‘000 tonnes cwt
-
3,000
6,000
9,000
12,000
2000 2001 2002 2003 2004 2005 2006 2007 2008 2009 2010 2011 2012 2013 2014 2015 2016 2017 2018 2019 2020 2021 2022 2023 2024 2025 2026 2027 2028 2029 2030
-
10%
20%
30%
40%
Official beef imports
Imported live cattle beef equivalent
Estimated Grey Trade
Beef from Chinese cattle
Imports as % of consumption
24

CHINA DEMOGRAPHICS – INCREASING AGEING
Population by Age Group
CHINA JAPAN GERMANY Male Female
Source: US Bureau, International Database
10% - 10%
0-45-9
10-1415-1920-2425-2930-3435-3940-4445-4950-5455-5960-6465-6970-7475-7980-8485-8990-9495-99100+
10% - 10% 10% - 10%
25

CHINA CONSUMES AS MANY CALORIES PER CAPITA AS JAPAN DID IN 1990
China Calorie consumption by Source
Source: FAO Statistics, ANZ
-
500
1,000
1,500
2,000
2,500
3,000
3,500
1990 1992 1994 1996 1998 2000 2002 2004 2006 2008 2010 2012
Dairy and Eggs Grain Meat Produce Sugar and Fat Other
26
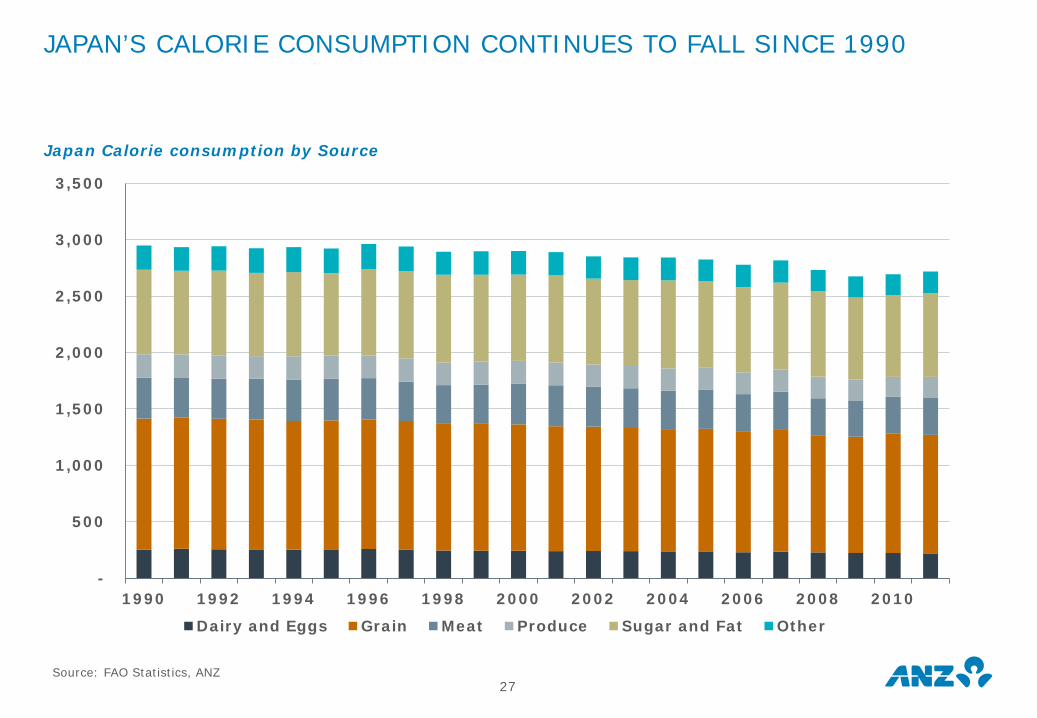
JAPAN’S CALORIE CONSUMPTION CONTINUES TO FALL SINCE 1990
Japan Calorie consumption by Source
Source: FAO Statistics, ANZ
-
500
1,000
1,500
2,000
2,500
3,000
3,500
1990 1992 1994 1996 1998 2000 2002 2004 2006 2008 2010
Dairy and Eggs Grain Meat Produce Sugar and Fat Other
27

GERMANY CALORIE CONSUMPTION HAD INCREASED BUT STAGNATED IN RECENT PAST
Germany Calorie consumption by Source
Source: FAO Statistics, ANZ
-
500
1,000
1,500
2,000
2,500
3,000
3,500
4,000
1990 1992 1994 1996 1998 2000 2002 2004 2006 2008 2010
Dairy and Eggs Grain Meat Produce Sugar and Fat Other
28

EVEN WITH LOW GROWTH SCENARIO, CHINA REMAINS IMPORTANT
Nominal Private Consumption Estimate – 20201 (USD trillions)
Notes: 1. Sourced from World Economic Forum; China real GDP is assumed to
be 5.5% pa
0.1
0.6
1.6
2010 2015 2020
China e-commerce, Gross merchandise value (USD trillions)
Source: WEF, BCG Analysis
12.4
4.2
1.3 2.4 1.8 1.8 1.3
2.6
2.3
1.6 0.4
0.5 0.3 0.4
-
$2tr
$4tr
$6tr
$8tr
$10tr
$12tr
$14tr
$16tr
US China India Japan Germany UK France
Private Consumption, 2015 Consumption growth 2015-20
29

58% 23%
4% 3%
2% 11%
Tmall
JD
Suning
VIP.com
Gome.com
Other
30
EMPHASIS ON USER EXPERIENCE, LOGISTICS SERVICES AND NEW CATEGORY EXPANSION
China B2C Online Shopping Market Share by GMV - 2015
788
137
884
Same Day Next DayAlibaba Cainiao JD.Com
Number of Cities for Same Day Delivery/Next Day Delivery
19% 15%
7% 8%
36% 30%
11% 18%
6% 6% 5% 12% 16% 11%
2015 2020e
Others
Packaged Food &DrinkHome Furnishing
Maternal & Child
Apparel
B&PC
ConsumerElectronics
Alibaba's parcels delivered
42m/day 100m/day
Traceability
Premiumisation
Differentiation

34%
20% 21%
-
50
100
150
200
China Australia USA'15 '20F CAGR (15-20F)
-
8%
16%
24%
32%
40%
'14 '15E '16F '17F '18F '19FChina Australia USA
INCREASING ONLINE GROCERY RETAIL
GROWING SHARE OF ECOMMERCE SALES2,3 Proportion of Total Retail Sales
RISING DIGITAL BUYER PENETRATION1,3 % of population
32.7% 51.7%
63.1% 66.3%
62.8% 71.1%
2014 2019F
ONLINE GROCERY MARKET 2015-2020F
With rising internet penetration ecommerce sales is expected to grow; online grocery market, although smaller in size, is forecast to grow by over 20% per annum in China, Australia & USA from 2015-2020F
• Online penetration of grocery is low in China. One of the primary reasons is slow development of cold-chain delivery infrastructure and shipping standards, especially in fresh food category
• Investments in online grocery and food has been on the rise since 2015
• Major online grocery players:
• Online grocery sales accounted for only 2.5% of total grocery revenue in 2015-16
• Companies such as Woolworths and Coles have invested significantly in online shopping solutions to ensure fast and efficient delivery
• Major online grocery players:
• Online grocery market is only a small share of USA grocery market at 2%
• In USA, over 2016, online grocery penetration for fresh foods and packaged foods is expected to increase from 8% to 26% and 16% to 28%, respectively
• Major online grocery players:
Key Market Trends/Issues
Source: eMarketer Worldwide Retail Ecommerce Sales 2014-2019 report, IBISWorld, Morgan Stanley Global Ecommerce report (Jan 2016), EY – The Retailer report (Jul-Sep 2015), ANZ Analysis
Note 1: Ages 14+ internet users who have purchased at least one item/service via online in a calendar year through any digital channel Note 3: For USA, forecast from Aug 2015; China excludes Hong Kong 31

Demand Analytics
32
THE EVOLVING AUSTRALIA CHINA WINE SUPPLY CHAIN: ACTIVE CHANNEL
S1
S2
S3
S4
S5
+
+
Active Supply Chain Facilitation
Product Transfer

33
THE EVOLVING AUSTRALIA CHINA MEAT SUPPLY CHAIN
Current State: Passive Supply Chain Participation
Market Intelligence
Future State: Active Supply Chain Participation to Create Sustainable

Thank You Michael Whitehead
34