october 2016 global catastrophe recap
TRANSCRIPT

Aon Benfield Analytics | Impact Forecasting
Global Catastrophe Recap October 2016
Risk. Reinsurance. Human Resources.
Aon Benfield Analytics | Impact Forecasting
Table of Contents Executive Summary 3
United States 4
Remainder of North America 4
South America 5
Europe 5
Africa 6
Asia 6
Oceania 7
Appendix 8
Contact Information 17
Global Catastrophe Recap: October 2016 2

Aon Benfield Analytics | Impact Forecasting
Executive Summary Hurricane Matthew leaves extensive Caribbean and US damage; USD15+ billion economic cost
Three powerful earthquakes struck central Italy in four days’ time; several villages flattened
Several tropical cyclones impacted portions of Asia leading to USD2.8 billion in economic damage
Hurricane Matthew brought considerable impacts to portions of the Southeast and Mid-Atlantic, including impacts resulting from riverine flooding in North Carolina that were felt for several weeks. The official death toll was 49, including 28 in North Carolina alone. Matthew caused major wind, storm surge, flash flood, and isolated tornado damage in several states including Florida, Georgia, South Carolina, North Carolina, and Virginia. The considerable damage occurred despite the storm only making its only US landfall as a minimum Category 1 storm in South Carolina. Total economic losses in the United States were anticipated to range up to a high of USD10 billion. Public and private insurance losses were considerably less, with preliminary estimates possibly as high as USD5.0 billion. A large portion of the inland flood loss in North Carolina went uninsured due to low NFIP take-up.
Matthew also brought devastating impacts to portions of the Caribbean and the Bahamas. The official death toll reached 552: 546 of who were in Haiti, though unofficial totals were as high as 1,600. Matthew caused economic damage of more than USD5.0 billion outside of the US: Cuba (USD2.6 billion), Haiti (USD1.9 billion), and the Bahamas (USD600 million).
Remnant moisture from Matthew would later bring flooding rain and high winds to parts of Atlantic Canada. Economic damages were expected to reach well in the 10s of millions (USD).
A series of strong earthquakes struck central Italy on October 26 (magnitude-5.5 and magnitude-6.1) and October 30 (magnitude-6.6) brought a fresh wave of damage and injuries to a region that was still in the midst of recovering from a major tremor in August. Just one fatality was reported, though dozens of people were injured. Catastrophic damage to several villages was reported as officials continued to take an official assessment to impacted areas, including several historical sites.
Super Typhoon Chaba caused widespread disruption and damage in South Korea claiming at least nine lives. Minor damage was also reported in Japan. The General Insurance Association of Korea announced that more than 33,100 claims were filed totaling KRW143 billion (USD126 million). Overall economic losses were much higher.
Tropical Storm Aere prompted widespread and significant flooding in central Vietnam. At least 31 people died and 122,000 homes were inundated. Significant damage to agricultural interests was reported. Typhoon Sarika and Super Typhoon Haima both made landfalls in the Philippines and China within one week. At least 16 people were killed and almost 115,000 homes were damaged or destroyed. Aggregated economic losses exceeded USD1.8 billion much of which was attributed to agricultural damage. Hurricane Nicole tracked within a few miles of Bermuda prompting damage to infrastructure, homes, and businesses.
Severe flooding in portions of Asia, Central America, and Egypt throughout October claimed at least 57 lives and damaged almost 210,000 homes while a powerful windstorm brought widespread damages to the Australian state of Victoria.
Global Catastrophe Recap: October 2016 3

Aon Benfield Analytics | Impact Forecasting
United States Date Event Location Deaths Structures/
Claims Economic
Loss (USD) 10/07-10/09 HU Matthew Southeast, Mid-Atlantic 49 500,000+ Up to 10 billion 10/12-10/16 Severe Weather Pacific Northwest 0 Hundreds 10s of millions Hurricane Matthew brought considerable impacts to portions of the Southeast and Mid-Atlantic from October 7-9, though impacts resulting from riverine flooding in North Carolina were felt for several weeks. The official death toll was 49, including 28 in North Carolina alone. Matthew caused major wind, storm surge, flash flood, and isolated tornado damage in several states including Florida, Georgia, South Carolina, North Carolina, and Virginia. The considerable damage occurred despite the storm only making its only US landfall as a minimum Category 1 storm in South Carolina. Total economic losses in the United States were anticipated to range up to a high of USD10 billion. Public and private insurance losses were considerably less, with preliminary estimates possibly as high as USD5.0 billion. A large portion of the inland flood loss in North Carolina went uninsured due to low NFIP take-up.
An active weather pattern brought multiple areas of low pressure to the Pacific Northwest from October 12-16, causing widespread damages in parts of Washington and Oregon. Tens of thousands of power outages occurred as the high winds downed trees and power lines. Additional damage resulted from 5 to 7 inches (127 to 254 millimeters) of rainfall spawning isolated reports of flooding and landslides. Two tornado touchdowns were noted in Oregon with most of the damage reported in the town of Manzanita.
Remainder of North America (Non-US) Date Event Location Deaths Structures/
Claims Economic
Loss (USD) 09/28-10/07 HU Matthew Caribbean 552+ 250,000+ 5.5+ billion
10/09-10/10 HU Matthew Canada 0 Thousands 10s of millions 10/13 HU Nicole Bermuda 0 Hundreds Millions 10/18-10/20 Flooding Central America 10 81,000+ Unknown Hurricane Matthew brought devastating impacts to portions of the Caribbean from the end of September into early October. The official death toll reached 552, of which 546 were in Haiti (though the final toll could be far higher). The storm caused major wind, storm surge, and flash flood damage in several countries in its path including the Bahamas, Hispaniola, Cuba, and northern regions of South America. It made separate landfalls in Haiti and Cuba at Category 4 intensity and caused catastrophic damage. Hundreds of thousands of homes and other structures were damaged or destroyed. Matthew caused economic damage of more than USD5.0 billion outside of the US: Cuba (USD2.6 billion), Haiti (USD1.9 billion), and the Bahamas (USD600 million). Insured losses were largely minimal in Cuba and Haiti, though the Bahamas insurance industry forecast a USD400 million loss – the costliest event in its history.
Portions of Atlantic Canada were lashed by a low pressure area, fuelled by the remnant tropical moisture of Hurricane Matthew, which brought significant heavy rainfall to parts of New Brunswick, Prince Edward Island, Nova Scotia, and Newfoundland on October 9-10. Despite widespread damage and disruption, there were no reports of fatalities. Officials in Cape Breton reported that damage to be well in the 10s of millions (CAD); while the repair bill for damages to roads alone in Newfoundland was expected to top CAD1.5 million (USD1.1 million).
Global Catastrophe Recap: October 2016 4
Aon Benfield Analytics | Impact Forecasting
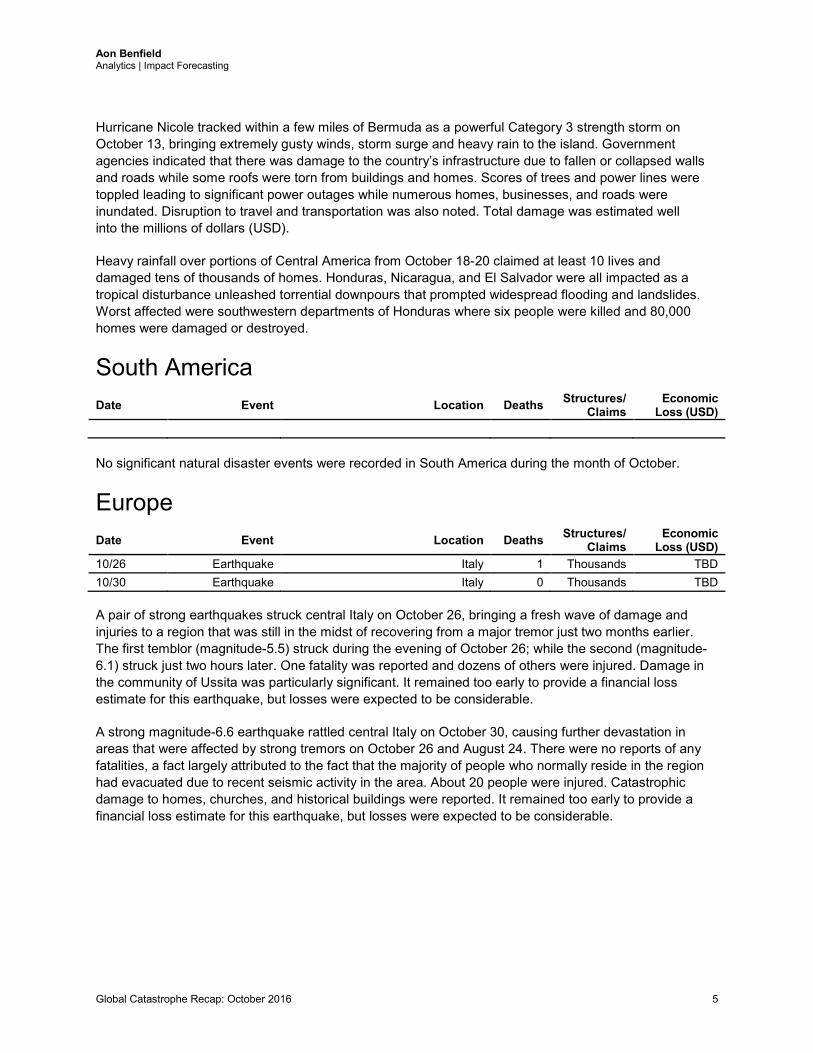
Hurricane Nicole tracked within a few miles of Bermuda as a powerful Category 3 strength storm on October 13, bringing extremely gusty winds, storm surge and heavy rain to the island. Government agencies indicated that there was damage to the country’s infrastructure due to fallen or collapsed walls and roads while some roofs were torn from buildings and homes. Scores of trees and power lines were toppled leading to significant power outages while numerous homes, businesses, and roads were inundated. Disruption to travel and transportation was also noted. Total damage was estimated well into the millions of dollars (USD).
Heavy rainfall over portions of Central America from October 18-20 claimed at least 10 lives and damaged tens of thousands of homes. Honduras, Nicaragua, and El Salvador were all impacted as a tropical disturbance unleashed torrential downpours that prompted widespread flooding and landslides. Worst affected were southwestern departments of Honduras where six people were killed and 80,000 homes were damaged or destroyed.
South America Date Event Location Deaths Structures/
Claims Economic
Loss (USD) No significant natural disaster events were recorded in South America during the month of October.
Europe Date Event Location Deaths Structures/
Claims Economic
Loss (USD) 10/26 Earthquake Italy 1 Thousands TBD 10/30 Earthquake Italy 0 Thousands TBD A pair of strong earthquakes struck central Italy on October 26, bringing a fresh wave of damage and injuries to a region that was still in the midst of recovering from a major tremor just two months earlier. The first temblor (magnitude-5.5) struck during the evening of October 26; while the second (magnitude-6.1) struck just two hours later. One fatality was reported and dozens of others were injured. Damage in the community of Ussita was particularly significant. It remained too early to provide a financial loss estimate for this earthquake, but losses were expected to be considerable.
A strong magnitude-6.6 earthquake rattled central Italy on October 30, causing further devastation in areas that were affected by strong tremors on October 26 and August 24. There were no reports of any fatalities, a fact largely attributed to the fact that the majority of people who normally reside in the region had evacuated due to recent seismic activity in the area. About 20 people were injured. Catastrophic damage to homes, churches, and historical buildings were reported. It remained too early to provide a financial loss estimate for this earthquake, but losses were expected to be considerable.
Global Catastrophe Recap: October 2016 5

Aon Benfield Analytics | Impact Forecasting
Africa Date Event Location Deaths Structures/
Claims Economic
Loss (USD) 10/27-10/29 Flooding Egypt 28 Thousands 11+ million Powerful thunderstorms in eastern portions of Egypt prompted flooding that claimed at least 26 lives from October 27-29. Lightning strikes claimed two other victims while a further 72 people were injured. The impacted governates were South Sinai, Red Sea, Sohag, Ismailia, and Beni Suef. The resort town of Ras Gharib, Red Sea, was among the worst-affected areas. Losses to homes and businesses in the affected areas were still being quantified. Authorities in Egypt allocated EGP100 million (USD11 million) for compensation of flood victims and urgent repairs to infrastructure.
Asia Date Event Location Deaths Structures/
Claims Economic
Loss (USD) 10/1-10/13 Flooding Thailand 4 88,000+ 10s of millions 10/05-10/06 TY Chaba South Korea, Japan 10 33,100+ 100s of millions 10/13-10/15 TS Aere Vietnam 31 122,250 10s of millions 10/16-10/19 TY Sarika Philippines, China 2 19,500+ 890+ million 10/19-10/21 STY Haima Philippines, China 14 95,000+ 945+ million 10/31-11/2 Flooding Vietnam 15 41,000+ 22+ million 10/31-11/2 Flooding China 0 Unknown 65+ million Widespread flooding was reported throughout Thailand following particularly heavy rainfall in the first two weeks of October. Seventeen provinces were affected with Ayutthaya and Nakhon Sawan, in Central Region, particularly badly affected. At least four people were killed and 28,000 homes were damaged in Nakhon Sawan; while more than 28,000 homes and numerous historical sites were affected in Ayutthaya. In total, almost 88,000 homes were affected in the country. Vast areas of farmland were also inundated.
Super Typhoon Chaba caused widespread disruption and damage in southern portions of Japan and South Korea as it grazed the countries on October 5-6. Southern South Korea was hardest-hit by Chaba which claimed at least nine lives, left one person missing, damaged 500 homes, and inundated 1,500 vehicles. Widespread damage was reported in Busan, Ulsan, and on Jeju Island. Minimal damages were reported in portions of Japan. In South Korea, more than 33,100 insurance claims were filed totaling almost KRW143 billion (USD126 million). Economic losses were expected to be much higher.
Tropical Storm Aere brought heavy rainfall to central portions of Vietnam from October 13-15 that caused widespread and significant flooding. At least 31 people died and 122,000 homes were inundated. Worst affected were Thừa Thiên-Huế, Quảng Trị, Quảng Bình, Hà Tĩnh, and Nghệ An provinces. More than 500,000 people were displaced and there were reports of significant damages to agricultural interests. Typhoon Sarika made one landfall in Philippines and two separate landfalls in southern China from October 16-19. The storm claimed two lives in the Philippines and caused significant damage to agricultural interests in the Chinese provinces of Hainan, Guangdong, and Guangxi. Economic damage estimates totaled nearly USD890 million – with a large portion of these attributed to agricultural losses.
Global Catastrophe Recap: October 2016 6
Aon Benfield Analytics | Impact Forecasting
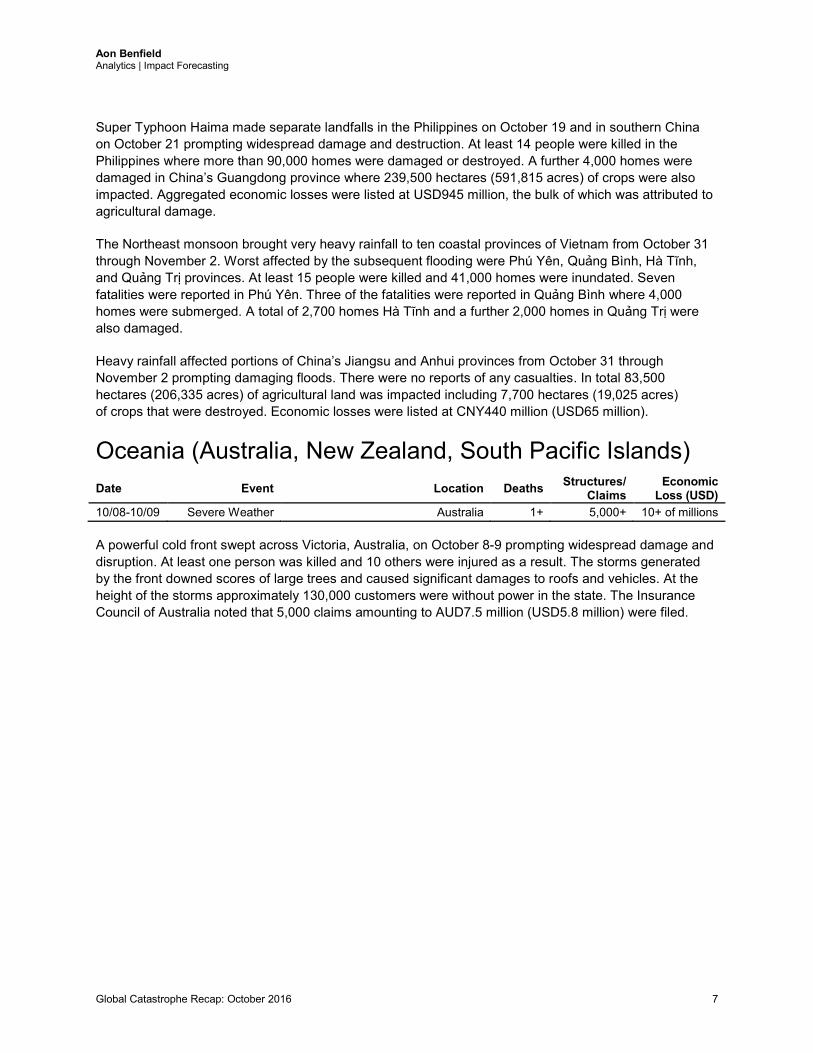
Super Typhoon Haima made separate landfalls in the Philippines on October 19 and in southern China on October 21 prompting widespread damage and destruction. At least 14 people were killed in the Philippines where more than 90,000 homes were damaged or destroyed. A further 4,000 homes were damaged in China’s Guangdong province where 239,500 hectares (591,815 acres) of crops were also impacted. Aggregated economic losses were listed at USD945 million, the bulk of which was attributed to agricultural damage.
The Northeast monsoon brought very heavy rainfall to ten coastal provinces of Vietnam from October 31 through November 2. Worst affected by the subsequent flooding were Phú Yên, Quảng Bình, Hà Tĩnh, and Quảng Trị provinces. At least 15 people were killed and 41,000 homes were inundated. Seven fatalities were reported in Phú Yên. Three of the fatalities were reported in Quảng Bình where 4,000 homes were submerged. A total of 2,700 homes Hà Tĩnh and a further 2,000 homes in Quảng Trị were also damaged.
Heavy rainfall affected portions of China’s Jiangsu and Anhui provinces from October 31 through November 2 prompting damaging floods. There were no reports of any casualties. In total 83,500 hectares (206,335 acres) of agricultural land was impacted including 7,700 hectares (19,025 acres) of crops that were destroyed. Economic losses were listed at CNY440 million (USD65 million).
Oceania (Australia, New Zealand, South Pacific Islands) Date Event Location Deaths Structures/
Claims Economic
Loss (USD) 10/08-10/09 Severe Weather Australia 1+ 5,000+ 10+ of millions A powerful cold front swept across Victoria, Australia, on October 8-9 prompting widespread damage and disruption. At least one person was killed and 10 others were injured as a result. The storms generated by the front downed scores of large trees and caused significant damages to roofs and vehicles. At the height of the storms approximately 130,000 customers were without power in the state. The Insurance Council of Australia noted that 5,000 claims amounting to AUD7.5 million (USD5.8 million) were filed.
Global Catastrophe Recap: October 2016 7
Aon Benfield Analytics | Impact Forecasting
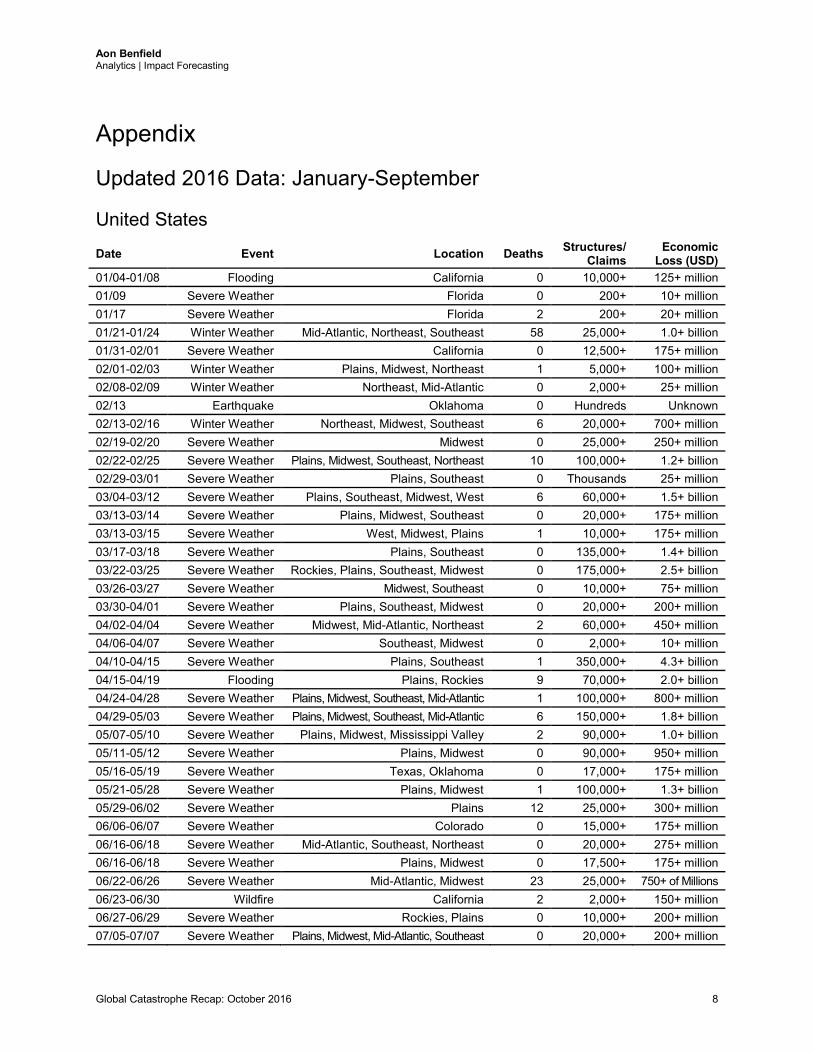
Appendix
Updated 2016 Data: January-September
United States
Date Event Location Deaths Structures/ Claims
Economic Loss (USD)
01/04-01/08 Flooding California 0 10,000+ 125+ million 01/09 Severe Weather Florida 0 200+ 10+ million 01/17 Severe Weather Florida 2 200+ 20+ million 01/21-01/24 Winter Weather Mid-Atlantic, Northeast, Southeast 58 25,000+ 1.0+ billion 01/31-02/01 Severe Weather California 0 12,500+ 175+ million 02/01-02/03 Winter Weather Plains, Midwest, Northeast 1 5,000+ 100+ million 02/08-02/09 Winter Weather Northeast, Mid-Atlantic 0 2,000+ 25+ million 02/13 Earthquake Oklahoma 0 Hundreds Unknown 02/13-02/16 Winter Weather Northeast, Midwest, Southeast 6 20,000+ 700+ million 02/19-02/20 Severe Weather Midwest 0 25,000+ 250+ million 02/22-02/25 Severe Weather Plains, Midwest, Southeast, Northeast 10 100,000+ 1.2+ billion 02/29-03/01 Severe Weather Plains, Southeast 0 Thousands 25+ million 03/04-03/12 Severe Weather Plains, Southeast, Midwest, West 6 60,000+ 1.5+ billion 03/13-03/14 Severe Weather Plains, Midwest, Southeast 0 20,000+ 175+ million 03/13-03/15 Severe Weather West, Midwest, Plains 1 10,000+ 175+ million 03/17-03/18 Severe Weather Plains, Southeast 0 135,000+ 1.4+ billion 03/22-03/25 Severe Weather Rockies, Plains, Southeast, Midwest 0 175,000+ 2.5+ billion 03/26-03/27 Severe Weather Midwest, Southeast 0 10,000+ 75+ million 03/30-04/01 Severe Weather Plains, Southeast, Midwest 0 20,000+ 200+ million 04/02-04/04 Severe Weather Midwest, Mid-Atlantic, Northeast 2 60,000+ 450+ million 04/06-04/07 Severe Weather Southeast, Midwest 0 2,000+ 10+ million 04/10-04/15 Severe Weather Plains, Southeast 1 350,000+ 4.3+ billion 04/15-04/19 Flooding Plains, Rockies 9 70,000+ 2.0+ billion 04/24-04/28 Severe Weather Plains, Midwest, Southeast, Mid-Atlantic 1 100,000+ 800+ million 04/29-05/03 Severe Weather Plains, Midwest, Southeast, Mid-Atlantic 6 150,000+ 1.8+ billion 05/07-05/10 Severe Weather Plains, Midwest, Mississippi Valley 2 90,000+ 1.0+ billion 05/11-05/12 Severe Weather Plains, Midwest 0 90,000+ 950+ million 05/16-05/19 Severe Weather Texas, Oklahoma 0 17,000+ 175+ million 05/21-05/28 Severe Weather Plains, Midwest 1 100,000+ 1.3+ billion 05/29-06/02 Severe Weather Plains 12 25,000+ 300+ million 06/06-06/07 Severe Weather Colorado 0 15,000+ 175+ million 06/16-06/18 Severe Weather Mid-Atlantic, Southeast, Northeast 0 20,000+ 275+ million 06/16-06/18 Severe Weather Plains, Midwest 0 17,500+ 175+ million 06/22-06/26 Severe Weather Mid-Atlantic, Midwest 23 25,000+ 750+ of Millions 06/23-06/30 Wildfire California 2 2,000+ 150+ million 06/27-06/29 Severe Weather Rockies, Plains 0 10,000+ 200+ million 07/05-07/07 Severe Weather Plains, Midwest, Mid-Atlantic, Southeast 0 20,000+ 200+ million
Global Catastrophe Recap: October 2016 8

Aon Benfield Analytics | Impact Forecasting
Date Event Location Deaths Structures/ Claims
Economic Loss (USD)
07/07-07/09 Severe Weather Rockies, Midwest, Southeast 0 40,000+ 375+ million 07/13-07/15 Severe Weather Rockies, Plains, Midwest, Southeast 7 50,000+ 500+ million 07/19-07/21 Severe Weather Midwest, Ohio Valley 3 10,000+ 125+ million 07/20-07/21 Severe Weather Midwest 0 10,000+ 140+ million 07/22-08/01 Wildfire California 2 250+ 100+ million 07/22-09/30 Wildfire California 1 100+ 250+ million 07/28-07/29 Severe Weather Rockies, Plains 0 115,000+ 1.6+ billion 07/30-08/01 Flooding Mid-Atlantic, Northeast 2 15,000+ 700+ million 08/02-08/04 Flooding Desert Southwest 0 Thousands 10s of millions 08/09-08/16 Flooding Louisiana, Mississippi, MS Valley 13 250,000+ 10 to 15 billion 08/13-08/31 Wildfires West 0 Thousands 100+ million 08/13-08/31 Wildfire California 0 2,000+ 100+ million 08/16-08/31 Wildfire California 0 2,000+ 100+ million 08/23-08/24 Flooding Midwest 1 Thousands 100+ million 08/24-08/25 Severe Weather Midwest 0 3,500+ 125+ million 09/01-09/08 HU Hermine Southeast, Mid-Atlantic 3 50,000+ 800+ million 09/03 Earthquake Oklahoma 0 Hundreds 10s of millions 09/21-09/30 Flooding Iowa, Wisconsin, Minnesota 1 30,000+ 550+ million
Global Catastrophe Recap: October 2016 9

Aon Benfield Analytics | Impact Forecasting
Remainder of North America (Non-US)
Date Event Location Deaths Structures/ Claims
Economic Loss (USD)
01/01-02/29 Drought Haiti 0 Unknown 84+ million 02/23-02/25 Winter Weather Canada 0 5,000+ 25+ million 02/28 Flooding Haiti 5 10,000+ Millions 03/09-03/10 Severe Weather Canada 1 5,000+ 50+ million 03/24-03/25 Winter Weather Canada 0 10,000+ 100+ million 04/23-04/24 Flooding Haiti 6 4,400+ Unknown 04/27-05/01 Flooding Haiti, Dominican Republic 1 2,500+ Millions 05/02-05/31 Wildfire Canada 0 35,000+ 5.0+ billion 05/26-05/31 Flooding Haiti 1 2,900+ Unknown 06/09 Earthquake Nicaragua, Honduras 0 3,000+ Millions 06/24-06/25 Severe Weather Canada 0 4,000+ 44+ million 06/28-06/30 Severe Weather Canada 0 8,500+ 85+ million 07/08 Severe Weather Canada 0 5,000+ 40+ million 07/08-07/11 Severe Weather Canada 0 5,000+ 50+ million 07/15-07/16 Severe Weather Canada 0 7,000+ 80+ million 07/18-07/20 Severe Weather Canada 0 10,000+ 100+ million 07/22 Severe Weather Canada 0 5,000+ 95+ million 07/27 Severe Weather Canada 0 7,000+ 67+ million 07/30-08/01 Severe Weather Canada 0 42,000+ 435+ million 08/02-08/10 HU Earl Mexico, Central America, Caribbean 67 15,000+ 250+ million 09/06-09/08 HU Newton Mexico 11 2,000+ 50+ million 09/14-09/18 Flooding Mexico 13 2,000+ Unknown 09/28-09/30 Flooding Canada 0 6,000+ 150+ million 09/29-09/30 Flooding Mexico 5 2,000+ 10s of millions
South America
Date Event Location Deaths Structures/ Claims
Economic Loss (USD)
01/01-01/25 Flooding Ecuador 9 2,000+ 10+ million 01/09-01/15 Flooding Brazil 3 25,000+ 100+ million 02/20-02/25 Flooding Peru 1 2,000+ Millions 03/10-03/11 Flooding Brazil 30 5,000+ 100+ million 04/04-04/10 Flooding Argentina, Uruguay 0 7,500+ 1.3+ billion 04/15-04/18 Flooding Chile 12 5,000+ 100+ million 04/15-04/18 Severe Weather Uruguay 8 5,000+ 25+ million 04/16 Earthquake Ecuador 673 10,000+ 3.4+ billion 08/14 Earthquake Peru 4 2,600+ Unknown
Global Catastrophe Recap: October 2016 10
Aon Benfield Analytics | Impact Forecasting
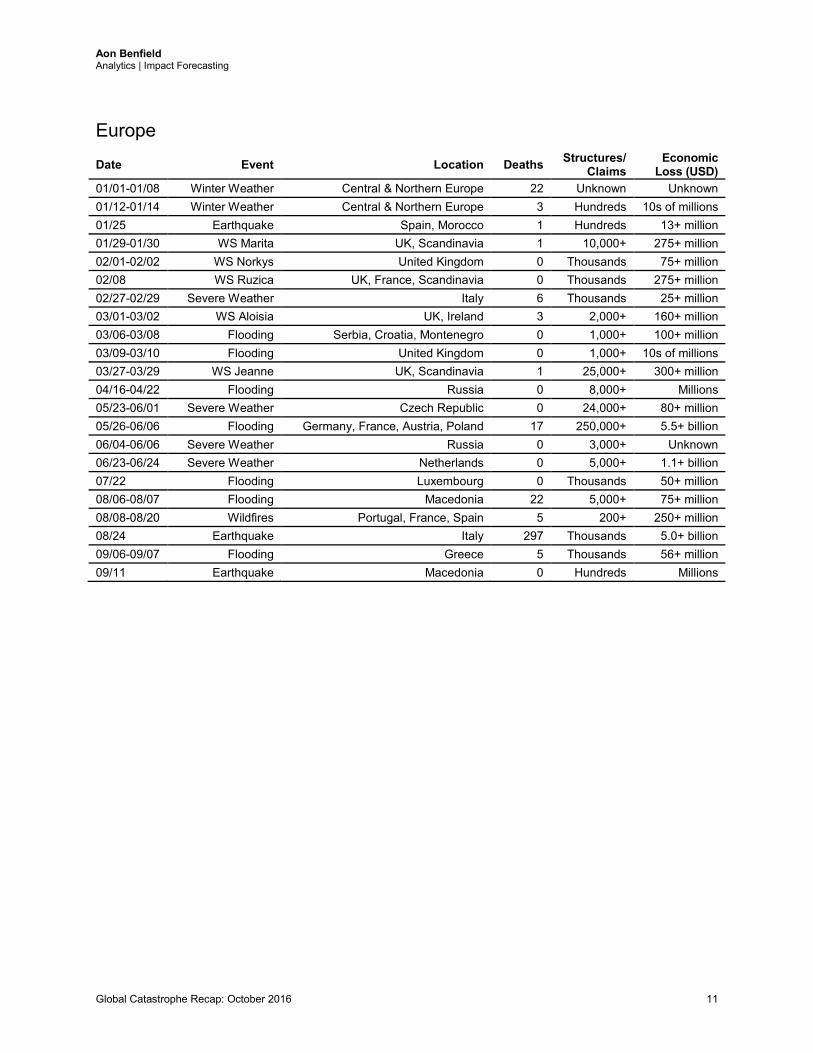
Europe
Date Event Location Deaths Structures/ Claims
Economic Loss (USD)
01/01-01/08 Winter Weather Central & Northern Europe 22 Unknown Unknown 01/12-01/14 Winter Weather Central & Northern Europe 3 Hundreds 10s of millions 01/25 Earthquake Spain, Morocco 1 Hundreds 13+ million 01/29-01/30 WS Marita UK, Scandinavia 1 10,000+ 275+ million 02/01-02/02 WS Norkys United Kingdom 0 Thousands 75+ million 02/08 WS Ruzica UK, France, Scandinavia 0 Thousands 275+ million 02/27-02/29 Severe Weather Italy 6 Thousands 25+ million 03/01-03/02 WS Aloisia UK, Ireland 3 2,000+ 160+ million 03/06-03/08 Flooding Serbia, Croatia, Montenegro 0 1,000+ 100+ million 03/09-03/10 Flooding United Kingdom 0 1,000+ 10s of millions 03/27-03/29 WS Jeanne UK, Scandinavia 1 25,000+ 300+ million 04/16-04/22 Flooding Russia 0 8,000+ Millions 05/23-06/01 Severe Weather Czech Republic 0 24,000+ 80+ million 05/26-06/06 Flooding Germany, France, Austria, Poland 17 250,000+ 5.5+ billion 06/04-06/06 Severe Weather Russia 0 3,000+ Unknown 06/23-06/24 Severe Weather Netherlands 0 5,000+ 1.1+ billion 07/22 Flooding Luxembourg 0 Thousands 50+ million 08/06-08/07 Flooding Macedonia 22 5,000+ 75+ million 08/08-08/20 Wildfires Portugal, France, Spain 5 200+ 250+ million 08/24 Earthquake Italy 297 Thousands 5.0+ billion 09/06-09/07 Flooding Greece 5 Thousands 56+ million 09/11 Earthquake Macedonia 0 Hundreds Millions
Global Catastrophe Recap: October 2016 11

Aon Benfield Analytics | Impact Forecasting
Africa
Date Event Location Deaths Structures/ Claims
Economic Loss (USD)
01/01-01/10 Heatwave South Africa 11 Unknown Unknown 01/01-02/15 Flooding Burundi 52 5,100+ 13+ million 01/01-03/31 Drought Namibia 0 Unknown 60+ million 01/01-06/30 Drought South Africa 0 Unknown 250+ million 01/01-06/30 Drought Zimbabwe 0 Unknown 1.6+ billion 02/29 Flooding Angola 54 Thousands Unknown 03/06-03/09 Flooding Angola 6 550+ Unknown 03/10 Flooding Kenya 3 1,000+ Unknown 04/02-04/07 Flooding Ethiopia 28 1,000+ Unknown 04/06-04/11 Flooding Somalia, Malawi 19 10,000+ Millions 04/12-04/18 Flooding Tanzania 3 3,000+ Unknown 04/13-04/17 Flooding Uganda 0 5,000+ 2.7+ million 04/16-04/22 Flooding Angola 19 5,000+ Unknown 04/29-05/02 Flooding Kenya 39 2,000+ Unknown 05/07-05/08 Landslide Rwanda 50 500+ Unknown 05/09 Landslide Ethiopia 100 Unknown Unknown 06/01-07/31 Flooding Niger 14 2,000+ Unknown 06/13 Flooding Ghana 10 Unknown Unknown 07/01-08/31 Flooding Sudan, South Sudan 129+ 41,000+ Unknown 07/12-08/09 Flooding Mali, Burkina Faso 26 10,000+ Unknown 07/13-07/15 Flooding Sudan 13 2,000+ Unknown 07/27 Severe Weather South Africa 7 Thousands 250+ million 08/14-09/07 Severe Weather Nigeria 28 15,000+ Unknown 09/10 Earthquake Tanzania 23 16,500+ 458+ million 09/20 Flooding Nigeria 29 17,500+ Unknown
Global Catastrophe Recap: October 2016 12

Aon Benfield Analytics | Impact Forecasting
Asia
Date Event Location Deaths Structures/ Claims
Economic Loss (USD)
01/01-03/31 Drought Philippines 0 Unknown 41+ million 01/01-06/30 Drought India 0 Unknown 5.0+ billion 01/01-06/30 Drought Vietnam 0 Unknown 675+ million 01/01-06/30 Drought Thailand 0 Unknown 3.3+ million 01/03 Earthquake India 22 1,000+ 75+ million 01/21 Earthquake China 0 2,200+ 15+ million 01/20-01/26 Winter Weather China, Taiwan, Korea, Japan, Thailand 116 25,000+ 2.0+ billion 01/26-01/29 Flooding China 11 1,000+ 20+ million 02/01-05/02 Wildfire India, Nepal 18 Unknown Unknown 02/03 Winter Weather India 10 Unknown Unknown 02/05-02/09 Flooding Indonesia 6 4,000+ Millions 02/06 Earthquake Taiwan 117 Thousands 750+ million 02/18-02/19 Severe Weather China 0 1,600+ 62+ million 02/19-02/24 Flooding Indonesia, Malaysia 1 7,200+ Millions 02/21-02/26 Winter Weather China 0 1,000+ 15+ million 03/03-03/09 Severe Weather China 0 4,000+ 315+ million 03/07-03/08 Flooding Indonesia 6 2,500+ Unknown 03/07-03/11 Winter Weather China 0 1,000+ 140+ million 03/08-03/11 Severe Weather United Arab Emirates, Oman 0 15,000+ 500+ million 03/09-03/29 Flooding Pakistan 141 1,100+ Millions 03/13 Flooding Indonesia 5 5,900+ Unknown 03/19-03/22 Severe Weather China 13 82,000+ 170+ million 03/25-03/28 Severe Weather China 0 2,000+ 77+ million 03/26-03/29 Winter Weather China 0 Unknown 146+ million 04/01-04/08 Flooding China 10 30,000+ 45+ million 04/01-04/15 Heatwave India 300 Unknown Unknown 04/02-04/08 Flooding Pakistan, Afghanistan 152 5,000+ Millions 04/08-04/15 Flooding Saudi Arabia, Yemen, Oman 47 25,000+ 100+ million 04/10-04/12 Severe Weather China 8 22,000+ 130+ million 04/13 Earthquake Myanmar, Bangladesh, India 2 Hundreds Unknown 04/14 & 04/16 Earthquake Japan 120 260,000+ 38+ billion 04/16-04/17 Flooding Afghanistan 31 Unknown Unknown 04/16-04/19 Severe Weather China 6 2,000+ 14+ million 04/20-04/28 Flooding China 20 16,000+ 97+ million 04/21-04/23 Severe Weather Myanmar 8 10,000+ Millions 04/22-04/25 Flooding India 18 Thousands 150+ million 04/24-04/27 Severe Weather China 0 2,000+ 216+ million 04/28-05/03 Flooding China 3 6,000+ 31+ million 04/29-05/03 Severe Weather Myanmar 18 17,900+ 2.6+ million 05/01-05/05 Severe Weather China 4 31,500+ 115+ million 05/01-08/31 Flooding China 475 500,000+ 28+ billion 05/09-05/12 Flooding Tajikistan, Afghanistan 10 5,000+ Unknown
Global Catastrophe Recap: October 2016 13
Aon Benfield Analytics | Impact Forecasting
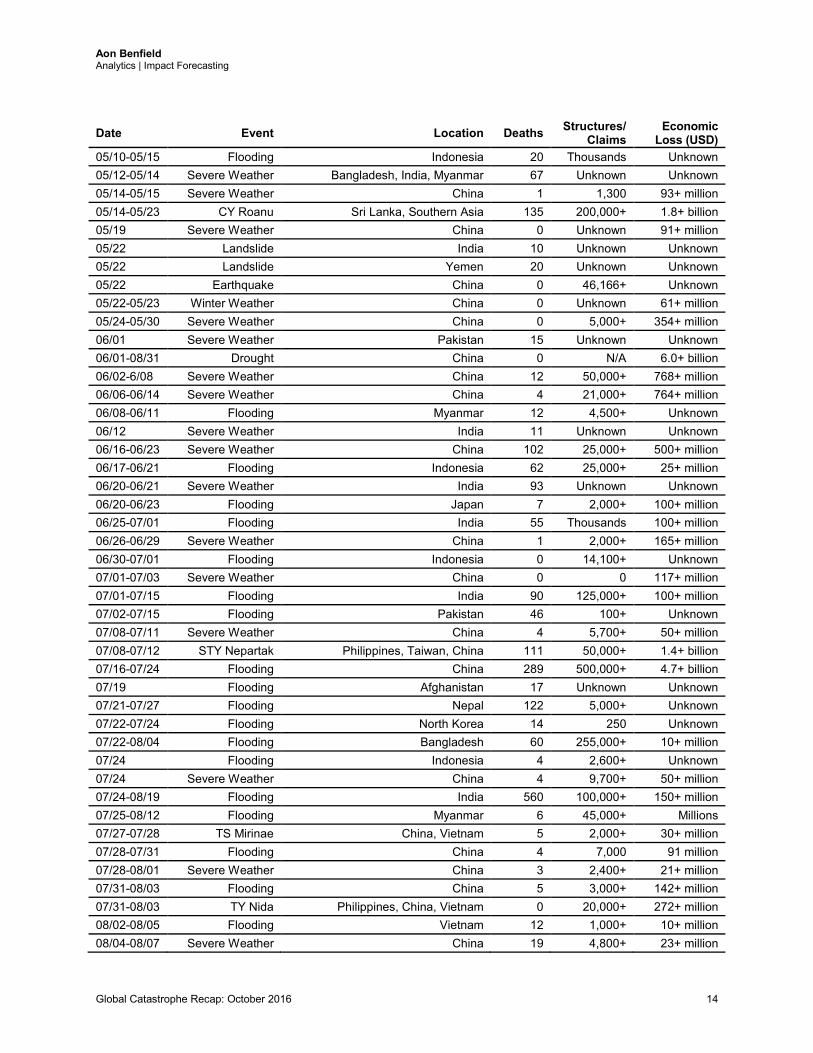
Date Event Location Deaths Structures/ Claims
Economic Loss (USD)
05/10-05/15 Flooding Indonesia 20 Thousands Unknown 05/12-05/14 Severe Weather Bangladesh, India, Myanmar 67 Unknown Unknown 05/14-05/15 Severe Weather China 1 1,300 93+ million 05/14-05/23 CY Roanu Sri Lanka, Southern Asia 135 200,000+ 1.8+ billion 05/19 Severe Weather China 0 Unknown 91+ million 05/22 Landslide India 10 Unknown Unknown 05/22 Landslide Yemen 20 Unknown Unknown 05/22 Earthquake China 0 46,166+ Unknown 05/22-05/23 Winter Weather China 0 Unknown 61+ million 05/24-05/30 Severe Weather China 0 5,000+ 354+ million 06/01 Severe Weather Pakistan 15 Unknown Unknown 06/01-08/31 Drought China 0 N/A 6.0+ billion 06/02-6/08 Severe Weather China 12 50,000+ 768+ million 06/06-06/14 Severe Weather China 4 21,000+ 764+ million 06/08-06/11 Flooding Myanmar 12 4,500+ Unknown 06/12 Severe Weather India 11 Unknown Unknown 06/16-06/23 Severe Weather China 102 25,000+ 500+ million 06/17-06/21 Flooding Indonesia 62 25,000+ 25+ million 06/20-06/21 Severe Weather India 93 Unknown Unknown 06/20-06/23 Flooding Japan 7 2,000+ 100+ million 06/25-07/01 Flooding India 55 Thousands 100+ million 06/26-06/29 Severe Weather China 1 2,000+ 165+ million 06/30-07/01 Flooding Indonesia 0 14,100+ Unknown 07/01-07/03 Severe Weather China 0 0 117+ million 07/01-07/15 Flooding India 90 125,000+ 100+ million 07/02-07/15 Flooding Pakistan 46 100+ Unknown 07/08-07/11 Severe Weather China 4 5,700+ 50+ million 07/08-07/12 STY Nepartak Philippines, Taiwan, China 111 50,000+ 1.4+ billion 07/16-07/24 Flooding China 289 500,000+ 4.7+ billion 07/19 Flooding Afghanistan 17 Unknown Unknown 07/21-07/27 Flooding Nepal 122 5,000+ Unknown 07/22-07/24 Flooding North Korea 14 250 Unknown 07/22-08/04 Flooding Bangladesh 60 255,000+ 10+ million 07/24 Flooding Indonesia 4 2,600+ Unknown 07/24 Severe Weather China 4 9,700+ 50+ million 07/24-08/19 Flooding India 560 100,000+ 150+ million 07/25-08/12 Flooding Myanmar 6 45,000+ Millions 07/27-07/28 TS Mirinae China, Vietnam 5 2,000+ 30+ million 07/28-07/31 Flooding China 4 7,000 91 million 07/28-08/01 Severe Weather China 3 2,400+ 21+ million 07/31-08/03 Flooding China 5 3,000+ 142+ million 07/31-08/03 TY Nida Philippines, China, Vietnam 0 20,000+ 272+ million 08/02-08/05 Flooding Vietnam 12 1,000+ 10+ million 08/04-08/07 Severe Weather China 19 4,800+ 23+ million
Global Catastrophe Recap: October 2016 14

Aon Benfield Analytics | Impact Forecasting
Date Event Location Deaths Structures/ Claims
Economic Loss (USD)
08/05-08/08 Flooding Pakistan 32 580+ Unknown 08/05-08/10 Flooding China 23 12,300+ 130+ million 08/07-08/10 Flooding India 13 15,000+ 10s of millions 08/08-08/16 Flooding Philippines 26 Thousands 10+ million 08/15-08/16 Flooding Thailand 3 7,500+ Millions 08/18-08/22 TS Dianmu China, Vietnam 17 4,100+ 273+ million 08/19-08/22 Flooding India 40 10,000+ 312+ million 08/20-08/25 Flooding China 2 11,400+ 96+ million 08/20-08/25 Flooding China 2 12,000+ 165+ million 08/20-08/25 Severe Weather China 0 400+ 70+ million 08/22-08/23 TS Mindulle Japan 2 5,000+ 10s of millions 08/24 Earthquake Myanmar 4 1,000+ 1.0+ million 08/26-08/30 Flooding China 8 8,400+ 76+ million 08/27-08/28 Flooding Pakistan 10 Unknown Unknown 08/30-09/01 TY Lionrock Japan, China, Korean Peninsula 550+ 50,000+ 325+ million 09/04-09/06 Severe Weather China 2 5,000+ 69+ million 09/05-09/06 Severe Weather China 0 6,400+ 54+ million 09/08-09/13 Severe Weather China 0 2,000+ 175+ million 09/12 Earthquake South Korea 0 6,000+ 21+ million 09/14-09/16 STY Meranti China, Taiwan, Philippines 44 70,600+ 2.5+ billion 09/18-09/22 Flooding China 23 4,100+ 21+ million 09/19-09/22 TY Malakas Taiwan, Japan 1 5,000+ 300+ million 09/20-09/22 Flooding Indonesia 53 2,550+ 22+ million 09/21-09/29 Flooding India 28 40,000+ 479+ million 09/26-09/29 TY Megi China, Taiwan 43 25,000+ 940+ million
Oceania (Australia, New Zealand, South Pacific Islands)
Date Event Location Deaths Structures/ Claims
Economic Loss (USD)
01/03-01/05 Flooding Australia (NSW) 0 500 25+ million 01/06-01/13 Bushfire Australia (WA) 2 1,400+ 100+ million 01/14 Severe Weather Australia (NSW) 1 2,000+ 25+ million 01/29-01/30 Severe Weather Australia (NSW) 0 1,300+ 27+ million 02/14 Earthquake New Zealand 0 7,200+ 50+ million 02/16-02/22 TC Winston Fiji, Tonga 44 46,000+ 1.4+ billion 03/23-03/24 Flooding New Zealand 0 2,000+ 25+ million 04/04-04/07 CY Zena Fiji 2 2,000+ 10s of millions 06/04-06/06 Severe Weather Australia 4 43,500+ 375+ million 07/16-07/17 Severe Weather Australia (South Australia & Victoria) 0 Thousands 20+ million 08/22 Earthquake Australia (Queensland) 0 1,000+ Millions 09/13-09/15 Flooding Australia (SA, VIC) 1 2,000+ 10+ million 09/20-09/30 Flooding Australia (NSW) 0 2,300+ 765+ million 09/28-09/30 Severe Weather Australia (SA) 0 5,000+ 75+ million
Global Catastrophe Recap: October 2016 15

Aon Benfield Analytics | Impact Forecasting
Additional Report Details TD = Tropical Depression, TS = Tropical Storm, HU = Hurricane, TY = Typhoon, STY = Super Typhoon, CY = Cyclone Fatality estimates as reported by public news media sources and official government agencies. Structures defined as any building – including barns, outbuildings, mobile homes, single or multiple family dwellings, and commercial facilities – that is damaged or destroyed by winds, earthquakes, hail, flood, tornadoes, hurricanes or any other natural-occurring phenomenon. Claims defined as the number of claims (which could be a combination of homeowners, commercial, auto and others) reported by various public and private insurance entities through press releases or various public media outlets. Damage estimates are obtained from various public media sources, including news websites, publications from insurance companies, financial institution press releases and official government agencies. Damage estimates are obtained from various public media sources, including news websites, publications from insurance companies, financial institution press releases and official government agencies. Economic loss totals include any available insured loss estimates, which can be found in the corresponding event text.
Global Catastrophe Recap: October 2016 16

Aon Benfield Analytics | Impact Forecasting
Contact Information Adam Podlaha Head of Impact Forecasting Aon Benfield Analytics Impact Forecasting +44 (0) 20 7522 3820 [email protected] Steve Bowen Director / Meteorologist Aon Benfield Analytics Impact Forecasting +1.312.381.5883 [email protected] Claire Darbinyan Senior Analyst / Meteorologist Aon Benfield Analytics Impact Forecasting +65.6645.0110 [email protected] Michal Lörinc Catastrophe Analyst Aon Benfield Analytics Impact Forecasting +420.234.618.358 [email protected]
Global Catastrophe Recap: October 2016 17

Aon Benfield Analytics | Impact Forecasting
About Aon Benfield
Aon Benfield, a division of Aon plc (NYSE: AON), is the world’s leading reinsurance intermediary and full-service capital advisor. We empower our clients to better understand, manage and transfer risk through innovative solutions and personalized access to all forms of global reinsurance capital across treaty, facultative and capital markets. As a trusted advocate, we deliver local reach to the world’s markets, an unparalleled investment in innovative analytics, including catastrophe management, actuarial and rating agency advisory. Through our professionals’ expertise and experience, we advise clients in making optimal capital choices that will empower results and improve operational effectiveness for their business. With more than 80 offices in 50 countries, our worldwide client base has access to the broadest portfolio of integrated capital solutions and services. To learn how Aon Benfield helps empower results, please visit aonbenfield.com. Copyright © by Impact Forecasting® No claim to original government works. The text and graphics of this publication are provided for informational purposes only. While Impact Forecasting® has tried to provide accurate and timely information, inadvertent technical inaccuracies and typographical errors may exist, and Impact Forecasting® does not warrant that the information is accurate, complete or current. The data presented at this site is intended to convey only general information on current natural perils and must not be used to make life-or-death decisions or decisions relating to the protection of property, as the data may not be accurate. Please listen to official information sources for current storm information. This data has no official status and should not be used for emergency response decision-making under any circumstances. Cat Alerts use publicly available data from the internet and other sources. Impact Forecasting® summarizes this publicly available information for the convenience of those individuals who have contacted Impact Forecasting® and expressed an interest in natural catastrophes of various types. To find out more about Impact Forecasting or to sign up for the Cat Reports, visit Impact Forecasting’s webpage at impactforecasting.com. Copyright © by Aon plc.
All rights reserved. No part of this document may be reproduced, stored in a retrieval system, or transmitted in any form or by any means, electronic, mechanical, photocopying, recording or otherwise. Impact Forecasting® is a wholly owned subsidiary of Aon plc.
Global Catastrophe Recap: October 2016 18