october - december 2017 quarterly report - hse.ie · childhood hearing impairment. a care pathway...
TRANSCRIPT

Performance Profile
October - December 2017
Quarterly Report

Health Service Performance Profile – October to December 2017 Quarterly Report 2
Contents
Corporate Updates .................................................................................................................................................. 3
Quality and Patient Safety ..................................................................................................................................... 10
Performance Overview .......................................................................................................................................... 13
Health and Wellbeing ......................................................................................................................................... 14
Primary Care ...................................................................................................................................................... 21
Mental Health ..................................................................................................................................................... 29
Social Care ......................................................................................................................................................... 34
Social Care - Disabilities .................................................................................................................................... 36
Social Care – Older Persons ............................................................................................................................. 42
National Ambulance Service .............................................................................................................................. 48
Acute Hospitals .................................................................................................................................................. 52
Finance .................................................................................................................................................................. 64
Human Resources ................................................................................................................................................. 71
Escalation Report .................................................................................................................................................. 75
Appendices ............................................................................................................................................................ 87
Appendix 1: Performance and Accountability Framework ................................................................................. 88
Appendix 2: Data Coverage Issues ................................................................................................................... 89
Appendix 3: Hospital Groups ............................................................................................................................. 91
Appendix 4: Community Health Organisations .................................................................................................. 92

Health Service Performance Profile — October to December 2017 Quarterly Report 3
Corporate Updates

Health Service Performance Profile – October to December 2017 Quarterly Report 4
Clinical Strategy and Programmes
The following is an end of year brief update on progress against the priorities and priority actions from the
National Service Plan.
Progress on the establishment and development of the Integrated Care Programmes (ICP)
2018 Programme plans for each of the ICP‟s have been approved by SMT
The ICP Older People is progressing the Implementation of the 10 Step Framework at 6 existing Pioneer
sites and on the development of 6 new sites using the 10 Step Framework. Integrated care teams were
recruited in 5 new sites and governance arrangements were put in place with a 6th site commencing early
2018. An Implementation Guidance document was launched; 'Making a Start in Integrated Care for Older
Persons'. This provided guidance to local governance groups, clinicians and managers to implement
integrated care.
The ICP for Chronic Disease have established their national and local governance structures to support the
development and implementation of the Programme. On-going work in the 24 integrated care active sites
across the country, where an integrated care approach for chronic disease is being tested, with staff
delivering care between the community and acute settings. The programme has also launched the National
Framework for Self-Management Support and a National Framework for Making Every Contact Count
The ICP Patient Flow programme has progressed a number of initiatives that aim to improve patient flow
through: improved discharge processes; application of operations management, best practice and quality
improvement methodologies, including the National Patient Flow Improvement Programme (being tested in
two proof of concept sites: Galway University Hospitals and University Hospital Limerick before phased
national rollout). In 2017, the programme established the ICP-PF steering group. National Patient Flow
Improvement Programmes were set up in both proof of concept sites with Programme Lead, Clinical Lead
and Data Analyst roles in post. Phase 1 of the Transforming Urgent and Emergency Care Project (UEC)
was completed in September 2017 and it delivered a validated blueprint for our UEC system and highlights
the necessary components for an effective UEC system. Phase 2 is also well progressed, expanding on
each of the components identified in the blueprint and how these can be translated into care for the
population, ranging from prevention to acute episodes of care
The ICP Children have progressed a number of service improvement initiatives. As part of the Waterford
Paediatric initiative, two of the three consultant paediatrician posts have been offered with the successful
incumbents due to commence in quarter 1 2018. Implementation of the hip ultrasound screening
programme has commenced in 8 sites during 2017 and is operational in 5/8 sites. An integrated care
pathway is being developed for children with neuromuscular disorders as well as infants with a permanent
childhood hearing impairment. A care pathway for hepatitis B in the perinatal period has been completed.
The Programme is also progressing the design of an implementation plan for the National Model of Care for
Paediatric Healthcare Services.
Progress on developing further clinical programme models of care (MoC)
Within the NSP 2017 Clinical Strategy and Programmes aim to develop further service shaping documents such
as models of care, guidelines and pathway, and support implementation of same across Hospital Groups and
CHOs.
In 2017, the following models of care have been designed and there are a number of models of care that are
nearing completion in 2018:
NCP for Paediatrics and Neonatology
NCP for Rehabilitation Medicine
NCP for Eating Disorders
Progress on developing and implementing the Patient Narrative Project to guide the delivery of
integrated services in order to create improved patient experience and outcomes.
Development and pilot of the Your Voice Matters framework which enables co-production in health and social
care through the collation, and analysis of a high volume of patient and service user voices in a systematic way
to be used to influence the design, delivery and improvement of integrated care at national and local levels was
delivered in 2017.

Health Service Performance Profile – October to December 2017 Quarterly Report 5
Your Voice Matters, an innovative means to find out the extent to which person-centred coordinated care
indicators developed by patients in May 2017, are experienced by health service users in their journeys across
and within services was completed in Q3 and Q4 2017. The survey had 584 respondents which focused on the
Integrated Care Programmes for Older Persons and the Prevention and Management of Chronic Conditions.
Office of Nursing and Midwifery Services Director (ONMSD)
The following is an end of year update on progress against the priorities and priority actions from the National
Service Plan.
Nurses and midwives with authority to prescribe
Within NSP 2017 the Office of Nursing and Midwifery services priorities where to provide an increase to 940
the number of nurses and midwives with authority to provide medicines and increase to 310 the number of
nurses and midwives with authority to prescribe ionising radiation (x-ray).
2016
Baseline
Additional
YTD 2017
Total at end of
Dec 2017
Target
2017
Status
Medicine 870 120 990 940 Exceeded the target
Ionising 287 33 320 310 Exceeded the target
Caring Behaviours System for Ireland (CBAS-I)
Throughout 2017 the Caring Behaviours Assurance System-Ireland programme has been expanded to the
Midland Regional Hospital Portlaoise and Naas General Hospital. A total of 30 quality champions have been
trained from these hospitals. Second CBAS-I programmes were facilitated in Galway University Hospital and
Portiuncula University Hospital. A total of 25 new quality champions were trained from these sites. Planning
commenced for further expansion of the programme to University Maternity Hospital, Limerick.
Framework for staffing and Skill Mix for Nursing Update
Project ongoing in three sites as directed by DoH (Beaumont Hospital - Dublin, Our Lady of Lourdes
Hospital, Drogheda and St Columcilles Hospital, Loughlinstown). Further extension of the pilot to 10
additional wards on the 3 existing sites as directed by the Taskforce steering group undertaken in Q4 2017.
Research into the project continues – led by Professor Jonathan Drennan in UCC. The following four
components are being measured using both administrative and cross-sectional data:
o Patient outcomes
o Nurse staffing
o Nurse workload
o Working environment
Policy Development – Candidate ANP Recruitment
125 cANP‟s recruited to the Demonstrator Sites and are undertaking the education programme at NUIG, UCD,
UCC and TCD.
Breakdown by Speciality
Older Persons X 42
Respiratory X 20
Rheumatology X 23
Unscheduled Care X 39
Chronic Disease X 1
Quality Care Metrics
Metrics and their respective indicators have been finalised for the following care areas – acute, midwifery,
children‟s, older people, public health and community nursing, mental health and intellectual disability. A total of
95 metrics and 544 indicators will be uploaded to the Nursing and Midwifery Quality Care-Metrics system in
2018 and the ONMSD will be supporting acute hospitals and CHO‟s in the change-over.
Health Service Performance Profile – October to December 2017 Quarterly Report 6
Children First National Office
Introduction
2017 was a critical year in terms of the implementation of Children First compliance throughout the H.S.E. The
full enactment of the Children First Act 2015 in December conferred new statutory obligations on the H.S.E. with
the introduction of mandatory reporting and assisting. In particular, the new Act placed increased liability on the
individual employee and staff member. In doing so it created the requirement that all staff must ensure that they
equip themselves with the appropriate information and skills to dispense their statutory duty under the Act. As
one of the largest and most complex organisation in the state with a wide range of diverse services providing
treatment to children and families the H.S.E. was presented with a considerable challenge. The H.S.E. has a
corporate liability as an employer to ensure that all employees and the staff of its funded and contracted
agencies were provided with adequate information and access to training that would equip them to fulfil their
duties under the Act.
The Children First National Office and team were established to oversee the implementation of Children First
compliance across the organisation. Given that there was a gap in management and oversight for the first few
months of the year, the C.F.N.O. has managed to end the year well on schedule in relation to its implementation
programme and with all key actions either completed or significantly advanced. An Interim Children First Lead
was appointed to the team in June and an intensive period of development, briefings and a multimedia
communications/ awareness raising programme ensured. This resulted in the uptake for the elearning
programme escalating from 28,000 in June to 68,00 at end of December 2018. Progress under specific key
areas is outlined below and certain dependencies and risks are also identified.
Children First Governance Structure in Place and Implemented –
National and Divisional Oversight Committees are in place
Children First Implementation Committees have been established in all C.H.O.s and Hospital Groups and
are meeting regularly.
A HSE National Children First Office has been established and is being staffed with a team of Training and
Development Officers to support each CHO, and Hospital Group in their implementation of Children First
and to audit a number of Funded Agencies and a number of relevant Contracted Services . An Interim
Children First Lead, Mary Kenny, was appointed in June 2017 and managed the team and implementation
of Children First compliance to end of year.
HSE Child Protection and Welfare Policy
The Children First Act 2015 is due to be enacted in full on the 11/03/2018. The Act introduce new statutory
obligations for H.S.E. employees and H.S.E. funded and contracted agencies. These are as follows:-
All relevant services i.e. services defined by the Act as providing directly to children and families must
display a Child Safeguarding Statement in their locations. This statement must outlined their commitment to
protecting children from identified risks or potential risks when availing of their service. Underpinning this
statement a suite of documents must be developed to include: A description of the services provided, an
assessment of risks to children availing of the service and a list of policies and responses to mitigate or
eliminate these risks.
Mandatory Reporting against a defined threshold.
Mandatory Assisting which includes the provision of reports, assessments, attendance and any other
proportionate and reasonable assistance required by Tusla in investigating a mandatory report.The current
2016 Policy is currently being revised to incorporate the new statutory obligations conferred on H.S.E.
employees and funded and contracted agencies. The revised policy will replace the 2016 Policy on the
website.
The C.F.N.O. decided that a National Corporate Statement and a local statement by C.H.O.s and Hospitals
would be developed by the H.S.E. to ensure its compliance with this requirement of the Act. The C.F.N.O. has
completed a H.S.E. Corporate Safeguarding Statement and local Safeguarding Statements are being
progressed in C.H.O.s and hospitals. The Corporate Statement will include a list of National H.S.E. procedures
and policies that address risks identified and will assist local areas in developing their C.S.S. in that many of
these National Statements also act as responses to local risks identified.

Health Service Performance Profile – October to December 2017 Quarterly Report 7
The H.S.E. Corporate Statement has been developed and the C.H.O. and hospital statements are being
progressed.
Children First Training Strategy
Three videos have been developed and are currently being placed on the website. The topics covered are:
Reasonable grounds for concern
How to complete a Standard Report Form to report a child protection concern to the Child and Family
Agency.
Domestic violence impact on children and response of agencies
A fourth video has been added to the Children First Website which provides guidance to staff in how to relate
sensitively and effectively with parents/ guardians in the event that they have to make a child protection report
on their children.
A generic eLearning training programme is available on (http://childrenfirst.hseland.ie/. A specific elearning
programme designed for staff directly employed by the H.S. E is available on www.hseland.ie. Both modules
address how to identify, assess and if necessary report child protection issues .The programme on
www.hseland.ie. is mandatory for all staff employed within the H.S.E. The programme is interactive and staff are
provided with a certificate of successful completion. The programme takes approximately 90 mins and can be
completed in separate time slots.
Subsequent to an intense promotion and communications programme there has been a steep escalation in
uptake of the e-learning programme with numbers increasing from 28,000 in June 2017 to 68,000 by year end.
An advanced briefing package has been developed for line managers. This briefing provides for more intensive
insight into all aspects of H.S.E. obligations and issues arising from Children First legislation and will allow for
an interactive discussion as the briefings will be delivered personally by the Training and Development Officers
on the National Children First Team. Live briefings have begun in all C.H.O.s and are being rolled out to
Hospitals. These briefings are being provided by training officers from the C.F.N.O.
A review of training will take place when the current programme of briefings are completed and this review will
look at additional training need of staff and additional cohorts of staff that may need live briefings. This review
will also take into account the capacity of the C.F.N.O. to deliver and the capacity of the service to support
further training.
Communication Strategy and Children First Website
The C.F.N.O revised information and guidance on its Children First website in order to fully incorporate the
additional statutory obligations conferred on staff by the enactment of the Children First Act 20T15. The H.S.E.
Children First Protection and Welfare Policy 2016 as outlined on the website is currently under review and is
due for completion imminently. This revision will incorporate additional guidance for staff in relation to their new
duties .All other aspects of the website have also been revised and are now up to date with the new legislation.
These include: the e-learning programme, the Frequently Asked Questions and additional four videos. An
additional and independent update has been placed on the site to inform staff who completed the unrevised e-
learning programme of the implications for them of the Children First Act without compelling them to revisit the
entire programme.
An intensive communications/ information strategy was conducted. This included the following:-
System wide broadcasts from the C.F.N.O. and the Director General.
Awareness raising days in Hospitals conducted by training officers from the C.F.N.O.
The circulation of hardcopies of the Tusla Guidance in relation to mandatory reporting and assisting.
The circulation of information leaflets to staff.
Information and relevant documents provided to senior managers in C.H.O. and H.G.s informing them of
their responsibilities under the Act.
Update to primary care performance meetings.
The insertion of an additional clause into service level agreements informing funded agencies of actions
required of them in order to assure the H.S.E. of their compliance.

Health Service Performance Profile – October to December 2017 Quarterly Report 8
Two articles in Health Matters
The website www.hse.ie/childrenfirst is the repository of most of the resources with leaflets setting out key
responsibilities for staff, GP‟s, parents, children and other relevant parties.
Quality Assurance and Monitoring
A Quality Assurance Framework for all aspects of the Children First programme has been developed. The
following are currently in place:
Scoped reports for HSE systems and services completing or not completing the Children First e-Learning
programme. Statistics have been greatly refined in this regard and are now specific to disciplines within
services. The team is currently developing a K.P.I. in relation to e-learning uptake which will be supported
by evidence from statistics gathered. This will embed the Children First training in the future performance
management system for C.H.O.s and Hospital Groups and will act as a driver for elearning uptake.
A Certification process for all staff who undertake the HSE Children First e-Learning programme and pass
the 10 question sequence on completion is in place.
An auditing process to ensure compliance of H.S.E. funded and contracted agencies is also in
development and will involve funding managers and Children First Training officers.
The C.F.N.O. is also in the process of ensuring that oversight and management of compliance with Children
First is included in the Controls Assurance Process.
HSE Funded Agencies, HSE Contracted Services and Agency Staff
An assurance process is in train to ensure that Children First compliance is stated in all service contracts
with both funded and contracted services. This includes self-assessments by HSE Funded Agencies of
their compliance with Children First. A compliance checklist has been developed by the C.F.N.O. to assist
agencies in this regard. An auditing process involving funding managers and Children First Training officers
is in development.
Positive engagement has commenced with Irish Regulatory Bodies to advance the inclusion of Children
First Training in the standards for registration and for CPD points.
The Children First National Office is currently engaging with H.R. and other relevant functions to ensure that
agency staff to be employed by the HSE must have undertaken Children First Training prior to taking up
employment. National contracts with employment agencies are being amended as part of the national
procurement process to reflect the requirement that all agency staff employed in the HSE have completed
relevant training and if required, the HSE e-Learning module prior to taking up duty. This work is still in
progress.
Risks/ Dependencies
The 2017 allocation for the Children First National Office was insufficient. Non-pay was not adequate to
cover staff mileage expenses.
There are a significant number of vacancies on the team in what is a critical developmental period. These
vacancies were generated during the gap in management oversight of the service from Jan to June 2017.
Actions are being progressed to recruit.
The introduction of mandatory assisting may create significant additional service pressure in the areas of
child psychiatry, psychology, public health nursing, paediatrics and G.P.s
It is critical in order to protect the liability of individual staff members and also corporate liability that an
efficient recording system for child protection reports is established in local services.
The rigid controls on information sharing amongst professionals in the C.F.A. 2015 is restrictive and
problematic for the form of multidisciplinary team working which is a common form of service delivery
throughout the H.S.E. This is the only condition in the Act the breach of which may incur a criminal sanction.
Therefore a protocol must be developed between the H.S.E and Tusla to ensure that such controls do not
act counter to collaborative working amongst professionals in the best interests of children.

Health Service Performance Profile – October to December 2017 Quarterly Report 9
Capital - Allocation/Expenditure Analysis
Total
Allocation
(Profile)
for Year
Cum Profile
for Period -
Jan - Dec
Expenditure
for Period
Jan - Dec
Variance for
Period Jan -
Dec
Expenditure
to Dec - as a
% of Profile
Expenditure
to Dec - as a
% of 2017
Total Profile
Variance as
% of Profile
Jan - Dec
2017
L2(1) 313.461 314.380 329.536 (15.156) 104.82% 105.13% -4.82%
L2(2) 68.000 68.000 67.746 0.254 99.63% 99.63% 0.37%
L3 2.539 2.539 2.539 0.000 100.00% 100.00% 0.00%
384.000 384.919 399.821 (14.903) 103.87% 104.12% -3.87%
L4 55.000 55.000 54.915 0.085 99.85% 99.85% 0.15%
439.000 439.919 454.736 (14.817) 103.37% 103.58% -3.37%
Asset
Disposals 2.613 2.613 0.000 2.613 0.00% 0.00% 100.00%
Net 441.613 442.532 454.736 (12.204) 102.76% 102.97% -2.76%
CONSTRUCTION - L2(1)
In the year to December 2017, expenditure on construction projects exceeded allocation by € 15.156m. This
additional expenditure was funded from Other Income / Contributions received in 2017 and in prior years. The
excess was additionally funded through the sale of assets amounting to €2.163m and by the vire of the surplus
on L2 (2) (new Children‟s Hospital) of € .254m.
CONSTRUCTION - L2(2) - (New Childrens Hospital)
Expenditure on the new Children‟s Hospital in the year to December 2017 amounted to € 67.746m, from a
Department of Health allocation of €68m. It was agreed that the remaining surplus of € .254 should be vired to
other construction projects to assist in reducing the additional expenditure incurred in this area.
ICT (L4)
Expenditure on ICT projects in the year to December 2017 amounted to € 54.915m or 99.85% of the allocated funding of €
55m.
Asset Disposals:
Receipts from Sale of Assets:
The value of sale proceeds in the year to December 2017amounted to € 2.613m.
Internal Audit
Total
Report
No of
Recommendations
75% implemented
or superseded after
6 months
95% implemented
or superseded after
12 months
2014 136 1281 N/A 91%
2015 116 1119 N/A 90%
2016 154 1761 63% 84%
2017 118 1364 36% N/A
Help Desk Queries
Q4 2017 No of Helpdesk Queries
2017
No of Helpdesk Queries
2016
% Increase
from 2016
Oct 165 131 26
Nov 140 105 33
Dec 91 71 28
Total 396 307 29

Health Service Performance Profile – October to December 2017 Quarterly Report 10
Quality and Patient Safety

Health Service Performance Profile – October to December 2017 Quarterly Report 11
Quality and Patient Safety
National
Acute Hospitals Division
Quality Assurance Division Update
Incident Management Training
Training: Dec. YTD
Systems Analysis Investigation 14 312
Incident Management Training 0 16
Human Factors Training 0 16
Find the Evidence Training 0 14
Healthcare Audit
Healthcare Audits: YTD
Audits in progress 45
Completed 33
Medical Exposure Radiation Unit (MERU)
MERU Dec. YTD
Radiation Safety Incidents Reported
3 51
Appeals Service
Appeal Type (YTD) Received Processed
Medical / GP Card 1,541 1,539 Medical / GP Visit Card 60 62 Nursing Home Support Scheme 391 366
CSAR 58 57 Home Care Package 132 133
Home Help 66 65
Other 115 98
Total 2,363 2,320
Mental Health Division
Social Care Division
Complaints
Training: Dec. YTD
Number of complaints officers/support staff
trained on the Complaints Management System
27 359
Number of Complaints logged on CMS 81 905
Number of Review Officers trained in YSYS
review officer training
0 104
Complaints: Dec. YTD
Number of complaints resolved under Part 3 Disabilities Act 2005
68 522
27
0
5
10
15
20
25
30
Jan Feb Mar Apr May June July Aug Sept Oct Nov Dec
Total SREs Reported - Mental Health Division
2015 2016
35
75
140
0
50
100
150
Jan Feb Mar Apr May June July Aug Sept Oct Nov Dec
Total SREs Reported - Social Care Division
2015 2016 2017
Serious Reportable Events Acute Hospitals Division
Social Care Division
Mental Health Division
Other Total
No. of SREs Reported December 2017 26 8 4 1 39
% Reported <24 hours December 2017 19% 63% 25% 100% 31%
No. of SREs Reported YTD 2017 442 140 27 6 615
% Reported <24 hours YTD 2017 23% 38% 33% 33% 27% % compliance 120 day investigations completed* 7% 22% 9% 0% 12%
*based on September YTD 2017

Health Service Performance Profile – October to December 2017 Quarterly Report 12
Quality Improvement Division Update
Supporting improvement in Emergency Departments and Injury Units
The Quality Improvement Division in collaboration with the Emergency Medicine Program has been working for
the last year with frontline staff in 10 Emergency Departments and one Injury Unit within 2 hospital groups. It is
using a QI approach known as Clinical Microsystems, which recognises that multi-disciplinary frontline teams
are the ones best placed to identify and improve aspects of care in their work setting. Training sessions have
been delivered to teams within the RCSI and the DML hospital groups. This type of work has a particular
emphasis on exploring the patient experience and the how these can be improved. The teams have been
working on improvement initiatives which they identify as a unit and working closely together have been making
important changes with a very positive impact for patients. Measuring change is built into the training, which is
an integral part of Quality Improvement.
A Celebration Day held in November highlighted the variety of initiatives in the first hospital group which was the
RCSI group, which was widely supported by HSE staff and showed how ED staff are responding to patient
opinions and concerns. There were a variety of positive improvements showcased on the day. These include
improving patient information, in particular medication information, along with both written and screen
information. There was a wheelchair initiative which showed a remarkable measurable improvement with
immediate positive improvement for both patients and staff. Another initiative which is on-going is a significant
project focusing on the patient experience in the waiting room. There were also some process improvements
discussed.
There has been very positive feedback from both patients and staff, and there is a strong emphasis on
sustaining the improvements the teams have made. This work will be continuing in other hospital groups
throughout 2018.
National Pressure Ulcer Prevention Safety Programme
49% reduction in ward acquired pressure ulcers across the 23 participating teams in six months
Phase 3 of the Pressure Ulcer to Zero (PUTZ) project was completed during 2017 having focused on the acute
sector with 23 multidisciplinary teams from all acute hospitals in the South South-West Hospital Group
(SSWHG) and Dublin Midlands Hospital Group (DMLHG). The collaborative is based on the Institute for
Healthcare Improvement (IHI) (2003) Breakthrough Series Collaborative Model the Framework for Improving
Quality (HSE, 2016), and was delivered by the Quality Improvement Division.
23 multidisciplinary teams from all hospitals in the SSWHG and DMLHG participated in two parallel
collaboratives and achieved a 49% reduction in newly acquired pressure ulcers during the project up to
September 2017.
The participating teams from the hospitals teams were brought through the improvement process by a team
form the Quality Improvement Division (QID) with help from experts in tissue viability. Formal education
sessions, local project support, and mentoring were provided by the QID team which enabled the local teams
build up an expertise in quality improvement methodologies and apply that learning to address the very
important patient safety issue of pressure ulcers.
The outcomes of this phase of the project include significant improvement in patient safety and patient
experience within the hospitals; and staff trained in quality improvement methods which they can now apply to
other patient safety initiatives.

Health Service Performance Profile – October to December 2017 Quarterly Report 13
Performance Overview Heat Maps Key: The table below provides details on the ruleset for the Red, Amber, Green (RAG) rating on the divisional heat maps
Graph Layout:
Target 2017 Trend 2016/2017 Trend 2015/2016
Design Layout: The Performance Overview table provides an update on the YTD performance
The Graphs and Service Level Performance table provides an update on the in-month performance
The Balanced Scorecard/Heat Map provides the YTD results with the results for last three months provided in the final three columns
Performance RAG Rating
Red > 10% of target
Amber > 5% ≤ 10% of target
Green ≤ 5% of target
Grey No result expected
Finance RAG Rating
Red ≥ 0.75% of target
Amber ≥ 0.10% <0.75% of target
Green < 0.10% of target
HR – Absence
Red ≥ 4%
Amber ≥ 3.7% < 4%
Green < 3.7%
HR – Indicative workforce
Red ≥ 1.5% of target
Amber ≥ 0.5% < 1.5% of target
Green < 0.5% of target
Health Service Performance Profile – October to December 2017 Quarterly Report 14
Health and Wellbeing

Health Service Performance Profile – October to December 2017 Quarterly Report 15
Health and Wellbeing Division
BreastCheck-number who had a mammogram
CervicalCheck-number who had screening
BowelScreen-number who completed a FIT
test
BreastCheck - % screening uptake rate
CervicalCheck- % with at least one
satisfactory screening in a five year period
BowelScreen - % client uptake rate
12,853 10,695
13,600
10,400
9,000
14,000
19,000
Jan Feb Mar Apr May Jun Jul Aug Sep Oct Nov Dec2017
26,235
12,740
22,000
13,000
10,000
14,000
18,000
22,000
26,000
30,000
Jan Feb Mar Apr May Jun Jul Aug Sep Oct Nov Dec
2017
9,995
6,882
8,540 8,000
5,500
7,500
9,500
11,500
Jan Feb Mar Apr May Jun Jul Aug Sep Oct Nov Dec
2017
70.6% 71.5% 70% 70%
50%
60%
70%
80%
90%
100%
Q4 Q1 Q2 Q3
2016/2017
79.6% 79.9% 80.0% 80.0%
78%
79%
80%
81%
Q4 Q1 Q2 Q32016/2017
38.2% 42.9%
45% 44%
20%
40%
60%
80%
Q4 Q1 Q2 Q3
2016/2017
Performance area
Target/ Expected Activity Freq
Previous Period YTD
Current Period YTD Change
SPLY YTD
SPLY Change
Environmental Health – food inspections 33,000 YTD/ 33,000 FYT
Q 24,639 33,162 +8,523 35,651 -2,489 ↓
BreastCheck - number of eligible women who had a mammogram
155,000 YTD/ 155,000 FYT
M 153,492 164,187 +10,695 141,882 +22,305
BreastCheck - % screening uptake rate
>70% Q-1Q 72.6% 72.2% -0.4% ↓ 74.4% -2.2% ↓
CervicalCheck - number of eligible women who had screening
242,000 YTD/ 242,000 FYT
M 246,267 259,007 +12,740 253,091 +5,916
CervicalCheck - % with at least one satisfactory screening in a five year period
>80% Q-1Q 79.7% 79.8% +0.1% 79.6% +0.2%
BowelScreen - number of people who completed a satisfactory FIT test
106,875 YTD/ 106,875 FYT
M 113,882 120,764 +6,882 108,285 +12,479
BowelScreen - % client uptake rate
>44% YTD/ >45% FYT
Q-1Q 40.5% 41.2% -0.7% ↓ 38.1% +3.1%
Diabetic RetinaScreen - number of people who participated
87,000 YTD/ 87,000 FYT
M 88,367 96,239 +7,872 88,807 +7,432
Diabetic RetinaScreen - % uptake rate
>56% Q-1Q 65.8% 67.7% +1.9% 59.1% +8.6%

Health Service Performance Profile – October to December 2017 Quarterly Report 16
Diabetic RetinaScreen - number who
participated
Tobacco - smokers receiving intensive
cessation support
Number of 5k Parkruns completed by the
general public in community settings
Diabetic RetinaScreen - % uptake rate
Number of people completing a structured
patient education programme for diabetes
Environmental Health – food inspections
7,884 7,872
6,123 5,650
4,500
6,500
8,500
10,500
Jan Feb Mar Apr May Jun Jul Aug Sep Oct Nov Dec
2017
1,499
657
1,534
653
300
700
1,100
1,500
1,900
Jan Feb Mar Apr May Jun Jul Aug Sep Oct Nov Dec
2017
38,511
26,550 31,074
17,593
10,000
20,000
30,000
40,000
50,000
Jan Feb Mar Apr May Jun Jul Aug Sep Oct Nov Dec
2017
59.9%
71.6%
52% 56%
40%45%50%55%60%65%70%75%80%
Q2 Q3 Q4 Q1 Q2
2016/2017
43
361
90
224
0
100
200
300
400
Jan Feb Mar Apr May Jun Jul Aug Sep Oct Nov Dec
2017
7,785
8,523
8,250 8,250
7,500
7,800
8,100
8,400
8,700
Q1 Q2 Q3 Q42017

Health Service Performance Profile – October to December 2017 Quarterly Report 17
Divisional Update
Healthy Ireland (HI)
Patient Experience Survey
The results of the first ever National Patient Experience Survey were launched on in December by An
Taoiseach and Minister for Health. The survey, a partnership between HIQA, the HSE and the Department of
Health, took place during the month of May 2017, and gave almost 27,000 patients discharged from a public
acute hospital throughout Ireland an opportunity to describe their experiences in order to improve our health
service.
It is the largest single survey of the healthcare system in Ireland and received an exceptional 51% response
rate. This is the first time the survey has been conducted and this information will be used as a baseline in order
to track progress on patients experience over the next number of years.
Some 84% of the patients who completed the survey indicated that their overall experience of acute healthcare
was either “good” or “very good”. However, one of the main objectives of the survey was to listen to the patient
voice and understand how their experience of services could be improved. It is now important that these
experiences are listened to and understood in order to make improvements to the quality and safety of Irish
healthcare.
In response to the results of the survey, each hospital has developed an implementation plan setting out how
they will improve patient experience based on patients‟ feedback. Saolta, University Limerick, Ireland East and
Dublin Midlands Hospital Groups implementation plans, identify the implementation of their Healthy Ireland (HI)
plan as a key component for making a meaningful difference to improving the health and well-being of the
people they serve while identifying the benefits of improving staff health and wellbeing for a better patient
experience.
Healthy Ireland Campaign (www.gov.ie)
HSE national communications in collaboration with the HSE national policy priority programmes provided a
range of information to support the Government‟s new national initiative to promote health and wellbeing across
the country. The Healthy Ireland campaign is encouraging people to get active, eat well and mind their mental
wellbeing across radio, digital, social and print media with the message small changes can make a big
difference to your physical and mental health and wellbeing.
Development and implementation of HI in Hospital Groups and CHOs
HI implementation is progressing well in the SAOLTA, Dublin Midlands, Ireland East, University Limerick and
RCSI Hospital Groups. A key focus of their implementation this month was supporting the Flu Vaccine
campaign and staff health & wellbeing initiatives.
Development of HI implementation plans by the 9 CHOs continued, with significant work undertaken to finalise
the plans.
National Screening Services
BreastCheck
The numbers of eligible women have had a mammogram YTD is 164,187. This is ahead of the expected activity
target YTD by +5.9% (YTD target: 155,000).
CervicalCheck
The number of women having one or more smear tests in a Primary Care setting YTD is 259,007. This
performance is ahead of the expected activity target YTD by +7.0% (YTD target: 242,000). NSS are monitoring
this increased activity.
BowelScreen
The number of clients who have completed a satisfactory FIT test is 120,764. This performance is ahead of the
expected activity target YTD by +13.0% (YTD target: 106,875). Encouragingly more clients are returning
completed FIT tests to the BowelScreen Programme and this increased activity is being monitored by NSS.

Health Service Performance Profile – October to December 2017 Quarterly Report 18
Diabetic RetinaScreen
The number of clients screened with final grading results is 96,239. This performance is ahead of the expected
activity target YTD by +10.6% (YTD target: 87,000). More diabetic clients are attending screening than expected
and this increased activity continues to be monitored by NSS
Immunisations (MMR and 6in1 at 24 months)
Nationally the uptake rate for 6in1 at 24 months YTD is 94.5% (target 95%) CHOs 2, 4, 5, and 8 are exceeding
the target YTD. CHOs 1, 3, 6, 7, 9 are within 5% of target YTD.
Nationally the uptake rate for MMR at 24 months YTD is 92.2% (target 95%) CHOs 1, 2, 3, 4, 5, 6, 7 and 8 are
within 5% of target YTD whereas CHO 9 is performing at 87.9% YTD.
Chronic Disease Management
Completion of a structured patient education programme for diabetes:
The HSE delivers two national structured patient education programmes for diabetes; the X-PERT Programme
and the DESMOND Programme. Both Programmes have been shown to achieve improved clinical and
psychological outcomes as well as empowering patients to self-manage their diabetes. X-PERT is a 17 hour
group structured patient education programme delivered by a Dietician over a 6 week period. Six CHOs (4, 5,
6, 7, 8 & 9) run the X-PERT programme. DESMOND is a 6 hour structured programme jointly facilitated by a
dietician and a nurse. Three CHOs (1, 2, and 3) run the DESMOND Programme.
1,781 people have completed the X-PERT programme YTD in CHOs 4, 5, 6, 7, 8 & 9. This performance is
ahead of the expected activity target YTD by +30.2% (YTD target: 1,368 people).
740 people completed the DESMOND structured patient education programme for diabetes in CHO 1, 2 and 3
YTD. This performance is behind the expected activity target YTD by -30.9% (YTD target: 1,072 people) and
performance continues to be monitored. The main factor contributing to this performance relates to the
availability of dieticians to support the delivery of these programmes in these areas. The Division is working with
colleagues in the Primary Care Division to address this issue.
Tobacco
Smokers receiving intensive cessation support
The HSE Quit Programme has one goal - to give smokers the help and support they need to quit smoking for
good. In December 2017, 657 smokers received intensive smoking cessation support. YTD 11,952 smokers
have received intensive smoking cessation support. This performance is below the expected activity target YTD
by -8.1% (YTD target: 13,000). This metric tracks the performance of intensive cessation support services
through both the QUIT (telephone helpline and on line cessation services) and face to face cessation services.
This KPI is sensitive to any temporary dip in face to face service provision resulting from a lack of cover for
practitioners in cases of unplanned absence or vacancies which may arise.
Physical Activity
5km Parkruns completed by the general public in community settings
This year‟s Operation Transformation (OT) programme encouraged people to participate in local Parkruns. YTD
330,794 members of the general public have completed a 5km Parkrun. This performance is above the
expected activity target YTD by +37.8% (YTD target: 240,000).
Environmental Health
Food business establishments are routinely inspected to assess compliance with official food control
requirements. 33,162 official food control surveillance inspections of food businesses were carried out in 2017.
This performance is ahead of the expected activity target 2017 by 162 inspections (target: 33,000). Of those
planned and planned surveillance inspections, 20.7% had either an unsatisfactory, unsatisfactory significant,
unsatisfactory serious outcome. This compares to 21.3% at the end of 2016.

Health Service Performance Profile – October to December 2017 Quarterly Report 19
The inspection activity in 2017 resulted in the following enforcement actions which were necessary in order to
protect public health and assure compliance with food safety requirements. The table below is a breakdown by
enforcement type for 2017.
Closure
Orders
Improvement
Notice
Notice Of
Application
To District
Court For
Improvement
Order
Prohibition
Orders
Seizure
Removal
&
Detention
Of
Products
Voluntary
Disposal
Destruction
Withdrawal
Of
Foodstuffs Prosecutions Total
64 261 1 3 1 1 11 342
There were 2818 food related complaints received - 501 food complaints and 2317 food business complaints.
There were 7742 food samples taken for microbiological analysis and 3656 food samples taken for chemical
analysis.
Test purchases of cigarettes are carried out in retail premises with volunteer minors to assess compliance with
tobacco control legislation. 356 retail premises have had an initial test purchase (tobacco) inspection in 2017.
This performance is behind the expected activity target by 28 initial inspections in 2017 (target: 384). However,
the total number of tobacco test purchases completed in 2017 was 442.
Test purchases of sunbed establishments are carried out in premises with volunteer minors to assess
compliance with sunbed control legislation. 32 establishments had a test purchase (sunbed) inspection and the
target for 2017 was achieved (target: 32). These establishments include any business where one or more than
one sunbed is made available for use or a business which sells or hires sunbeds or advertises or promotes the
use, sale or hire of sunbeds. Test purchase inspections can be impacted by the availability of volunteer minors
during the year.
A mystery shopper inspection is conducted to test the compliance of a sunbed business with other parts of the
legislation that may not be verified satisfactorily during a physical inspection. 32 establishments had a mystery
shopper inspection for sunbeds in 2017 (target: 32).
Under the Planning and Development Acts, Planning Authorities are required to consult with the HSE for
developments accompanied by an environmental impact statement. For these types of developments the HSE
can make submissions that inform the planning process with regard to the protection of public health and the
maximising of health gain from these developments. 37 out of 39 relevant consultation requests from planning
authorities received a response from the Environmental Health Service which is (-5.2%) behind its target for
2017 (target: 100%).
Manufacturers, importers and distributors are required to notify the HSE of Electronic Cigarettes and/or Refill
Containers that are not safe, not of good quality or not in conformity with the E.U. (Manufacture, Presentation
and Sale of Tobacco Products) Regulations 2016. The HSE, as the market surveillance authority, is required to
assess the notifications and take appropriate action. No notifications were received during 2018.
96.47% of environmental health complaints received by the Environmental Health Service from the public were
risk assessed within 1 working day in 2017 (target: 95%). Complaints must be risk assessed to determine what
course of action (if any) should be taken within one working day of receipt of the complaint. Complaints are
received from members of the public regarding matters that a complainant considers to be a risk to public health
for example an unsafe foodstuff, an unhygienic food premises, tobacco being sold to minors, pests not being
controlled and substandard cosmetic products.
The Environmental Health Service carries out monthly sampling under Regulation 9 of the Fluoridation of Water
Supplies Regulations 2007 to ensure compliance with the statutory range of concentration of fluoride in
fluoridated public drinking water supplies. In 2017, 2,460 drinking water samples have been taken to assess
compliance which is 168 samples behind target for 2017 (target: 2,628). Non achievement of the target was
due to plants not fluoridating during the year, which is outside of the control of the HSE.

Health Service Performance Profile – October to December 2017 Quarterly Report 20
Health and Wellbeing Balanced Scorecard/Heat Map
Rep
ort
ing
Fre
qu
en
cy
Ex
pe
cte
d
Acti
vit
y /
Ta
rge
t
Nati
on
al
YT
D
% V
ar
YT
D
CH
O 1
CH
O 2
CH
O 3
CH
O 4
CH
O 5
CH
O 6
CH
O 7
CH
O 8
CH
O
9
Cu
rre
nt
(-2
)
Cu
rre
nt
(-1
)
Cu
rre
nt
Qu
ali
ty &
Sa
fety
Serious Reportable Events
Investigations completed within 120 days1 M 90% NA
Service User Experience
Complaints investigated within 30 working days
2
Q 75% 83% 10.7%
Environmental Health
Food Inspections Q 33,000 33,162 0.5% 8,320 8,534 8,523
Acc
es
s
National Screening
Breastcheck - % screening uptake rate Q-1Q >70% 72.2% 3.2% 70.5% 74.9% 71.5%
Cervicalcheck - % with at least one satisfactory screening in a five year period
Q-1Q >80% 79.8% -0.3% 79.7% 79.7% 79.9%
Bowelscreen- % screening uptake rate Q-1Q >44% 41.2% -6.3% 41.2% 39.7% 42.9%
Diabetic RetinaScreen - % screening uptake rate
Q-1Q >56% 67.7% 20.9% 60.7% 71.6% 71.6%
Fin
an
ce
Net Expenditure variance from plan
Total M €207,385 €204,546 -1.37% -2.87% -1.48% -1.37%
Pay M €100,337 €96,100 -4.22% -3.85% -4.14% -4.22%
Non-pay M €113,110 €114,464 1.20% -1.96% 0.63% 1.20%
Service Arrangements (05.01.2018)
Number signed M 3.5% 96.73% 3.27% 90.7% 93.42% 96.73%
Monetary value signed M 3.5% 98.95% 1.05% 99% 98.36% 98.95%
HR
Absence
Overall M-1M 3.5% 3.64% -4% 3.73% 4.42%
1 Data under review
2 This covers all of Community Healthcare
Health Service Performance Profile – October to December 2017 Quarterly Report 21
Primary Care

Health Service Performance Profile – October to December 2017 Quarterly Report 22
Primary Care Division
Total CITs
SLT access within 52 weeks
Physiotherapy access within 52 weeks
Early Discharge CIT
SLT waiting list
Assessment Waiting List Treatment Waiting List
SLT Oct Nov Dec Oct Nov Dec
≤ 52 weeks 12,400 13,185 13,331 7,668 7,311 7,358
> 52 weeks 470 475 459 533 567 612
Total 12,870 13,660 13,790 8,201 7,878 7,970
Physiotherapy Assessment Waiting List
Physiotherapy Assessment WL Oct Nov Dec
≤ 12 weeks 20,576 20,389 19,033
>12 weeks ≤ 26 weeks 6,934 6,144 7,010
> 26 weeks ≤ 39 weeks 2,913 2,505 2,603
>39 weeks ≤ 52 weeks 1,304 1,237 1,374
> 52 weeks 1,811 1,506 1,646
Total 33,538 31,781 31,666
2,024
2,510 2,904 3,233
500
1,500
2,500
3,500
Jan Feb Mar Apr May Jun Jul Aug Sep Oct Nov Dec
2015/2016 2016/2017
96.6%
96.8% 97.1%
96.7%
100%
94%
95%
96%
97%
98%
99%
100%
Jan Feb Mar Apr May Jun Jul Aug Sep Oct Nov Dec
2015/2016 2016/2017
97.9%
95.9%
95.2% 94.8%
98%
92%
94%
96%
98%
100%
Jan Feb Mar Apr May Jun Jul Aug Sep Oct Nov Dec
2015/2016 2016/2017
397
336 382
390
533
100
200
300
400
500
600
700
Jan Feb Mar Apr May Jun Jul Aug Sep Oct Nov Dec
2015/2016 2016/2017
Performance area
Target/ Expected Activity Freq
Previous Period YTD
Current Period
YTD Change SPLY YTD
SPLY Change
Total CIT 32,860TD/
32,860FYT M 34,974 38,207 +3,233 27,834 +10,373
Early Discharge CIT 6,072YTD/ 6,072FYT
M 4,933 5,323 +390 4,965 +358
Child Health – new born visited within 72 hours
98% Q 98.4% 98.1% -0.3% 97.7% +0.4%
Child Health - developmental screening 10 months
95% M-1M 92.9% 92.8% -0.1% 93.3% -0.5%
Medical card turnaround within 15 days 96% M 99.6% 99.6% 89.6% +10%
Speech and Language Therapy access within 52 weeks
100% M 96.5% 96.7% +0.2% 96.8% -0.1%
Physiotherapy access within 52 weeks 98% M 95.3% 94.8% -0.5% 95.9% -1.1%
Occupational Therapy access within 52 weeks
92% M 76.5% 77% +0.5 80.4% -3.4%
Access to palliative inpatient beds 98% M 97.8% 97.8% 96.8% +1%
Access to palliative community services
95% M 92.3% 92.1% -0.2% 91.5% +0.6%
Access to substance misuse treatment (over 18 years)
100% Q-1Q 98.1% 98.5% +0.4% 98% +0.5%
Access to substance misuse treatment (under 18 years)
100% Q-1Q 98.6% 96.5% -2.1% 83% +13.5%

Health Service Performance Profile – October to December 2017 Quarterly Report 23
Occupational Therapy access within 52 weeks
Child Health – new borns visited within 72
hours
Access to palliative inpatient beds
Access to substance misuse treatment
(over 18 years)
Medical card turnaround within 15 days
Occupational Therapy Assessment Waiting
List
Occupational Therapy Assessment WL Oct Nov Dec
≤ 12 weeks 8,969 8,873 8,926
>12 weeks ≤ 26 weeks 7,210 6,733 6,907
> 26 weeks ≤ 39 weeks 4,390 4,175 4,429
>39 weeks ≤ 52 weeks 2,886 2,820 3,145
> 52 weeks 7,316 6,927 6,976
Total 30,771 29,528 30,383
Child Health – developmental screening 10
months
Access to palliative community services
Access to substance misuse treatment
(under 18 years)
84.3% 80.4% 79.2%
77%
92%
60%
70%
80%
90%
100%
Jan Feb Mar Apr May Jun Jul Aug Sep Oct Nov Dec
2015/2016 2016/2017
97%
98.1% 98.4%
97.2%
90%
95%
100%
Mar Jun Sep Dec2015/2016 2016/2017
95.9% 95.2%
97%
96.8%
98%
92%
94%
96%
98%
100%
Jan Feb Mar Apr May Jun Jul Aug Sep Oct Nov Dec
2015/2016 2016/2017
91.0%
98% 94.7% 98.5%
80%
90%
100%
Dec Mar Jun Sept
2015/2016 2016/2017
95.6%
89.6% 89.2%
99.6% 96%
0%
20%
40%
60%
80%
100%
Jan Feb Mar Apr May Jun Jul Aug Sep Oct Nov Dec
2015/2016 2016/2017
92.7%
94.6% 93.8%
92.6%
95%
90%
92%
94%
96%
Dec Jan Feb Mar Apr May Jun Jul Aug Sep Oct Nov2015/2016 2016/2017
88.5% 87%
91.5% 90.5%
95%
80%
85%
90%
95%
100%
Jan Feb Mar Apr May Jun Jul Aug Sep Oct Nov Dec
2015/2016 2016/2017
100%
81.6%
97.5% 96.5%
100%
70%
80%
90%
100%
Dec Mar Jun Sept
2015/2016 2016/2017

Health Service Performance Profile – October to December 2017 Quarterly Report 24
Service level performance
Performance area Best performance Outliers
Total CIT CHO3 623, CHO7 593, CHO5 516 CHO6 166, CHO8 252, CHO1 305
Early Discharge CIT CHO3 76, CHO4 73, CHO5 73 CHO6 8, CHO9 18, CHO7 22
Child Health – new born visited within 72 hours
CHO5 99.9%, CHO4 99.7%, CHO7 99.2% CHO6 95.2%, CHO9 97.1%, CHO1 97.9%
Child Health – developmental screening 10 months
CHO9 94.9%, CHO7 94.2%, CHO2 94.2% CHO3 85.3%, CHO6 90.9%, CHO1 91.7%
Speech and Language Therapy access within 52 weeks
CHO3 100%, CHO6 100%, CHO9 98.9% CHO7 91.1%, CHO4 93.3%, CHO1 95.2%
Physiotherapy access within 52 weeks
CHO4 100%, CHO6 100%, CHO3 99.7% CHO2 83.4%, CHO9 92.5%, CHO1 94%
Occupational Therapy access within 52 weeks
CHO2 98.4%, CHO3 97.3% CHO7 82.2% CHO1 59.1%, CHO4 69.2%, CHO8 70.1%
Access to palliative inpatient beds
CHO3 100%, CHO4 100%, CHO5 100% CHO9 93%. CHO7 96.5%, CHO6 97%
Access to palliative community services
CHO5 96.3%, CHO1 95.9%, CHO2 94.9% CHO4 85.7%, CHO7 86.4%, CHO6 88.5%
Access to substance misuse treatment (over 18 years)
CHO2 100%, CHO4 100%, CHO6 100% CHO8 88.2%, CHO3 90.5%, CHO5 98.7%
Access to substance misuse treatment (under 18 years)
CHO1 100%, CHO4 100%, CHO5 100% CHO2 80%
Divisional Update - Primary Care
QPS Serious Reportable Events
There was one serious reportable event (SRE) reported to the National Primary Care Division for the month of
December.
Community Intervention Teams
CIT referrals are 16.3% ahead of target. This represents a 37.3% increase compared to the same period last
year.
CIT Early discharge is 12.3% below target at 5,323 compared to the target of 6,072. The number of referrals in
the early discharge category has changed for a number of reasons including:
Changes in clinical practice – Some patients are prescribed newer anti-coagulation medication which does
not require a nurse visit for monitoring. CIT previously received a higher number of referrals for acute
monitoring.
Some patients referred from a hospital ward have now been categorised as hospital avoidance as their
hospital stay is complete and the CIT intervention avoids their return to a day ward / OPD appointment.
Child Health screening 10 months
CHO3 is red on the balanced scorecard and remains below target at 85.3%. CHO3 performance for the same
period last year was 83.9%. Performance in the remaining CHOs is within a range of 90.9% to 94.9%. The
remaining CHOs are therefore green on the balanced score card / heat map.
CHO3 performance is 85.3%. In the December report, the 7-9 month assessment report was in respect of
children born in January 2017 and reaching age 10 months in November 2017. As of 23/01/2018, 91.3%
of babies born in the Mid-West have had their Developmental Assessment check.
There has been one vacant post in CHO3 since December 2016. The post will be filled in April 2018. The
service has also been impacted by a number of sick leave absences which has reduced the availability of
doctors to provide the service.
The Progression of the Nurse Led Developmental Check and the commencement of the Senior Medical
Officer will also assist CHO3 in reaching the target in relation to Child Health Screening 10 Months.
Health Service Performance Profile – October to December 2017 Quarterly Report 25
PCRS Medical Card Turnaround within 15 days
Performance in December was 99.6% compared to a target of 96%. Performance in November was also 99.6%.
The online application system for medical card applications is now live and the National Medical Card Unit is on
track to process all completed applications within 15 working days.
Speech and Language Therapy (SLT) Access within 52 weeks
The National YTD position is 96.7% compared to a target of 100% and the prior month YTD position in
November of 96.5%. The outturn in 2016 was 96.8%. CHO4 and CHO7 are amber on the balanced scorecard /
heat map at 93.3%, and 91.1% respectively. There are currently 459 clients awaiting initial assessment for
longer than 12 months. 281 are aged 0-18; most of whom require a Multi-Disciplinary Team (MDT) assessment.
Referrals YTD are 1.0% lower than expected activity YTD and 1.9% lower than the same period last year. The
number of clients waiting for initial assessment for longer than 52 weeks has decreased from 475 in November
to 459 in December. The number of clients waiting for treatment for longer than 52 weeks has increased from
567 in November to 612 in December.
Physiotherapy Access within 52 Weeks
The National YTD position is 94.8%. The outturn in November was 95.3%. The outturn in 2016 was 95.9%. The
number of clients waiting longer than 52 weeks has increased from 1,506 in November to 1,646 in December.
Referrals YTD are 1.5% lower than expected activity YTD and 0.8% higher than the same period last year.
CHO2 is red on the balanced scorecard at 83.4%. CHO9 is amber on the balanced scorecard at 92.5%.
Occupational Therapy Access within 52 weeks
The National YTD position is 76.9%. This is marginally improved on the prior month outturn of 76.5%. The
outturn in 2016 was 80.40%. The number of clients waiting longer than 52 weeks increased from 6,927 in
November to 6,976 in December. Referrals YTD are 3.8% lower than expected activity YTD and 1.7% lower
than the same period last year. CHOs have reported a number of contributing factors impacting on access to
services. The National Service Improvement Group has submitted a draft copy of their report to the National
Director for consideration. Chief Officers and Heads of Primary Care have also prepared a diagnostic
assessment of the issues specific to their CHO and their specific plans to address same. Work is on-going in
this regard.
Palliative Care IPU
In December 2017, 96.8% of admissions (out of a target of 98%) to a specialist palliative care inpatient unit
were admitted within 7 days. Six CHOs performed at 100% for admissions within 7 days within the current
month. The national YTD position is 97.8%. Compared to December 2016, access within 7 days to specialist
palliative care inpatient beds improved by 1.5%. The percentage of people who had to wait over 7 days for
admission decreased by 30.7% against the same period last year (9 vs. 13) and 32.2% against 2016 (78 vs.
115) in total.
Palliative Care Community
In December 2017, 90.5% of patients who waited for specialist palliative care services in a community setting
were seen within 7 days (out of a target of 95%). This is an increase of 1.8% compared to November (88.7%).
Year to date performance is 92.1% which is a decrease of 0.6% against the same period last year. YTD
Improvements are noted in six CHOs versus December YTD 2016. The percentage of people who had to wait
over 7 days for service has decreased by 30.1% versus the same period last year (74 vs. 106) and 7.1%
against 2016 (760 vs. 818) in total.
Substance Misuse
% of substance misusers (over 18 years) for whom treatment has commenced within one calendar month
following assessment
As at the end of the reporting period, the national performance target was 100% with an activity rate of 98.5%
which is a variance of -1.5%. Of note, CHOs 2, 4, 6, 7 and 9 reached the target of 100% while CHO8
underperformed by –11.8%.

Health Service Performance Profile – October to December 2017 Quarterly Report 26
% of substance misusers (under 18 years) for whom treatment has commenced within one week following
assessment
As at the end of the reporting period, the national performance target was 100% with an activity rate of 96.5%
which is a variance of -3.5%. Of note, CHOs 1, 4, 5, 7, and 8 reached target of 100% while CHO 2
underperformed by -20% with 0 activity reported for CHO3. (Note CHO 6 is reported via CHO 7).
Opioid Substitution Treatment
9790 patients received Opioid Substitute Treatment (excluding prisons) for the reporting period which
includes 4227 patients being treated by 359 GPs in the community.
703 pharmacies catering for 6890 patients.
81 clinics providing Opioid Substitute Treatment and an additional 9 prison clinics were provided in the
prison service.
65 new patients commenced Opioid Substitute Treatment during the reporting period (5 in General Practice,
50 in HSE clinics and 10 in the prison clinics)
The majority of Opioid Substitution Treatment (OST) KPIs are on target with the exception of
transfers. Reasons behind the below target transfer of stabilised clients to the lowest level of complexity
(Level 1) from clinics and Level 2 GPs have been discussed at CHO performance meetings and will be
reviewed through the National Addiction Advisory Governance Group.
Opioid Substitute Treatment Waiting Times (month in arrears)
During the reporting period, the national Average waiting time from Opioid Substitution Treatment
assessment to exit from the waiting list or treatment commenced for the 145 people who exited the waiting
list was 25.3 days. Of note, CHOs 2, 4, 5, 6, 7, 8 and 9 reported average waiting times of less than a month
with CHOs 1 and 3 reporting waiting times of 39 days and 67.5 days respectively.
SAOR
The expected number of staff trained in SAOR Screening and Brief Intervention for problem alcohol and
substance use for 2017 was 778. Of note are CHOs 1, 4 and 9 who had a variance of 655.6%, 139% and
143.3% respectively. CHO6 had a variance of -100% which can be attributed to the delivery of training and
reporting on training for CHOs 6 and 7 in one return. To date, 1239 have been trained nationally, which is
59.3% more than expected for the year. The variance can be attributed to the SAOR Train the Trainer
Programme which allowed for additional trainers in CHOs 1, 6, 7 and 9.
Needle Exchange
Data quality issues for this metric are currently being reviewed nationally.
Homeless Services
At a national level all metrics are below target including;
Service Users with Medical Cards performance is 67% (National Target 75%),
Health Needs Assessments metric performance is 74% (Target 85%),
Health Needs supported through the hostel network have increased to 77% (Target 80%).
Areas of Improvement/Areas of Risk
Primary Care
€5m full year funding was allocated to CHOs in June 2017 in relation to stretch metrics to facilitate the
achievement of KPI targets.
SLT waiting lists include a number of clients who are awaiting MDT assessment / intervention. This means that
the additional 83 posts provided under NSP 2016 will not address this group of clients as they cannot be seen
until the MDT team is available and there are staffing deficits in other disciplines.
The National Service Improvement group in relation to Physiotherapy has finalised and submitted their report to
the National Director. The Occupational Therapy report is expected to be submitted shortly.
The continued prioritisation of AON referrals is impacting on waiting times for Primary Care referrals.

Health Service Performance Profile – October to December 2017 Quarterly Report 27
Primary Care Balanced Scorecard/Heat Map
Rep
ort
ing
Fre
qu
en
cy
Ex
pe
cte
d
Acti
vit
y /
Ta
rge
t
Nati
on
al
YT
D
% V
ar
YT
D
CH
O 1
CH
O 2
CH
O 3
CH
O 4
CH
O 5
CH
O 6
CH
O 7
CH
O 8
CH
O 9
Cu
rre
nt
(-2
)
Cu
rre
nt
(-1
)
Cu
rre
nt
Qu
ali
ty &
Sa
fety
Serious Reportable Events
Investigations completed within 120 days
3
M 90% NA
Service User Experience
Complaints investigated within 30 working days
4
M 75% 83% 10.7%
Community Intervention Teams
Total CIT M 32,860 37,685 14.7% No
Service 2,856 6,618 6,856 6,898 1,833 7,594 2,448 5,582
2,999 3,742 3,233
Early Discharge CIT M 6,072 5,214 -14.1% No
Service 1,150 1,006 916 857 66 398 439 382
350 600 390
Child Health
Child Health – new borns visited within 72 hours
Q 98% 98.2% 0.2% 97.9% 99% 95.8% 99.7% 99.9% 95.2% 99.2% 97.6% 97..1%
97.9% 98.8% 97.4%
Child screening 10 months M-1M 95% 92.8% -2.3% 91.7% 94.2% 85.3% 93.8% 93.7% 90.9% 94.2% 93% 94.9%
92.8% 91.7% 92.6%
Acc
es
s
PCRS
Medical card turnaround within 15 days M 96% 99.6% 3.8%
62.2% 99.6% 99.6%
Therapy Waiting Lists
SLT access within 52 weeks M 100% 96.7% -3.4% 95.2% 98.3% 100% 93.3% 98.6% 100% 91.1% 98.4% 98.9%
96.3% 96.5% 96.6%
Physiotherapy access within 52 weeks M 98% 94.8% -3.3% 94% 83.4% 99.7% 100% 98.3% 100% 98.3% 96.3% 92.5%
94.6% 95.3% 94.8%
Occupational Therapy access within 52 weeks
M 92% 76.9% -16.4% 59.1% 98.4% 97.3% 69.2% 76.3% 78.8% 82.3% 70.1% 81.2%
76.2% 76.5% 76.9%
Palliative Care
Access to palliative inpatient beds M 98% 97.8% -0.2% 99.7% 99.7% 100% 100% 100% 97% 96.5% No
Service 93%
97% 98.7% 96.8%
Access to palliative community services M 95% 92.1% -3.1% 95.9% 94.9% 93.4% 85.7% 96.3% 88.5% 86.4% 94.8% 94%
91.7% 88.7% 90.5%
Social Inclusion - access to substance misuse treatment
Access to substance misuse treatment (over 18 years)
Q-1Q 100% 98.5% -1.5% 99.3% 100% 90.5% 100% 98.7% 100% 100% 88.2% 100%
94.7% 97.5% 98.5%
Access to substance misuse treatment (under 18 years)
Q-1Q 100% 96.5% -3.5% 100% 80% No
Service 100% 100%
No
Service 100% 100% 100%
81.6% 97.5% 96.5%
3 Data under review.
4 This refers to all of Community Healthcare.

Health Service Performance Profile – October to December 2017 Quarterly Report 28
Rep
ort
ing
Fre
qu
en
cy
Ex
pe
cte
d
Acti
vit
y /
Ta
rge
t
Nati
on
al
YT
D
% V
ar
YT
D
CH
O 1
CH
O 2
CH
O 3
CH
O 4
CH
O 5
CH
O 6
CH
O 7
CH
O 8
CH
O 9
Cu
rre
nt
(-2
)
Cu
rre
nt
(-1
)
Cu
rre
nt
Fin
an
ce
Net Expenditure variance from plan
Total M €3,854,560 €3,858,558 0.10% 3.54% 4.59% 1.64% 0.58% 0.64% 0.35% -2.19% 0.26% -1.82%
0.00% 0.17% 0.10%
Pay M €633,589 €619,851 -2.17%
-1.21% -0.96% -2.17%
Non-pay M €3,247,078 €3,272,847 0.79%
0.47% 0.62% 0.79%
Income M -€26,107 -€34,139 30.77%
28.90% 29.06% 30.77%
Service Arrangements (05.01.2018)
Number signed – Primary Care M 3.50% 80.63% 19.37% 63.19% 70.62% 80.63%
Monetary value signed – Primary Care M 3.50% 98.62% 1.38% 98.48% 95.59% 98.62%
Number signed – Social Inclusion M 3.50% 98.25% 1.75% 97.09% 97.86% 98.25%
Monetary value signed – Social Inclusion
M 3.50%
99.08% 0.92% 98.90% 99.02% 99.08%
Number signed –Palliative Care M 3.50% 86.96% 13.04% 86.36% 86.36% 86.96%
Monetary value signed – Palliative Care M 3.50% 99.20% 0.80% 98.96% 98.97% 99.20%
HR
Absence
Overall M-1M 3.5% 4.45% -27.14% 4.76% 4.01% 5.03% 2.70% 4.38% 4.84% 4.84% 5.03% 7.34% 4.40% 4.47%

Health Service Performance Profile – October to December 2017 Quarterly Report 29
Mental Health
Health Service Performance Profile – October to December 2017 Quarterly Report 30
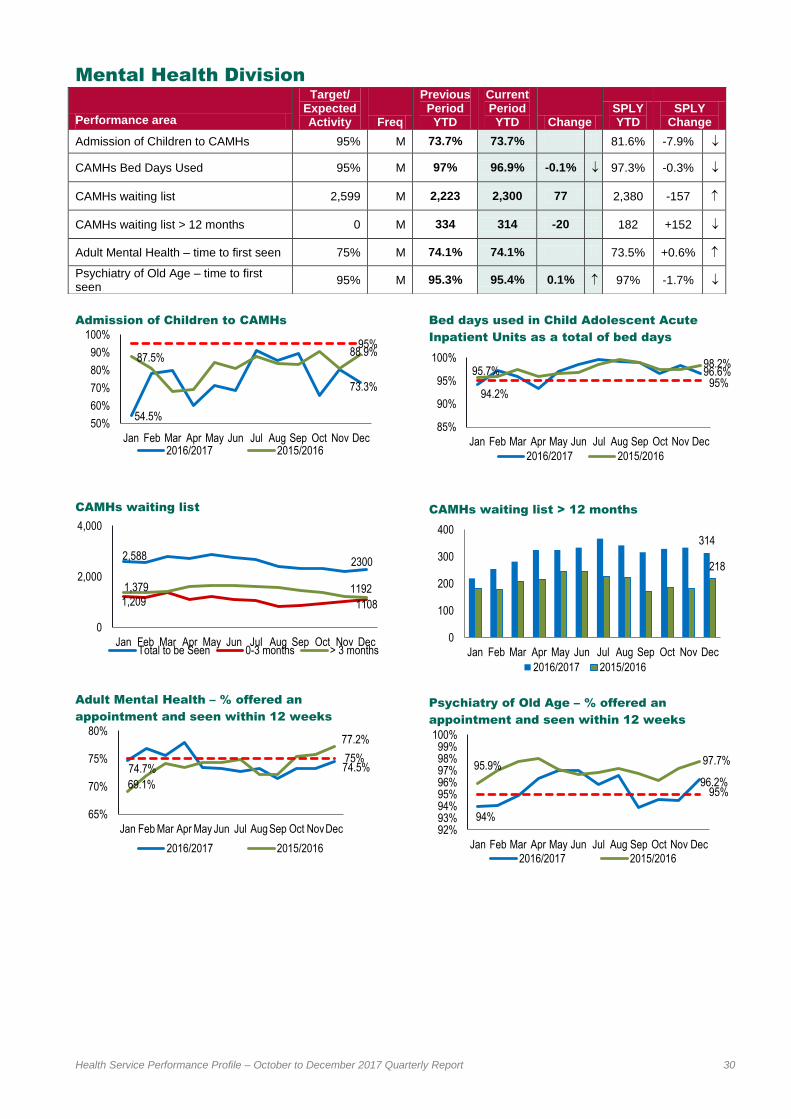
Mental Health Division
Admission of Children to CAMHs
CAMHs waiting list
Adult Mental Health – % offered an
appointment and seen within 12 weeks
Bed days used in Child Adolescent Acute
Inpatient Units as a total of bed days
CAMHs waiting list > 12 months
Psychiatry of Old Age – % offered an
appointment and seen within 12 weeks
54.5%
73.3%
87.5% 88.9%
95%
50%
60%
70%
80%
90%
100%
Jan Feb Mar Apr May Jun Jul Aug Sep Oct Nov Dec2016/2017 2015/2016
2,588 2300
1,209 1108
1,379 1192
0
2,000
4,000
Jan Feb Mar Apr May Jun Jul Aug Sep Oct Nov DecTotal to be Seen 0-3 months > 3 months
74.7% 74.5%
69.1%
77.2%
75%
65%
70%
75%
80%
Jan Feb Mar Apr May Jun Jul AugSep Oct NovDec
2016/2017 2015/2016
94.2%
96.6% 95.7% 98.2%
95%
85%
90%
95%
100%
Jan Feb Mar Apr May Jun Jul Aug Sep Oct Nov Dec
2016/2017 2015/2016
314
218
0
100
200
300
400
Jan Feb Mar Apr May Jun Jul Aug Sep Oct Nov Dec
2016/2017 2015/2016
94%
96.2%
95.9% 97.7%
95%
92%93%94%95%96%97%98%99%
100%
Jan Feb Mar Apr May Jun Jul Aug Sep Oct Nov Dec
2016/2017 2015/2016
Performance area
Target/ Expected Activity Freq
Previous Period YTD
Current Period YTD Change
SPLY YTD
SPLY Change
Admission of Children to CAMHs 95% M 73.7% 73.7% 81.6% -7.9%
CAMHs Bed Days Used 95% M 97% 96.9% -0.1% 97.3% -0.3%
CAMHs waiting list 2,599 M 2,223 2,300 77 2,380 -157
CAMHs waiting list > 12 months 0 M 334 314 -20 182 +152
Adult Mental Health – time to first seen 75% M 74.1% 74.1% 73.5% +0.6%
Psychiatry of Old Age – time to first seen
95% M 95.3% 95.4% 0.1% 97% -1.7%

Health Service Performance Profile – October to December 2017 Quarterly Report 31
Service level performance
Performance area Best performance Outliers
CAMHs Bed Days Used CHO 6, 7 & 8 (100%) CHO 3 (71.1%)
CAMHs waiting list > 12 months CHO 2 (0) CHO 4 (199), CHO 8(52) & CHO 3 (43)
Adult Mental Health – time to first seen CHO 2 (92.3%), CHO 5(86.4%) & CHO 1 (85.1%)
CHO 9 (63.9%), CHO 8(65.5%) & CHO 4 (68.2%)
Psychiatry of Old Age – time to first seen
CHO 6, 1 & 3 (100%) CHO 4 (77.5%), CHO 9 (89.9%) & CHO 7 (96.9%)
Divisional Update
The performance in both General Adult and Psychiatry of Old Age services is generally good however there are
on-going challenges in recruitment which are detailed below.
The level of vacancies and difficulty in recruiting and retaining skilled staff, particularly nursing and medical staff,
poses a significant challenge for the provision of Mental Health Services. This is impacting on the delivery of
services, and reflected in underperformance within CHOs. The MH Division continues to work with CHOs to
maximise and ensure the most effective use of resources. There is work on-going with the HSE HR partners
and the National Recruitment Service to attract and retain staff within mental health services. The recruitment
challenges are having a significant budgetary impact in the CHO‟s as a result of high medical and nursing
agency costs.
A related issue arising is the cost of external placements where no suitable service exists in the CHO‟s. This
issue is causing concern as it is driving cost in the CHO‟s and is an issue that is being addressed by the MHD
through the performance management process with the CHO‟s and the development of a Specialist
Rehabilitation initiative.
Child Adolescent Acute Inpatient Units (CAMHs)
A related for CAMHS services are the recruitment issues identified above. This issue of staffing deficits with
associated longer wait times is being addressed though the CAMHS service improvement process and is a high
priority for the MHD. A challenge arising will be to continue to reduce the numbers of children admitted to adult
acute inpatient units and to minimise the length of stay.
In December, 73.7% of children were admitted to child and adolescent inpatient units, as against 80.6% in
November.
In December, 96.6% of the total bed days used for child admissions were in Child and Adolescent Acute
Inpatient Units, against 98.4% in November, indicating that where a child has been admitted to an adult acute
inpatient unit, the length of stay has been kept to an absolute minimum. Performance year to date continues to
be above the target of 95%, indicating that where a child has been admitted to an adult acute inpatient unit, the
length of stay has been kept to a minimum.
Access to Child and Adolescent Mental Health Services
The CAMHs Waiting List Initiative which is focussing on ensuring that no-one is waiting over 12 months is
continuing despite the challenges presented by the level of vacancies and the difficulty in recruiting.
To monitor / address the issue of CAMHS Consultant vacancies, a monthly CAMHS Consultant vacancy
profiling exercise now takes place in order to gather data on CAMHS medical vacancies across all 69
community CAMHS teams.
The CHOs with individuals waiting over 12 months are taking focussed actions to meet the target. The >12
month waiting list increases are mostly restricted to CHO 1, 3, 4, and 8 with particular challenges in CHO 4.
As has been indicated previously the increases in waiting lists relate significantly to availability of appropriately
trained staff including primary care based psychological supports, recruitment difficulties in appointing clinical
staff and lack of suitable accommodation for maximum operational effectiveness. It is worth noting that the

Health Service Performance Profile – October to December 2017 Quarterly Report 32
Department of Public Expenditure have given approval to recruit 120 new Assistant Psychology posts into
Primary Care who are coming on-stream in Q1 2018. This initiative will have a significant impact on building
capacity within Primary Care to address early assessment and triage of young people that are currently being
referred to CAMHs teams.
Each CHO with waiting lists > 12 months has been asked by the Service Improvement Lead and National
Director to provide management plans to address their respective lists. On-going work is continuing within each
CHO area to focus efforts on reducing the >12 month lists utilising existing resources to balance emerging acute
needs with that of those waiting for long periods. Despite on-going recruitment campaigns, this work continues
to present significant challenges while current vacancies, particularly in CAMHS Consultant posts and
increasingly CAMHS nursing posts remain unfilled.

Health Service Performance Profile – October to December 2017 Quarterly Report 33
Mental Health Balanced Scorecard/Heat Map
Rep
ort
ing
Fre
qu
en
cy
Ex
pe
cte
d
Acti
vit
y /
Ta
rge
t
Nati
on
al
YT
D
% V
ar
YT
D
CH
O 1
CH
O 2
CH
O 3
CH
O 4
CH
O 5
CH
O 6
CH
O 7
CH
O 8
CH
O 9
Cu
rre
nt
(-2
)
Cu
rre
nt
(-1
)
Cu
rre
nt
Qu
ali
ty &
Safe
ty
Serious Reportable Events
Investigations completed within 120 days
5
M 90% 9% -90%
Service User Experience
Complaints investigated within 30 working days
6
M 75% 83% 10.7%
CAMHs
Admission of children to CAMHs inpatient units
M 95% 73.7% -22.4% 65.5% 80.6% 73.3%
Bed days used M 95% 96.9% 2% 98.6% 99.5% 95% 98.7% 84.9% 100% 96.2% 98.3% 95.3% 96.6% 98.4% 96.6%
Ac
ce
ss
Time to first seen
General Adult Teams M 75% 74.1% -1.2% 76.6% 90.5% 71.9% 66.6% 86.5% 83.5% 67.7% 65.5% 61.9% 73.2% 73.2% 74.5%
Psychiatry of Old Age Teams
M 95% 95.4% 0.4% 95.4% 99% 98.4% 85.4% 99% 98.9% 95.7% 95.3% 83.8% 94.6% 94.5% 96.2%
CAMHs > 12 months
Waiting > 12 months M 0 314 >100% 10 0 43 199 3 2 1 52 4 329 334 314
Fin
an
ce
Net Expenditure variance from plan
Total M €860,755 €860,372 -0.04% -0.05% 6.91% 0.70% 1.02% 0.79% 1.93% -0.17% 4.23% -0.69% 1.10% 1.18% -0.04%
Pay M €686,052 €680,267 -0.84% 0.09% 0.00% -0.84%
Non-pay M €193,921 €199,486 2.87% 4.36% 4.91% 2.87%
Income M -€19,218 -€19,381 0.84% -1.85% -2.94% 0.84%
Service Arrangements (05.01.2018)
Number signed M 3.50% 88.89% 11.11% 84.77% 87.24% 88.89%
Monetary value signed M 3.50% 66.66% 33.34% 66.32% 66.40% 66.66%
HR
Absence
Overall M-1M
3.5% 4.42% -26.28% 5.08% 3.62% 6.12% 3.17% 4.87% 4.24% 4.32% 4.99% 4.27% 4.46% 4.53%
EWTD Compliance
<24 hour shift M 100% 91.4% -8.6% 80.4% 100% 100% 89.9% 97.6% 93% 96.1% 100% 85.2% 93.5% 91.4% 91.4%
<48 hour working week M 95% 91% -4.2% 76.1% 90.9% 100% 75.4% 95.2% 90.7% 98.7% 98.5% 91.4% 90.4% 87.2% 91%
5 Data under review.
6 This covers all of Community Healthcare

Health Service Performance Profile – October to December 2017 Quarterly Report 34
Social Care

Health Service Performance Profile – October to December 2017 Quarterly Report 35
Social Care Balanced Scorecard/Heat Map
Rep
ort
ing
Fre
qu
en
cy
Ex
pe
cte
d
Acti
vit
y /
Ta
rge
t
Nati
on
al
YT
D
% V
ar
YT
D
CH
O 1
CH
O 2
CH
O 3
CH
O 4
CH
O 5
CH
O 6
CH
O 7
CH
O 8
CH
O 9
Cu
rre
nt
(-2
)
Cu
rre
nt
(-1
)
Cu
rre
nt
Qu
ali
ty &
Sa
fety
Serious Reportable Events
Investigations completed within 120 days
7
M 90% 22% -75.6%
Service User Experience
Complaints investigated within 30 working days
8
M 75% 83% 10.7%
Safeguarding
% of Prelim Screenings for Adults Aged 65 Years and Older (new KPI)
Q-1Q 100% 95.8% -4.2% 95% 100% 100% 100% 95.6% 100% 93.5% 92.5% 81.3%
78.5% 98.7% 95.8%
% of Prelim Screenings for Adults Under 65 Years (new KPI)
Q-1Q 100% 98.4% -1.6% 97% 97.1% 100% 98.9% 99.2% 97.2% 98.6% 98.4% 100%
83.9% 97.4% 98.4%
HR
Absence
Overall M-1M 3.5% 5.17% -47.71% 6.63% 5.21% 5.46% 4.65% 6.14% 4.07% 4.67% 6.46% 3.84% 5.19% 5.13%
7 Data under review.
8 This refers to all of Community Healthcare

Health Service Performance Profile – October to December 2017 Quarterly Report 36
Social Care - Disabilities

Health Service Performance Profile – October to December 2017 Quarterly Report 37
Social Care Division- Disabilities
*Total of 129 teams, starting from a base of 56
Disability Act Compliance
% of Preliminary Screenings for adults aged
65 years and over
PA Hours
Congregated Settings
% of Preliminary Screenings for adults under
65 years
Home Support Hours
28.1%
12.7%
100% 100%
19.6% 25.1%
0%
50%
100%
Q1 Q2 Q3 Q42016/2017 2015/2016
83.9%
97.4% 98.4% 100% 100%
50%
100%
Q1 Q2 Q3 Q42017
384,727 375,469 380,389
381,307
329,705
353,488
300,000
350,000
400,000
Q4 Q1 Q2 Q3
2015/2016 2016/2017
22 3 16
27 50
169
020406080
100120140160180
Q1 Q2 Q3 Q4
2015/2016 2016/2017
78.5%
98.7% 95.8% 100% 100%
50%
100%
Q1 Q2 Q3 Q42017
718,963 741,694 683,037
753,522
650,013 689,615
400,000
600,000
800,000
Q4 Q1 Q2 Q32015/2016 2016/2017
Performance area
Target/ Expected Activity Freq
Previous Period
YTD
Current Period
YTD Change SPLY YTD
SPLY Change
% of Disability Network Teams established
100% M 0 0 0
Number of Disability Network Teams established*
73 YTD/ 73 FYT
M 0 0 0
Disability Act Compliance 100% Q 29.7% 25.3% -4.4% ↓ 23.9% 1.4%
Congregated Settings 223 YTD/ 223 FYT
Q 97 147 50 73 74
% of Preliminary Screenings- Adults 65 years and older
100% Q-1Q 98.7% 95.8% -2.9% ↓
% of Preliminary Screenings – Adults under 65 years
100% Q-1Q 97.4% 98.4% +1%
PA hours 1,060,464 YTD/ 1,413,954 FYT
Q-1M 742,818 1,124,125 381,307 1,129,727 -5,602
Home Support 2,068,845 YTD/ 2,758,461 FYT
Q-1M 1,466,127 2,219,649 753,522 2,207,910 -11,739
Respite No of overnights 136,877 YTD/ 182,505 FYT
Q-1M 82,274 125,030 42,757 135,112 -10,082
Respite No of day only respite sessions
30,752 YTD / 40,998 FYT
Q-1M 22,120 34,837 12,717 32,782 2,055
HIQA 80% Q-1M 78.4% 77% -1.4% 63.6% 13.4%
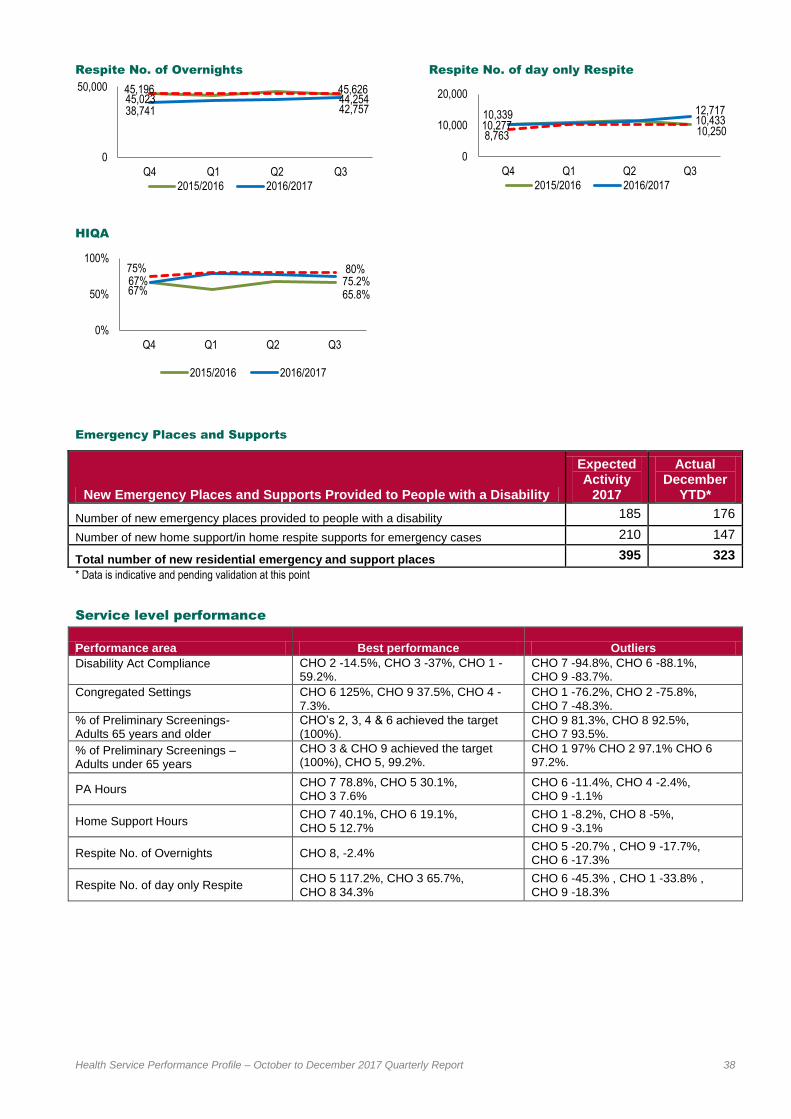
Health Service Performance Profile – October to December 2017 Quarterly Report 38
Respite No. of Overnights
HIQA
Respite No. of day only Respite
Emergency Places and Supports
* Data is indicative and pending validation at this point
Service level performance
Performance area Best performance Outliers
Disability Act Compliance
CHO 2 -14.5%, CHO 3 -37%, CHO 1 -59.2%.
CHO 7 -94.8%, CHO 6 -88.1%, CHO 9 -83.7%.
Congregated Settings
CHO 6 125%, CHO 9 37.5%, CHO 4 -7.3%.
CHO 1 -76.2%, CHO 2 -75.8%, CHO 7 -48.3%.
% of Preliminary Screenings- Adults 65 years and older
CHO‟s 2, 3, 4 & 6 achieved the target (100%).
CHO 9 81.3%, CHO 8 92.5%, CHO 7 93.5%.
% of Preliminary Screenings – Adults under 65 years
CHO 3 & CHO 9 achieved the target (100%), CHO 5, 99.2%.
CHO 1 97% CHO 2 97.1% CHO 6 97.2%.
PA Hours CHO 7 78.8%, CHO 5 30.1%, CHO 3 7.6%
CHO 6 -11.4%, CHO 4 -2.4%, CHO 9 -1.1%
Home Support Hours CHO 7 40.1%, CHO 6 19.1%, CHO 5 12.7%
CHO 1 -8.2%, CHO 8 -5%, CHO 9 -3.1%
Respite No. of Overnights CHO 8, -2.4% CHO 5 -20.7% , CHO 9 -17.7%, CHO 6 -17.3%
Respite No. of day only Respite CHO 5 117.2%, CHO 3 65.7%, CHO 8 34.3%
CHO 6 -45.3% , CHO 1 -33.8% , CHO 9 -18.3%
45,196 44,254
38,741 42,757 45,023
45,626
0
50,000
Q4 Q1 Q2 Q3
2015/2016 2016/2017
67% 65.8% 67% 75.2%
75% 80%
0%
50%
100%
Q4 Q1 Q2 Q3
2015/2016 2016/2017
10,339 10,433 10,277
12,717
8,763 10,250
0
10,000
20,000
Q4 Q1 Q2 Q3
2015/2016 2016/2017
New Emergency Places and Supports Provided to People with a Disability
Expected Activity
2017
Actual December
YTD*
Number of new emergency places provided to people with a disability 185 176
Number of new home support/in home respite supports for emergency cases 210 147
Total number of new residential emergency and support places 395 323

Health Service Performance Profile – October to December 2017 Quarterly Report 39
Divisional Commentary
Emergency Places
The variation in target in relation to Emergency Cases is attributed to a lower number of cases being delivered
with a higher cost value. The December submission has been completed following a validation exercise
undertaken across all CHOs in relation to Emergency Cases.
Progressing Disability Services (0-18 Teams)
A total of 56 network teams are in place. The appointment of Children‟s Disability Network Managers has
been identified as a critical enabler to facilitate the continued roll out of this programme.
Children’s Disability Network Manager Post(s): A Forum has been established comprising
representatives from Impact, HSE Corporate Employee Relations and HSE Disability Operations Team to
progress the implementation and recruitment of these posts. All parties have committed to completing
these negotiations by the end of January 2018.
Disability Act Compliance rates are slowly improving with 25.3% compliance in Q4 2017, in comparison to
23.9% at Q4 2016. In addition the total number of applications „overdue for completion‟ has reduced for the
first time since the Act commenced.
Standardised approach to Assessment of Need Revised Standard Operating Procedures for
Assessment of Need have been approved by the Social Care Management Team and noted by the HSE
Leadership Team. The revised procedures were circulated in December with an implementation date target
of March 1st 2018. Training for Assessment Officers regarding the implementation of this procedure has
commenced.
Improvement Plans at CHO level re Assessment of Need Waiting List - Each CHO now has a specific
improvement plan which sets out clear actions which will lead to an elimination of current waiting times. The
Disability Act 2005 sets out the requirement for assessments to be completed within 6 months of the date of
receipt in relation to this category. Work remains on-going across all 9 CHOs in relation to the
improvement/elimination of waiting lists for assessments for clinical assessments, with specific focus on
those areas with the largest waiting lists (Cork/Dublin areas).
Additional supports at national level – A team of three National Disability Specialists (NDS) is now in
place working with CHOs on a CHO basis in relation to Children‟s Disability Services. In addition the team
members have been assigned individual responsibility in relation to Disability Compliance, IT Steering
Group and the Access and Inclusion Model.
Training and Support – A specialist training and support resource has been made available to the NDS
team for deployment at CHO level. This will enable capacity building with frontline professionals.
Congregated Settings
Activity in relation to Q4 reflects a total of 147 people transitioned from congregated settings at the end of
December 2017 – which is an increase of 50 on the Sept 2017 figure. Work remains on-going to address the
key challenges arising in relation to the procurement of appropriate housing in a buoyant housing market, and
the undertaking of necessary works to ensure HIQA compliance – which must be secured before any new
facility can become operational.
Performance Notices
CHO1
CHO1 has been in escalation in relation to its financial and overall performance since April. A Performance
Notice was issued by the HSE to the Chief Officer of CHO1 on the 21st June 2017. The Notice set out the
HSE‟s performance expectations in respect of the CHO1‟s year-end financial position and its overall
performance. To date the Social Care Division has provided extensive ongoing support to CHO1 through a
programme of in-depth engagement and recommended improvement actions. Work is on-going with CHO1 in
relation to the improvement plan to address the current underperformance and the CHO has met targets in
relation to service provision. It is planned to review the performance of CHO1 at year end and consider the
potential of closing out the Improvement Plan assuming that the CHO has met all targets set out.

Health Service Performance Profile – October to December 2017 Quarterly Report 40
CHO2 Aras Attracta
While it is acknowledged that significant progress has been made to date over the period 2015 & 2016 concerns
have arisen as to 2017 performance in CHO2 Aras Attracta. Since these concern‟s emerged early in the year,
the Social Care Division together with the support of the Quality Improvement Division have provided significant
additional supports both by way of interventions and also capital and revenue resources. A Performance Notice
was issued in July to the Chief Officer of CHO2 in respect of Aras Attracta in relation to the above matters and
in particular Regulatory Concerns (HIQA) and underperformances issues in relation to same. The Division is
continuing to monitor and support CHO2 in relation to meeting the requirements of the Performance Notice
through the Improvement Plan to address the current underperformance.
St. John of God Community Services
As a result of a number of concerns of the HSE in relation to service delivery at SJOGCS which have been on-
going and the subject of meetings, correspondence and reports, a First Notification Letter was issued to
SJOGCS on the 26th July 2017 in accordance with the Service Arrangement. The Notification Letter sets out
the HSE‟s performance expectations in respect of SJOGCS in relation to HIQA Regulatory Compliance, HSE
Internal Audit Report Findings and Recommendations, Financial Management/Controls and Reported Deficits
and Service Performance. The HSE and SJOGCS are engaged in a National Task Forces process which
clearly sets out improvement actions across four key action improvement areas. The HSE, and representatives
of the Task Force, having met with the Chair and 2 non-executive Directors of SJOGs, issued the agreed final
draft Improvement Plan to SJOGs on December 28th. Two meetings with SJOGs are scheduled for January
2018, to agree a final Implementation Plan for subsequent implementation by the Board of SJOGCS and which
will be subject to oversight by Community Services.

Health Service Performance Profile – October to December 2017 Quarterly Report 41
Disabilities Balanced Scorecard/Heat Map
Rep
ort
ing
Fre
qu
en
cy
Ex
pe
cte
d A
cti
vit
y/
Ta
rge
t
Nati
on
al
YT
D
% V
ar
YT
D
CH
O 1
CH
O 2
CH
O 3
CH
O 4
CH
O 5
CH
O 6
CH
O 7
CH
O 8
CH
O 9
Cu
rre
nt
(-2
)
Cu
rre
nt
(-1
)
Cu
rre
nt
Qu
ali
ty &
Sa
fety
HIQA Compliance
HIQA Compliance Q-1M 80% 77% -3.7% 78.4% 77.8% 75.2%
Acc
es
s
Disability Network Teams 0-18 years
% established M 100% 0% 0% 0% 0% 0% 0% 0% 0% 0% 0% 0% 0% 0% 0%
Number established M 73 0 0 0 0 0 0 0 0 0 0 0 0 0 0
Disability Act
Disability Act Compliance Q 100% 25.3% -74.7% 40.8% 85.5% 63% 21.9% 20.8% 11.9% 5.2% 37.5% 16.3%
24% 35.1% 12.7%
Congregated Settings
Congregated Settings Q 223 147 -34.1% 5 8 7 38 25 9 15 29 11 53 17 50
Supports in the Community
PA Hours Q-1M 1,060,465 1,124,125 6% 103,596 208,976 236,412 90,151 97,845 16,289 30,923 120,891 219,042 369,314 373,504 381,307
Home Support Hours Q-1M 2,068,845 2,219,649 7.3% 231,780 142,892 110,826 160,649 203,764 274,481 417,788 366,588 310,882 731,318 734,809 753,522
Respite Overnights Q-1M 136,877 125,030 -8.7% 7,710 29,521 10,707 18,491 8,305 8,535 17,501 13,183 11,077 40,639 41,635 42,757
Respite Day Only Sessions Q-1M 30,752 34,837 13.3% 2,907 5,058 14,318 2,046 1,970 1,055 4,026 1,023 2,434 10,691 11,429 12,717
Fin
an
ce
Net Expenditure variance from plan
Total M €1,695,195 €1,723,470 1.67% 3.39% 0.33% 2.10% 1.84% 1.86% 1.28% 4.14% 1.79% 1.68%
1.79% 1.89% 1.67%
Pay M €640,895 €644,525 0.57%
1.46% 1.30% 0.57%
Non-pay M €1,103,958 €1,135,577 2.86%
1.84% 2.16% 2.86%
Income M -€49,658 -€56,631 14.04%
-1.48% 0.21% 14.04%
Service Arrangements (05.01.2018)
Number signed M 100% 87.21% 12.79%
86.12% 87.65% 87.21%
Monetary value signed M 100% 90.37% 9.63%
90.20% 90.37% 90.37%
Health Service Performance Profile – October to December 2017 Quarterly Report 42
Social Care – Older Persons

Health Service Performance Profile – October to December 2017 Quarterly Report 43
Social Care Division - Older Persons
Number of home help hours provided
% of Preliminary Screenings for adults aged
65 years and over
Delayed Discharges
Number of persons funded under NHSS in long
term residential care
Number of persons in receipt of a Home Care
Package
% of Preliminary Screenings for adults under
65 years
Delayed Discharges by Destination
Over
65 Under
65 Total Total
%
Home * 70 34 104 21.7%
Long Term Nursing Care 238 40 278 57.9%
Other 49 49 98 20.4%
Total 357 123 480 100%
*(This includes 45 people waiting for home supports (12 aged
<65y & 33 aged 65y or over); 5 of the 45 have their applications
processed & are waiting for funding (all 5 aged <65y)
862,424
895,457
847,673 855,238
871,921
871,945
800,000
900,000
1,000,000
1,100,000
1,200,000
Jan Feb Mar Apr May Jun Jul Aug Sep Oct Nov Dec
2015/2016 2016/2017
78.5%
98.7% 95.8% 100%
50%
70%
90%
Q1 Q2 Q3 Q42017
559
436 451
480
475 475
350
450
550
650
750
Jan Feb Mar Apr May Jun Jul Aug Sep Oct Nov Dec
2015/2016 2016/2017
23,093
23,142
23,019
22,949
23,171 23,292
22,000
22,400
22,800
23,200
23,600
Jan Feb Mar Apr May Jun Jul Aug Sep Oct Nov Dec
2015/2016 2016/2017
15,406 16,351
16,351
19,807
16,450
16,750
14,000
16,000
18,000
20,000
Jan Feb Mar Apr May Jun Jul Aug Sep Oct Nov Dec
2015/2016 2016/2017
83.9%
97.4% 98.4% 100%
50%
70%
90%
Q1 Q2 Q3 Q4
2017
Performance area
Target/ Expected Activity Freq
Previous Period YTD
Current Period YTD Change
SPLY YTD
SPLY Change
Home Help Hours 10.57m YTD /10.57m FYT
M 9,530,566 10,385,804 +855,238 10,546,733 -160,929 ↓
Home Care Packages 16,750 YTD 16,750 FYT
M 19,642 19,807 +165 16,351 +3,456 ↑
Number of people being funded under NHSS
23,292 YTD/ 23,292 FYT
M 23,066 22,949 -117 23,142 -193 ↓
Delayed Discharges < 475 M 582 480 -102 ↑ 436 +44
% of Preliminary Screenings – Adults 65 years and older (new KPI)
100% Q-1Q 98.7% 95.8% -2.9% ↓
% of Preliminary Screenings – Adults under 65 years(new KPI)
100% Q-1Q 97.4% 98.4% +1% ↑

Health Service Performance Profile – October to December 2017 Quarterly Report 44
NHSS Overview
Oct Nov Dec YTD 2017 Dec 16
No. of new applicants 704 887 703 9,911 700
National placement list for funding approval
466 562 537 537 400
Total no. people funded under NHSS in LTRC
23,125 23,066 22,949 22,949 23,142
Pri
va
te
Un
its
No. of new patients entering scheme
505 512 460 6,310 520
No. of patients Leaving NHSS
456 553 538 6,280 523
Increase 49 -41 -78 30 -3
Pu
bli
c
Un
its
No. of new patients entering scheme
135 142 104 1,763 139
No. of patients Leaving NHSS
130 146 134 1,817 146
Net Increase 5 -4 -30 -54 -7
*Note: In addition to the leavers above there were a further 169 (9 in Dec.) from Contract Beds/Subvention/Section 39 savers beds
Service level performance
Performance area Best performance Outliers
% of Preliminary Screenings- Adults 65 years and older
CHO‟s 2, 3, 4 & 6 achieved the target (100%)
CHO 9 81.3%, CHO 8 92.5%, CHO 7 93.5%,
% of Preliminary Screenings- Adults under 65 years
CHO 3 & CHO 9 achieved the target (100%), CHO 5 99.2%
CHO 1 97%, CHO 2 97.1%, CHO 6 97.2%
Home Help Hours CHO 9 10.9%, CHO 2 4.6%, CHO 4 0.6% CHO 6 -25.7%, CH0 7 -13%, CHO 5 -12%
Home Care Packages CHO 2 52.5%, CHO 7 40,9%, CHO 6 28.8%
All CHO‟s exceeded their targets
Delayed Discharges National Children's Hospital at Tallaght Hospital & Ennis (0), Mallow, Nenagh & St Johns (1)
St. James's Hospital (44), Beaumont Hospital (36) & Mater (36)
Divisional Update
Delayed Discharges
The end of December 2017 Delayed Discharge figure is 480. In December, there were 104 people waiting to go
home and of these the number of people awaiting HH and HCP was 45 (5 were approved with funding awaited
–all 5 aged under 65). The remaining people were awaiting a specific community provision, new or refurbished
home, convalescent or other unspecified input. All hospitals continue to have access to an unlimited number of
transitional Care Beds. The total national approved for Nov is 817 with a total YTD of 8,156.
Home Care
HCP activity is over target (+18.3%) and HH Hours activity is slightly under target (-1.7%) at the end of
December. The HCP activity over target is reduced to 14.85% when the additional HCPs in December are taken
into account. Some CHOs are experiencing capacity issues in terms of availability of home care staff. In such
cases where appropriate, the home care service may be delivered through the HCP scheme to enable the
person to return to, or remain at, home. This results in some CHOs being below target in relation to home help
and above target on HCPs (CHO 3,5, 6, 7 & CHO 8). CHO 2 & 9 are exceeding both HH and HCP targets this
month as lower value HCPs are being approved but such arrangements are being carefully managed within the
overall home care resources available in the CHO. Please note changes to Home Support Service will be
implemented in 2018 which will streamline the data and make it clearer (Home Support Service section below).

Health Service Performance Profile – October to December 2017 Quarterly Report 45
Whilst additional Home Care funding is acknowledged and has been targeted to support home support services,
(45 extra HCPs per week directed towards specific hospitals commenced in Oct) demand for home support
continues to exceed the level of service that can be funded. Waiting lists for HH and HCP have become a
feature of the service as resources have not kept pace with population growth, or with the increasing
dependency of the growing numbers of people aged ≥80years, within the over 65 years cohort. The CHO
waiting lists for the end of December 2017 indicates that 5,418 people were waiting for home care funding. All
those waiting are assessed and people being discharged from acute hospitals, who are in a position to return
home with supports, are prioritised. The table above demonstrates the effect of increased demographics on
home care services.
Home Support 2018 – a single funded service
With the approval of the Department of Health, the HSE has worked during 2017 to streamline the home care
packages scheme and home help services and will move to a single funded service from 2018 which will be
called “Home Support Service for Older People”. This new approach will provide significant benefits for the
service users, the public and the health system. The services will be easier to understand and through the
streamlining of the application processes there will be a requirement to make only one application and decision
for home support services for older people. Service users will also be facilitated to move to changed levels of
service as their assessed needs change without the need for an additional application process. This approach
will also make activity data more transparent & accountable and it will be easier to understand as the key data
to be collected will be number of hours and number of clients in receipt. Intensive Home Care Packages being
funded separately and centralised, will remain separate for the time being.
Overall, in 2018, 17,094m home support hours are expected to be delivered to 50,500 people at any time. In
addition, Intensive Home Care Packages will be delivered to approximately 235 people at any time and will
deliver approximately 360,000 hours in the full year.
Given the importance of ensuring the robustness of comparative analysis, the 2017 national activity levels are
also available in the new format so that direct comparisons can be made between 2017 and 2018 activity. In
2018, as stated above 17.094m home support hours are expected to be provided to 50,500 people at any time,
which compares with 16.34m hours projected to be delivered to 50,000 people (reflecting home help and home
care package funded hours/clients combined) in 2017, showing an increase of 754,000 hours and an increase
of 500 people in receipt in 2018.
Safeguarding
The issue of noncompliance in % of Preliminary Screenings- Adults 65 years and older relates primarily to a
reporting issue. On further examination it has been determined that this is inaccurate. The data will be revisited
and updated data will be provided with the December data in the next reporting cycle. Overall compliance is
97% nationally.
3228
3835 3930 4353
4811 4973 5006
4443 4381 4506 4544 4576 4674 4842 4871 4687 4871 5232
5430 5337 5418
0
1000
2000
3000
4000
5000
6000
Total No of People on Waiting Lists for HH Hours & HCP's
Total Waiting List

Health Service Performance Profile – October to December 2017 Quarterly Report 46
Quality and Patient Safety
In relation to the % of CHOs who have established a Residents’ Council / Family Forum / Service User Panel or
equivalent for Services for Older People a review of CHO7 indicates resident committees are in place in majority
of settings and work is on-going to ensure full compliance.
NHSS
In December 2017 the Nursing Homes Support Scheme funded 22,949 long term public and private residential
places, and when adjusted for clients not in payment, there were 24,115 places supported under the scheme.
There is a decrease of 193 in the number of people supported under the scheme when compared to the same
period last year, a 0.8% decrease in activity year on year. The revised target for 2017 of 23,292 people to be
supported under the scheme at year end has not been realised due mainly to a higher number of leavers than
anticipated and a decrease in the number of applications received for financial support under the scheme.
The target of maintaining the wait time for funding approval at no more than 4 weeks is being achieved and this
target has consistently been achieved since April 2015. The number on the placement list at the end of
December 2017 is 537 (December 2016 – 400), a significant reduction from the numbers waiting in October
2014 (2,135).
A total of 8,168 people were approved for funding under the scheme in 2017 compared to 8,383 people
approved in 2016, a decrease of 215 approvals or 2.6% year on year. In 2017, 9,911 applications were
received and 8,073 new clients went into care and were funded under the scheme in public and private nursing
homes. This is a decrease of 48 or 0.6% in the number of new clients supported under the scheme when
compared to 2016. The scheme is taking on new clients within the limits of the resources available, in
accordance with the legislation and Government policy.
.

Health Service Performance Profile – October to December 2017 Quarterly Report 47
Older Persons Balanced Scorecard/Heat Map
Rep
ort
ing
Fre
qu
en
cy
Ex
pe
cte
d
Acti
vit
y /
Ta
rge
t
Nati
on
al
YT
D
% V
ar
YT
D
CH
O 1
CH
O 2
CH
O 3
CH
O 4
CH
O 5
CH
O 6
CH
O 7
CH
O 8
CH
O 9
Cu
rre
nt
(-2
)
Cu
rre
nt
(-1
)
Cu
rre
nt
Acc
es
s
Home Care Services
Home Help Hours M 10,570,000 10,385,804 -1.7% 1,442,142 1,353,387 922,108 1,995,759 1,146,958 337,968 638,601 1,249,355 1,299,527 864,266 870,433 855,238
Home Care Packages M 16,750 19,807 18.3% 1,378 1,912 1,149 1,557 1,242 2,221 3,060 2,681 4,607 19,486 19,642 19,807
NHSS
Number of people funded under NHSS
M 23,292 22,949 -1.5%
23,125 23,066 22,949
Delayed Discharges
Number of people subject to Delayed Discharge
M < 475 480 -1.1%
563 582 480
Fin
an
ce
Net Expenditure variance from plan
Total M €806,557 €803,920 -0.33% -0.04% 3.12% 0.06% -0.32% 0.32% -0.52% 5.26% 0.76% 1.50%
2.08% 2.05% -0.33%
Pay M €699,614 €693,443 -0.88%
-0.87% -0.02% -0.88%
Non-pay M €490,171 €491,173 0.20%
4.05% 2.79% 0.20%
Income M -€383,229 -€380,696 -0.66%
-0.83% -0.74% -0.66%
Service Arrangements (05.01.2018)
Number signed M 3.50% 99.07% 0.93% 99.35% 99.44% 99.07%
Monetary value signed M 3.50% 98.88% 1.12% 98.89% 98.88% 98.88%

Health Service Performance Profile – October to December 2017 Quarterly Report 48
National Ambulance Service

Health Service Performance Profile – October to December 2017 Quarterly Report 49
National Ambulance Service
Allocation of Resource within 90 seconds -
ECHO
Response Times (within 18 minutes, 59
seconds) – ECHO
Call Volume (arrived at scene) – ECHO
ROSC
Allocation of Resource within 90 seconds -
DELTA
Response Times (within 18 minutes, 59
seconds) – DELTA
Call Volume (arrived at scene) – DELTA
97.3%
97.8%
85%
80%
90%
100%
Jan Feb Mar Apr May Jun Jul Aug Sep Oct Nov Dec
2016/2017
78.2% 78.5%
82.7% 80%
60%
80%
100%
Jan Feb Mar Apr May Jun Jul Aug Sep Oct Nov Dec
2015/2016 2016/2017
450
429 394
501
440
300
400
500
Jan Feb Mar Apr May Jun Jul Aug Sep Oct Nov Dec
2015/2016 2016/2017
42.3% 45.1%
40.3%
36%
40%
35.0%
40.0%
45.0%
50.0%
55.0%
Dec Mar Jun Sept
2016/2017 2015/2016
91.7% 89.9%
85%
80%
90%
100%
Jan Feb Mar Apr May Jun Jul Aug Sep Oct Nov Dec
2016/2017
56.5% 56.3%
60.1% 54%
80%
50%
70%
90%
Jan Feb Mar Apr May Jun Jul Aug Sep Oct Nov Dec
2015/2016 2016/2017
10,837
11,600
10,310 12,078
10,179
6,000
8,000
10,000
12,000
14,000
Jan Feb Mar Apr May Jun Jul Aug Sep Oct Nov Dec
2015/2016 2016/2017
Performance area
Target/ Expected Activity Freq
Previous Period YTD
Current Period
YTD Change SPLY YTD
SPLY Change
Allocation of Resource within 90 seconds - ECHO
85% M 98.3% 98.2% 0.1% 94.7% 3.5%
Allocation of Resource within 90 seconds - DELTA
85% M 91.5% 91.3% 0.2% 88.8% 2.5%
Response Times - ECHO 80% M 82.9% 82.7% 0.2% 80.9% 1.8%
Response Times - DELTA 80% M 62.2% 61.3% 0.9% 60.5% 0.8%
% turnaround delays escalated ( where ambulances not cleared in 60mins)
100% M 98.8% 98.7% 0.1% 95.5% 3.2%
ROSC 40% Q-1Q 41.6% 42.6% 1.0% 44.8% 2.2%

Health Service Performance Profile – October to December 2017 Quarterly Report 50
Service level performance
Performance area Best performance Outliers
Allocation of Resource within 90 seconds - ECHO
South 99%, West 94.7 %, North Leinster 98.8 %
Allocation of Resource within 90 seconds - DELTA
West 90%,South92.2 %, North Leinster 88.2%
Response Times - ECHO North Leinster 86.9%, Dublin Fire Brigade 81.7%, South 81.2%
Western Area 64.8%
Response Times - DELTA North Leinster 60.8% Western Area 55.2%,Southern Area 57.6%, Dublin Fire Brigade 42.1%
Divisional Update
Activity volume for AS19
and AS210
calls received this month has increased by 973 (3%) since the same
month last year.
The daily average call rate for AS11 and AS2
2 calls received this month was 997. (31 days this month)
ECHO (life-threatening cardiac or respiratory arrest) incidents responded to within the target timeframe of
80% in 18 minutes and 59 seconds was on target at 80% this month. This is 3% compared to last month.
ECHO calls increased by 12% (58) compared to the same month last year.
DELTA (life-threatening illness or injury, other than cardiac or respiratory arrest) incidents responded to
within the expected activity timeframe of 80% in 18 minutes and 59 seconds was 54% this month. This has
decreased by 6% since last month.
Nationally there was a 6% (682) increase in DELTA call activity compared to the same month last year.
9 AS1 – 112/ 999 emergency and urgent calls
10 AS2 - Urgent calls received from a general practitioner or other medical sources

Health Service Performance Profile – October to December 2017 Quarterly Report 51
National Ambulance Service Balanced Scorecard/Heat Map
Rep
ort
ing
Fre
qu
en
cy
Ex
pe
cte
d
Acti
vit
y /
Ta
rge
t
Nati
on
al
YT
D
% V
ar
YT
D
No
rth
Le
ins
ter
So
uth
We
st
Du
bli
n
Fir
e B
rig
ad
e
Cu
rre
nt
(-2
)
Cu
rre
nt
(-1
)
Cu
rre
nt
Qu
ali
ty &
Sa
fety
Serious Reportable Events
Investigations completed within 120 days M 90% NA
Service User Experience
Complaints investigated within 30 working days
M 75% 28% -62.7%
Resource Allocation within 90 seconds
ECHO M 85% 98.3% 15.6% 97.6% 99.1% 98.3% 99.3% 98.4% 97.8%
DELTA M 85% 91.3% 7.4% 89.1% 92.6% 93.1% 90.7% 90.5% 89.9%
ROSC
Return of Spontaneous Circulation Q-1Q 40% 42.6% 6.5% 43.6% 45.1%
Ac
ce
ss Response Times - within 18 minutes, 59 seconds
ECHO M 80% 82.7% 3.3% 85.9% 80.1% 79.4% 83.2% 81.6% 83.4% 80%
DELTA M 80% 61.4% -23.2% 64.9% 61.5% 62.4% 56.1% 62.2% 59.8% 54%
Fin
an
ce Net Expenditure variance from plan
Total M €157,771 €157,000 -0.49% -1.20% -1.07% -0.49%
Pay M €118,828 €116,217 -2.20% -1.66% -1.62% -2.20%
Non-pay M €39,304 €42,078 7.06% 0.29% 0.74% 7.06%
HR
Absence
Overall M-1M 3.50% 5.83% -28.57% 5.95% 4.94%

Health Service Performance Profile – October to December 2017 Quarterly Report 52
Acute Hospitals

Health Service Performance Profile – October to December 2017 Quarterly Report 53
Acute Hospitals
Overview of Key Acute Hospital Activity
Activity Area Result YTD Dec 2017
Expected Activity YTD
Result YTD Dec 2016
SPLY % Var
Result Oct
Result Nov
Result Dec
Emergency
Presentations 1,416,367 1,393,358 1,382,300 +2.5% 120,206 117,718 119,487
New ED Attendances 1,182,805 1,168,318 1,157,074 +2.2% 101,156 98,831 101,623
OPD Attendances 3,303,568 3,440,981 3,327,526 -0.7% 276,587 301,595 219,572
Activity Area (HIPE data month in arrears)
Result YTD Nov 2017
Expected Activity YTD
Result YTD Nov 2016
SPLY % Var
Result Sept
Result Oct
Result Nov
Inpatient [IP] Discharges 582,848 586,785 581,868 +0.2% 52,880 52,652 54,050
Day Case [DC] Discharges
993,713 980,386 976,214 +1.8% 89,409 89,506 96,095
IP & DC Discharges 1,576,561 1,567,171 1,558,082 +1.2% 142,289 142,158 150,145
% IP 37% 37.4% 37.3% -0.3% 37.2% 37% 36%
% DC 63% 62.6% 62.7% +0.3% 62.8% 63% 64%
Emergency IP Discharges 395,526 393,067 391,073 +1.1% 35,358 35,561 36,791
Elective IP Discharges 85,831 87,260 84,972 +1% 8,056 7,931 8,410
Maternity IP Discharges 101,491 106,458 105,822 -4.1% 9,466 9,160 8,849
Waiting Lists
Target/ Expected Activity Freq
Previous Period YTD
Current Period
YTD Change SPLY YTD
SPLY Change
Inpatient adult waiting list within 15 months 90% M 85.8% 86.5% +0.7% 91% -4.5%
Daycase adult waiting list within 15 months 95% M 93.2% 92.6% -0.6% 93.2% -0.6%
Inpatient children waiting list within 15 months
95% M 88.9% 88.7% -0.2% 94.1% -5.4%
Daycase children waiting list within 15 months
97% M 87.5% 85.9% -1.6% 92.7% -6.8%
Outpatient waiting list within 52 weeks 85% M 72.9% 72.4% -0. 5% 80.7% -8.3%
Inpatient and Day Case Waiting List
Outpatient Waiting List
Patient Experience Time
Target/ Expected Activity Freq
Previous Period YTD
Current Period YTD Change
SPLY YTD
SPLY Change
% 75 years within 9 hours 100% M 62.5% 62% -0.5% 62.6% -0.6%
% 75 years within 24 hours (new KPI) 100% M 92.5% 92.4% -0.1%
% in ED < 24 hours 100% M 96.9% 96.9% 96.7% +0.2%
% within 6 hours 75% M 66.6% 66.3% -0.3% 67.3% -1%
% who leave before completion of treatment
< 5% M 5.5% 5.6% +0.1% 5.3% +0.3%
% patients admitted or discharged within 6
hours
ED over 24 hours
7,710 7,656
2,937 4,495
0
5,000
10,000
15,000
Jan Feb Mar Apr May Jun Jul Aug Sep Oct Nov Dec
15m+ 18m+
58,766 99,474
35,945
69,904
0
50,000
100,000
150,000
Jan Feb Mar Apr May Jun Jul Aug Sep Oct Nov Dec
15m+ 18m+
64.4% 63.1%
75%
50%
70%
90%
Jan Feb Mar Apr May Jun Jul Aug Sep Oct Nov Dec2016/2017
1,461 1,175
4,318 3,519
0 01,0002,0003,0004,0005,000
Jan Feb Mar Apr May Jun Jul Aug Sep Oct Nov Dec
Patients 75+ >24 hrs All patients > 24 hrs

Health Service Performance Profile – October to December 2017 Quarterly Report 54
% patients over 75 years admitted or
discharged within 9 hours
% of patients who leave before completion of
treatment
Colonoscopy
Target/ Expected Activity Freq
Previous Period YTD
Current Period
YTD Change SPLY YTD
SPLY Change
Urgent colonoscopy – number of people waiting > 4 weeks (new KPI)
0 M 67 68 +1
Routine Colonoscopy within 13 weeks 70% M 56.9% 57.8% +0.9% 58% -0.2%
Urgent Colonoscopy – number of people
waiting > 4 weeks
Number on waiting list for GI Scopes
Breast Cancer within 2 weeks
Prostate Cancer within 20 working days
Lung Cancer within 10 working days
Radiotherapy within 15 working days
57.8%
57.2%
100%
25%
45%
65%
85%
105%
Jan Feb Mar Apr May Jun Jul Aug Sep Oct Nov Dec
2016/2017
4.9%
6.4%
5%
3%
5%
7%
Jan Feb Mar Apr May Jun Jul Aug Sep Oct Nov Dec
2016/2017
27
1 0
50
Jan Feb Mar Apr May Jun Jul Aug Sep Oct Nov Dec
2017
9,943 10,177
7,498 7,441
0
4,000
8,000
12,000
Jan Feb Mar Apr May Jun Jul Aug Sep Oct Nov Dec
<13 weeks > 13 week breaches
99.5%
78.1%
87.7%
95.2%
95%
55%
65%
75%
85%
95%
Jan Feb Mar Apr May Jun Jul Aug Sep Oct Nov Dec
2015/2016 2016/2017
64.2%
65.1% 45.5%
77%
90%
0%
50%
100%
Jan Feb Mar Apr May Jun Jul Aug Sep Oct Nov Dec2015/2016 2016/2017
88.54%
84.6% 82.1%
88.9%
95%
70%
80%
90%
100%
Jan Feb Mar Apr May Jun Jul Aug Sep Oct Nov Dec
2015/2016 2016/2017
86.6% 76.3%
74.6% 73.7%
90%
60%
80%
100%
Jan Feb Mar Apr May Jun Jul Aug Sep Oct Nov Dec2015/2016 2016/2017
Cancer Services
Target/ Expected Activity Freq
Previous Period YTD
Current Period YTD Change
SPLY YTD
SPLY Change
Urgent breast cancer within 2 weeks 95% M 73.8% 75.3% +1.5% 87.9% -12.6%
Routine breast cancer within 12 weeks 95% M 70.9% 71.1% +0.2% 72.7% -1.6%
Lung Cancer within 10 working days 95% M 82% 82.3% +0.3% 81.5% +1.1%
Prostate cancer within 20 working days 90% M 60.3% 61.5% +1.2% 53.4% +8.1%
Radiotherapy within 15 working days 90% M 76.6% 76.3% -0.3% 83.1% -6.8%
Number deemed suitable for colonoscopy in December
Number scheduled over 20 working days in December
Bowel Screen Colonoscopy Activity 220 140

Health Service Performance Profile – October to December 2017 Quarterly Report 55
Delayed Discharges
Ambulance Turnaround Times
Rate of Staph. Aureus bloodstream infections
in Acute Hospital per 10,000 bed days
Delayed Discharges by destination
Over
65 Under
65 Total
Total %
Home 70 34 104 21.7%
Long Term Nursing Care
238 40 278 57.9%
Other 49 49 98 20.4%
Total 357 123 480 100%
Ambulance Turnaround Times breakdown
Rate of new cases of Clostridium Difficile
associated diarrhoea in Acute Hospitals per
10,000 bed days used
559
436 451
480
475
350
550
750
Jan Feb Mar Apr May Jun Jul Aug Sep Oct Nov Dec
2015/2016 2016/2017
22 35 7 6
5 0
34 41
0
20
40
60
Jan Feb Mar Apr May Jun Jul Aug Sep Oct Nov Dec3-4 hours 4-5 hours 5 - 6 hours > 3 hours
0.9
0.9 0.6
1.1
1.6
Jan Feb Mar Apr May Jun Jul Aug Sep Oct Nov Dec
2017
2.5
1.8
0.0
1.0
2.0
3.0
Jan Feb Mar Apr May Jun Jul Aug Sep Oct Nov Dec
2017
Performance Area
Target/ Expected Activity Freq
Previous Period YTD
Current Period YTD Change
SPLY YTD
SPLY Change
HCAI – Rate of new cases of Staph. Aureus infection (new KPI)
<1 M 0.9 0.9
HCAI – rate of new cases of C Difficile infection (new KPI)
< 2 M 2.1 1.8 -0.3%
Maternity Safety Statements 100% M-2M 84.2% 100% +15.8% 94.7% +5.3%
Medical Readmission Rates (new KPI) 11.1% M-1M 11.1% 11.1%
Surgical Readmission Rates < 3% M-1M 2% 2% 2.1% -0.1%
Hip Fracture Surgery within 48 hours 95% M-1M 85.4% 85.5% +0.1% 85.4% +0.1%
Medical Average Length of Stay 6.3 days M-1M 6.8 6.8 6.8
Surgical Average Length of Stay 5 days M-1M 5.3 5.4 +0.1
5.4
Ambulance Clearance Times < 60 minutes 95% M 92.7% 92.4% -0.3% 93% -0.6%
Elective Laparoscopic Cholecystectomy > 60% M-1M 45.6% 45.5% -0.1%
43.4% -2.1%
Number of beds subject to Delayed Discharge
<475 M 582 480 -102 436 +44
Jun 17
Jul 17
Aug 17
Sept 17
Oct 17
Nov 17
Dec 17
3-4 hours 11 6 4 7 11 11 35
4-5 hours 1 1 1 0 3 1 6
5 - 6 hours 0 0 1 1 0 0 0
> 3 hours 12 7 6 8 14 12 41

Health Service Performance Profile – October to December 2017 Quarterly Report 56
Service level performance
Performance Area Best performance Outliers
Inpatient adult waiting list within 15 months
25 out of 39 hospitals achieved target Cork (75.1%), Galway (77.7%) & St James’s (77.8%)
Daycase adult waiting list within 15 months
27 out of 41 hospitals achieved target Roscommon (85%), University Hospital Limerick (85.8%) & Galway (87.8%)
Inpatient children waiting list within 15 months
17 out of 23 hospitals achieved target OLH Crumlin (78.5%), Sligo (80.1%) & Galway (86.5%)
Daycase children waiting list within 15 months
25 out of 32 hospitals achieved target OLH Crumlin (77%), National Children’s Hospital at Tallaght (82.5%) & Galway (85.3%)
Outpatient waiting list within 52 weeks
10 out of 45 hospitals achieved target RVEEH (52.7%), Croom (53.9%) & Waterford (58.8%)
% 75 years within 9 hours PET St Luke's Hospital Kilkenny (95.7%), Portlaoise (86.3%) & Letterkenny (74.1%)
University Hospital Limerick (35.5%),Tallaght Adults (43.4%) & Beaumont (46.4%)
% 75 years within 24 hours PET St Lukes’ Kilkenny & Sligo (100%), Letterkenny (99.8&) & Portiuncula (99.7%)
University Hospital Limerick (75.5%), University Hospital Waterford (79.9%) & Naas (80.9%)
% within 6 hours PET St Luke’s Hospital Kilkenny (89.6%), OLH Crumlin (84.5%) & Portlaoise (79.8%)
Tallaght (37.7%), Beaumont (46.5%) & St James’s (47.8%)
% who leave before completion of treatment
19 out of 30 hospitals achieved target Mater (19.2%), St. James’s (18%) & Tallaght (16.3%)
Urgent colonoscopy – number waiting > 4 weeks
38 out of 39 hospitals achieved target Navan (1)
Routine Colonoscopy within 13 weeks 19 out of 39 hospitals achieved target Naas (24.6%), Waterford (35.9%) & Limerick (37.9%).
Urgent breast cancer within 2 weeks 7 out of 9 hospitals achieved target Waterford (57.1%) & Letterkenny (84.5%)
Routine breast cancer within 12 weeks
St Vincent’s, Beaumont & Limerick (100%), Galway (97.8%)
Mater (25.2%), Waterford (32.8%), Letterkenny (37.2%), St James’s (44.4%) & Cork (59.1%)
Lung Cancer within 10 working days 5 out of 8 hospitals achieved target Limerick (58.7%) & Cork (83.3%) & Beaumont (94.7%)
Prostate cancer within 20 working days
Beaumont, St Vincent’s, & Galway (100%) & Mater (97.4%) Waterford (95.7%)
Limerick (5.9%), St James’s (6.3%) & Cork (41.4%)
Radiotherapy within 15 working days
UPMC, Whitfield, Waterford (100%) &
Mid-Western Radiation Oncology Centre Limerick (98.2%)
Cork (50%), SLRON Network (71.9%) & Altnagelvin (75%)
HCAI rates - Staph. Aureus 37 out of 48 hospitals achieved target OLH Crumlin (6.0), Tallaght (3.1) & Connolly (2.6)
HCAI rates – Cdiff 36 out of 48 hospitals achieved target Mallow (6.6), St James’s (4.7) & Tullamore (3.9)
Medical Readmission Rates 26 out of 38 hospitals achieved target Letterkenny (14.7%), South Tipperary (13.8%) & Tullamore (13.1%)
Surgical Readmission Rates 38 out of 42 hospitals achieved target Cork (3.4%), Kerry (3.2%) & Tullamore (3.1%)
Hip Fracture Surgery within 48 hours 6 out of 16 hospitals achieved target Drogheda (60%) Cork (67.9%) & Limerick (72.2%)
Medical Average Length of Stay 9 out of 35 hospitals achieved target Roscommon (13.7), Beaumont (11.7) & Tallaght Hospital - Adults (11.1)
Surgical Average Length of Stay 15 out of 34 hospitals achieved target St. James's (9.5), Mater (8.9) & St. Vincent's (8.0)
Ambulance Clearance Times
< 60 minutes 15 out of 34 hospitals achieved target
Letterkenny (71.7%), Mayo (77%) & Waterford (80.1%)
Elective Laparoscopic Cholecystectomy
12 out of 36 hospitals achieved target 10 out of 36 hospitals are at 0%
Number of beds subject to Delayed Discharge
National Children's Hospital at Tallaght Hospital & Ennis (0), Mallow, Nenagh & St Johns (1)
St. James's Hospital (44), Mater & Beaumont Hospital (36) & Drogheda (32)

Health Service Performance Profile – October to December 2017 Quarterly Report 57
Divisional Update
Emergency Department (ED) Performance
New ED attendances increased by 2.2% when ED attendances Year to Date December 2017 are compared
with Year to Date December 2016. New ED Attendances in December 2017 were 101,623 versus 97,645 in
December 2016 on a national basis, that is, an increase of 4%.
ED PET less than 24 hours (all patients) was 96.7% in December 2017. ED PET less than 24 hours for
patients aged 75+ was 91.5% in December 2017.
ED PET less than 9 hours (all patients) was 78.7% in December 2017.
ED Congestion Escalation Directive
A conjoint Directive was signed by the Minister for Health, the Director General and the National Director for
Acute Hospital Services in November 2015. It provides for distinct stages of escalation with clearly delineated
thresholds, actions and owners.
Reduction in Delayed Discharges (DD)
There were 480 Delayed Discharges at the end of December 2017. Additional funding for winter 2017 measures
will provide for the following;
45 additional home care packages every week for a 26 week period.
20 additional transitional care bed approvals per week for 12 acute hospitals from mid October 2017 to
support the discharge of patients from acute care but may require further convalescence before returning
home or for patients awaiting their application to be processed under the Nursing Home Support Scheme.
European Working Time Directive
As a result of a robust joint verification process led by the Acute Hospitals Division and the IMO, and including
representation from DOH, further improvements were observed during 2016 with an increase in compliance
from 76% in December 2015 to 81% in December 2016 with an average 48 hour working week for all NCHDs.
In 2017, the compliance has been consistent at 82%. Based on preliminary data for November 2017, the
compliance is 83%.
The critical success factors in effecting sustained improvements are as follows;
Targeting those sites where performance was well below the national average.
Focus on increasing intern compliance in all sites.
Site visits and robust interrogation of performance data and rosters.
Shared learning from those sites that had delivered sustained improvements.
Inpatient/Day Case Discharges (based on HIPE data which is one month in arrears)
Day Case Discharges (including dialysis)
The number of day case procedures Year to Date November 2017 was 993,713 versus 976,214 for the same
period in 2016, that is, an increase of 17,499 (1.8%) cases. The number of day cases Year to Date November
2017 was 1.4% higher than the Year to Date target of 980,386. The number of day cases undertaken in the
November 2017 was 96,095 versus 86,801 in November 2016, that is, an increase of 9,294 cases (10.7%).
Inpatient Discharges
The number of inpatient discharges was 582,848 Year to Date November 2017 versus 581,868 for the
corresponding period in 2016, that is, an increase of 980 (0.2%) cases. The number of inpatient discharges in
November 2017 was 54,050 versus 52,851 in November 2016, that is, an increase of 1,199 cases (2.3%).
Elective Inpatient Discharges
There were 85,831 elective inpatient discharges for the period January to November 2017 versus 84,972 for the
same period in 2016, that is, an increase of 1%. Elective inpatient discharges were 1.6% lower than the target of
87,260 for the period January to November 2017.
Emergency Inpatient Discharges
There were 395,526 emergency inpatient discharges Year to Date November 2017 and 391,073 for the
corresponding period in 2016, that is, an increase of 1.1%. Emergency discharges were 0.6% higher than the
Year to Date November 2017 target of 393,067.
Maternity Inpatient Discharges

Health Service Performance Profile – October to December 2017 Quarterly Report 58
Maternity inpatient discharges were 101,491 Year to Date November 2017 and 105,822 for the corresponding
period in 2016, that is, a decrease of 4,331 (4.1%) patient discharges.
It should be noted that the February 2017 data had one day less than February 2016 having regard to the fact
that 2016 was a leap year.
Colonoscopies
There was a significant improvement in waiting times for routine colonoscopies between October and December
2017. The compliance rate improved from 51.9% in October 2017 to 57.8% in December 2017.
A national Endoscopy Working Group was established following the appointment of a National Endoscopy Lead.
The priority areas for the National Endoscopy Working Group are: capacity and demand analysis, referral
pathways, validation and scheduling, quality assurance, training and liaison with the bowel screen service.
The following deliverables are complete;
I. Capacity and Demand Analysis
The phase 1 Capacity and Demand study is complete. An independent assessment of future GI endoscopy
capacity requirements across hospitals has been commissioned by the HSE to complement the Phase 1
Capacity and Demand study. The purpose of the study is as follows;
a. Outline the required endoscopy capacity for the next three to ten years across all Hospital Groups.
b. Provide further information for utilising the Smaller Hospitals Framework.
c. Inform likely future Bowel Screen requirements.
d. Support and contribute to the work of the National Endoscopy Working Group and the National Clinical
Lead for Endoscopy.
II. Referral Pathway
a. The NTPF published a GI Endoscopy direct referral pathway in January 2017. This pathway is a section of
the overarching National Inpatient, Day Case, and Planned Procedure Waiting List Management Protocol.
The protocol is complete and is applicable to referrals received by endoscopy units from outpatients, ED,
private entities and GPs.
b. Phase 1 of a GP eReferral demonstrator project on Healthlink is complete. Phase 2 commenced with GP
practices referring to St Vincent‟s University Hospital, Beaumont Hospital, Mater Misericordiae University
Hospital and University Hospital Limerick.
Cancer Services
The National Cancer Control Programme undertook an in depth review of the performance of Symptomatic
Breast Clinics and Rapid Access Clinics for prostate and lung cancer services in designated cancer centres in
2016 (Phase 1). The purpose of the review was to identify opportunities to improve the performance of these
clinics. The improvement initiatives identified include the introduction of a systematic and consistent approach to
enhancing access to these clinics having regard to national policy guidelines.
Phase 2 of the project will focus on the implementation of the improvement initiatives by the eight cancer sites.
The improvement initiatives will be implemented in waves having regard to resource requirements and
timeframe for delivery. The Wave I initiatives are currently being implemented in the eight cancer centres. The
core objective of these initiatives is to drive process improvement, efficiency and enhance the patient pathway.
The Wave I improvement initiatives were 78% complete at the end of December.
Seven of the eight cancer centres achieved or exceeded the 2017 National Service Plan (NSP) target in relation
to urgent symptomatic breast patient referrals to Symptomatic Breast Cancer clinics. Five of the eight cancer
centres complied with the NSP target for lung cancer referrals to Rapid Access Clinics for Lung Cancer. Five of
the eight cancer centres complied with the NSP target for prostate cancer referrals to Rapid Access Clinics for
prostate cancer.

Health Service Performance Profile – October to December 2017 Quarterly Report 59
Waiting Lists
Inpatient/Day Case Waiting Lists
The Department of Health approved an Inpatient/Day Case waiting list improvement plan for 2017. Under this
Plan 31,600 patients have come off the waiting list at the 31st October which exceeded the target of 29,838.
HSE also exceeded the target number waiting as of 31 October; it was agreed that the number waiting over 15
months at end October would be 9,151 and the number was 7,282.
The Department of Health notified the HSE in early October 2017 that it had ring fenced a further €10m in 2017
to support measures to reduce waiting times through a mixture of insourcing measures within the HSE and the
purchase of private capacity via the National Treatment Purchase Fund. The HSE agreed the cases with the
NTPF and the targeted areas were the longest waiters and complex cases such as cardio-thoracic, spinal,
orthopaedic, neurosurgical and pain management cases.
Action Plan for Scoliosis
The Action Plan for Scoliosis aims to ensure that no patient who requires scoliosis surgery will be waiting more
than four months for surgery by the end of 2017. The Plan addresses treatment of children requiring both spinal
fusion and other spinal procedures and includes insourcing in the Children‟s Hospital Group and the broader
public hospital sector, as well as outsourcing initiatives, including private providers nationally and abroad. In
tandem, the HSE is working to develop a long-term sustainable solution for scoliosis and paediatric orthopaedic
cases. The HSE targeted over 400 procedures under this initiative to support the delivery of the agreed target.
A total of 371 procedures (spinal fusion and other) were undertaken in 2017. A small number of patients
declined treatment options in Ireland and overseas and opted to stay with their treating consultant. Every effort
is being made to offer early appointments to these patients.
Healthcare Associated Infections (HCAI)
There were 36 hospitals with no cases of Staphylococcus Aureus Blood Stream Infection and 26 hospitals with
no cases of Clostridium Difficile related diarrhoea reported in December. There were 28 hospital acquired
Staphylococcus Aureus Blood Stream Infections in HSE hospitals and 53 cases of Clostridium Difficile
associated diarrhoea.
In May 2017, the HSE established a national response team led by the Health and Wellbeing Division to co-
ordinate and support response efforts to deal with the challenge of Carbapenemase Producing
Enterobacteriaceae (CPE) within the wider context of HCAI AMR. The national response team is working with
senior nominated staff at Hospital Group level to give effect to this response.
A small number of hospitals have shown increased rates of Clostridium Difficile infection, particularly Model 4
hospitals. While it is accepted that there is a greater intrinsic risk of hospital acquired infection in Level 4
hospitals as they provide care for the most complex and vulnerable patients, the increased rate requires review
and oversight to ensure that appropriate surveillance and isolation measures are being implemented fully. The
Acute Hospitals Division is working with Health and Wellbeing and the individual hospitals to determine key
causal factors and agree additional actions, as appropriate.
Performance and Accountability Framework
The Performance and Accountability Framework sets out the means by which the HSE and Hospital Groups are
held to account for their performance across the four domains of the Balanced Scorecard which includes
financial performance. Under the Performance and Accountability Framework there is provision for formal
escalation of individual hospitals that are underperforming. When a hospital is escalated, Accountable Officers
are expected to ensure managers reporting to them are notified and that the appropriate remedial actions are
being taken and monitored. The timeframes for improvement are also set out.
The Mater Misericordiae University Hospital was escalated to black escalation under the HSE‟s Performance
and Accountability Framework following a review of its financial performance in January and February 2017.
The Ireland East Hospitals Group continued to monitor the hospital‟s performance on a monthly basis thereafter.
The Ireland East Hospitals Group subsequently issued a Performance Notice to the Hospital in June 2017. The
Group commissioned a diagnostic review of the Hospital which examined internal process as well as financial
performance and this was completed in September. The Mater Misericordiae University Hospital accepted the
Health Service Performance Profile – October to December 2017 Quarterly Report 60
recommendations and agreed a detailed work plan to deliver them. A Benefits Realisation model has been
designed to track performance and ensure financial performance and process targets are met. The growth in
complex activity such as transplant, interventional cardiology and urology is posing significant cost pressures in
the current year as the activity is beyond the funding provided under ABF. The hospital continues to focus on
reducing overtime and agency costs and effecting improvements in bed days used.
St James‟s Hospital was escalated to black escalation in April 2017 based on a monthly assessment of its
financial performance in Quarter 1/2017. The Dublin Midlands Hospitals Group subsequently issued a
Performance Notice to the hospital in June. There was some stabilisation in financial performance in June and
July with deterioration in its financial performance in August. A second Performance Notice was issued by the
Dublin Midlands Hospitals Group CEO to St James‟s Hospital in September due to no evidence of traction in the
cost containment areas identified in the Financial Stabilisation Plan. The 2017 financial outturn for the hospital
was very favourable. The Dublin Midlands Hospitals Group will continue to monitor the implementation of the
Financial Stabilisation Plan in quarter 1/2018 to ensure sustained improvement in performance.

Health Service Performance Profile – October to December 2017 Quarterly Report 61
Acute Hospitals Balanced Scorecard/Heat Map
Rep
ort
ing
Fre
qu
en
cy
Ex
pe
cte
d
Acti
vit
y /
Ta
rge
t
Nati
on
al
YT
D
% V
ar
YT
D
Ire
lan
d E
as
t
Mid
lan
ds
Du
bli
n
RC
SI
So
uth
We
st
So
uth
/
UL
Sa
olt
a
Ch
ild
ren
’s
Cu
rre
nt
(-2
)
Cu
rre
nt
(-1
)
Cu
rre
nt
Qu
ali
ty &
Sa
fety
Serious Reportable Events
Investigations completed within 120 days
11
M 90% 7% -92.2%
Service User Experience
Complaints investigated within 30
working days M 75% 72% -4%
HCAI Rates - Staph. Aureus M < 1 0.9 7.4% 0.9 1.7 1.1 0.2 0.5 0.6 3.5
1.0 0.9 0.9
HCAI Rates - C Difficile M < 2 1.8 12.4% 1.4 2.8 2.1 2.2 0.9 1.0 0.0
2.0 2.1 1.8
% of ED patients who leave before completion of treatment
M < 5% 5.6% -12% 6.9% 9.3% 5% 4.2% 5.5% 3.7% 2.8% 5.9% 5.5% 6.4%
Urgent colonoscopy - number waiting > 4 weeks (zero tolerance)
M 0 68 43 5 1 7 1 6 5 11 3 1
Implementation of NEWS Q 100% 96.7% -3.3% 100% 83.3% 100% 100% 100% 100%
0% 0% 96.7%
Implementation of IMEWS Q 100% 100% 0% 100% 100% 100% 100% 100%
0% 0% 100%
Maternity safety statements M-2M 100% 100% 0% 100% 100% 100% 100% 100% 100% 84.2%
Readmission Rates - Medical M-1M 11.1% 11.1% 0% 11% 11.1% 10.8% 11.2% 9.1% 12.6% 10.4% 10.5% 10.2%
Readmission Rates - Surgical M-1M < 3% 2% 33.3% 1.7% 2.7% 2.4% 1.9% 1.4% 2% 1.8% 1.8% 1.9%
Hip fracture surgery within 48 hours M-1M 95% 85.5% -10% 93.9% 90.3% 85.9% 79.5% 72.9% 90.5% 87% 87.7% 86.8%
Avlos – Medical (site specific targets) M-1M 6.3 days 6.8 -7.9% 6.8 8.6 7.2 6.4 5 6.4 6.5 6.9 7
Avlos – Surgical (site specific targets) M-1M 5 days 5.4 -8% 5.9 6.8 5.8 4.6 5 4.6 5.2 5.2 5.4
Radiotherapy treatment within 15 working days
M 90% 76.3% -15.2% 72% 68.9% 99.1% 88.5%
80% 77.7% 73.7%
11
Data under review

Health Service Performance Profile – October to December 2017 Quarterly Report 62
Rep
ort
ing
Fre
qu
en
cy
Ex
pe
cte
d
Acti
vit
y /
Ta
rge
t
Nati
on
al
YT
D
% V
ar
YT
D
Ire
lan
d E
as
t
Mid
lan
ds
Du
bli
n
RC
SI
So
uth
We
st
So
uth
/
UL
Sa
olt
a
Ch
ild
ren
’s
Cu
rre
nt
(-2
)
Cu
rre
nt
(-1
)
Cu
rre
nt
Acc
es
s
PET - 75 years or older within 9 hours M 100% 62% -38% 67.4% 59% 56.3% 57.6% 41.5% 73.2% 60.4% 60.3% 57.2%
PET - 75 years or older within 24
hours (zero tolerance) M 100% 92.4% -7.6% 92.8% 93.4% 94.6% 90.3% 77.7% 95.5% 91.8% 92.7% 91.5%
PET - ED within 24 hours (zero
tolerance) M 100% 96.9% -3.1% 96.9% 96% 97.9% 95.3% 92.9% 98.2% 99.5% 96.7% 96.9% 96.7%
PET - ED within 6 hours M 75% 66.3% -11.6% 69.2% 58.2% 61.6% 65.2% 56.2% 68.1% 86% 66.4% 65.6% 63.1%
Routine Colonoscopy within 13 weeks M 70% 57.8% -17.5% 55.4% 50.7% 85.9% 65.6% 49.1% 51.1% 50% 51.9% 56.9% 56.9%
Elective Laparoscopic Cholecystectomy
M-1M >60% 45.5% -24.2% 60.3% 54.7% 48.6% 45.8% 7.4% 26.2% 41.4% 45.8% 45.9%
Inpatient Adult within 15 months M 90% 86.5% -3.9% 92% 79.6% 91.1% 86.8% 95.2% 81% 85.9% 85.8% 86.5%
Daycase Adult within 15 months M 95% 92.6% -2.5% 95.3% 89.5% 99.9% 91.9% 91.5% 90.5% 93.5% 93.2% 92.6%
Inpatient Child within 15 months M 95% 88.7% -6.6% 98.1% 100% 99.2% 96.1% 99.4% 82.8% 86.6% 87% 88.9% 88.7%
Daycase Child within 15 months M 97% 85.9% -11.4% 100% 100% 100% 94.6% 100% 86.4% 81.2% 88.3% 87.5% 85.9%
Outpatient within 52 weeks M 85% 72.4% -14.8% 76.1% 71.8% 78.8% 68.9% 69.5% 74% 64.7% 73.6% 72.9% 72.4%
Ambulance Clearance Times within 60 minutes
M 95% 92.4% -2.7% 93.5% 95.9% 96.3% 89.4% 94.9% 85.2% 97.8% 92.6% 92.5% 90%
Number of beds subject to Delayed Discharge (zero tolerance site specific targets)
M <475 480 -1.1% 140 100 98 67 9 55 11 563 582 480
Urgent Breast Cancer within 2 weeks M 95% 75.3% -20.8% 82% 29% 99.9% 72.4% 100% 78.8% 66.5% 78.6% 95.2%
Routine Breast Cancer within 12 weeks
M 95% 71.1% -25.2% 82.4% 45.5% 99.8% 61.4% 98.6% 54% 71% 71.8% 74.2%
Lung Cancer within 10 working days M 95% 82.6% -13.1% 99.2% 95.6% 74.4% 69.4% 61% 93.8% 86.8% 86% 88.9%
Prostate Cancer within 20 working days
M 90% 61.5% -31.7% 61.3% 2.3% 92% 50.1% 10% 99.3% 77.4% 82.3% 77%

Health Service Performance Profile – October to December 2017 Quarterly Report 63
Rep
ort
ing
Fre
qu
en
cy
Ex
pe
cte
d
Acti
vit
y /
Ta
rge
t
Nati
on
al
YT
D
% V
ar
YT
D
Ire
lan
d E
as
t
Mid
lan
ds
Du
bli
n
RC
SI
So
uth
We
st
So
uth
/
UL
Sa
olt
a
Ch
ild
ren
’s
Cu
rre
nt
(-2
)
Cu
rre
nt
(-1
)
Cu
rre
nt
Fin
an
ce
Net Expenditure variance from plan
Total M €4,593,523 €4,733,223 3.04% 4.04% 1.61% 3.73% 2.97% 7.03% 4.07% 1.04%
5.49% 5.52% 3.04%
Pay M €3,709,503 €3,722,859 0.36% 1.00% -0.77% 0.15% -0.67% 3.44% 1.06% 0.17%
1.57% 1.60% 0.36%
Non-pay M €1,783,946 €1,862,476 4.40% 5.92% 2.90% 7.77% 5.11% 4.35% 6.50% 1.95%
6.67% 6.47% 4.40%
Income M -€899,927 -€852,111 -5.31% -4.61% -5.11% -4.76% -6.53% -8.83% -5.56% -2.27%
-7.61% -8.08% -5.31%
Service Arrangements (05.01.2018)
Number signed M 3.50% 100% 0% 100% 100% 100%
Monetary value signed M 3.50% 100% 0% 100% 100% 100%
HR
Absence
Overall M-1M 3.5% 3.98% -13.71% 3.67% 3.78% 4.08% 3.95% 5.34% 3.75% 3.73% 4.05% 4.17%
European Working Time Directive (EWTD)
Within 24 hours M 100% 98.5% -1.5% 99.6% 98.7% 98.3% 99.5% 98.3% 97.2% 95.2% 97% 98.2% 98.5%
< 48 hour working week M 95% 83% -12.6% 79.6% 76.8% 81.5% 87.7% 87.1% 92.1% 63.2% 83% 83.4% 83%

Health Service Performance Profile – October to December 2017 Quarterly Report 64
Finance

Health Service Performance Profile – October to December 2017 Quarterly Report 65
Introduction
The Letter of Determination, dated 25th October 2016, provides for a net revenue budget for the HSE in 2017 of
€13,912m. This represents an increase of €422.1m (3.1%) year on year (2016: €13,489.9m). In addition, a further sum of
€36.5m was held by the DoH for additional service initiatives and was released during the year as specific implementation
plans were agreed. This brought the total revenue budget available in 2017 to €13,948.5m. This represents an overall
increase of €458.6m (3.4%) year on year.
Delivering the maximum amount of services, as safely and effectively as possible, within the limits of the available funding
was a key objective for the HSE in 2017. Each National Director, Hospital Group CEO, CHO Chief Officer and other
senior managers faced specific challenges in respect of ensuring the type and volume of safe services were delivered
within the resources available.
The HSE fully acknowledged the requirement to operate within the limits of the funding that has been notified. We
prioritised efforts around developing the most efficient models of service delivery, extending controls around the pay bill
and other significant cost categories and increasing productivity in order to contain the annual growth in costs that is
typical of healthcare systems in Ireland and internationally.
A total of €208.3m once off funding was provided by way of a supplementary estimate for 2017. The letter of
determination received on the 29th December indicated €75m was available for central pay awards, €50m for SCA, and
€47.7m in relation to a shortfall on income. Additionally €35.6m was made available for winter access programme.
All figures quoted in this report are produced prior to the finalisation of the annual financial statements and as such are
not considered final until that process has been completed and are subject to change.
Financial Performance
The HSE had expenditure of €14.322 billion against a budget of €14.156 billion for 2017 leading to a deficit of €165.9m or
1.17%.
Expenditure by Category and Division
Approved
Allocation
YTD % Var
Act v Tar Actual Plan Variance
€000s €000s €000s €000s €000s
Acute Hospitals Division 4,593,523 4,733,224 4,593,523 139,701 3.0%
National Ambulance Service & Emergency Mgt 157,771 157,000 157,771 (771) -0.5%
Health & Wellbeing Division 207,385 204,546 207,385 (2,839) -1.4%
Primary Care Division (Note 1) 1,039,555 1,033,099 1,039,555 (6,456) -0.6%
Mental Health Division 860,755 860,372 860,755 (383) 0.0%
Social Care Division 3,418,580 3,442,931 3,418,580 24,351 0.7%
National Cancer Control Programme (NCCP) 3,098 3,242 3,098 144 4.7%
Clinical Strategy & Programmes Division 35,179 35,245 35,179 67 0.2%
Quality Assurance & Verification 5,050 3,039 5,050 (2,012) -39.8%
Quality Improvement Division 8,359 8,382 8,359 23 0.3%
Other National Divisions / Services 320,527 335,233 320,527 14,705 4.6%
Total Operational Service Areas 10,649,782 10,816,313 10,649,782 166,531 1.56%
Pensions 403,326 379,905 403,326 (23,421) -5.8%
State Claims Agency 274,000 283,224 274,000 9,224 3.4%
Primary Care Reimbursement Service (Note 1) 2,565,708 2,565,664 2,565,708 (44) 0.0%
Demand Led Local Schemes (Note 1) 249,297 259,795 249,297 10,498 4.2%
Overseas Treatment 14,093 17,193 14,093 3,099 22.0%
Total Pensions & Demand Led Areas 3,506,425 3,505,781 3,506,425 (644) -0.02%
Grand Total 14,156,207 14,322,095 14,156,207 165,887 1.17%
Note 1: PCRS and Demand Led Schemes form part of the Primary Care Division but are reported under Pensions & Demand Led Areas

Health Service Performance Profile – October to December 2017 Quarterly Report 66
There is a net deficit within Operational Services of €166.5m or 1.56%. This includes a net deficit of €139.7m in Acute
Hospitals.
Pensions and Demand Led Areas have a small surplus of €0.6m. Within this, the State Claims Agency has a deficit of
€9m, Pensions have a surplus of (€23.4m), Primary Care Reimbursement Service has a surplus of (€0.04m), Demand
Led Schemes have a deficit of €10.5m and Overseas Treatment has a deficit of €3.1m.
The following Pay Cost Pressures, totalling €88m, have crystallised and/or will have an impact on 2017. As previously
noted, €75m has been made available as part of the once off supplementary estimate for 2017 for these pay cost
pressures, which has be factored into these year-end figures.
1. €56.2m – The acceleration of public service pay restoration. The January 2017 agreement which brought forward
to April the payment of a €1,000 increase (already due for payment in September 2017 under the LRA). This
applies to public servants on annualised salaries up to €65,000 and who are parties to the Lansdowne Road
agreement. The additional monthly cost to the HSE is approx. €11m per month for the period April – August 2017
or €56.8m, that was not anticipated or funded through the budgeting and service planning process.
2. €12m - NCHD Living Out Allowance,
3. €20m – Nursing Incremental Credits, Task Transfer & other allowances.
Acute Hospitals
Approved
Allocation
YTD % Var Act v
Tar Actual Plan Variance
€'000 €'000 €'000 €'000 €'000
RCSI Dublin North East 707,874 734,282 707,874 26,408 3.7%
Dublin Midlands 868,604 882,631 868,604 14,027 1.6%
Ireland East 911,661 948,532 911,661 36,870 4.0%
South / South West 776,888 800,000 776,888 23,112 3.0%
Saolta University Health Care 731,729 761,509 731,729 29,780 4.1%
UL Hospitals 289,769 310,140 289,769 20,371 7.0%
National Children‟s Hospital 283,378 286,316 283,378 2,938 1.0%
Regional & National Services 23,621 9,815 23,621 (13,806) -58.4%
Total 4,593,523 4,733,224 4,593,523 139,701 3.0%
Acute Hospital Division (AHD) has expenditure of €4,733m against a budget of €4,593m leading to an adverse variance
of €139.7m (3.0%), which includes the supplementary funding for pay cost pressures, winter access and the shortfall on
income.
The deficit of €139.7m is comprised of an income variance of €47.9m and a gross variance of €91.8m, of which €13.3m
relates to Pay and €78.5m relates to Non Pay.
Of the total variance, €109.2m relates to direct provision of service with €30.5m representing HSE funded providers. 67%
of the year to date deficit is concentrated in three Hospital Groups, Ireland East Hospital Group €36.8m, RCSI Hospital
Group €26.4m and Saolta University Health Care Group €29.8m.
There is an overriding requirement for the HSE to maximise the provision of essential services within the totality of the
funding available in the AHD. It has also been necessary to provide for stretched savings targets within the acute hospital
sector in order to support the delivery of planned level of services.

Health Service Performance Profile – October to December 2017 Quarterly Report 67
Social Care - Older Persons
Approved
Allocation
YTD % Var Act v
Tar Actual Plan Variance
€'000 €'000 €'000 €'000 €'000
CHO 1 83,969 83,933 83,969 (36) 0.0%
CHO 2 75,579 77,936 75,579 2,357 3.1%
CHO 3 67,625 67,668 67,625 43 0.1%
CHO 4 123,419 123,018 123,419 (401) -0.3%
CHO 5 74,776 75,012 74,776 236 0.3%
CHO 6 62,796 62,471 62,796 (325) -0.5%
CHO 7 93,528 98,446 93,528 4,919 5.3%
CHO 8 67,108 67,615 67,108 507 0.8%
CHO 9 103,289 104,833 103,289 1,544 1.5%
Regional & National 54,468 42,986 54,468 (11,482) -21.1%
Subtotal 806,557 803,920 806,557 (2,637) -0.3%
NHSS 916,829 915,541 916,829 (1,288) -0.1%
Overall Total 1,723,385 1,719,461 1,723,385 (3,924) -0.2%
Core services excluding NHSS has expenditure of €803.9m against a budget of €806.5m leading to a surplus of €2.6m, which includes the supplementary funding for pay cost pressures and winter access.
NHSS had expenditure of €915.5m against a budget of €916.8m leading to a small surplus of (€1.3m).
Managing the year on year growth in demand for community-based social services has been one of the key challenges
for Older Persons services in 2016 and this continued throughout 2017.
Social Care – Disabilities
Approved
Allocation
YTD % Var Act v
Tar Actual Plan Variance
€'000 €'000 €'000 €'000 €'000
CHO 1 125,072 129,313 125,072 4,240 3.4%
CHO 2 165,766 166,307 165,766 541 0.3%
CHO 3 149,221 152,351 149,221 3,130 2.1%
CHO 4 218,634 222,652 218,634 4,018 1.8%
CHO 5 159,260 162,225 159,260 2,965 1.9%
CHO 6 185,555 187,924 185,555 2,369 1.3%
CHO 7 211,870 220,633 211,870 8,764 4.1%
CHO 8 200,789 204,386 200,789 3,596 1.8%
CHO 9 268,206 272,704 268,206 4,498 1.7%
Regional & National 10,821 4,976 10,821 (5,845) -54.0%
Total 1,695,195 1,723,470 1,695,195 28,276 1.7%
Disability Services has expenditure of €1,723.4m against a budget of €1,695.2m leading to an adverse variance of €28.2m, which includes the supplementary funding for pay cost pressures. The NSP 2017 submission flagged €9m in very stretched savings targets with a high delivery risk, which crystallised during the year.

Health Service Performance Profile – October to December 2017 Quarterly Report 68
The variance detailed above is associated with 4 key issues:
1. Expenditure associated with HIQA compliance;
2. Specific challenges in a small number of larger voluntary providers;
3. Emergency placements ahead of target in some areas
4. Expected reductions in agency spend did not materialise.
Variations from plan are followed up with each Chief Officer through the HSE‟s Performance Process.
Mental Health
Approved
Allocation
YTD % Var Act v
Tar Actual Plan Variance
€'000 €'000 €'000 €'000 €'000
CHO 1 73,608 73,572 73,608 (35) 0.0%
CHO 2 97,678 104,432 97,678 6,754 6.9%
CHO 3 64,289 64,739 64,289 449 0.7%
CHO 4 114,205 115,373 114,205 1,168 1.0%
CHO 5 95,684 96,444 95,684 760 0.8%
CHO 6 56,867 57,963 56,867 1,096 1.9%
CHO 7 87,659 87,510 87,659 (149) -0.2%
CHO 8 90,238 94,059 90,238 3,821 4.2%
CHO 9 114,092 113,305 114,092 (787) -0.7%
Central Mental Hospital 26,010 25,835 26,010 (174) -0.7%
Suicide Prevention 9,929 8,717 9,929 (1,212) -12.2%
Regional & National 30,496 18,423 30,496 (12,074) -39.6%
Total 860,755 860,372 860,755 (383) 0.0%
The Mental Health Division spent €860.3m against a budget of €860.7m, representing a small surplus of €0.4m, which includes the supplementary funding for pay cost pressures.
Recruitment and retention programmes continued to be prioritised to maximise the delivery of Mental Health services in
2017, therefore the level of once-off savings achieved in 2016 were not available in the current year.
Health & Wellbeing
Approved
Allocation
YTD % Var Act v
Tar Actual Plan Variance
€'000 €'000 €'000 €'000 €'000
Total 207,385 204,546 207,385 (2,839) -1.4%
The Health and Wellbeing Division spent €204.5m versus a budget of €207.3m leading to a surplus of (€2.8m) or (1.4%). This underspend is reflective of difficulties in recruiting clinical staff such as public health doctors and radiographers. Also, vaccination programmes (Rotavirus, Men-B, Flu and HPV) created TRS earlier in the year, however, the uptake of the vaccines consumption increased over the winter months, particularly November and December.

Health Service Performance Profile – October to December 2017 Quarterly Report 69
Primary Care Division
Approved
Allocation
YTD % Var Act v
Tar Actual Plan Variance
€'000 €'000 €'000 €'000 €'000
CHO 1 92,979 96,271 92,979 3,292 3.5%
CHO 2 99,627 104,204 99,627 4,576 4.6%
CHO 3 80,360 81,674 80,360 1,314 1.6%
CHO 4 131,040 131,802 131,040 762 0.6%
CHO 5 93,354 93,952 93,354 598 0.6%
CHO 6 62,074 62,294 62,074 220 0.4%
CHO 7 159,778 156,275 159,778 (3,503) -2.2%
CHO 8 129,233 129,571 129,233 337 0.3%
CHO 9 129,778 127,421 129,778 (2,357) -1.8%
Regional 11,907 14,906 11,907 2,999 25.2%
National 49,424 34,728 49,424 (14,696) -29.7%
Sub Total 1,039,555 1,033,099 1,039,555 (6,456) -0.6%
PCRS 2,565,708 2,565,664 2,565,708 (44) 0.0%
DLS 249,297 259,795 249,297 10,498 4.2%
Sub Total PCRS & DLS 2,815,005 2,825,459 2,815,005 10,454 0.4%
Total Primary Care Division 3,854,560 3,858,558 3,854,560 3,998 0.1%
The Primary Care Division (PCD) spent €3,858m versus a budget of €3,854m leading to a deficit of €3.9m, which includes the supplementary funding for pay cost pressures and winter access (aids and appliances). Core operational services within Primary Care, Social Inclusion and Palliative Care delivered a surplus of (€6.4m) with PCRS showing a surplus of €0.04m and Demand Led Schemes having a deficit of €10.5m. The total variance is showing a once off benefit relating to time related savings where anticipated expenditure has not yet manifested. This relates mainly to Chronic Disease clinical posts, primary care leases and palliative care beds not coming on stream as anticipated. The timing benefit is also masked by cost pressures in core primary care services particularly within medical and surgical supplies, NVRL, GP training and paediatric home care packages to facilitate complex discharges. While some time related savings were available to PCD during 2016 to help offset pressures in these areas there was limited opportunity to benefit from such support in 2017. Commentary on the Primary Care Reimbursement Service and Demand Led Local Schemes is provided later in this document.
National Services
The National Services Division spent €335.2m versus a budget of €320.5m leading to an adverse variance €14.7m. This
heading includes national functional divisions such as HR, HBS, System Reform, Legal Services and CIO. The bulk of the
costs and cost pressures giving rise to this spend and deficit level represent essential supports provided by the national
functions to support direct service provision.
Pay and Staffing Framework
The 2017 pay framework provided Divisions with a realistic pay resource within which they were required to manage pay
in 2017 and beyond.
Demand Led Services: PCRS & DLS / State Claims (SCA) and Pensions
1. The PCRS budget for 2017 was framed by reference to a series of working assumptions. These have been developed in detailed discussions with the DoH. Expenditure in the PCRS budget was the subject of close monitoring and assessment during 2017.

Health Service Performance Profile – October to December 2017 Quarterly Report 70
2. Pension costs incurred within the HSE and HSE-funded agencies (Section 38) are determined by individuals‟ service and their eligibility under the relevant public pension scheme as provided for in relevant legislation. The funding available to the HSE in 2017 provided for the cost of 2016 retirees in addition to an estimated 2,850 new retirees, across both the statutory and voluntary sectors, Funding has been fully provided against the current forecast expenditure in this area. In the event that expenditure is higher, the HSE will seek, with the DoH, solutions which do not adversely impact services.
3. The SCA financial plan for 2017 was based on the assumption that, in the event of costs varying from the funding level provided to the HSE, this would be identified as early as possible. The letter of determination received on the 29
th
December indicated €50m will be made available for the SCA. 4. The Treatment Abroad Scheme (TAS) relates to the provision of clinically urgent care and treatment abroad and the
legislation which underpins it does not facilitate the operation of the scheme within any particular cash limit. The Cross Border Directive scheme is similar in this latter respect. As with other demand-led services it is difficult to predict expenditure or activity patterns into the future with full accuracy.

Health Service Performance Profile – October to December 2017 Quarterly Report 71
Human Resources

Health Service Performance Profile – October to December 2017 Quarterly Report 72
Staff Category /Group WTE Dec 2017 change since Dec
2016
% change since Dec
2016
change since Nov
2017
Total Health Service 110,795 +3,710 +3.5% +325
Medical/ Dental 10,121 +399 +4.1% -1
Consultants 2,971 +109 +3.8% +2
NCHDs 6,331 +271 +4.5% -1
Medical (other) & Dental 820 +19 +2.3% -2
Nursing 36,777 +942 +2.6% +161
Nurse Manager 7,434 +155 +2.1% +37
Nurse Specialist 1,706 +127 +8.0% +3
Staff Nurse 25,315 +547 +2.2% +193
Public Health Nurse 1,514 +15 +1.0% +1
Nursing Student 500 +95 +23.4% -71
Nursing (other) 308 +2 +0.8% -2
Health & Social Care 15,950 +586 +3.8% +58
Therapists (OT, Physio, SLT) 4,441 +207 +4.9% +18
Health Professionals (other) 11,509 +380 +3.4% +39
Management/ Admin 17,714 +948 +5.7% +60
Management (VIII+) 1,610 +165 +11.4% +7
Clerical & Supervisory (III to VII) 16,105 +783 +5.1% +54
General Support 9,454 +6 +0.1% -6
Patient & Client Care 20,779 +830 +4.2% +53
Ambulance 1,745 +105 +6.4% -6
Care 19,034 +725 +4.0% +59
Service Area WTE Dec 2017 change since Dec
2016
% change since Dec
2016
change since Nov
2017
Total Health Service 110,795 +3,710 +3.5% +325
Ambulance 1,843 +109 +6.3% -7
Children's 3,104 +131 +4.4% +7
Dublin Midlands 10,301 +229 +2.3% +22
Ireland East 11,382 +411 +3.7% -1
RCSI 8,777 +330 +3.9% +1
Saolta Healthcare 8,674 +216 +2.6% -6
South/ South West 9,979 +394 +4.1% +32
University of Limerick 3,974 +378 +10.5% +38
other Acute Services 68 +26 +62.6% +0
Acute Services 58,102 +2,224 +4.0% +87
CHO 1 4,875 +77 +1.6% +13
CHO 2 4,943 +141 +2.9% +12
CHO 3 3,997 +90 +2.3% -1
CHO 4 6,850 +294 +4.5% +31
CHO 5 4,453 +81 +1.8% +20
CHO 6 3,762 -573 -13.2% +18
CHO 7 6,363 +834 +15.1% +33
CHO 8 5,705 +69 +1.2% +42
CHO 9 6,412 +152 +2.4% +22
Other Non-Acute 428 +21 +5.2% +4
PCRS 392 +26 +7.1% -3
Community Services 48,180 +1,212 +2.6% +191
Health & Wellbeing 1,450 +67 +4.8% -4
Corporate 1,567 +76 +5.1% +6
Health Business Services 1,497 +132 +9.6% +45

Health Service Performance Profile – October to December 2017 Quarterly Report 73
Health Sector Workforce: December 2017 – Key Messages
At the end of December 2017, health services‟ employment stood at 110,795 WTEs. When compared with the November 2017 figure (110,470 WTEs), the change is an increase of +325 WTEs and is 3,710 WTEs of an increase in the last 12 months.
The increase this month compares with an increase of +276 WTEs in December 2016. In December growth was seen across all Service Areas, with biggest increases in by Social Care at +121 WTEs (+0.4%) followed Acute Services at +87 WTEs (+0.1%).
Some of the more significant monthly increases in grade groups and individual grades were seen in; Staff Nurses
+193 WTEs, Nurse Managers +37 WTEs, Main Therapy Grades +18 WTEs, Social Care/Social Workers +15 WTEs,
Grades III to Grade VIIIs +54 WTEs and Healthcare Assistants +62 WTEs.
Pay and Staffing Strategy
HSPC figure of 110,795 WTEs at end of December is 104 WTEs above direct WTE level as set out in the 2017
Health Sector funded workforce plan (December 2017 110,691 WTEs) that was submitted in August. However
this figure is to be adjusted upwards to take account of increased budget allocations in the latter part of 2017 and
thus direct employment levels will be within this revised figure.
All service divisions, with the exception of the Acute Hospitals Services (+1,142 WTEs)) are within their projected
direct employment profile at this time. It should be noted progress or otherwise in agency and overtime
conversion impacts on the overall directly reported WTEs.
Assessment of the overall position as at the end of 2017 is that despite increased agency expenditure and
overtime expenditure running ahead of 2016 levels, with budget variances of the order of 31% and 16.5%
respectively, the outturn of €7,625 billion is below overall pay budget by €23 million for 2017.
Absence Rates
Service Medical
/Dental Nursing
Health &
Social Care
Management
Admin General Support
Patient &
Client Care Overall
Acute Services 0.9% 4.7% 3.2% 4.2% 5.6% 6.1% 4.2%
Mental Health 2.1% 4.8% 4.0% 4.2% 6.0% 4.7% 4.5%
Primary Care 2.5% 5.0% 3.6% 4.7% 4.9% 5.9% 4.5%
Social Care 0.1% 5.4% 4.0% 4.2% 5.6% 5.4% 5.1%
Health & Wellbeing 4.6% 2.2% 4.0% 4.6% 8.4% 3.9% 4.4%
Corporate & HBS 0.0% 2.7% 0.0% 4.2% 5.1% 7.6% 4.1%
Overall 1.2% 4.8% 3.5% 4.34 % 5.6% 5.6% 4.5%
Certified 85.6% 86.7% 88.4% 90.1% 91.2% 89.4% 88.5%
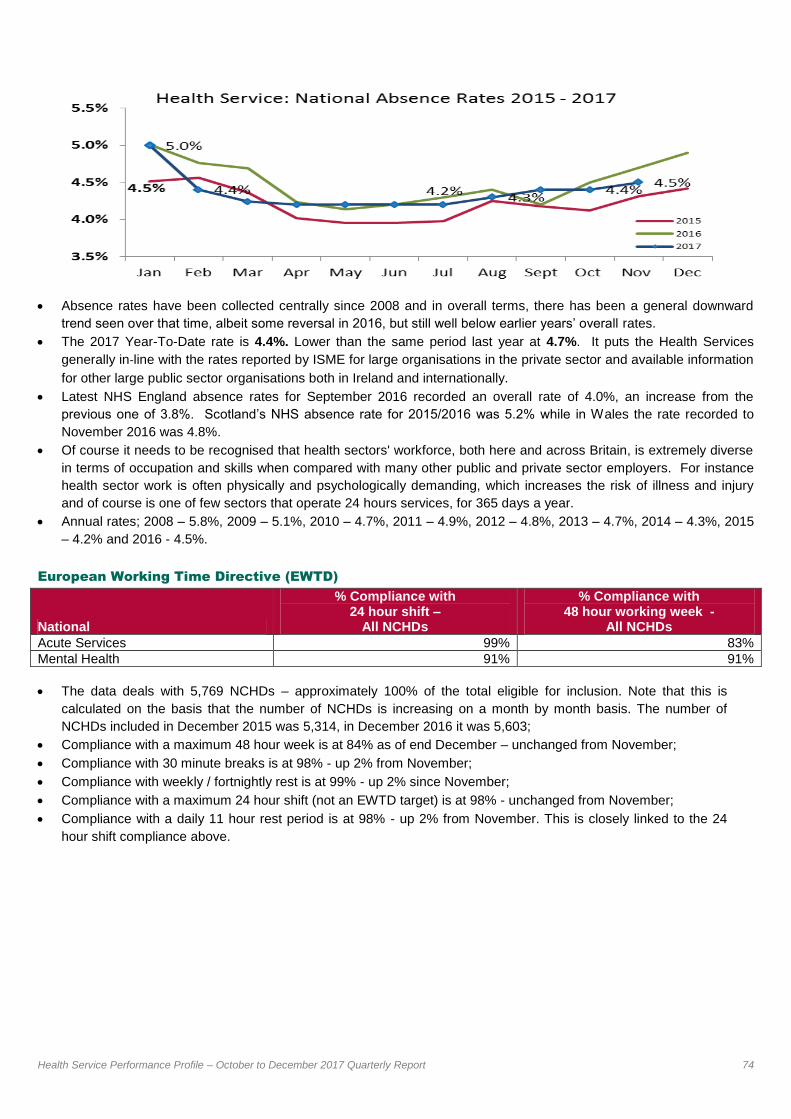
Health Service Performance Profile – October to December 2017 Quarterly Report 74
Absence rates have been collected centrally since 2008 and in overall terms, there has been a general downward
trend seen over that time, albeit some reversal in 2016, but still well below earlier years‟ overall rates.
The 2017 Year-To-Date rate is 4.4%. Lower than the same period last year at 4.7%. It puts the Health Services
generally in‐line with the rates reported by ISME for large organisations in the private sector and available information
for other large public sector organisations both in Ireland and internationally.
Latest NHS England absence rates for September 2016 recorded an overall rate of 4.0%, an increase from the
previous one of 3.8%. Scotland‟s NHS absence rate for 2015/2016 was 5.2% while in Wales the rate recorded to
November 2016 was 4.8%.
Of course it needs to be recognised that health sectors' workforce, both here and across Britain, is extremely diverse
in terms of occupation and skills when compared with many other public and private sector employers. For instance
health sector work is often physically and psychologically demanding, which increases the risk of illness and injury
and of course is one of few sectors that operate 24 hours services, for 365 days a year.
Annual rates; 2008 – 5.8%, 2009 – 5.1%, 2010 – 4.7%, 2011 – 4.9%, 2012 – 4.8%, 2013 – 4.7%, 2014 – 4.3%, 2015
– 4.2% and 2016 - 4.5%.
European Working Time Directive (EWTD)
National
% Compliance with 24 hour shift –
All NCHDs
% Compliance with 48 hour working week -
All NCHDs
Acute Services 99% 83%
Mental Health 91% 91%
The data deals with 5,769 NCHDs – approximately 100% of the total eligible for inclusion. Note that this is
calculated on the basis that the number of NCHDs is increasing on a month by month basis. The number of
NCHDs included in December 2015 was 5,314, in December 2016 it was 5,603;
Compliance with a maximum 48 hour week is at 84% as of end December – unchanged from November;
Compliance with 30 minute breaks is at 98% - up 2% from November;
Compliance with weekly / fortnightly rest is at 99% - up 2% since November;
Compliance with a maximum 24 hour shift (not an EWTD target) is at 98% - unchanged from November;
Compliance with a daily 11 hour rest period is at 98% - up 2% from November. This is closely linked to the 24
hour shift compliance above.
, with the exception of the Acute Hospitals Services (+437 WTEs) are within their projected direct employment profile at this time. It should be noted progress or otherwise in agency and overtime conversion will impact on
the overall directly reported WTEs. Recorded employment levels have increased by +12,484WTEs (+12.9%) since they bottomed out in October 2013.
Agency expenditure is showing an increase of 7.2% when compared with the same period in 2016. It is also well
above profile against the updated funded workforce plan projection to the end of September, where the overall gap
against budget stands at €39.3 million or +16.6%%.
Overtime/On-call is also ahead of same period in 2016 at +6.4%. The updated 2017 Pay and Staffing
Strategy/Funded Workforce Plan envisaged significant reductions in agency and that overtime expenditure in 2017
would be in line with 2016.
Overall pay expenditure to end of September is ahead of profile by €23.6 million, a variance of 0.41%

Health Service Performance Profile – October to December 2017 Quarterly Report 75
Escalation Report

Health Service Performance Profile – October to December 2017 Quarterly Report 76
National Performance Oversight Group
[NPOG]
Escalation Report
Level 3 Red Level 4
Black
NPOG February 2018 (December 2017 Reporting Cycle)
Version 27th February 2018

Health Service Performance Profile – October to December 2017 Quarterly Report 77
Escalation Summary
1. Areas of Level 4 Escalation Black (DG oversight)
No. Area of escalation Division
1 Patients waiting in ED > 24 hours
Acute Hospitals
2 Colonoscopy - % of people waiting > 13 weeks for a routine colonoscopy/OGD and urgent colonoscopy - % of people waiting < 4 weeks
Acute Hospitals
3 Financial Position: Projected net expenditure to year end including pay management
Acute Hospitals
2. Areas of Level 3 Escalation RED (NPOG oversight)
No. Area of escalation Division
1 Cancer Services – Rapid Access Clinics (Prostate, Lung, Breast and Radiotherapy)
Acute Hospitals
2 Number of Delayed Discharges over 90 days
Acute Hospitals and Social Care
3 Waiting List > 18 months for an elective procedure /
Waiting List >18 months for an OPD appointment
Acute Hospitals
4 Ambulance Turnaround Times
Acute Hospitals
5 Serious Reportable Events (SREs) Acute Hospitals
6 Assessment of Need (Disability Act Compliance) and Network Teams Social Care
7 Occupational Therapy – Assessment Waiting list ≤ 52 weeks Primary Care
8 Financial Position: Projected net expenditure to year end Social Care (Disabilities)
9 CAMHS Mental Health
i Appendix 1: Services in Escalation
ii Appendix 2: Areas deescalated from NPOG oversight

Health Service Performance Profile – October to December 2017 Quarterly Report 78
Performance summary areas of escalation Level 4 [Black] escalation ED over 24 hours
Acute Hospitals
Financial position: projected net expenditure to
year end including pay management – Acute
Hospitals
YTD Actual €’000
YTD Budget
€’000
YTD Variance
€’000
YTD %
Variance
Acute Hospitals Division 4,733,224 4,593,523 139,701 3.04%
Urgent Colonoscopy patients greater than 4
weeks
Acute Hospitals
Number on waiting list for GI Scopes
Acute Hospitals
Level 3 [Red] escalation Breast Cancer within 2 weeks
Acute Hospitals
Lung Cancer within 10 working days
Acute Hospitals
Prostate Cancer within 20 working days
Acute Hospitals
Radiotherapy within 15 working days
Acute Hospitals
1,461 1,175
4,318 3,519
0 01,0002,0003,0004,0005,000
Jan Feb Mar Apr May Jun Jul Aug Sep Oct Nov Dec
Patients 75+ >24 hrs All patients > 24 hrs
27
1 0
50
Jan Feb Mar Apr May Jun Jul Aug Sep Oct Nov Dec
2017
9,943 10,177
7,498 7,441
0
4,000
8,000
12,000
Jan Feb Mar Apr May Jun Jul Aug Sep Oct Nov Dec
<13 weeks > 13 week breaches
99.5%
78.1%
87.7%
95.2%
95%
55%
65%
75%
85%
95%
Jan Feb Mar Apr May Jun Jul Aug Sep Oct Nov Dec
2015/2016 2016/2017
88.54%
84.6% 82.1%
88.9%
95%
70%
80%
90%
100%
Jan Feb Mar Apr May Jun Jul Aug Sep Oct Nov Dec
2015/2016 2016/2017
64.2%
65.1% 45.5%
77%
90%
0%
50%
100%
Jan Feb Mar Apr May Jun Jul Aug Sep Oct Nov Dec2015/2016 2016/2017
86.6% 76.3%
74.6% 73.7%
90%
60%
80%
100%
Jan Feb Mar Apr May Jun Jul Aug Sep Oct Nov Dec2015/2016 2016/2017

Health Service Performance Profile – October to December 2017 Quarterly Report 79
Delayed Discharges
Acute Hospitals and Social Care
Ambulance Turnaround Times
Acute Hospitals and NAS
Inpatient and Day Case Waiting List
Acute Hospitals
Outpatient Waiting List
Acute Hospitals
Total Number of SREs Reported
Acute Hospitals
Disability Act Compliance
Social Care
Occupational Therapy – Assessment waiting list ≤ 52
weeks
Financial position: projected net expenditure
to year end including pay management –
Social Care (Disabilities)
YTD Actual €’000
YTD Budget
€’000
YTD Variance
€’000
YTD %
Variance
Social Care (Disabilities) 1,723,470 1,695,195 28,276 1.67%
559
436 451
480
475
350
550
750
Jan Feb Mar Apr May Jun Jul Aug Sep Oct Nov Dec
2015/2016 2016/2017
22 35 7 6
5 0
34 41
0
20
40
60
Jan Feb Mar Apr May Jun Jul Aug Sep Oct Nov Dec3-4 hours 4-5 hours 5 - 6 hours > 3 hours
7,710 7,656
2,937 4,495
0
5,000
10,000
15,000
Jan Feb Mar Apr May Jun Jul Aug Sep Oct Nov Dec
15m+ 18m+
58,766 99,474
35,945
69,904
0
50,000
100,000
150,000
Jan Feb Mar Apr May Jun Jul Aug Sep Oct Nov Dec
15m+ 18m+
442
0
100
200
300
400
500
Jan Feb Mar Apr May June July Aug Sept Oct Nov Dec
Total SREs Reported - Acute Hospitals Division
2015 2016 2017
12.7%
100% 100%
23.0%
25.1% 25.1%
0%
20%
40%
60%
80%
100%
Q4 Q1 Q2 Q3 Q4
2016/2017 2015/2016
84.3% 80.4% 79.2%
77%
92%
60%
70%
80%
90%
100%
Jan Feb Mar Apr May Jun Jul Aug Sep Oct Nov Dec
2015/2016 2016/2017

Health Service Performance Profile – October to December 2017 Quarterly Report 80
CAMHs waiting list > 12 months
________________________________________________________________
NPOG Review and Improvement process
The NPOG Framework for Performance Review and Improvement follows a 4 stage process. These stages
are Review, Enquire, Diagnose and Improve [REDI]
314
218
0
100
200
300
400
Jan Feb Mar Apr May Jun Jul Aug Sep Oct Nov Dec
2016/2017 2015/2016
Stage 1 Review: Identifying the problem
Stage 2 Enquire: Getting to a shared
agreement on the problem and taking
immediate action
Stage 3 Diagnose: Getting a deeper assessment
of the problem and generating solutions
Stage 4 Improve: Planning for and
implementing solutions

Health Service Performance Profile – October to December 2017 Quarterly Report 81
Areas of Level 4 [Black] Escalation [Director General oversight]
ED: Patients waiting in ED > 24 hours and people over 75 years
Division Escalation
level
Date
escalated
Reason for escalation Responsible
Acute Hospitals May 2015
Due to the number of people continuing to wait in ED for > 24 hours ND AHD
NPOG REDI elements Date agreed
Due
date
Status
1 Diagnosis: Under the auspices of the National Patient Flow Improvement
Programme the diagnostic, actions and projections for service improvement
for projects at Galway and UL hospitals will be completed
07.06.17 on-going
Under management at operational level
2 Diagnosis: Escalation actions in relation to scheduled and un-scheduled
care will be aligned with the work on the 3 Year Plan which has been
commissioned by the DDG Operations
06.09.17 on-going
Under management at operational level
Colonoscopy: [% of people waiting > 13 weeks and Urgent]
Division Escalation
level
Date
escalated
Reason for escalation Responsible
Acute Hospitals 12March
2015
Due to the number of patients waiting greater than 13 weeks for a routine colonoscopy/OGD and on-going breaches in urgent colonoscopies
ND AHD
NPOG REDI elements Date agreed
Due date Status
1 Review: Monthly review of urgent colonoscopy breach data 07.06.17 on-going on-going
Financial position including pay management
Division Escalation
level
Date
escalated
Reason for escalation Responsible
Acute Hospitals February
2016
Due to the risks to financial performance within acute hospitals ND AHD
NPOG REDI elements Date agreed
Due date Status
1 Enquire: Finance performance meetings to be held with each Hospital
Groups and with hospitals subject to formal escalation.
04.05.16 on-going
Complete
12
Routine colonoscopies escalated Red to Black in September 2015

Health Service Performance Profile – October to December 2017 Quarterly Report 82
Areas of Level 3 [Red] Escalation [NPOG Oversight] General: Cancer Rapid Access Clinics (Prostate, Lung, Breast and Radiotherapy)
Division Escalation
level
Date
escalated
Reason for escalation Responsible
Acute
Hospitals/NCCP
13
May
2015
Escalated due to the persistence and breadth of underperformance in
Rapid Access Cancer services
ND AHD
ND CCP
NPOG REDI elements Date agreed
Due date Status
1 Improve: Trajectory for service improvement cognisant of planning assumptions to be completed
05.04.17 06.12.17 Update
provided
2 Improve: RAC performance will be monitored by NPOG on a monthly 06.12.17 on-going
3 Review: Testing implementation of the Predictive Tool will be completed in DMHG
09.01.18 06.02.18
Delayed Discharges
Division Escalation
level
Date
escalated
Reason for escalation Responsible
Social Care and Acute Hospitals
June
2015
Escalated due to the target for Delayed Discharges > 90 days
being breached
ND SC and
ND AHD
NPOG REDI elements Date agreed
Due date Status
1 Review: ND AHD to identify opportunities for process improvement in
relation to the completion of nursing home applications
06.09.17 01.11.17 Complete
Waiting Lists: > 18 months Inpatient & Day Case and Outpatient
Division Escalation
level
Date
escalated
Reason for escalation Responsible
Acute Hospitals October
2015
Escalated due to the continued growth in waiting lists and waiting
times
ND AHD
NPOG REDI elements Date agreed Due date Status
1 Diagnosis: Escalation actions in relation to scheduled and un-
scheduled care will be aligned with the work on the 3 Year Plan
which has been commissioned by the DDG Operations
06.09.17 on-going Under management at operational level
13
Lung Cancer May 2015. Prostate Cancer July 2015 and de-escalated from Black to Red in March 2016. Breast Cancer July 2016. Radiotherapy September 2016.

Health Service Performance Profile – October to December 2017 Quarterly Report 83
Ambulance Turnaround Times
Division Escalation
level
Date
escalated
Reason for escalation Responsible
Acute Hospitals February
2017
Escalated due to long turnaround in certain hospitals impacting on
availability of ambulances for other calls
ND AHD
NPOG REDI elements Date agreed
Due date Status
1 Improve: Improvement Plan inclusive of trajectory for service improvement to be developed
08.02.17 04.10.17
Complete
Serious Reportable Events [SREs] Division Escalation
level
Date
escalated
Reason for escalation Responsible
Acute Hospitals March
2015
Escalated due to concerns about the reporting and investigation of
SREs
ND AHD
NPOG REDI elements Date agreed
Due date Status
1 Review: SRE compliance will be monitored by NPOG on a monthly basis 05.07.17 on-going
on-going
2 Enquire: ND QAVD to correspond with system following launch of new framework to outline expectations including requirement to audit existing SRE‟s in line with framework
09.01.18 06.03.18 Complete
Assessment of Need (Disability Act Compliance) and Network Teams
Division Escalation
level
Date
escalated
Reason for escalation Responsible
Social Care August
2015
Escalated based on continued underperformance in compliance with
Disability Act assessments
ND SC
NPOG REDI elements Date agreed
Due date Status
1 Enquire: ND HR will support the progression of the Disability Network Team Manager posts
04.10.17 03.04.18
Occupational Therapy: Assessment Waiting List ≤ 52 weeks Division Escalation
level
Date
escalated
Reason for escalation Responsible
Primary Care July
2016
Escalated based on continued poor performance ND PC
NPOG REDI elements Date agreed
Due date Status
1 Improve: Action plan for service improvement and timelines for its implementation to be completed
07.09.16 04.10.17
Update
provided

Health Service Performance Profile – October to December 2017 Quarterly Report 84
Financial position: Social Care (Disabilities) Division Escalation
level
Date
escalated
Reason for escalation Responsible
Social Care November
2016
Risk to financial performance within Social Care Division (Disabilities) ND SC
NPOG REDI elements Date agreed
Due date Status
1 Improve: Improvement trajectory of Social Care (Disabilities) finance to be monitored monthly
11.01.17 on-going
on-going
CAMHS
Division Escalation
level
Date
escalated
Reason for escalation Responsible
Mental Health June 2017 Dis-improvement in performance (admission to Adult Units and
Waiting Lists)
ND MH
ND HR
NPOG REDI elements Date agreed
Due date Status
1 Improve: Improvement trajectory for waiting lists > 12 months to be included in relevant CHO Performance Agreements
09 01 17 06.03.18

Health Service Performance Profile – October to December 2017 Quarterly Report 85
Appendix 1: Services in Escalation – 2nd February 2018
Service Accountable Officer Escalation Area Level
Ireland East Hospital Group (Accountable Officer – Mary Day CEO)
Mater Misericordiae University Hospital Gordon Dunne ED > 24 hours Black
Routine Colonoscopy > 13 weeks Black
Breast Cancer within 2 weeks Red
Finance Black
Midland Regional Hospital Mullingar Shona Schneemann Finance Black
St Luke’s Hospital Kilkenny Ann Slattery Routine Colonoscopy > 13 weeks Black
Finance Black
Wexford General Hospital Lily Byrnes Routine Colonoscopy > 13 weeks Black
National Maternity Hospital Dr Rhona Mahony (Master) Finance Black
Dublin Midlands Hospital Group (Accountable Officer – Susan O’Reilly CEO)
Midland Regional Hospital Portlaoise Michael Knowles ED > 24 hours Black
Routine Colonoscopy > 13 weeks Black
Midland Regional Hospital Tullamore Orlagh Claffey ED > 24 hours Black
Routine Colonoscopy > 13 weeks Black
Naas General Hospital Alice Kinsella ED > 24 hours Black
Routine Colonoscopy > 13 weeks Black
St. James’s Hospital Lorcan Birthistle Prostate Cancer within 20 days Red
Breast Cancer within 2 weeks Red
Routine Colonoscopy >13 weeks Black
Finance Black
Tallaght Hospital David Slevin ED > 24 hours Black
Routine Colonoscopy > 13 weeks Black
St Luke’s Radiation Oncology Network Dr Orla McArdle Radiotherapy Red
RCSI Hospital Group (Accountable Officer – Ian Carter CEO)
Beaumont Hospital Ian Carter Lung Cancer within 10 working days Red
Finance Black
Connolly Hospital Margaret Boland Finance Black
Rotunda Hospital Prof Fergal Malone (Master) Finance Black
South/South West Hospital Group (Accountable Officer – Gerry O’Dwyer CEO)
Cork University Hospital Tony McNamara Routine Colonoscopy > 13 weeks Black
Prostate Cancer within 20 days Red
Lung Cancer within 10 working days Red
Radiotherapy within 15 working days Red
Mercy University Hospital Cork Sandra Daly ED > 24 hours Black
Routine Colonoscopy > 13 weeks Black
Finance Black
South Tipperary General Hospital Maria Barry ED > 24 hours Black
University Hospital Kerry Fearghal Grimes ED > 24 hours Black
University Hospital Waterford Richard Dooley ED > 24 hours Black
Routine Colonoscopy > 13 weeks Black
Breast Cancer within 2 weeks Red
University of Limerick Hospital Group (Accountable Officer – Collette Cowan CEO)
University Hospital Limerick Colette Cowan ED > 24 hours Black

Health Service Performance Profile – October to December 2017 Quarterly Report 86
Service Accountable Officer Escalation Area Level
Prostate Cancer within 20 days Red
Lung Cancer within 10 working days Red
Routine Colonoscopy > 13 weeks Black
St John’s Hospital Limerick John Cummins Routine Colonoscopy > 13 weeks Black
University of Limerick Hospital Group including (ULH/ULMH/Nenagh/Ennis) and St John’s Hospital Limerick
Colette Cowan/John Cummins Finance Black
Saolta Hospital Group (Accountable Officer – Maurice Power CEO)
University Hospital Galway Chris Kane ED > 24 hours Black
Routine Colonoscopy > 13 weeks Black
Finance Black
Letterkenny University Hospital Sean Murphy Routine Colonoscopy > 13 weeks Black
Mayo General Hospital Catherine Donohoe Routine Colonoscopy > 13 weeks Black
Sligo University Hospital Grainne McCann Finance Black
Portiuncula University Hospital James Keane Finance Black
Children’s Hospital Group (Accountable Officer – Eilish Hardiman CEO)
Our Lady’s Children’s Hospital Crumlin Helen Shortt Routine Colonoscopy > 13 weeks Black
Service Accountable Officer Escalation Area Level
CHO 1 (Accountable Officer – John Hayes)
Primary Care John Hayes OT Assessment waiting list ≤ 52 weeks Red
CHO 4 (Accountable Officer – Ger Reaney)
Primary Care Ger Reaney OT Assessment waiting list ≤ 52 weeks Red
Social Care Ger Reaney Assessment of Need (Disability Act Compliance) and Network Teams
Red
CHO 5 (Accountable Officer – Aileen Colley )
Primary Care Aileen Colley OT Assessment waiting list ≤ 52 weeks Red
CHO 6 (Accountable Officer – Martina Queally )
Primary Care Aileen Colley OT Assessment waiting list ≤ 52 weeks Red
CHO 7 (Accountable Officer – David Walsh)
Social Care David Walsh Assessment of Need (Disability Act Compliance) and Network Teams
Red
CHO 8 (Accountable Officer – Pat Bennett)
Primary Care Pat Bennett OT Assessment waiting list ≤ 52 weeks Red
CHO 9 (Accountable Officer – Gerry O’Neill)
Social Care Gerry O’Neill Assessment of Need (Disability Act Compliance) and Network Teams
Red
Social Care (Accountable Officer – Pat Healy)
Social Care (Disabilities) Pat Healy Finance Red

Health Service Performance Profile – October to December 2017 Quarterly Report 87
Appendices

Health Service Performance Profile – October to December 2017 Quarterly Report 88
Appendix 1: Performance and Accountability Framework
The NPOG will seek assurance, on behalf of the Director General, that National Directors are delivering against
priorities. The NPOG will explore, with relevant National Director whether appropriate and timely remedial actions
are being taken to address areas of underperformance.
Under the Performance and Accountability Framework there is provision for the formal escalation of individual
Hospital Groups, CHOs or other services that are underperforming. Escalation reflects an increased level of
concern in relation to performance which requires more intense focus, action and scrutiny in order to bring about
improvement.
In the context of the Escalation and Intervention Framework underperformance also includes performance that:
Places patients or service users at risk
Fails to meet the required standards for that service
Departs from what is considered normal practice.
Performance management and the operation of the Performance and Accountability Framework is expected to be
a process managed primarily at the level of the National Ambulance Service, Hospital Groups, CHOs and the
PCRS.
There are four levels of escalation
Level 1 (Yellow)
A variance emerges.
A variance from plan is identified and intervention and support in response to early signs of difficulty is managed at a local level
A decision to escalate an area of underperformance in individual services under their remit is made by CHO Chief Officers, Hospital Group CEOs or the Head of PCRS.
Level 2 (Amber)
The problem persists.
It becomes harder to fix and potentially spreads to other organisations. Intervention and support are required at HG or CHO level
A decision to escalate an area of underperformance in individual CHOs, or Hospital Group is made by the relevant National Director.
Level 3 (Red)
The problem becomes critical.
The performance issue persists and the level of management responsible has failed to reverse underperformance. Support and / or intervention are required by NPOG.
A decision to escalate an area of underperformance in individual National Divisions is made by the NPOG in agreement with the relevant National Director.
NPOG are responsible in agreement with the relevant National Director for determining the supports, interventions required and for recommending sanctions to Director General.
Level 4
(Black)
Prolonged underperformance puts quality, safety and financial sustainability at risk.
The actions determined by NPOG do not achieve the necessary impact and action is required by the Director General
A decision to escalate underperformance of individual National Directors/ Divisions is made by the Director General on the basis of a recommendation by the NPOG.

Health Service Performance Profile – October to December 2017 Quarterly Report 89
Appendix 2: Data Coverage Issues
Division Metric Name Data Coverage Issue
Primary Care
Dietetics
% on waiting list for treatment < 12 weeks
% on waiting list for treatment < 52 weeks
Non Return – CHO 9 (North Dublin)
PHN (% of new patients accepted onto the caseload and seen within 12
weeks)
Non return – CHO2 (Mayo)
Non return – CHO3 (North Tipperary / East Limerick, Clare)
Non Return - CHO 7 (Dublin South West, Kildare West Wicklow)
Non Return - CHO 8 (Laois Offaly)
Psychology
% on waiting list for treatment < 12 weeks
% on waiting list for treatment < 52 weeks
Non Return – CHO 8 (Louth)
Orthodontics
% of referrals seen for assessment within 6 months
Reduce the proportion of patients on the treatment waiting list waiting
longer than four years (grade 4 and 5)
Non Return – DML South West, Midlands
Health Amendment Act
No. of Health Amendment Act cardholders who were reviewed Non Return - National
Palliative Care
Access to specialist palliative care services in the community provided
within 7 days
Access to specialist inpatient bed within 7 days
Non Return - Kerry
Social Inclusion No. of unique individuals attending pharmacy needle exchange Non Return - National
Mental Health
General Adult Teams
% of accepted referrals/re-referrals offered first appointment within 12
weeks/3 months
CHO 2 - 2 teams
CHO 4 - 1 team
General Adult Teams
% of accepted referrals/re-referrals offered first appointment and seen
within 12 weeks/3 months
CHO 2 - 2 teams
CHO 4 - 1 team
General Adult Teams
% of new (including re-referred) cases offered appointment and DNA in
the current month
CHO 2 - 2 teams
CHO 4 - 1 team
CAMHs Admissions of children to Child and Adolescent Acute Inpatient Units as a % of the total number of admissions of children to mental health acute
CHO 4 – 1 Team

Health Service Performance Profile – October to December 2017 Quarterly Report 90
Division Metric Name Data Coverage Issue
inpatient units.
CAMHs % of bed days used in HSE Child and Adolescent Acute Inpatient Units as a total of bed days used by children in mental health acute inpatient units
CHO 4 – 1 Team
General Adult Teams % of accepted referrals / re-referrals offered first appointment within 12 weeks / 3 months by Child and Adolescent Community Mental Health Teams
CHO 4 – 1 Team
General Adult Teams % of accepted referrals / re-referrals offered first appointment and seen within 12 weeks / 3 months by Child and Adolescent Community Mental Health Teams
CHO 4 – 1 Team
General Adult Teams %. of new (including re-referred) child/adolescent referrals offered appointment and DNA in the current month
CHO 4 – 1 Team
Acute Hospitals % of hospitals with implementation of IMEWS for pregnant patients South/Southwest data outstanding

Health Service Performance Profile – October to December 2017 Quarterly Report 91
Appendix 3: Hospital Groups
Hospital Hospital Ir
ela
nd
Eas
t
Ho
sp
ita
l G
rou
p
Cappagh National Orthopaedic Hospital
Du
bli
n M
idla
nd
s
Ho
sp
ita
l G
rou
p Coombe Women and Infants University Hospital
Mater Misericordiae University Hospital Midland Regional Hospital – Portlaoise
Midland Regional Hospital - Mullingar Midland Regional Hospital – Tullamore
National Maternity Hospital Holles Street Naas General Hospital
Our Lady‟s Hospital - Navan St James Hospital
Royal Victoria Eye and Ear Hospital Dublin Tallaght Hospital
St. Columcille's Hospital Loughlinstown
So
uth
/ S
ou
th W
es
t
Ho
sp
ita
l G
rou
p
Bantry General Hospital
St. Luke's Hospital Kilkenny Cork University Hospital
St Michael's Hospital Dun Laoghaire Kerry General Hospital
St Vincent‟s University Hospital Elm Park Lourdes Orthopaedic Hospital Kilcreene
Wexford General Hospital Mallow General Hospital
RC
SI
Ho
sp
ita
l
Gro
up
Beaumont Hospital including St Josephs Mercy University Hospital Cork
Cavan General Hospital South Tipperary General Hospital
Connolly Hospital South Infirmary University Hospital Cork
Our Lady of Lourdes Hospital Drogheda Waterford Regional Hospital
Rotunda Hospital
Sa
olt
a H
osp
ita
l
Gro
up
Galway University Hospitals
Un
ive
rsit
y o
f
Lim
eri
ck H
os
pit
al
Gro
up
Croom Hospital Letterkenny General Hospital
Ennis Hospital Portiuncula Hospital General & Maternity Ballinasloe
Nenagh Hospital Mayo General Hospital
St John's Hospital Roscommon County Hospital
University Hospital, Limerick Sligo General Hospital
University Maternity Hospital
Ch
ild
ren
's
Ho
sp
ita
l
Gro
up
Children's University Hospital Temple Street
Our Lady's Hospital for Sick Children Crumlin
National Children‟s Hospital, Tallaght

Health Service Performance Profile – October to December 2017 Quarterly Report 92
Appendix 4: Community Health Organisations
Areas included CHO’s Areas included CHO’s
CH
O 1
Cavan
CH
O 6
Dublin South East
Monaghan Dun Laoghaire
Donegal Wicklow
Sligo
CH
O 7
Dublin South City
Leitrim Dublin West
CH
O 2
Galway Dublin South West
Roscommon Kildare
Mayo West Wicklow
CH
O 3
Clare
CH
O 8
Laois
Limerick Offaly
North Tipperary Longford
East Limerick Westmeath
CH
O 4
North Cork Louth
North Lee Meath
South Lee C
HO
9 Dublin North Central
West Cork Dublin North West
Kerry Dublin North
CH
O 5
Waterford
Wexford
Carlow
Kilkenny
Tipperary South