ocwen financial corp - annual reports
TRANSCRIPT

OCWEN FINANCIAL CORP
FORM 10-K(Annual Report)
Filed 03/30/00 for the Period Ending 12/31/99
Telephone 561-682-8000
CIK 0000873860Symbol OCN
SIC Code 6162 - Mortgage Bankers and Loan CorrespondentsIndustry Consumer Financial Services
Sector FinancialFiscal Year 12/31
http://www.edgar-online.com© Copyright 2011, EDGAR Online, Inc. All Rights Reserved.
Distribution and use of this document restricted under EDGAR Online, Inc. Terms of Use.
UNITED STATES
SECURITIES AND EXCHANGE COMMISSION
Washington, D.C. 20549
FORM 10-K
(Mark one)
[X] ANNUAL REPORT PURSUANT TO SECTION 13 OR 15(d) OF THE SECURITIES EXCHANGE ACT OF 1934
For the fiscal year ended December 31, 1999
OR
[ ] TRANSITION REPORT PURSUANT TO SECTION 13 OR 15(d) OF THE SECURITIES EXCHANGE ACT OF 1934
For the transition period from: ___________________to________________
Commission File No. 0-21341
OCWEN FINANCIAL CORPORATION (Exact name of Registrant as specified in its charter)
Securities registered pursuant to Section 12(b) of the Act:
COMMON STOCK, $.01 PAR VALUE NEW YORK STOCK EXCHANG E (NYSE) (Title of each class) (Name of each exchange on which registered)
Securities registered pursuant to Section 12 (g) of the Act: Not applicable.
Indicate by check mark whether the registrant (1) has filed all reports required to be filed by Section 13 or 15(d) of the Securities Exchange Act of 1934 during the preceding 12 months (or for such shorter period that the registrant was required to file such reports) and (2) has been subject to such filing requirements for the past 90 days. Yes [X] No[ ]
Indicate by check mark if disclosure of delinquent filers pursuant to Item 405 of Regulation S-K is not contained herein, and will not be contained, to the best of the registrant's knowledge, in definitive proxy or information statements incorporated by reference in Part III of this Form 10-K or any amendment to this Form 10-K. [ ]
Aggregate market value of the Common Stock, $.01 par value, held by nonaffiliates of the registrant, computed by reference to the closing price as reported on the NYSE as of the close of business on March 09, 2000: $232,380,138 (for purposes of this calculation affiliates include only directors and executive officers of the registrant).
FLORIDA 65-00 39856 ------- ----- ----- (State or other jurisdiction of (I.R.S. Employer incorporation or organization) Identific ation No.) 1675 PALM BEACH LAKES BOULEVARD WEST PALM BEACH, FLORIDA 33401 ------------------------ ----- (Address of principal executive office) (Z ip Code) (561) 682-8000 -------------- (Registrant's telephone number, including are a code)

Number of shares of Common Stock, $.01 par value, outstanding as of March 9, 2000: 67,733,475 shares
DOCUMENTS INCORPORATED BY REFERENCE: Portions of the Annual Report to Shareholders for fiscal year ended December 31, 1999 are incorporated by reference into Part I, Items 1 and 3, and Part II, Items 5-8, and portions of the Company's definitive Proxy Statement with respect to the Company's Annual Meeting of Shareholders to be held on May 16, 2000, and as filed with the Commission on or about March 30, 2000, are incorporated by reference into Part III, Items 10-13.

OCWEN FINANCIAL CORPORATION
1999 FORM 10-K ANNUAL REPORT
2
TABLE OF CONTENTS PAGE PART I Item 1. Business................................... ......................... 5 General.................................... ......................... 5 Segments................................... ......................... 5 Discount Loans........................... ......................... 5 Domestic Residential Mortgage Loan Servic ing...................... 6 Investments in Low-Income Housing Tax Cre dit Interests............ 7 Commercial Real Estate Lending........... ......................... 7 UK Operations............................ ......................... 9 OTX...................................... ......................... 10 Domestic Subprime Single Family Residenti al Lending............... 10 Investment Securities.................... ......................... 11 OAC...................................... ......................... 11 Unsecured Collections.................... ......................... 12 Corporate Items and Other................ ......................... 12 Sources of Funds........................... ......................... 12 Risk Factors............................... ......................... 13 Competition................................ ......................... 13 Employees.................................. ......................... 13 Regulation................................. ......................... 14 The Company.............................. ......................... 14 The Bank................................. ......................... 15 Federal Taxation........................... ......................... 20 State Taxation............................. ......................... 21 Item 2. Properties................................. ......................... 22 Item 3. Legal Proceedings.......................... ......................... 22 Item 4. Submission of Matters to a Vote of Security Holders................. 23 PART II Item 5. Market for the Registrant's Common Equity a nd Related Stockholder Matters........................ ......................... 23 Item 6. Selected Consolidated Financial Data....... ......................... 23 Item 7. Management's Discussion and Analysis of Fin ancial Condition and Results of Operations........ ......................... 23 Item 7A.Quantitative and Qualitative Disclosures Ab out Market Risk................................ ......................... 23 Item 8. Financial Statements and Supplementary Data ......................... 23

OCWEN FINANCIAL CORPORATION 1999 FORM 10-K ANNUAL REPORT
CERTAIN STATEMENTS CONTAINED HEREIN ARE NOT, AND CERTAIN STATEMENTS CONTAINED IN FUTURE FILINGS BY THE COMPANY WITH THE SECURITIES AND EXCHANGE COMMISSION (THE "COMMISSION"), IN THE COMPANY'S PRESS RELEASES OR IN THE COMPANY'S OTHER PUBLIC OR SHAREHOLDER COMMUNICATIONS MAY NOT BE, BASED ON HISTORICAL FACTS AND ARE "FORWARD-LOOKING STATEMENTS" WITHIN THE MEANING OF SECTION 27A OF THE SECURITIES ACT OF 1933, AS AMENDED, AND SECTION 21E OF THE SECURITIES EXCHANGE ACT OF 1934, AS AMENDED. THESE FORWARD-LOOKING STATEMENTS, WHICH ARE BASED ON VARIOUS ASSUMPTIONS (SOME OF WHICH ARE BEYOND THE COMPANY'S CONTROL), MAY BE IDENTIFIED BY REFERENCE TO A FUTURE PERIOD(S) OR BY THE USE OF FORWARD-LOOKING TERMINOLOGY SUCH AS "ANTICIPATE," "BELIEVE," "COMMITMENT," "CONSIDER," "CONTINUE," "COULD," "ENCOURAGE," "ESTIMATE," "EXPECT," "FORESEE," "INTEND," "IN THE EVENT OF," "MAY," "PLAN," "PRESENT," "PROPOSE," "PROSPECT," "UPDATE," "WHETHER," "WILL," "WOULD," FUTURE OR CONDITIONAL VERB TENSES, SIMILAR TERMS, VARIATIONS ON SUCH TERMS OR NEGATIVES OF SUCH TERMS. ALTHOUGH THE COMPANY BELIEVES THE ANTICIPATED RESULTS OR OTHER EXPECTATIONS REFLECTED IN SUCH FORWARD-LOOKING STATEMENTS ARE BASED ON REASONABLE ASSUMPTIONS, IT CAN GIVE NO ASSURANCE THAT THOSE RESULTS OR EXPECTATIONS WILL BE ATTAINED. ACTUAL RESULTS COULD DIFFER MATERIALLY FROM THOSE INDICATED IN SUCH STATEMENTS DUE TO RISKS, UNCERTAINTIES AND CHANGES WITH RESPECT TO A VARIETY OF FACTORS, INCLUDING, BUT NOT LIMITED TO, INTERNATIONAL, NATIONAL, REGIONAL OR LOCAL ECONOMIC ENVIRONMENTS (PARTICULARLY IN THE MARKET AREAS WHERE THE COMPANY OPERATES), GOVERNMENT FISCAL AND MONETARY POLICIES (PARTICULARLY IN THE MARKET AREAS WHERE THE COMPANY OPERATES), PREVAILING INTEREST OR CURRENCY EXCHANGE RATES, EFFECTIVENESS OF INTEREST RATE, CURRENCY AND OTHER HEDGING STRATEGIES, LAWS AND REGULATIONS AFFECTING FINANCIAL INSTITUTIONS, INVESTMENT COMPANIES AND REAL ESTATE (INCLUDING REGULATORY FEES, CAPITAL REQUIREMENTS, ACCESS FOR DISABLED PERSONS AND ENVIRONMENTAL COMPLIANCE), UNCERTAINTY OF FOREIGN LAWS, COMPETITIVE PRODUCTS, PRICING AND CONDITIONS (INCLUDING FROM COMPETITORS THAT HAVE SIGNIFICANTLY GREATER RESOURCES THAN THE COMPANY), CREDIT, PREPAYMENT, BASIS, DEFAULT, SUBORDINATION AND ASSET/LIABILITY RISKS, LOAN SERVICING EFFECTIVENESS, ABILITY TO IDENTIFY ACQUISITIONS AND INVESTMENT OPPORTUNITIES MEETING THE COMPANY'S INVESTMENT STRATEGY, THE COURSE OF NEGOTIATIONS AND THE ABILITY TO REACH AGREEMENT WITH RESPECT TO THE MATERIAL TERMS OF ANY PARTICULAR TRANSACTION, SATISFACTORY DUE DILIGENCE RESULTS, SATISFACTION OR FULFILLMENT OF AGREED UPON TERMS AND CONDITIONS OF CLOSING OR PERFORMANCE, THE TIMING OF TRANSACTION CLOSINGS, SOFTWARE INTEGRATION, DEVELOPMENT AND LICENSING, AVAILABILITY OF AND COSTS ASSOCIATED WITH OBTAINING ADEQUATE AND TIMELY SOURCES OF LIQUIDITY, ABILITY TO REPAY OR REFINANCE INDEBTEDNESS (AT MATURITY OR UPON ACCELERATION), TO MEET COLLATERAL CALLS BY LENDERS (UPON RE-VALUATION OF THE UNDERLYING ASSETS OR OTHERWISE), TO GENERATE REVENUES SUFFICIENT TO MEET DEBT SERVICE PAYMENTS AND OTHER OPERATING EXPENSES, AVAILABILITY OF DISCOUNT LOANS FOR PURCHASE, SIZE OF, NATURE OF AND YIELDS AVAILABLE WITH RESPECT TO THE SECONDARY MARKET FOR MORTGAGE LOANS, FINANCIAL, SECURITIES AND SECURITIZATION MARKETS IN GENERAL, ALLOWANCES FOR LOAN LOSSES, CHANGES IN REAL ESTATE CONDITIONS (INCLUDING LIQUIDITY, VALUATION, REVENUES, RENTAL RATES, OCCUPANCY LEVELS AND COMPETING PROPERTIES), ADEQUACY OF INSURANCE COVERAGE IN THE EVENT OF A LOSS, OTHER FACTORS GENERALLY UNDERSTOOD TO AFFECT THE REAL ESTATE ACQUISITION, MORTGAGE AND LEASING MARKETS AND SECURITIES INVESTMENTS, AND OTHER RISKS DETAILED FROM TIME TO TIME IN THE COMPANY'S REPORTS AND FILINGS WITH THE COMMISSION, INCLUDING ITS REGISTRATION STATEMENTS ON FORMS S-1 AND S-3 AND PERIODIC
TABLE OF CONTENTS (CONTINUED) PAGE Item 9. Changes in and Disagreements with Accounta nts on Accounting and Financial Disclosure................ .......................... 24 PART III Item 10. Directors and Executive Officers of Regist rant...................... 24 Item 11. Executive Compensation.................... .......................... 24 Item 12. Security Ownership of Certain Beneficial O wners and Management.......................... .......................... 23 Item 13. Certain Relationships and Related Transact ions...................... 24 PART IV Item 14. Exhibits, Financial Statement Schedules, a nd Reports on Form 8-K............................. .......................... 25 Signatures.................................. .......................... 27 FORWARD-LOOKING STATEMENTS

REPORTS ON FORMS 10-Q, 8-K AND 10-K AND EXHIBIT 99.1, RISK FACTORS (filed herewith), TO THE COMPANY'S FORM 10-K FOR THE YEAR ENDED DECEMBER 31, 1999. GIVEN THESE UNCERTAINTIES, READERS ARE CAUTIONED NOT TO PLACE UNDUE RELIANCE ON SUCH STATEMENTS. THE COMPANY DOES NOT UNDERTAKE, AND SPECIFICALLY DISCLAIMS ANY OBLIGATION, TO PUBLICLY RELEASE THE RESULT OF ANY REVISIONS THAT MAY BE MADE TO ANY FORWARD-LOOKING STATEMENTS TO REFLECT THE OCCURRENCE OF ANTICIPATED OR UNANTICIPATED EVENTS OR CIRCUMSTANCES AFTER THE DATE OF SUCH STATEMENTS.
3

PART I
ITEM 1. BUSINESS
GENERAL
Ocwen Financial Corporation ("OCN" or the "Company") is a specialty financial services company whose primary business activities consist of the acquisition, servicing and resolution of subperforming and non-performing residential and commercial mortgage loans, as well as the related development of loan servicing technology and business-to-business e-commerce solutions for the mortgage and real estate industries.
The Company is a Florida corporation which was organized in February 1988 in connection with its acquisition of Ocwen Federal Bank FSB (the "Bank"). The Company is a registered savings and loan holding company subject to regulation by the Office of Thrift Supervision (the "OTS"). The Bank is a wholly owned subsidiary of the Company and is subject to regulation by the OTS, as its chartering authority, and by the Federal Deposit Insurance Corporation ("FDIC"), as a result of its membership in the Savings Association Insurance Fund ("SAIF"), which insures the Bank's deposits to the maximum extent permitted by law. The Bank is also subject to certain regulation by the Board of Governors of the Federal Reserve System ("Federal Reserve Board") and currently is a member of the Federal Home Loan Bank ("FHLB") of New York, one of the 12 regional banks which comprise the FHLB System.
SEGMENTS
The Company's business segments consisted of the following: (i) single family residential and commercial real estate discount loan acquisition and resolution activities; (ii) servicing of domestic residential mortgage loans for others; (iii) investments in low-income housing tax credit interests; (iv) commercial real estate lending; (v) United Kingdom ("UK") operations; (vi) technology (which is conducted through Ocwen Technology Xchange ("OTX") and its subsidiaries); (vii) domestic subprime single family residential lending; (viii) investment securities; (ix) the operations of Ocwen Asset Investment Corp., a Florida corporation (and together with its predecessor by merger, a Virginia corporation, "OAC"); (x) unsecured collections; and (xi) corporate items and other.
During 1999, segment activity reflects growth in the servicing segment, an exit from the direct subprime originations business, both in the US and the UK, the cessation of commercial and multi-family loan origination activity and the acquisition of OAC.
DISCOUNT LOANS
Certain mortgage loans, for which the borrower is not current as to principal and interest payments or for which there is a reason to believe the borrower will be unable to continue to make scheduled principal and interest payments, are acquired at a discount. Discount loans generally have collateral coverage which is sufficiently in excess of the purchase price of the loan, such that successful resolutions can produce total returns which are in excess of an equivalent investment in performing mortgage loans.
The Company began its discount loan operations in 1991 and initially focused on the acquisition of single family residential loans. In 1994 the Company expanded this business to include the acquisition and resolution of discount multi-family residential and commercial real estate loans (together, unless the context otherwise requires, "commercial real estate loans"). Prior to entering the discount loan business, management of the Company had substantial loan resolution experience through former subsidiaries of the Company which had been engaged in the business of providing private mortgage insurance for residential loans. This experience assisted the Company in developing the procedures, facilities and systems to evaluate, acquire and resolve such loans.
ACQUISITION OF DISCOUNT LOANS. Discount real estate loans generally are acquired in pools, although discount commercial real estate loans may be acquired individually. These pools generally are acquired in auctions or other competitive bid circumstances. The Company obtains a substantial amount of discount loans from various private sector sellers, such as banks, savings institutions, mortgage companies, subprime lenders and insurance companies. In addition, governmental agencies, including the Department of Housing and Urban Development ("HUD"), are potential sources of discount loans.
4

The Company generally acquires discount loans solely for its own portfolio. From time to time, however, the Company and one or more co-investors may submit a joint bid to acquire a pool of discount loans in order to enhance the prospects of submitting a successful bid. If successful, the Company and the co-investors generally allocate ownership of the acquired loans in an agreed upon manner, although in certain instances the Company and the co-investor may continue to have a joint interest in the acquired loans. In addition, from time to time the Company and a co-investor may acquire discount loans through a joint venture.
Prior to making an offer to purchase a portfolio of discount loans, the Company conducts an investigation and evaluation of the loans in the portfolio. Evaluations of potential discount loan acquisitions are conducted primarily by the Company's employees who specialize in the analysis of nonperforming loans, often with further specialization based on geographic or collateral-specific factors. The Company's employees regularly use third parties, such as brokers, who are familiar with a property's type and location, to assist them in conducting an evaluation of the value of collateral property, and depending on the circumstances, particularly in the case of commercial real estate loans, may use subcontractors, such as local counsel and engineering and environmental experts, to assist in the evaluation and verification of information and the gathering of other information not previously made available by a potential seller.
The Company determines the purchase offer by using a proprietary modeling system and loan information database which focuses on the anticipated recovery amount and the timing and cost of the resolution of the loans. The amount offered by the Company generally is at a discount from both the stated value of the loan and the value of the underlying collateral which the Company estimates is sufficient to generate an acceptable return on its investment.
RESOLUTION OF DISCOUNT LOANS. After a discount loan is acquired, the Company utilizes its information technology software systems to resolve the loan as expeditiously as possible in accordance with specified procedures. The various resolution alternatives generally include the following: (i) the borrower brings the loan current in accordance with original or modified terms; (ii) the borrower repays the loan or a negotiated amount of the loan; (iii) the borrower agrees to deed the property to the Company in lieu of foreclosure, in which case it is classified as real estate owned and held for sale by the Company; or (iv) the Company forecloses on the loan and the property is acquired at the foreclosure sale either by a third party or by the Company, in which case it is classified as real estate owned and held for sale by the Company. In addition, in the case of single family residential loans, assistance is provided to borrowers in the form of forbearance agreements under which the borrower either makes a monthly payment less than or equal to the original monthly payment or makes a monthly payment more than the contractual monthly payment to make up for arrearages.
In appropriate cases, the Company works with borrowers to resolve the loan in advance of foreclosure. One method is through forbearance agreements, which generally allow the borrower to pay the contractual monthly payment plus a portion of the arrearage each month, and other means. Although this strategy may result in an initial reduction in the yield on a discounted loan, the Company believes that it is advantageous because it (i) generally results in a higher resolution value than foreclosure; (ii) reduces the amount of real estate owned acquired by foreclosure or by deed-in-lieu thereof and related risks, costs and expenses; (iii) enhances the ability of the Company to sell the loan in the secondary market, either on a whole loan basis or through securitizations (in which case the Company may continue to earn fee income from servicing such loans); and (iv) permits the borrower to retain ownership of the home and, thus, enhances relations between the Company and the borrower.
The general goal of the Company's asset resolution process is to maximize, in a timely manner, cash recovery on each loan in the discount loan portfolio. The Company generally anticipates a longer period (approximately 12 to 30 months) to resolve discount commercial real estate loans than to resolve discount single family residential loans because of their complexity and the wide variety of issues that may occur in connection with the resolution of such loans.
The Credit Committee of the Board of Directors of the Bank actively monitors the asset resolution process to identify discount loans which have exceeded their expected foreclosure period and real estate owned which has been held longer than anticipated. Plans of action are developed for each of these assets to remedy the cause for delay and are reviewed by the Credit Committee.
SALE OF DISCOUNT LOANS. From time to time the Company sells performing discount loans either on a whole loan basis or indirectly through the securitization of such loans and sale of the mortgage-related securities backed by them. During the third quarter of 1999, the Company made a strategic decision to structure future securitizations as financing transactions, which will preclude the use of gain-on-sale accounting. There were no securitizations of loans executed by the Company during the second half of 1999.
5

Additional financial information regarding this segment appears under the captions "Segment Profitability" on page 21 and "Note 29: Business Segment Reporting" on pages 113 to 114 of the Company's 2000 Annual Report to Shareholders (the "Annual Report to Shareholders") and is incorporated herein by reference.
DOMESTIC RESIDENTIAL MORTGAGE LOAN SERVICING
During 1996, the Company developed a program to provide loan servicing and various other asset management and resolution services to third party owners of nonperforming assets, underperforming assets and subprime assets such as Class B, C and D single family residential mortgage loans. Servicing contracts entered into by the Company provide for the payment to the Company of specified fees and in some cases may include terms which allow the Company to participate in the profits resulting from the successful resolution of the assets being serviced. Servicing fees, generally expressed as a percent of the unpaid principal balance, are collected from the borrowers' payments. During any period in which the borrower is not making payments, the Company is required under certain servicing agreements to advance its own funds to meet contractual principal and interest remittance requirements for certain investors, maintain property taxes and insurance, and process foreclosures. The Company generally recovers such advances from borrowers for reinstated and performing loans and from investors for foreclosed loans.
The Bank has been approved as a loan servicer by HUD, Federal Home Loan Mortgage Corporation ("FHLMC") and Federal National Mortgage Association ("FNMA"). The Bank is rated a Tier 1 servicer and as a preferred servicer for high-risk mortgages by FHLMC, the highest rating categories. The Bank is one of only six special servicers of commercial mortgage loans to have received a "Strong" rating from Standard & Poor's. The Bank is recognized and/or designated by four rating agencies (Standard & Poor's, Duff and Phelps, IBC Fitch Investors, and Moody's) as a "Special Servicer" for both commercial and residential mortgage loans and is the only special servicer with this designation for all mortgage categories.
The Company developed the concept of residential special servicing in 1997 and, in 1998, began entering into special servicing arrangements wherein the Company acted as a special servicer for third parties, typically as part of a securitization. The Company services loans that become greater than 90 days past due and receives incentive fees to the extent certain loss mitigation parameters are achieved.
In connection with the securitization and sale of loans, the Company generally retains the rights to service such loans for investors. The Company also acquires mortgage servicing rights which are recorded at cost.
During 1999, the Company opened a 125,000 square foot national servicing center in Orlando, Florida. The service center has capacity to house 900 employees per shift handling customer contact on up to one million loans.
In December 1999, OCN announced a joint venture with independent Italian loan servicer, FBS SpA, to service mortgage loans in Italy. The new joint venture gives OCN 50% ownership in a newly formed company, Ocwen FBS SpA.
Additional financial information regarding this segment appears under the captions "Segment Profitability" on pages 21 to 22 and "Note 29: Business Segment Reporting" on pages 113 to 114 of the Annual Report to Shareholders and is incorporated herein by reference.
INVESTMENTS IN LOW -INCOME HOUSING TAX CREDIT INTERESTS
The Company invests in low-income housing tax credit interests primarily through limited partnerships for the purpose of obtaining Federal income tax credits pursuant to Section 42 of the Internal Revenue Code of 1986, as amended (the "Code"), which provides a tax credit to investors in qualified low-income rental housing that is constructed, rehabilitated or acquired after December 31, 1986. To be eligible for housing tax credits, a property generally must first be allocated an amount of tax credits by the tax credit allocating agency, which in most cases also serves as the housing finance agency, of the state in which the property is located. If the property is to be constructed or rehabilitated, it must be completed and placed in service within a specified time, generally within two years after the year in which the tax credit allocation is received. A specified portion of the apartment units in a qualifying project may be rented only to qualified tenants for a period of 15 years, or a portion of any previously claimed tax credits will be subject to recapture, as discussed below.
6

The Company's investments in low-income housing tax credit interests are made by the Company indirectly through its subsidiaries, which may be a general partner and/or a limited partner in the partnership. Low-income housing tax credit partnerships in which the Company, through a subsidiary, acts as a general partner are presented on a consolidated basis.
The affordable housing projects owned by the low-income housing tax credit partnerships in which the Company has invested are located throughout the United States.
The ownership of low-income housing tax credit interests produces two types of tax benefits. The primary tax benefit flows from the low-income housing tax credits under the Code which are generated by the ownership and operation of the real property in the manner required to obtain such tax credits. These credits may be used to offset Federal income tax on a dollar for dollar basis but may not offset the alternative minimum tax; tax credits thus may reduce the overall Federal income tax to an effective rate of 20%. In addition, the operation of the rental properties produces losses for financial statement and tax purposes in the early years and sometimes throughout the anticipated ownership period. These tax losses may be used to offset taxable income from other operations and thereby reduce income tax which would otherwise be paid on such taxable income.
Tax credits may be claimed over a ten-year period on a straight-line basis once the underlying multi-family residential properties are placed in service. Tax credits claimed reduce the tax payments computed based upon taxable income to not less than the alternative minimum tax computed for that year or any year not more than three years before or 15 years after the year the tax credit is earned. The Taxpayer Relief Act of 1997 changed the tax credit carryback period from 3 years to 1 year and the carry forward period from 15 years to 20 years for credits that become available for use in years beginning after December 31, 1997. Tax credits are realized even if units in the project do not continue to be occupied once the units in the project have been initially rented to qualifying tenants, and tax credits are not dependent on a project's operating income or appreciation. Tax credits can be claimed over a ten-year period and generally can be lost or recaptured only if non-qualifying tenants are placed in units, ownership of the project is transferred or the project is destroyed and not rebuilt during a 15-year compliance period for the project. The Company has established specific investment criteria for investment in multi-family residential projects which have been allocated tax credits, which require, among other things, a third party developer of the project and/or the seller of the interest therein to provide a guarantee against loss or recapture of tax credits and to maintain appropriate insurance to fund rebuilding in case of destruction of the project. Notwithstanding the Company's efforts, there can be no assurance that the multi-family residential projects owned by the low-income housing tax credit partnerships in which it has invested will satisfy applicable criteria during the 15-year compliance period and that there will not be loss or recapture of the tax credits associated therewith.
Additional financial information regarding this segment appears under the captions "Segment Profitability" on pages 21 to 22 and "Note 29: Business Segment Reporting" on pages 113 to 114 of the Annual Report to Shareholders and is incorporated herein by reference.
COMMERCIAL REAL ESTATE LENDING
The Company's investment in multi-familiy residential and commercial real estate loans declined significantly during 1999, reflecting the Company's decision to cease the origination of such loans. The Company's lending activities have historically included the acquisition of loans secured by commercial real estate, particularly loans secured by hotels and office buildings, which the Company began originating in late 1994 and late 1995, respectively. Commercial real estate loans have also been made to finance the purchase and refinance of commercial properties, the refurbishment of distressed properties and the construction of hotels. Additionally, the Company has originated loans for the construction of multi-family residences, as well as bridge loans to finance the acquisition and rehabilitation of distressed multi-family residential properties.
Multi-family residential and commercial real estate loans are secured by a first priority lien on the real property, all improvements thereon and, in the case of hotel loans, all fixtures and equipment used in connection therewith, as well as a first priority assignment of all revenue and gross receipts generated in connection with the property. The liability of a borrower on multi-family residential and commercial real estate loans generally is limited to the borrower's interest in the property, except with respect to certain specified circumstances.
In addition to stated interest, certain of the the large multi-family residential and commercial real estate loans originated by the Company include provisions pursuant to which the borrower agrees to pay the Company as additional interest on the loan an amount based on specified percentages (generally between 10-38%) of the net cash flow from the property during the term of
7
the loan and/or the net proceeds from the sale or refinancing of the property upon maturity of the loan. Participating interests have also been obtained in the form of additional fees which must be paid by the borrower in connection with a prepayment of the loan, generally after an initial lock-out period during which prepayments are prohibited. The fees which could be payable by a borrower during specified periods of the loan consist of either fixed exit fees or yield maintenance payments, which are required to be paid over a specified number of years after the prepayment and are intended to increase the yield to the Company on the proceeds from the loan payoff to a level which is comparable to the yield on the prepaid loan.
Construction loans generally have terms of three to four years and interest rates which float on a monthly basis in accordance with designated reference rates. Payments during the term of the loan may be made to the Company monthly on an interest-only basis. The loan amount may include an interest reserve which is maintained by the Company and utilized to pay interest on the loan during a portion of its term.
Construction loans are secured by a first priority lien on the real property, all improvements thereon and all fixtures and equipment used in connection therewith, as well as a first priority assignment of all revenues and gross receipts generated in connection with the property. Construction loans are made without pre-leasing requirements or any requirement of a commitment by another lender to "take-out" the construction loan by making a permanent loan secured by the property upon completion of construction. Disbursements on a construction loan are subject to a retainage percentage of 10% and are made only after evidence that available funds have been utilized by the borrower, available funds are sufficient to pay for all construction costs through the date of the construction advance and funds remain in the construction budget and from sources other than the loan to complete construction of the project.
The Company generally has required the general contractor selected by the borrower, which along with the general construction contract is subject to the Company's review and approval, to provide payment and performance bonds issued by a surety approved by the Company in an amount at least equal to the costs which are estimated to be necessary to complete construction of the project in accordance with the construction contract. Moreover, the Company generally conducts site inspections of projects under construction at least bi-monthly and of completed projects at least semi-annually.
Additional financial information regarding this segment appears under the captions "Segment Profitability" on pages 21 to 22 and "Note 29: Business Segment Reporting" on pages 113 to 114 of the Annual Report to Shareholders and is incorporated herein by reference.
UK OPERATIONS
The Company entered the UK subprime residential mortgage market in 1998 through the acquisition of 36.07% of the total outstanding common stock of Norland Capital Group plc, doing business as Kensington Mortgage Company ("Kensington"), on February 25, 1998 for $45.9 million. The Company's investment at December 31, 1999 represented 35.84% of Kensington's total outstanding common stock. Kensington is an originator of subprime residential mortgages in the UK.
On April 24, 1998, the Company, through its then wholly-owned subsidiary Ocwen UK plc ("Ocwen UK"), acquired substantially all of the assets, and certain liabilities, of the UK operations of Cityscape Financial Corp. ("Cityscape UK"). As consummated, the Company acquired Cityscape UK's mortgage loan portfolio and its residential subprime mortgage loan origination and servicing businesses. On October 1, 1999, the Company sold all the shares of Ocwen UK Limited, formerly known as Ocwen UK, to Malvern House Acquisition Limited for the pound sterling equivalent of $122.1 million in cash. As a result of the transaction, the Company recorded a pretax gain on sale of $50.4 million.
Additional financial information regarding this segment appears under the captions "Segment Profitability" on pages 21 to 22 and "Note 29: Business Segment Reporting" on pages 113 to 114 of the Annual Report to Shareholders and is incorporated herein by reference.
OTX
OTX, which was formed in 1998, designs software solutions for mortgage and real estate transactions, provides business-to-business e-commerce solutions via the Internet for the mortgage and real estate industries, and also provides implementation, integration and consulting services related to its software and internet products. OTX's principal products are its REALTransSM
8

system, REAL-e(TM) software and REALSynergy(TM) software.
The REALTrans system is a web-based mortgage loan processing application and vendor management system that facilitates the electronic ordering, tracking and fulfillment of mortgage and real estate products and services. It automates the mortgage process, eliminating duplicate manual data entry, reducing errors and speeding delivery time. It also provides a task-based workflow management system, allowing users to track the progress of all tasks and vendor requests required to fulfill an order from any location, at any time.
The REAL-e software is a Windows-based, residential loan-servicing platform that manages the total servicing life cycle of a loan. The REAL-e software was developed through years of experience in the loan servicing industry. It provides powerful workflow management capability, leading to increased effectiveness and lower operational costs, and it integrates with the Internet, call center telephony and data warehouse technology. It can be implemented in its entirety or as a series of modules, including Loan Servicing, Collections, Loss Mitigation, Default Loan Management, REO Management, Construction Loan Servicing and Single Family Bond Series Tracking.
In June 1999, OTX acquired the assets of Synergy Software, LLC, a developer of commercial and multifamily mortgage servicing systems. The REALSynergy software is an advanced, Windows-based full-service commercial and multi-family loan servicing software. It handles virtually any loan structure, including complex remittance requirements, monitors multiple properties for each loan, tracks building and site information reports, details extensive appraisal summaries, and includes dynamic, easy-to-use contact management, call tracking and task management capabilities.
The losses incurred by OTX in 1999 and 1998 reflect OCN's continuing efforts to develop OTX and its suite of technology-based solutions.
Additional financial information regarding this segment appears under the captions "Segment Profitability" on pages 21 to 22 and "Note 29: Business Segment Reporting" on pages 113 to 114 of the Annual Report to Shareholders and is incorporated herein by reference.
DOMESTIC SUBPRIME SINGLE FAMILY RESIDENTIAL LENDING
In August 1999, the Company closed its domestic subprime origination business and reassigned or terminated employees who were involved in loan origination and related management and support functions. Since late 1994, the Company's lending activities have included the origination and purchase of domestic single family residential loans to borrowers who because of prior credit problems, the absence of a credit history or other factors are unable or unwilling to qualify as borrowers for a single family residential loan under guidelines of the FNMA and the FHLMC ("conforming loans") and who have substantial equity in the properties which secure the loans.
Through 1996, the Company acquired subprime single family residential loans primarily through a correspondent relationship with Admiral Home Loan ("Admiral") and, to a lesser extent, correspondent relationships with three other financial services companies. Correspondent institutions originated loans based on guidelines provided by the Company and promptly sold the loans to the Company on a servicing-released basis.
The Company, through Ocwen Financial Services, Inc. ("OFS"), acquired substantially all of the assets of Admiral in a transaction which closed on May 1, 1997. In connection with the Company's acquisition of assets from Admiral, the Bank transferred its retail and wholesale subprime single family residential lending operations to OFS.
The terms of the loan products offered by the Company directly or through its correspondents emphasized real estate loans which generally were underwritten with significant reliance on a borrower's level of equity in the property securing the loan.
Additional financial information regarding this segment appears under the captions "Segment Profitability" on pages 21 to 22 and "Note 29: Business Segment Reporting" on pages 113 to 114 of the Annual Report to Shareholders and is incorporated herein by reference.
9

INVESTMENT SECURITIES
Investment securities includes the results of the securities portfolio, whether available for sale or investment, other than subprime residuals and subordinate interests related to the Company's securitization activities (which have been included in the related business activity). The investment policy of the Company, which is established by the Investment Committee and approved by the Board of Directors, is designed primarily to provide a portfolio of diversified instruments while seeking to optimize net interest income within acceptable limits of interest rate risk, credit risk and liquidity.
On July 27, 1998, the Company sold its entire portfolio of AAA-rated agency interest-only securities ("IOs") for $137.5 million, which represented book value. As a result of an increase in prepayment speeds due to declining interest rates, the Company recorded impairment charges of $86.1 million in 1998 prior to the sale resulting from the Company's decision to discontinue this investment activity and write down the book value of the IOs. The AAA-rated agency IOs consisted of IOs, which are classes of mortgage-related securities that are entitled to payments of interest but no (or only nominal) principal, and inverse IOs, which bear interest at a floating rate that varies inversely with (and often at a multiple of) changes in a specified index.
Additional financial information regarding this segment appears under the captions "Segment Profitability" on pages 21 to 22 and "Note 29: Business Segment Reporting" on pages 113 to 114 of the Annual Report to Shareholders and is incorporated herein by reference.
OAC
On October 7, 1999, Ocwen Acquisition Company ("Acquisition Sub"), a Virginia corporation and an indirect wholly-owned subsidiary of OCN, merged (the "Merger") with and into OAC, a Virginia corporation, in accordance with the Agreement of Merger (the "Merger Agreement") dated as of July 25, 1999 among OAC, OCN, and Acquisition Sub. In accordance with the Merger Agreement, OAC shareholders (except for OCN or its subsidiaries) received 0.71 shares of OCN stock for each outstanding share of OAC common stock. A total of 12,371,750 shares of OCN stock at a value of $96.8 million were issued to OAC shareholders. The Merger, which resulted in OCN acquiring the remaining interest in OAC, reflects an aggregate purchase price of $101.3 million, including direct costs of the acquisition. The Merger was accounted for as a purchase, and the purchase price has been allocated to OAC's assets and liabilities based on their fair market values. The resulting $60.0 million excess of net assets acquired over the purchase price is being amortized on a straight-line basis over a period of five years. Prior to the Merger, the Company, through IMI, owned 1,540,000 or 8.12% of the outstanding common stock of OAC and 1,808,733 units or 8.71% of the outstanding partnership units of Ocwen Partnership L.P. ("OPLP"). OPLP is the operating partnership subsidiary of OAC.
On October 20, 1999, OAC merged into Small Commercial Properties Corporation I ("SCP"), a Florida corporation and an indirect wholly-owned subsidiary of OCN. Immediately thereafter, SCP changed its name to Ocwen Asset Investment Corp. As a result of this merger, OAC ceased to qualify as a real estate investment trust ("REIT") under the Code.
OAC is a real estate investment company which has invested in several categories of real estate and real estate related assets, including (i) subordinate interests in commercial and residential mortgage-backed securities; (ii) distressed commercial and multi-family real property, including properties acquired by a mortgage lender at foreclosure (or deed in lieu of foreclosure); (iii) commercial, multi-family and single-family residential mortgage loans, including construction and rehabilitation loans and mezzanine loans; (iv) interest-only and inverse interest-only mortgage-related securities supported by residential and commercial mortgage loans; and (v) discount loans. OAC also has acquired real property or mortgage loans secured by such real property and other real property interests that: (i) may be environmentally distressed; or (ii) are located outside the United States.
Additional financial information regarding this segment appears under the captions "Segment Profitability" on pages 21 to 22 and "Note 29: Business Segment Reporting" on pages 113 to 114 of the Annual Report to Shareholders and is incorporated herein by reference.
UNSECURED COLLECTIONS
In 1998, the Company began acquiring charged-off unsecured credit card receivables at a discount. Collections of unsecured credit card receivables are accounted for under the cost recovery method, whereby revenue is recognized only to the
10

extent that collections have exceeded original cost.
Additional financial information regarding this segment appears under the captions "Segment Profitability" on pages 21 to 22 and "Note 29: Business Segment Reporting" on pages 113 to 114 of the Annual Report to Shareholders and is incorporated herein by reference.
CORPORATE ITEMS AND OTHER
Corporate items and other consists primarily of individually insignificant business activities, amounts not allocated to the operating segments, distributions on the Company's 10-7/8% Capital Trust Securities, transfer pricing mismatches and other general corporate expenses.
Additional financial information regarding this segment appears under the captions "Segment Profitability" on pages 21 to 22 and "Note 29: Business Segment Reporting" on pages 113 to 114 of the Annual Report to Shareholders and is incorporated herein by reference.
SOURCES OF FUNDS
GENERAL. Deposits, FHLB advances, reverse repurchase agreements, lines of credit, and maturities and payments of principal and interest on loans and securities and proceeds from the sales and securitizations thereof currently are the principal sources of funds for use in the Company's investment and lending activities and for other general business purposes. Management of the Company closely monitors rates and terms of competing sources of funds on a regular basis and generally utilizes the sources which are the most cost effective.
DEPOSITS. The primary source of deposits for the Company is brokered certificates of deposit obtained primarily through national investment banking firms which, pursuant to agreements with the Company, solicit funds from their customers for deposit with the Company ("brokered deposits"). In addition, during 1995, the Company commenced a program to obtain certificates of deposit from customers of regional and local investment banking firms which are made aware of the Company's products by the Company's direct solicitation and marketing efforts. The Company also solicits certificates of deposit from institutional investors and high net worth individuals identified by the Company. The Company's brokered deposits are reported net of unamortized deferred fees, which have been paid to investment banking firms.
The Company believes that the effective cost of brokered and other wholesale deposits is more attractive to the Company than deposits obtained on a retail basis from branch offices after the general and administrative expense associated with the maintenance of branch offices is taken into account. Moreover, brokered and other wholesale deposits generally give the Company more flexibility than retail sources of funds in structuring the maturities of its deposits and in matching liabilities with comparably maturing assets.
Although management of the Company believes that brokered and other wholesale deposits are advantageous in certain respects, such funding sources, when compared to retail deposits attracted through a branch network, are generally more sensitive to changes in interest rates and volatility in the capital markets and are more likely to be compared by the investor to competing investments. In addition, such funding sources may be more sensitive to significant changes in the financial condition of the Company. There are also various regulatory limitations on the ability of all but well-capitalized insured financial institutions to obtain brokered deposits. See "Regulation - The Bank - Brokered Deposits." These limitations currently are not applicable to the Company because the Bank is a well-capitalized financial institution under applicable laws and regulations. See "Regulation - The Bank -Regulatory Capital Requirements." There can be no assurances, however, that the Company will not become subject to such limitations in the future.
As a result of the Company's reliance on brokered and other wholesale deposits, significant changes in the prevailing interest rate environment, in the availability of alternative investments for individual and institutional investors or in the Company's financial condition, among other factors, could affect the Company's liquidity and results of operations much more significantly than might be the case with an institution that obtained a greater portion of its funds from retail or core deposits attracted through a branch network.
11

In addition to brokered and other wholesale deposits, the Company obtains deposits from its office located in New Jersey. These deposits include non-interest bearing checking accounts, NOW and money market checking accounts, savings accounts and certificates of deposit and are obtained through advertising, walk-ins and other traditional means. At December 31, 1999, the deposits which were allocated to this office comprised approximately 5% of the Company's total deposits.
BORROWINGS. Through the Bank, the Company can obtain advances from the FHLB of New York upon the security of certain of its residential first mortgage loans, mortgage-backed and mortgage-related securities and other assets, including FHLB stock, provided certain standards related to the creditworthiness of the Bank have been met. FHLB advances are available to member financial institutions, such as the Bank, for investment and lending activities and other general business purposes. FHLB advances are made pursuant to several different credit programs, each of which has its own interest rate, which may be fixed or adjustable, and range of maturities.
The Company also obtains funds pursuant to securities sold under reverse repurchase agreements. Under these agreements, the Company sells securities (generally mortgage-backed and mortgage-related securities) under an agreement to repurchase such securities at a specified price at a later date. Reverse repurchase agreements have short-term maturities (typically 90 days or less) and are deemed to be financing transactions. All securities underlying reverse repurchase agreements are reflected as assets in the Company's consolidated financial statements and are held in safekeeping by broker-dealers.
The Company's borrowings also include lines of credit, notes, subordinated debentures, bonds - match funded agreements and other interest-bearing obligations.
OTHER. Additional information on the Company's sources of funds appears under the captions "Liquidity, Commitments and Off-Balance Sheet Risks" on pages 60 to 61, "Deposits" on pages 54 to 55, "Note 16: Deposits" on page 96, "Note 17: Bonds-Match Funded Agreements" on pages 96 to 97, "Note 18: Obligations Outstanding Under Lines of Credit" on page 97 and "Note 19: Notes, Debentures and Other Interest-Bearing Obligations" on pages 98 to 99 of the Annual Report to Shareholders and is incorporated herein by reference.
RISK FACTORS
Information related to risk factors which could directly or indirectly, affect the Company's results of operations and financial condition set forth in Exhibit 99.1 and are incorporated herein by reference.
COMPETITION
The information under the caption "Competition" set forth in Exhibit 99.1 is incorporated herein by reference.
SUBSIDIARIES
A list of the Company's significant subsidiaries is set forth in Exhibit 21.0 and is incorporated herein by reference.
EMPLOYEES
At December 31, 1999 the Company had 1,131 full time employees. The employees are not represented by a collective bargaining agreement. Management considers the Company's employee relations to be satisfactory.
REGULATION
Financial institutions and their holding companies are extensively regulated under federal and state laws. As a result, the business, financial condition and prospects of the Company can be materially affected not only by management decisions and general economic conditions, but also by applicable statutes and regulations and other regulatory pronouncements and policies promulgated by regulatory agencies with jurisdiction over the Company and the Bank, such as the OTS and the FDIC. The effect of such statutes, regulations and other pronouncements and policies can be significant, cannot be predicted with a high degree of certainty and can change over time. Moreover, such statutes, regulations and other pronouncements and policies are intended to protect depositors and the insurance funds administered by the FDIC and not stockholders or holders of indebtedness which are not insured by the FDIC.
The enforcement powers available to Federal banking regulators are substantial and include, among other things, the ability to assess civil monetary penalties, to issue cease-and-desist or removal orders and to initiate injunctive actions against banking organizations and institution-affiliated parties, as defined. In general, these enforcement actions must be initiated for violations of laws and regulations and unsafe or unsound practices. Other actions or inactions may provide the basis for enforcement action, including misleading or untimely reports filed with regulatory authorities.
The following discussion and other references to and descriptions of the regulation of financial institutions contained herein constitute brief summaries thereof as currently in effect. This discussion is not intended to constitute, and does not purport
12

to be, a complete statement of all legal restrictions and requirements applicable to the Company and the Bank and all such descriptions are qualified in their entirety by reference to applicable statutes, regulations and other regulatory pronouncements.
THE COMPANY
GENERAL. The Company is a registered savings and loan holding company under the Home Owner's Loan Act (the "HOLA"). As such, the Company is subject to regulation, supervision and examination by the OTS.
ACTIVITIES RESTRICTION. There are generally no restrictions on the activities of a savings and loan holding company, such as the Company, which holds only one subsidiary savings institution. However, if the Director of the OTS determines that there is reasonable cause to believe that the continuation by a savings and loan holding company of an activity constitutes a serious risk to the financial safety, soundness or stability of its subsidiary savings institution, the Director may impose such restrictions as are deemed necessary to address such risk, including limiting: (i) payment of dividends by the savings institution; (ii) transactions between the savings institution and its affiliates; and (iii) any activities of the savings institution that might create a serious risk that the liabilities of the holding company and its affiliates may be imposed on the savings institution. Notwithstanding the above rules as to permissible business activities of unitary savings and loan holding companies, if the savings institution subsidiary of such a holding company fails to meet the qualified thrift lender ("QTL") test set forth in OTS regulations, then such unitary holding company shall become subject to the activities and restrictions applicable to multiple savings and loan holding companies and, unless the savings institution requalifies as a QTL within one year thereafter, shall register as, and become subject to the restriction applicable to, a bank holding company. See "The Bank-Qualified Thrift Lender Test."
If the Company were to acquire control of another savings institution other than through merger or other business combination with the Bank, the Company would thereupon become a multiple savings and loan holding company. Except where such acquisition is pursuant to the authority to approve emergency thrift acquisition and where each subsidiary savings institution meets the QTL test, as set forth below, the activities of the Company and any of its subsidiaries (other than the Bank or other subsidiary savings institutions) would thereafter be subject to further restrictions. Among other things, no multiple savings and loan holding company or subsidiary thereof which is not a savings institution generally shall commence or continue for a limited period of time after becoming a multiple savings and loan holding company or subsidiary thereof any business activity, other than: (i) furnishing or performing management services for a subsidiary savings institution; (ii) conducting an insurance agency or escrow business; (iii) holding, managing, or liquidating assets owned by or acquired from a subsidiary savings institution; (iv) holding or managing properties used or occupied by a subsidiary savings institution; (v) acting as trustee under deeds of trust; (vi) those activities authorized by regulation as of March 5, 1987 to be engaged in by multiple savings and loan holding companies; or (vii) unless the Director of the OTS by regulation prohibits or limits such activities for savings and loan holding companies, those activities authorized by the Federal Reserve Board as permissible for bank holding companies. Those activities described in clause (vii) above also must be approved by the Director of the OTS prior to being engaged in by a multiple savings and loan holding company.
RESTRICTIONS ON ACQUISITIONS. Except under limited circumstances, savings and loan holding companies are prohibited from acquiring, without prior approval of the Director of the OTS: (i) control of any other savings institution or savings and loan holding company or substantially all of the assets thereof; or (ii) more than 5% of the voting shares of a savings institution or holding company thereof which is not a subsidiary. Except with the prior approval of the Director of the OTS, no director or officer of a savings and loan holding company, or person owning or controlling by proxy or otherwise more than 25% of such company's stock, may acquire control of any savings institution, other than a subsidiary savings institution, or of any other savings and loan holding company.
The Director of the OTS may approve acquisitions resulting in the formation of a multiple savings and loan holding company which controls savings institutions in more than one state only if: (i) the multiple savings and loan holding company involved controls a savings institution which operated a home or branch office located in the state of the institution to be acquired as of March 5, 1987; (ii) the acquiror is authorized to acquire control of the savings institution pursuant to the emergency acquisition provisions of the Federal Deposit Insurance Act ("FDIA"); or (iii) the statutes of the state in which the institution to be acquired is located specifically permit institutions to be acquired by state-chartered savings institutions located in the state where the acquiring entity is located (or by a holding company that controls such state-chartered savings institutions).
RESTRICTIONS ON TRANSACTIONS WITH AFFILIATES. Transactions between the Company or any of its non-bank subsidiaries and
13

the Bank are subject to various restrictions, which are described below under "The Bank-Affiliate Transactions."
THE BANK
GENERAL. The Bank is a federally-chartered savings bank organized under the HOLA. As such, the Bank is subject to regulation, supervision and examination by the OTS. The deposit accounts of the Bank are insured up to applicable limits by the SAIF administered by the FDIC and, as a result, the Bank also is subject to regulation, supervision and examination by the FDIC.
The business and affairs of the Bank are regulated in a variety of ways. Regulations apply to, among other things, insurance of deposit accounts, capital ratios, payment of dividends, liquidity requirements, the nature and amount of the investments that the Bank may make, transactions with affiliates, community and consumer lending laws, internal policies and controls, reporting by and examination of the Bank and changes in control of the Bank.
INSURANCE OF ACCOUNTS. Pursuant to legislation enacted in September 1996, a fee was required to be paid by all SAIF-insured institutions at the rate of $0.657 per $100 of deposits held by such institutions at March 31, 1995. The money collected recapitalized the SAIF reserve to the level of 1.25% of insured deposits as required by law. In 1996, the Bank recorded a pre-tax charge of $7.1 million for this assessment. The recapitalization of the SAIF has resulted in lower deposit insurance premiums for most SAIF-insured financial institutions, including the Bank.
Insured institutions also are required to share in the payment of interest on the bonds issued by a specially created government entity, the Finance Corporation ("FICO"), the proceeds of which were applied toward resolution of the thrift industry crisis in the 1980s. Beginning on January 1, 1997, in addition to the insurance premiums paid by SAIF-insured institutions to maintain the SAIF reserve at its required level pursuant to the current risk classification system, SAIF-insured institutions pay deposit insurance premiums towards the payment of interest on the FICO bonds. The FICO assessment rate is adjusted quarterly.
Under the current risk classification system, institutions are assigned to one of three capital groups which are based solely on the level of an institution's capital - "well capitalized," "adequately capitalized" and "undercapitalized" - which are defined in the same manner as the regulations establishing the prompt corrective action system under Section 38 of the FDIA, as discussed below. These three groups are then divided into three subgroups, which are based on supervisory evaluations by the institution's primary federal regulator, resulting in nine assessment classifications. Assessment rates currently range from 0 basis points for well capitalized, healthy institutions to 27 basis points for undercapitalized institutions with substantial supervisory concerns.
The FDIC may terminate the deposit insurance of any insured depository institution, including the Bank, if it determines after a hearing that the institution has engaged or is engaging in unsafe or unsound practices, is in an unsafe or unsound condition to continue operations, or has violated any applicable law, regulation, order or any condition imposed by an agreement with the FDIC. It also may suspend deposit insurance temporarily during the hearing process for the permanent termination of insurance, if the institution has no tangible capital. If insurance of accounts is terminated, the accounts at the institution at the time of the termination, less subsequent withdrawals, shall continue to be insured for a period of six months to two years, as determined by the FDIC. Management is aware of no existing circumstances which would result in termination of the Bank's deposit insurance.
REGULATORY CAPITAL REQUIREMENTS. Federally-insured savings associations are subject to three capital requirements of general applicability: a tangible capital requirement, a core or leverage capital requirement and a risk-based capital requirement. All savings associations currently are required to maintain tangible capital of at least 1.5% of adjusted total assets (as defined in the regulations), core capital equal to 3% of adjusted total assets and total capital (a combination of core and supplementary capital) equal to 8% of risk-weighted assets (as defined in the regulations). For purposes of the regulation, tangible capital is core capital less all intangibles other than qualifying purchased mortgage servicing rights. Core capital includes common stockholders' equity, non-cumulative perpetual preferred stock and related surplus, minority interests in the equity accounts of fully consolidated subsidiaries and certain nonwithdrawable accounts and pledged deposits. Core capital generally is reduced by the amount of a savings association's intangible assets, other than qualifying mortgage servicing rights.
A savings association is allowed to include both core capital and supplementary capital in the calculation of its total capital for purposes of the risk-based capital requirements, provided that the amount of supplementary capital included does not exceed the savings association's core capital. Supplementary capital consists of certain capital instruments that do not qualify as core capital, including subordinated debt (such as the Bank's Debentures) which meets specified requirements, and general
14

valuation loan and lease loss allowances up to a maximum of 1.25% of risk-weighted assets. In determining the required amount of risk-based capital, total assets, including certain off-balance sheet items, are multiplied by a risk weight based on the risks inherent in the type of assets. The risk weights assigned by the OTS for principal categories of assets currently range from 0% to 100%, depending on the type of asset.
OTS policy imposes a limitation on the amount of net deferred tax assets that may be included in regulatory capital. (Net deferred tax assets represent deferred tax assets, reduced by any valuation allowances, in excess of deferred tax liabilities.) Application of the limit depends on the possible sources of taxable income available to an institution to realize deferred tax assets. Deferred tax assets that can be realized from the following generally are not limited: taxes paid in prior carryback years and future reversals of existing taxable temporary differences. To the extent that the realization of deferred tax assets depends on an institution's future taxable income (exclusive of reversing temporary differences and carryforwards), or its tax-planning strategies, such deferred tax assets are limited for regulatory capital purposes to the lesser of the amount that can be realized within one year of the quarter-end report date or 10% of core capital.
In August 1993, the OTS adopted a final rule incorporating an interest-rate risk component into the risk-based capital regulation. Under the rule, an institution with a greater than "normal" level of interest rate risk will be subject to a deduction of its interest rate risk component from total capital for purposes of determining whether it has met the risk-based capital requirement. As a result, such an institution will be required to maintain additional capital in order to comply with the risk-based capital requirement. Although the final rule was originally scheduled to be effective as of January 1994, the OTS has indicated that it will delay invoking its interest rate risk rule until appeal procedures are implemented and evaluated. The OTS has not yet established an effective date for the capital deduction. Management of the Company does not believe that the adoption of an interest rate risk component to the risk-based capital requirement will adversely affect the Bank if it becomes effective in its current form.
Effective April 1, 1999, the OTS minimum core capital ratio provides that only those institutions with Uniform Financial Institution Rating System ("UFIRS") rating of "1" are subject to a 3% minimum core capital ratio. All other institutions are subject to a 4% minimum core capital ratio. The 3% minimum core capital ratio currently applies to all federal savings associations.
CLASSIFIED ASSETS. OTS regulations require that each insured savings association classify its assets on a regular basis. In addition, in connection with examinations of insured associations, OTS examiners have authority to identify problem assets and, if appropriate, require them to be classified. There are three classifications for problem assets: "substandard," "doubtful" and "loss." Substandard assets have one or more defined weaknesses and are characterized by the distinct possibility that the insured institution will sustain some loss if the deficiencies are not corrected. Doubtful assets have the weaknesses of substandard assets with the additional characteristic that the weaknesses make collection or liquidation in full on the basis of currently existing facts, conditions and values questionable, and there is a high possibility of loss. An asset classified as a loss is considered uncollectible and of such little value that continuance as an asset of the institution is not warranted. Another category designated "special mention" also must be established and maintained for assets which do not currently expose an insured institution to a sufficient degree of risk to warrant classification as substandard, doubtful or loss but do possess credit deficiencies or potential weaknesses deserving management's close attention. Assets classified as substandard or doubtful require the institution to establish general allowances for loan losses. If an asset or portion thereof is classified as a loss, the insured institution must either establish specific allowances for loan losses in the amount of 100% of the portion of the asset classified as a loss or charge off such amount. In this regard, the Company establishes required reserves and charges off loss assets as soon as administratively practicable. General loss allowances established to cover possible losses related to assets classified substandard or doubtful may be included in determining an institution's regulatory capital, while specific valuation allowances for loan losses do not qualify as regulatory capital.
In 1996, based upon discussions with the OTS and as a result of an OTS bulletin issued on December 13, 1996 entitled "Guidance on the Classification and Regulatory Reporting of Certain Delinquent Loans and Other Credit Impaired Assets," the Company has classified all discount loans that are 90 or more days contractually past due, not otherwise classified, as special mention and all real estate owned, not otherwise classified, as special mention. The Company also modified its policy for classifying nonperforming discount loans and real estate owned related to its discount loan portfolio ("nonperforming discount assets") to take into account both the holding period of such assets from the date of acquisition and the ratio of book value to market value of such assets. All nonperforming discount assets which are held 15 months or more after the date of acquisition are classified substandard; nonperforming discount assets held 12 months to less than 15 months from the date of acquisition are classified as substandard if a ratio of book value to market value is 80% or more; and nonperforming discount assets held less than
15

12 months from the date of acquisition are classified as substandard if they have a ratio of book value to market value of more than 85%. In addition, nonperforming discount assets which are performing for a period of time subsequent to acquisition by the Company are classified as substandard at the time such loans become nonperforming. The Company also modified its classified assets policy to classify all real estate owned which is not generating a cash flow and which has been held for more than 15 months and three years as substandard and doubtful, respectively. The Company's past experience indicates that classified discount assets do not necessarily correlate to probability or severity of loss.
Excluding assets which have been classified loss and fully reserved by the Bank, the Bank's classified assets at December 31, 1999 under the above policy consisted of $217.4 million of assets classified as substandard and $7.8 million of assets classified as doubtful. In addition, at the same date, $479.4 million of assets were designated as special mention.
Substandard assets at December 31, 1999 under the above policy consisted primarily of $118.6 million of loans and real estate owned related to the Company's discount single family residential loan program and $58.0 million of loans and real estate owned related to the Company's discount commercial real estate loan program. Special mention assets at December 31, 1999 under the policy consisted primarily of $384.1 million and $77.1 million of loans and real estate owned related to the Company's discount single family residential and discount commercial real estate loan programs, respectively.
PROMPT CORRECTIVE ACTION. Federal law provides the Federal banking regulators with broad power to take "prompt corrective action" to resolve the problems of undercapitalized institutions. The extent of the regulators' powers depends on whether the institution in question is "well capitalized," "adequately capitalized," "undercapitalized," "significantly undercapitalized" or "critically undercapitalized." Under regulations adopted by the Federal banking regulators, an institution shall be deemed to be: (i) "well capitalized" if it has a total risk-based capital ratio of 10.0% or more, has a Tier 1 risk-based capital ratio of 6.0% or more, has a Tier 1 leverage capital ratio of 5.0% or more and is not subject to specified requirements to meet and maintain a specific capital level for any capital measure; (ii) "adequately capitalized" if it has a total risk-based capital ratio of 8.0% or more, a Tier 1 risk-based capital ratio of 4.0% or more and a Tier 1 leverage capital ratio of 4.0% or more (3.0% under certain circumstances) and does not meet the definition of "well capitalized"; (iii) "undercapitalized" if it has a total risk-based capital ratio that is less than 8.0%, a Tier 1 risk-based capital ratio that is less than 4.0% or a Tier 1 leverage capital ratio that is less than 4.0% (3.0% under certain circumstances); (iv) "significantly undercapitalized" if it has a total risk-based capital ratio that is less than 6.0%, a Tier 1 risk-based capital ratio that is less than 3.0% or a Tier 1 leverage capital ratio that is less than 3.0% and; (v) "critically undercapitalized" if it has a ratio of tangible equity to adjusted total assets that is equal to or less than 2.0%. The regulations also permit the appropriate Federal banking regulator to downgrade an institution to the next lower category (provided that a significantly undercapitalized institution may not be downgraded to critically undercapitalized) if the regulator determines: (i) after notice and opportunity for hearing or response, that the institution is in an unsafe or unsound condition or (ii) that the institution has received (and not corrected) a less-than-satisfactory rating for any of the categories of asset quality, management, earnings or liquidity in its most recent exam. At December 31, 1999, the Bank was a "well capitalized" institution under the prompt corrective action regulations of the OTS.
Depending upon the capital category to which an institution is assigned, the regulators' corrective powers, many of which are mandatory in certain circumstances, include: prohibition on capital distributions; prohibition on payment of management fees to controlling persons; requiring the submission of a capital restoration plan; placing limits on asset growth; limiting acquisitions, branching or new lines of business; requiring the institution to issue additional capital stock (including additional voting stock) or to be acquired; restricting transactions with affiliates; restricting the interest rates that the institution may pay on deposits; ordering a new election of directors of the institution; requiring that senior executive officers or directors be dismissed; prohibiting the institution from accepting deposits from correspondent banks; requiring the institution to divest certain subsidiaries; prohibiting the payment of principal or interest on subordinated debt; and, ultimately, appointing a receiver for the institution.
QUALIFIED THRIFT LENDER TEST. All savings associations are required to meet the QTL test set forth in the HOLA to avoid certain restrictions on their operations. Under the QTL test provisions, a savings institution must maintain at least 65% of its portfolio assets in qualified thrift investments. In general, qualified thrift investments include loans, securities and other investments that are related to housing, small business and credit card lending, and to a more limited extent, consumer lending and community service purposes. Portfolio assets are defined as an institution's total assets less goodwill and other intangible assets, the institution's business property and a limited amount of the institution's liquid assets. A savings association that does not
16

meet the QTL test set forth in the HOLA and implementing regulations must either convert to a bank charter or comply with the following restrictions on its operations: (i) the association may not engage in any new activity or make any new investment, directly or indirectly, unless such activity or investment is permissible for a national bank; (ii) the branching powers of the association shall be restricted to those of a national bank; (iii) the association shall not be eligible to obtain any advances from its FHLB; and (iv) payment of dividends by the association shall be subject to the rules regarding payment of dividends by a national bank. Upon the expiration of three years from the date the association ceases to be a QTL, it must cease any activity and not retain any investment not permissible for a national bank and immediately repay any outstanding FHLB advances (subject to safety and soundness considerations). The Bank met the QTL test throughout 1999, and its qualified thrift investments comprised 68.83% of its portfolio assets at December 31, 1999.
RESTRICTIONS ON CAPITAL DISTRIBUTIONS. Prior to amendments which became effective April 1, 1999 (see below), the OTS regulation governing capital distributions by savings associations, which included cash dividends, stock redemptions or repurchases, cash-out mergers, interest payments on certain convertible debt and other transactions charged to the capital account of a savings association as a capital distribution, created three tiers of associations for capital distribution purposes. These three tiers were based on regulatory capital, with the top two tiers providing a safe harbor for specified levels of capital distributions from associations so long as such associations notified the OTS and received no objection to the distribution from the OTS. Associations that did not qualify for the safe harbor provided for the top two tiers of associations were required to obtain prior OTS approval before making any capital distributions.
Tier 1 associations could make the highest amount of capital distributions, and were defined as savings associations that, before and after the proposed distribution, met or exceeded their fully phased-in regulatory capital requirements. Tier 1 associations were permitted to make capital distributions during any calendar year equal to the greater of: (i) 100% of net income for the calendar year-to-date plus 50% of its "surplus capital ratio" at the beginning of the calendar year; and (ii) 75% of its net income over the most recent four-quarter period. The "surplus capital ratio" is defined to mean the percentage by which the association's ratio of total capital to assets exceeds the ratio of its fully phased-in capital requirement to assets, and "fully phased-in capital requirement" is defined to mean an association's capital requirement under the statutory and regulatory standards applicable on December 31, 1994, as modified to reflect any applicable individual minimum capital requirement imposed upon the association.
The OTS amended its capital distribution regulation effective April 1, 1999. Under the revised regulation, the Bank is required to file a notice with the OTS at least 30 days prior to making a capital distribution unless (a) it is not eligible for expedited treatment under the OTS application processing regulations, (b) the total amount of the Bank's capital distributions (including the proposed distribution) for the calendar year exceeds the Bank's net income for the year to date plus retained net income for the previous two years, (c) the Bank would not be "adequately capitalized" following the proposed distribution or (d) the proposed distribution would violate any applicable statute, regulation, or an agreement between the Bank and the OTS, or a condition imposed upon the Bank by an OTS-approved application or notice. If one of these four criteria is present, the Bank is required to file an application with the OTS at least 30 days prior to making the proposed capital distribution. The OTS may deny the Bank's application or disapprove its notice if the OTS determines that (a) the Bank will be "undercapitalized," "significantly undercapitalized" or "critically under capitalized," as defined in the OTS capital regulations, following the capital distribution, (b) the proposed capital distribution raises safety and soundness concerns or (c) the proposed capital distribution violates a prohibition contained in any statute, regulation or agreement between the Bank and the OTS or a condition imposed on the Bank in an application or notice approved by the OTS.
The new rule also amends the definition of "capital distribution" to include any payment to repurchase, redeem, retire, or otherwise acquire debt instruments included in total risk-based capital.
LOAN-TO-ONE BORROWER. Under applicable laws and regulations, the amount of loans and extensions of credit which may be extended by a savings institution such as the Bank to any one borrower, including related entities, generally may not exceed the greater of $500,000 or 15% of the unimpaired capital and unimpaired surplus of the institution. Loans in an amount equal to an additional 10% of unimpaired capital and unimpaired surplus also may be made to a borrower if the loans are fully secured by readily marketable securities. An institution's "unimpaired capital and unimpaired surplus" includes, among other things, the amount of its core capital and supplementary capital included in its total capital under OTS regulations.
At December 31, 1999, the Bank's unimpaired capital and surplus amounted to $332.8 million, resulting in a general loans-to-one borrower limitation of $49.9 million under applicable laws and regulations.
17

BROKERED DEPOSITS. Under applicable laws and regulations, an insured depository institution may be restricted in obtaining, directly or indirectly, funds by or through any "deposit broker," as defined, for deposit into one or more deposit accounts at the institution. The term "deposit broker" generally includes any person engaged in the business of placing deposits, or facilitating the placement of deposits, of third parties with insured depository institutions or the business of placing deposits with insured depository institutions for the purpose of selling interests in those deposits to third parties. In addition, the term "deposit broker" includes any insured depository institution, and any employee of any insured depository institution, which engages, directly or indirectly, in the solicitation of deposits by offering rates of interest (with respect to such deposits) which are significantly higher than the prevailing rates of interest on deposits offered by other insured depository institutions having the same type of charter in such depository institution's normal market area. As a result of the definition of "deposit broker," all of the Bank's brokered deposits, as well as possibly its deposits obtained through customers of regional and local investment banking firms and the deposits obtained from the Bank's direct solicitation efforts of institutional investors and high net worth individuals, are potentially subject to the restrictions described below. Under FDIC regulations, well-capitalized institutions are not subject to the brokered deposit limitations, while adequately capitalized institutions are able to accept, renew or roll over brokered deposits only: (i) with a waiver from the FDIC; and (ii) subject to the limitation that they do not pay an effective yield on any such deposit which exceeds by more than (a) 75 basis points, the effective yield paid on deposits of comparable size and maturity in such institution's normal market area for deposits accepted in its normal market area or (b) 120% for retail deposits and 130% for wholesale deposits, respectively, of the current yield on comparable maturity U.S. Treasury obligations for deposits accepted outside the institution's normal market area. Undercapitalized institutions are not permitted to accept brokered deposits and may not solicit deposits by offering an effective yield that exceeds by more than 75 basis points the prevailing effective yields on insured deposits of comparable maturity in the institution's normal market area or in the market area in which such deposits are being solicited. At December 31, 1999, the Bank was a well-capitalized institution which was not subject to restrictions on brokered deposits. See "Sources of Funds - Deposits."
LIQUIDITY REQUIREMENTS. All savings associations are required to maintain an average daily balance of liquid assets, which include specified short-term assets and certain long-term assets, equal to a certain percentage of the sum of its average daily balance of net withdrawable deposit accounts and borrowings payable in one year or less. The liquidity requirement may vary from time to time (between 4% and 10%) depending upon economic conditions and savings flows of all savings associations. In November 1997, the OTS amended its liquidity regulations to, among other things, provide that a savings association shall maintain liquid assets of not less than 4% of the amount of its liquidity base at the end of the preceding calendar quarter as well as to provide that each savings association must maintain sufficient liquidity to ensure its safe and sound operation. Prior to November 1997, the required liquid asset ratio was 5%. Historically, the Bank has operated in compliance with these requirements.
AFFILIATE TRANSACTIONS. Under federal law and regulation, transactions between a savings association and its affiliates are subject to quantitative and qualitative restrictions. Affiliates of a savings association include, among other entities, companies that control, are controlled by or are under common control with the savings association. As a result, the Company, OAC and the Company's non-bank subsidiaries are affiliates of the Bank.
Savings associations are restricted in their ability to engage in "covered transactions" with their affiliates. In addition, covered transactions between a savings association and an affiliate, as well as certain other transactions with or benefiting an affiliate, must be on terms and conditions at least as favorable to the savings association as those prevailing at the time for comparable transactions with non-affiliated companies. Savings associations are required to make and retain detailed records of transactions with affiliates.
Notwithstanding the foregoing, a savings association is not permitted to make a loan or extension of credit to any affiliate unless the affiliate is engaged only in activities the Federal Reserve Board has determined to be permissible for bank holding companies. Savings associations also are prohibited from purchasing or investing in securities issued by an affiliate, other than shares of a subsidiary.
Savings associations are also subject to various limitations and reporting requirements on loans to insiders. These limitations require, among other things, that all loans or extensions of credit to insiders (generally executive officers, directors or 10% stockholders of the institution) or their "related interests" be made on substantially the same terms (including interest rates and collateral) as, and follow credit underwriting procedures that are not less stringent than, those prevailing for comparable transactions with the general public and not involve more than the normal risk of repayment or present other unfavorable features.
18

COMMUNITY INVESTMENT AND CONSUMER PROTECTIONS LAWS. In connection with its lending activities, the Bank is subject to a variety of federal laws designed to protect borrowers and promote lending to various sectors of the economy and population. Included among these are the Federal Home Mortgage Disclosure Act, Real Estate Settlement Procedures Act, Truth-in-Lending Act, Equal Credit Opportunity Act, Fair Credit Reporting Act and the Community Reinvestment Act.
SAFETY AND SOUNDNESS. Other regulations include: (i) real estate lending standards for insured institutions, which provide guidelines concerning loan-to-value ratios for various types of real estate loans; (ii) risk-based capital rules to account for interest rate risk, concentration of credit risk and the risks posed by "non-traditional activities;" (iii) rules requiring depository institutions to develop and implement internal procedures to evaluate and control credit and settlement exposure to their correspondent banks; and (iv) rules addressing various "safety and soundness" issues, including operations and managerial standards, standards for asset quality, earnings and stock valuations, and compensation standards for the officers, directors, employees and principal stockholders of the insured institution.
FEDERAL TAXATION
GENERAL. The Company and all of its domestic subsidiaries currently file, and expect to continue to file, a consolidated Federal income tax return based on a calendar year. Ocwen UK, a foreign subsidiary previously owned by the Company, was not included in the consolidated federal income tax return, but filed its own tax return in the UK. Consolidated returns have the effect of eliminating inter-company transactions, including dividends, from the computation of taxable income.
ALTERNATIVE MINIMUM TAX. In addition to the regular corporate income tax, corporations, including qualifying savings institutions, are subject to an alternative minimum tax. The 20% tax is computed on Alternative Minimum Taxable Income ("AMTI") and applies if it exceeds the regular tax liability. AMTI is equal to regular taxable income with certain adjustments. For taxable years beginning after 1989, AMTI includes an adjustment for 75% of the excess of "adjusted current earnings" over regular taxable income. Net operating loss carrybacks and carryforwards are permitted to offset only 90% of AMTI. Alternative minimum tax paid can be credited against regular tax due in later years.
TAX RESIDUALS. From time to time, the Company acquires Real Estate Mortgage Investment Conduit ("REMIC") residuals or retains residual securities in REMICs which were formed by the Company in connection with the securitization and sale of loans. Although a tax residual may have little or no future economic cash flows from the REMIC from which it has been issued, the tax residual does bear the income tax liability or benefit resulting from the difference between the interest rate paid on the securities by the REMIC and the interest rate received on the mortgage loans held by the REMIC. This generally results in taxable income for the Company in the first several years of the REMIC and equal amounts of tax deductions thereafter. The Company receives cash payments in connection with the acquisition of tax residuals to compensate the Company for the time value of money associated with the tax payments related to these securities and the costs of modeling, recording, monitoring and reporting the securities. The Company defers all fees received and recognizes such fees in interest income on a level yield basis over the expected life of the deferred tax asset related to tax residuals. The Company also adjusts the recognition in interest income of fees deferred based upon the changes in the actual prepayment rates of the underlying mortgages held by the REMIC and periodic reassessments of the expected life of the deferred tax asset related to tax residuals. At December 31, 1999, the Company's gross deferred tax assets included $2.4 million which was attributable to the Company's tax residuals and related deferred income.
INVESTMENTS IN LOW-INCOME HOUSING TAX CREDIT INTERESTS. For a discussion of the tax effects of investments in low-income housing tax credit interests, see "Segments-Investment in Low-Income Housing Tax Credit Interests."
EXAMINATIONS. The most recent examination by the IRS of the Company's Federal income tax return was of the tax return filed for 1996. The statute of limitations has run with respect to 1995 and all prior tax years. Thus, the Federal income tax returns for the years 1996 through 1998 are open for examination. Management of the Company does not anticipate any material adjustments as a result of any examination, although there can be no assurances in this regard.
19

STATE TAXATION
The Company's income is subject to tax by the States of Florida and California, which have statutory tax rates of 5.5% and 10.84%, respectively, and is determined based on certain apportionment factors. The Company is taxed in New Jersey on income, net of expenses, earned in New Jersey at a statutory rate of 3.0%. No state return of the Company has been examined, and no notification has been received by the Company that any state intends to examine any of the Company's tax returns.
20

ITEM 2. PROPERTIES
The following table sets forth information relating to the Company's facilities at December 31, 1999.
OAC does not maintain an office. It relies on the facilities provided by the Company.
ITEM 3. LEGAL PROCEEDINGS
The Company is subject to various pending legal proceedings. Management is of the opinion that the resolution of these claims will not have a material adverse effect on the results of operations or financial condition of the Company. See "Note 30: Commitments and Contingencies" on page 115 of the Company's Annual Report to Shareholders which is incorporated herein by reference.
ITEM 4. SUBMISSION OF MATTERS TO A VOTE OF SECURITY HOLDERS
On October 7, 1999 a special meeting of shareholders of Ocwen Financial Corporation was held to vote on a proposal to acquire OAC, which was approved. The results of the vote were 48,558,971 votes for, 23,483 votes against and 8 votes abstaining. Because more than 50% of the shares entitled to vote on the proposal were so voted, broker nonvotes could not have elected to vote and thus were not recorded.
21
Net Book Value of Property or Leasehold Location Owned/ Leased Improvements -------------------------------------- ------ ------ ----------------- (Dol lars in Thousands) EXECUTIVE OFFICES: 1675 Palm Beach Lakes Boulevard West Palm Beach, FL................ Lea sed $ 5,376 MAIN OFFICE: 2400 Lemoine Ave Fort Lee, NJ....................... Lea sed $ 15 SERVICING CENTER: 12650 Ingenuity Drive Orlando, FL........................ Own ed $23,021 OTX OFFICES: Main office: 1675 Palm Beach Lakes Boulevard West Palm Beach, FL............... Lea sed $ 45 DTS Communications, Inc: 5050 Avenida Encinas, Suite 200. Carlsbad, CA...................... Lea sed $ 123 Amos, Inc.: 10 Research Parkway Wallingford, CT................... Lea sed $ 104 Synergy Software, LLC: 109 Westpark Drive. Brentwood, TN..................... Lea sed $ 9

PART II
ITEM 5. MARKET FOR THE REGISTRANT'S COMMON EQUITY A ND RELATED STOCKHOLDER MATTERS
Information required by this Item appears under the caption "Shareholder Information" on page 119 of the Annual Report to Shareholders and is incorporated herein by reference.
ITEM 6. SELECTED CONSOLIDATED FINANCIAL DATA
Information required by this Item appears under the caption "Selected Consolidated Financial Information" on pages 18 to 20 of the Annual Report to Shareholders and is incorporated herein by reference.
ITEM 7. MANAGEMENT'S DISCUSSION AND ANALYSIS OF FIN ANCIAL CONDITION AND RESULTS OF OPERATIONS
Information required by this Item appears under the caption "Management's Discussion and Analysis of Financial Condition and Results of Operations" on pages 21 to 63 of the Annual Report to Shareholders and is incorporated herein by reference. In addition, please also note the information below.
RECENT DEVELOPMENTS
On January 4, 2000 the Company repurchased in the open market $20.0 million of its 11.5% Redeemable Notes for a $3.2 million pre tax gain. The Notes are due in 2005 and had an outstanding balance of $140.5 million at December 31, 1999.
On January 18, 2000 the Company acquired 44 commercial discount loans for a cost of $167.6 million. The portfolio includes both performing and non-performing loans.
On February 3, 2000 the Company sold a commercial mortgage-backed security for net proceeds of $40.9 million, resulting in a pre tax gain of $2.8 million.
For the period from January 1, 2000 through March 22, 2000, the Company repurchased 1.4 million shares of its common stock at an average price of $6.48 per share. To date, the Company has repurchased 6.0 million shares, the maximum amount authorized under its stock repurchase program, at an average price of $6.61 per share.
On March 24, 2000 the Company announced that it had retained Grubb & Ellis to exclusively market and sell its portfolio of office buildings located in San Francisco. This portfolio consists of four properties which total approximately 900,000 square feet.
ITEM 7A. QUANTITATIVE AND QUALITATIVE DISCLOSURES A BOUT MARKET RISK
Information required by this Item appears under the captions "Asset and Liability Management" on pages 55 to 60, "Note 1: Summary of Significant Accounting Policies" on pages 72 to 78 and "Note 22: Derivative Financial Instruments" on pages 101 to 104 of the Annual Report to Shareholders and is incorporated herein by reference.
ITEM 8. FINANCIAL STATEMENTS AND SUPPLEMENTARY DATA
Information required by this Item appears on pages 65 to 118 in the Annual Report to Shareholders and is incorporated herein by reference.
22

ITEM 9. CHANGES IN AND DISAGREEMENTS WITH ACCOUNTAN TS ON ACCOUNTING AND FINANCIAL DISCLOSURE
None.
PART III
ITEM 10. DIRECTORS AND EXECUTIVE OFFICERS OF THE RE GISTRANT
The information contained in the Company's definitive Proxy Statement with respect to the Company's Annual Meeting of Shareholders to be held on May 16, 2000, and as filed with the Commission on or about March 30, 2000 (the "Company's 2000 Proxy Statement") under the captions "Election of Directors - Nominees for Director," "Executive Officers Who Are Not Directors," and "Security Ownership of Certain Beneficial Owners - Section 16(a) Beneficial Ownership Reporting Compliance" is incorporated herein by reference.
ITEM 11. EXECUTIVE COMPENSATION
The information contained in the Company's 2000 Proxy Statement under the captions "Executive Compensation," "Board of Directors Compensation" and "Performance Graph" is incorporated herein by reference.
ITEM 12. SECURITY OWNERSHIP OF CERTAIN BENEFICIAL O WNERS AND MANAGEMENT
The information contained in the Company's 2000 Proxy Statement under the caption "Security Ownership of Certain Beneficial Owners - Beneficial Ownership of Common Stock" is incorporated herein by reference.
ITEM 13. CERTAIN RELATIONSHIPS AND RELATED TRANSACT IONS
The information contained in the Company's 2000 Proxy Statement under the caption "Certain Relationships and Related Transactions" is incorporated herein by reference.
23

PART IV
ITEM 14. EXHIBITS, FINANCIAL STATEMENT SCHEDULES, A ND REPORTS ON FORM 8-K
(a) EXHIBITS.
(1) Incorporated by reference from the similarly described exhibit filed in connection with the Registrant's Registration Statement on Form S-1 (File No. 333-5153) as amended, declared effective by the commission on September 25, 1996.
(2) Incorporated by reference from the similarly described exhibit included with the Registrant's Annual Report on Form 10-K for the year ended December 31, 1998
(3) Incorporated by reference from the similarly described exhibit filed in connection with the Company's Registration Statement on Form S-1 (File No. 333-28889), as amended, declared effective by the Commission on August 6, 1997.
(4) Incorporated by reference from similarly described exhibit included with Registrant's Quarterly Report on Form 10-Q for the quarter ended
3.1 Amended and Restated Articles of Incorporat ion (1) 3.2 Amended and Restated Bylaws (2) 4.0 Form of Certificate of Common Stock (1) 4.1 Form of Indenture between the Company and B ank One, Columbus, NA as Trustee (1) 4.2 Form of Note due 2003 (included in Exhibit 4.1) (1) 4.3 Certificate of Trust of Ocwen Capital Trust I (3) 4.4 Amended and Restated Declaration of Trust o f Ocwen Capital Trust I (3) 4.5 Form of Capital Security of Ocwen Capital T rust I (4) 4.6 Form of Indenture relating to 10 7/8% Junio r Subordinated Debentures due 2027 of the Company (3) 4.7 Form of 10 7/8% Junior Subordinated Debentu res due 2027 of the Company (4) 4.8 Form of Guarantee of the Company relating t o the Capital Securities of Ocwen Capital Trust I (3) 4.9 Form of Indenture between the Company and T he Bank of New York as Trustee (5) 4.10 Form of Subordinated Debentures due 2005 (5 ) 4.11 Form of Indenture between OAC and Norwest B ank Minnesota, National Association, as Trustee thereunder for the 11.5% Redeemable Notes due 2005 (6) 10.1 Ocwen Financial Corporation 1991 Non-Qualif ied Stock Option Plan, as amended (7) 10.2 Ocwen Financial Corporation 1996 Stock Plan for Directors, as amended (8) 10.3 Ocwen Financial Corporation 1998 Annual Inc entive Plan (8) 10.4 Ocwen Financial Corporation Long-Term Incen tive Plan (8) 10.5 Loan Facility Agreement dated April 23, 199 9 among Ocwen Limited, National Westminster Bank plc and Ocwen Financial Corporation (9) 10.6 Agreement of Merger dated as of July 25, 19 99 among Ocwen Financial Corporation, Ocwen Asset Investm ent Corp. and Ocwen Acquisition Company (10) 10.7 Loan Agreement, dated as of April 7, 1998, between OAIC Bush Street, LLC and Salomon Brothers Realty Corp. (11) 10.8 Loan Agreement, dated as of April 24, 1998, between OAC and Greenwich Financial Products Inc. (12) 10.9 Amended and Restated Loan Agreement, dated as of June 10, 1998, by and among, inter alia, OAIC California Part nership, L.P., OAIC California partnership II, L.P., Salomon Br others Realty Corp. and LaSalle National Bank (12) 10.10 Compensation and Indemnification Agreement, dated as of May 6, 1999, between OAC and the independent committee o f the Board of Directors (13) 10.11 Second Amendment to Guarantee of Payment, d ated as of July 9, 1999, made by and between Salomon Brothers Realty Corp. and Ocwen Partnership, L.P. (13) 10.12 Indemnity agreement, dated August 24, 1999, among OCN, and OAC's directors (13) 11.1 Computation of earnings per share (14) 12.1 Ratio of earnings to fixed charges (filed h erewith) 13.1 Excerpts from the Annual Report to Sharehol ders for the year ended December 31, 1999 (filed herewit h) 21.0 Subsidiaries (filed herewith) 23.0 Consent of PricewaterhouseCoopers LLP (file d herewith) 27.1 Financial Data Schedule for the year ended December 31, 1999 (filed herewith) 99.1 Risk factors (filed herewith)

September 30, 1997.
(5) Incorporated by reference from the similarly described exhibit filed in connection with Amendment No. 2 to Offering Circular on Form OC (on Form S-1) filed on June 7, 1995.
(6) Incorporated by reference from OAC's Registration Statement on Form S-4 (File No. 333-64047), as amended, as declared effective by the Commission on February 12, 1999.
(7) Incorporated by reference from the similarly described exhibit filed in connection with the Registrant's Registration .
24

Statement on Form S-8 ( File No. 333-44999), effective when filed with the Commission on January 28, 1998.
(8) Incorporated by reference from the similarly described exhibit to the Company's definitive Proxy Statement with respect to the Company's 1998 Annual Meeting of Shareholders as filed with the Commission on March 31, 1998.
(9) Incorporated by reference from the similarly described exhibit filed in connection with the Registrant's Quarterly Report on Form 10Q for the quarter ended June 30, 1999.
(10) Incorporated by reference from the similarly described exhibit included with the Registrant's current report on Form 8-K filed with the Commission on July 26, 1999.
(11) Incorporated by reference from OAC's Quarterly Report on Form 10-Q for the quarterly period ended June 30, 1998.
(12) Incorporated by reference from the Current Report on Form 8-K filed by OAC with the Commission on April 23, 1998.
(13) Incorporated by reference from OAC's Quarterly Report on Form 10-Q for the quarterly period ended September 30, 1999.
(14) Incorporated by reference from "Note 21: Basic and Diluted Earnings per Share" on pages 100 to 101 of the Annual Report to Shareholders.
FINANCIAL STATEMENTS AND SCHEDULES. The following Consolidated Financial Statements of Ocwen Financial Corporation and Report of PricewaterhouseCoopers LLP, Independent Certified Public Accountants, are incorporated herein by reference from pages 65 to 118 of the Annual Report to Shareholders:
Report of Independent Certified Public Accountants
Consolidated Statements of Financial Condition at December 31, 1999 and 1998
Consolidated Statements of Operations for each of the three years in the period ended December 31, 1999
Consolidated Statements of Changes in Shareholders' Equity for each of the three years in the period ended December 31, 1999
Consolidated statements of Comprehensive Income for each of the three years in the period ended December 31, 1999
Consolidated Statements of Cash Flows for each of the three years in the period ended December 31, 1999
Notes to Consolidated Financial Statements
Financial statement schedules have been omitted because they are not applicable or the required information is shown in the Consolidated Financial Statements or notes thereto.
(b) REPORTS ON FORM 8-K FILED DURING THE QUARTER ENDED DECEMBER 31, 1999
(1) A Form 8-K was filed by the Company on October 1, 1999 which contained a news release announcing the sale of Ocwen UK, its estimated 1999 third quarter results and certain other information.
(2) A Form 8-K was filed by the Company on October 7, 1999 which contained a news release announcing its acquisition of OAC and information regarding its stock repurchase program.
(3) A Form 8-K was filed on October 15, 1999 which contained the pro forma financial information required as a result of the sale of Ocwen UK.
(4) A Form 8-K was filed by the Company on November 12, 1999 which contained a news release announcing the Company's financial results for the three and nine months ended September 30, 1999, and certain other information.
25

SIGNATURES
Pursuant to the requirements of Section 13 or 15(d) of the Securities Exchange Act of 1934, as amended, the Registrant has duly caused this report to be signed on its behalf by the undersigned, thereunto duly authorized.
OCWEN FINANCIAL CORPORATION
Pursuant to the requirements of the Securities Exchange Act of 1934, as amended, this Report has been signed below by the following persons on behalf of the registrant and in the capacities and on the dates indicated:
BY: /s/ WILLIAM C. ERBEY ------------------------------------ William C. Erbey Chairman of the Board and Chief Executive Officer (duly authorized representative) Date: March 30, 2000
/s/ WILLIAM C. ERBEY Date: March 30, 2000 -------------------------------------------------- William C. Erbey, Chairman of the Board and Chief Executive Officer (principal executive officer) /s/ BARRY N. WISH Date: March 30, 2000 -------------------------------------------------- Barry N. Wish, Director /s/ W. C. MARTIN Date: March 30, 2000 -------------------------------------------------- W.C. Martin, Director /s/ HOWARD H. SIMON Date: March 30, 2000 -------------------------------------------------- Howard H. Simon, Director /s/ HON. THOMAS F. LEWIS Date: March 30, 2000 -------------------------------------------------- Hon. Thomas F. Lewis, Director /s/ MARK S. ZEIDMAN Date: March 30, 2000 -------------------------------------------------- Mark S. Zeidman, Senior Vice President and Chief Financial Officer (principal financial officer) /s/ ROBERT J. LEIST, JR. Date: March 30, 2000 -------------------------------------------------- Robert J. Leist, Jr., Vice President and Chief Accounting Officer (principal accounting officer)

(1) Earnings represents pre-tax income from continuing operations before extraordinary gain, adjusted for losses and undistributed income of equity investees.
(2) Fixed charges represent total interest expensed and capitalized, including and excluding interest on deposits, amortization of capitalized debt expenses, as well as the interest component of rental expense.
(3) The ratios of earnings to fixed charges were computed by dividing (x) income from continuing operations before income taxes and extraordinary gains, adjusted for losses and undistributed income of equity investees plus fixed charges by (y) fixed charges.
Exhibit 12.1 OCWEN FINANCIAL CORPORATION AND SUBSIDIARIES COMP UTATION OF EARNINGS TO FIXED CHARGES (DOLLARS IN THOUSANDS) 1999 1998 1997 1996 1995 --------- --------- --------- --- ------ --------- Earnings: Income (loss) from continuing operations before income taxes (1) and extraordinary gain $ 23,973 $ (32,805) $ 99,538 $ 61,301 $ 37,701 Add: Fixed charges (2) 173,167 203,315 167,165 1 17,455 84,626 --------- --------- --------- --- ------ --------- Earnings for computation purposes $ 197,140 $ 170,510 $ 266,703 $ 1 78,756 $ 122,327 Ratio of earnings to fixed charges: Including interest on deposits (3) 1.13 0.83 1.58 1.52 1.45 Excluding interest on deposits (3) 1.33 0.62 3.39 3.68 3.95

FINANCIAL TABLE OF CONTENTS
17
SELECTED CONSOLIDATED FINANCIAL INFORMATION ....... ......................... 18 MANAGEMENT'S DISCUSSION AND ANALYSIS OF FINANCIAL CONDITION AND RESULTS OF OPERATIONS ... ......................... 21 REPORT OF MANAGEMENT .............................. ......................... 64 REPORT OF INDEPENDENT CERTIFIED PUBLIC ACCOUNTANTS ......................... 65 CONSOLIDATED FINANCIAL STATEMENTS ................. ......................... 66 SHAREHOLDER INFORMATION ........................... ........................ 119

SELECTED CONSOLIDATED FINANCIAL INFORMATION
The following tables present selected consolidated financial information of Ocwen Financial Corporation and its subsidiaries ("OCN" or the "Company") at the dates and for the periods indicated. The historical operations and balance sheet data at and for the years ended December 31, 1999, 1998, 1997, 1996, and 1995, have been derived from financial statements audited by PricewaterhouseCoopers LLP, independent certified public accountants. The selected consolidated financial information should be read in conjunction with, and is qualified in its entirety by reference to, the information contained in the Consolidated Financial Statements and related notes set forth elsewhere herein.
18
For the Year Ended December 31, ---------------------------------- --------------------------- 1999 (1) 1998 1997 1996 1995 --------- --------- -------- - --------- --------- (Dollars in Thousands, e xcept per share data) OPERATIONS DATA: Interest income ................................... .............. $ 253,224 $ 307,694 $ 272,53 1 $ 193,894 $ 137,275 Interest expense .................................. .............. 155,542 184,893 156,28 9 116,160 84,060 --------- --------- -------- - --------- --------- Net interest income before provision for loan lo sses ......... 97,682 122,801 116,24 2 77,734 53,215 Provision for loan losses (2) ..................... .............. 6,710 18,509 32,21 8 22,450 1,082 --------- --------- -------- - --------- --------- Net interest income after provision for loan los ses .......... 90,972 104,292 84,02 4 55,284 52,133 --------- --------- -------- - --------- --------- Servicing fees and other charges .................. .............. 75,437 59,180 25,96 2 4,682 2,870 Gain on interest-earning assets, net (3) .......... .............. 44,298 129,988 82,21 2 21,682 6,916 Impairment charges on securities available for sale ............. (58,777) (129,714) - - -- -- Amortization of excess of net assets acquired over purchase price 3,201 -- - - -- -- Other income (4) .................................. .............. 81,560 53,729 15,77 5 10,939 21,147 --------- --------- -------- - --------- --------- Total non-interest income ...................... .............. 145,719 113,183 123,94 9 37,303 30,933 --------- --------- -------- - --------- --------- Compensation and employee benefits ................ .............. 102,173 115,556 77,57 3 39,043 29,913 Technology and communication costs ................ .............. 19,647 17,560 9,49 2 4,907 4,680 Other operating expenses .......................... .............. 74,325 95,146 39,80 9 25,656 10,819 --------- --------- -------- - --------- --------- Total non-interest expense ..................... .............. 196,145 228,262 126,87 4 69,606 45,412 --------- --------- -------- - --------- --------- Distributions on Company-obligated, mandatorily red eemable securities of subsidiary trust holding solely junior subordinated debentures 13,111 13,594 5,24 9 -- -- Equity in (losses) earnings of investment in unconsolidated entities (5) (12,616) (7,985) 23,68 8 38,320 -- Income tax (expense) benefit ...................... .............. (2,608) 30,699 (21,30 9) (11,159) (4,515) Minority interest in net loss of consolidated subsi diary ........ 638 467 70 3 -- -- --------- --------- -------- - --------- --------- Income (loss) from continuing operations .......... .............. 12,849 (1,200) 78,93 2 50,142 33,139 Extrordinary gain on repurchase of debt, net of tax es ........... 6,983 -- - - -- -- Discontinued operations (6) ....................... .............. -- -- - - -- (7,672) --------- --------- -------- - --------- --------- Net income (loss) ................................. .............. $ 19,832 $ (1,200) $ 78,93 2 $ 50,142 $ 25,467 ========= ========= ======== = ========= ========= Income (loss) from continuing operations per share (7): Basic .......................................... .............. $ 0.20 $ (0.02) $ 1.4 0 $ 0.99 $ 0.64 Diluted ........................................ .............. $ 0.20 $ (0.02) $ 1.3 9 $ 0.94 $ 0.60 Net income (loss) per share (7): Basic .......................................... .............. $ 0.31 $ (0.02) $ 1.4 0 $ 0.99 $ 0.49 Diluted ........................................ .............. $ 0.31 $ (0.02) $ 1.3 9 $ 0.94 $ 0.46
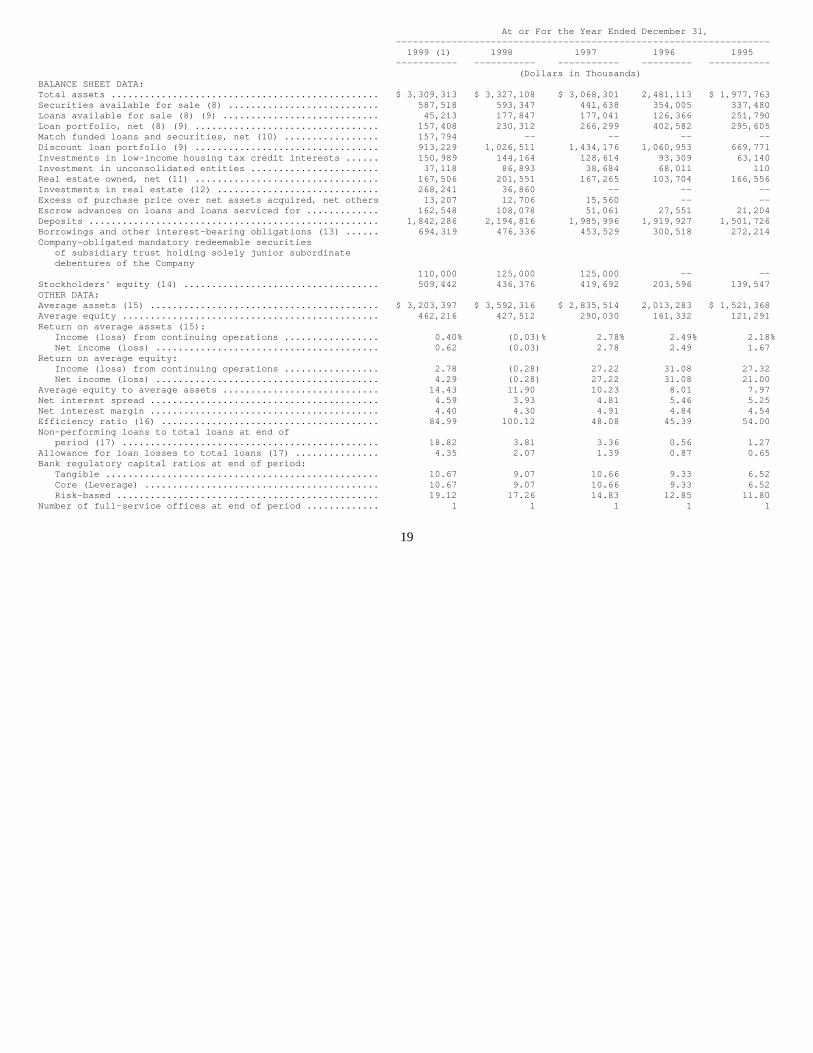
19
At or For the Year Ended December 31, -------------------------------------- ----------------------------- 1999 (1) 1998 1997 1996 1995 ----------- ----------- --------- -- --------- ----------- (Dollars in Thou sands) BALANCE SHEET DATA: Total assets ...................................... .......... $ 3,309,313 $ 3,327,108 $ 3,068,3 01 2,481,113 $ 1,977,763 Securities available for sale (8) ................. .......... 587,518 593,347 441,6 38 354,005 337,480 Loans available for sale (8) (9) .................. .......... 45,213 177,847 177,0 41 126,366 251,790 Loan portfolio, net (8) (9) ....................... .......... 157,408 230,312 266,2 99 402,582 295,605 Match funded loans and securities, net (10) ....... .......... 157,794 -- -- -- -- Discount loan portfolio (9) ....................... .......... 913,229 1,026,511 1,434,1 76 1,060,953 669,771 Investments in low-income housing tax credit intere sts ...... 150,989 144,164 128,6 14 93,309 63,140 Investment in unconsolidated entities ............. .......... 37,118 86,893 38,6 84 68,011 110 Real estate owned, net (11) ....................... .......... 167,506 201,551 167,2 65 103,704 166,556 Investments in real estate (12) ................... .......... 268,241 36,860 -- -- -- Excess of purchase price over net assets acquired, net others 13,207 12,706 15,5 60 -- -- Escrow advances on loans and loans serviced for ... .......... 162,548 108,078 51,0 61 27,551 21,204 Deposits .......................................... .......... 1,842,286 2,194,816 1,985,9 96 1,919,927 1,501,726 Borrowings and other interest-bearing obligations ( 13) ...... 694,319 476,336 453,5 29 300,518 272,214 Company-obligated mandatory redeemable securities of subsidiary trust holding solely junior subord inate debentures of the Company 110,000 125,000 125,0 00 -- -- Stockholders' equity (14) ......................... .......... 509,442 436,376 419,6 92 203,596 139,547 OTHER DATA: Average assets (15) ............................... .......... $ 3,203,397 $ 3,592,316 $ 2,835,5 14 2,013,283 $ 1,521,368 Average equity .................................... .......... 462,216 427,512 290,0 30 161,332 121,291 Return on average assets (15): Income (loss) from continuing operations ....... .......... 0.40% (0.03)% 2. 78% 2.49% 2.18% Net income (loss) .............................. .......... 0.62 (0.03) 2. 78 2.49 1.67 Return on average equity: Income (loss) from continuing operations ....... .......... 2.78 (0.28) 27. 22 31.08 27.32 Net income (loss) .............................. .......... 4.29 (0.28) 27. 22 31.08 21.00 Average equity to average assets .................. .......... 14.43 11.90 10. 23 8.01 7.97 Net interest spread ............................... .......... 4.59 3.93 4. 81 5.46 5.25 Net interest margin ............................... .......... 4.40 4.30 4. 91 4.84 4.54 Efficiency ratio (16) ............................. .......... 84.99 100.12 48. 08 45.39 54.00 Non-performing loans to total loans at end of period (17) .................................... .......... 18.82 3.81 3. 36 0.56 1.27 Allowance for loan losses to total loans (17) ..... .......... 4.35 2.07 1. 39 0.87 0.65 Bank regulatory capital ratios at end of period: Tangible ....................................... .......... 10.67 9.07 10. 66 9.33 6.52 Core (Leverage) ................................ .......... 10.67 9.07 10. 66 9.33 6.52 Risk-based ..................................... .......... 19.12 17.26 14. 83 12.85 11.80 Number of full-service offices at end of period ... .......... 1 1 1 1 1

NOTES TO SELECTED CONSOLIDATED FINANCIAL INFORMATIO N
(1) Financial data for 1999 reflects the sale of the Company's wholly-owned UK subsidiary, Ocwen UK Limited, formerly known as Ocwen UK plc ("Ocwen UK"), on September 30, 1999 for a gain of $50.4 million. Ocwen UK was engaged in the subprime mortgage loan origination and servicing business and began operations on April 24, 1998. Financial data for 1999 also reflects the Company's acquisition of Ocwen Asset Investment Corp. ("OAC") on October 7, 1999 for a total purchase price of $101.3 million. Previously, the Company accounted for its investment in OAC and its operating partnership subsidiary, Ocwen Partnership LP ("OPLP"), under the equity method. See Note 2 to the Consolidated Financial Statements for additional information regarding these transactions. (2) The provision for loan losses in 1999, 1998, 1997 and 1996 consists primarily of $5.4 million, $17.6 million, $31.9 million and $20.6 million, respectively, related to the Company's discount loan portfolio. Beginning in the first quarter of 1996, the Company began recording a provision for losses on discount loans. (3) Includes $36.8 million, $109.6 million, $71.9 million, $15.2 million and $1.6 million of net gains recognized in connection with the securitization of loans during 1999, 1998, 1997, 1996 and 1995, respectively. During the third quarter of 1999, the Company made a decision to structure future securitizations as financing transactions, thereby precluding the use of gain-on-sale accounting. The Company executed no securitizations of loans during the second half of 1999. (4) Other income for 1999 includes the $50.4 million gain on the sale of Ocwen UK. (5) Results for 1999 related primarily to the Company's 35.84% investment in Norland Capital Group plc, doing business as Kensington Mortgage Company ("Kensington"), and the Company's 16.83% combined equity investment in OAC and OPLP, prior to the acquisition on October 7, 1999. Results for 1997 and 1996 related to the Company's investment in BCBF, L.L.C. (the "LLC"), a 50% owned joint venture formed between the Company and BlackRock Capital Finance ("BlackRock") to acquire loans from the Department of Housing and Urban Development ("HUD") in April 1996. The LLC distributed all of its assets on December 12, 1997. (6) In September 1995, the Company announced its decision to dispose of its automated banking division, which was substantially complete at December 31, 1995. (7) All per share amounts have been adjusted retroactively to reflect the 10-for-1 stock split in July 1996 and the 2-for-1 stock split in November 1997. In addition, all per share amounts have been adjusted for the adoption of Statement of Financial Accounting Standards No. 128, "Earnings per Share." See Note 1 to the Consolidated Financial Statements (which is incorporated herein by reference). (8) Securities available for sale are carried at fair value. Loans available for sale are carried at the lower of cost or market value. (9) The discount loan portfolio consists of mortgage loans purchased at a discount to the unpaid debt, most of which were non-performing or subperforming at the date of acquisition. The loan portfolio, net and loans available for sale consist of other loans which were originated or purchased by the Company for investment or for potential sale, respectively. Data related to discount loans does not include discount loans held by the LLC. (10) Match funded loans and securities, net is primarily comprised of securitized loans and securities accounted for as financing transactions. The match funded loans were acquired as a result of the OAC acquisition. See Note 9 to the Consolidated Financial Statements (which is incorporated herein by reference). (11) Real estate owned consists of properties acquired by foreclosure or by deed-in-lieu thereof and is primarily attributable to the Company's discount loan acquisition and resolution business. (12) Balance at December 31, 1999 includes eight properties with an aggregate carrying value of $252.6 million that were acquired as a result of the OAC acquisition. See Note 12 to the Consolidated Financial Statements (which is incorporated herein by reference). (13) Balance at December 31, 1999 includes $140.5 million of 11.5% notes and $101.0 million of bonds-match funded agreements assumed as a result of the OAC acquisition. See Notes 17 and 19 to the Consolidated Financial Statements (which is incorporated herein by reference). (14) Reflects the issuance of 12,371,750 shares of common stock in the amount of $96.8 million in connection with the acquisition of OAC on October 7, 1999. Also reflects the Company's repurchase of 4,611,700 shares of its common stock for an aggregate of $30.7 million and 17,630,120 shares of common stock for an aggregate of $42.0 million during 1999 and 1995, respectively. (15) Includes the Company's pro rata share of the average assets held by the LLC during 1997 and 1996. (16) The efficiency ratio represents non-interest expense divided by the sum of net interest income before provision for loan losses, non-interest income and equity in earnings of investment in unconsolidated entities. (17) Non-performing loans and total loans do not include loans in the Company's discount loan portfolio or loans available for sale.
20

MANAGEMENT'S DISCUSSION AND ANALYSIS OF FINANCIAL C ONDITION AND RESULTS OF OPERATIONS
The following discussion of the Company's consolidated financial condition, results of operations and capital resources and liquidity should be read in conjunction with the Selected Consolidated Financial Information, Consolidated Financial Statements and the related notes, all included elsewhere herein.
RESULTS OF OPERATIONS
GENERAL. The Company recorded net income of $19.8 million for 1999, as compared to a net loss of $1.2 million for 1998 and net income of $78.9 million for 1997. Diluted earnings per share were $0.31 for 1999, as compared with diluted loss per share of ($0.02) for 1998 and diluted earnings per share of $1.39 for 1997. There were a number of key factors that contributed to annual results for 1999 as compared to 1998, including: a pretax gain of $50.4 million earned from the sale of Ocwen UK on September 30, 1999; continued growth in the profitability of the domestic residential mortgage loan servicing business, which reported a 59% increase in net income to $12.9 million in 1999 as compared to $8.1 million in 1998; a reduction in the amount of impairment charges recorded on the securities portfolio from $129.7 million in 1998 to $58.8 million in 1999; a reduction in reported gain on sale of interest earning assets from $130.0 million in 1998 to $44.3 million in 1999, reflecting the Company's decision in the third quarter of 1999 to discontinue the practice of structuring securitizations as sales transactions, thus precluding recognition of gain-on-sale accounting; and an increase in net losses incurred by Ocwen Technology Xchange, Inc. ("OTX") from $9.6 million in 1998 to $19.2 million in 1999, reflecting the continuing investment in the development of the Company's technology businesses.
SEGMENT PROFITABILITY. The following table presents the after tax contribution by business segment to the Company's net income (loss) for the years indicated:
The following is a discussion of the contribution by business segment to the Company's net income (loss) for the years indicated.
o SINGLE FAMILY RESIDENTIAL DISCOUNT LOANS. Results for 1999 and 1998 include impairment charges of $27.3 million and $14.2 million, respectively, on residential subordinate securities. Securitization gains during 1999, 1998 and 1997 were $22.8 million, $48.1 million and $51.1, respectively. See "Results of Operations - Non-Interest Income."
o COMMERCIAL REAL ESTATE DISCOUNT LOANS. Net income includes gains from sales of loans of $4.2 million, $12.2 million and $3.5 million during 1999, 1998 and 1997, respectively. Net income also includes gains on the repayment of loans, which is reported as interest income, of $16.4 million, $39.4 million and $43.3 million, respectively. Gains from the sale and operation of commercial real estate owned amounted to $3.6 million, $23.5 million and $13.2 million during 1999, 1998 and 1997, respectively.
o DOMESTIC RESIDENTIAL MORTGAGE LOAN SERVICING. The increase in net income during 1999 and 1998 reflects an increase in servicing fees as a result of an increase in loans serviced for others. Domestic residential servicing fees amounted to $46.2 million, $39.9 million and $22.1 million during 1999, 1998, and 1997, respectively. See "Results of Operations - Non-Interest Income."
21
Year Ended December 31, --------------------------- ----- 1999 1998 1 997 -------- -------- --- ----- (Dollars in Thousands) Discount loans: Single family residential loans ................... ..................... $(10,996) $ 15,444 $ 2 5,100 Commercial real estate loans ...................... ..................... 14,747 37,001 2 8,398 -------- -------- --- ----- 3,751 52,445 5 3,498 Domestic residential mortgage loan servicing ...... ..................... 12,939 8,148 (954) Investment in low-income housing tax credits ...... ..................... 8,960 9,662 1 1,300 Commercial real estate lending .................... ..................... 5,630 13,549 1 1,545 UK operations ..................................... ..................... 36,429 12,246 -- OTX ............................................... ..................... (19,190) (9,619) (391) Domestic subprime single family residential lending .................... (18,234) (21,951) 1,841 Investment securities ............................. ..................... (3,874) (59,281) 2,894 OAC ............................................... ..................... 365 (9,750) 153 Unsecured collections ............................. ..................... (4,110) (1,036) 185 Corporate items and other ......................... ..................... (2,834) 4,387 ( 1,139) -------- -------- --- ----- $ 19,832 $ (1,200) $ 7 8,932 ======== ======== === =====

o INVESTMENT IN LOW-INCOME HOUSING TAX CREDITS. Net income for 1999 includes $6.6 million of gains associated with the sale of tax credit interests. This compares to gains of $7.4 million and $6.1 million in 1998 and 1997, respectively. Low-income housing tax credits and benefits amounted to $18.2 million, $17.7 million, and $14.9 million for 1999, 1998, and 1997, respectively. Net operating losses from tax credit properties in service amounted to $6.3 million, $6.9 million, and $4.9 million during 1999, 1998, and 1997, respectively. See "Changes in Financial Condition - Investment in Low-Income Housing Tax Credit Interests."
o COMMERCIAL REAL ESTATE LENDING. Net income includes $8.1 million, $12.4 million and $12.3 million of additional interest received on the payoff of loans during 1999, 1998, and 1997, respectively. As of June 30, 1999, the Company ceased the origination of multi-family and commercial real estate loans.
o UK OPERATIONS. On September 30, 1999, the Company sold all of the shares of its wholly-owned subsidiary, Ocwen UK, to Malvern House Acquisition Limited for the pound sterling equivalent of $122.1 million in cash. Ocwen UK was originally formed to acquire substantially all of the assets, and certain of the liabilities, of the United Kingdom operations of Cityscape Financial Corp., and commenced operations on April 24, 1998. As a result of the transaction, the Company recorded a pretax gain on sale of $50.4 million. Ocwen UK securitization gains during 1999 and 1998 totaled $10.2 million and $27.0 million, respectively. UK operations also includes equity in (losses) earnings of Kensington of $(9.2) million and $0.4 million for 1999 and 1998, respectively.
o OTX. The increase in net losses incurred by OTX, which was formed in 1998, reflects the Company's continuing investment in the development of its technology businesses. Losses for 1999 also included a $3.4 million charge reflecting the impact of a reduction in the estimated useful life of the goodwill associated with the acquisitions previously made by OTX. On June 2, 1999, OTX acquired substantially all of the assets of Synergy Software, LLC ("Synergy"), a developer of commercial and multi-family mortgage servicing systems. See Note 2 to the Consolidated Financial Statements (which is incorporated herein by reference).
o DOMESTIC SUBPRIME SINGLE FAMILY RESIDENTIAL LENDING. Net losses during 1999 and 1998 included $29.4 million and $31.0 million, respectively, of impairment charges on subprime residual securities. The net loss for 1998 also included a charge of $10.1 million for the write-off of goodwill at Ocwen Financial Services, Inc. ("OFS"). In August 1999, the Company closed its domestic subprime origination business, which had been conducted primarily through OFS, which itself was formed in 1997. During 1999, 1998 and 1997, gains of $3.8 million, $34.5 million and $18.8 million were recorded in connection with the securitization of loans.
o INVESTMENT SECURITIES. The $59.3 million loss in 1998 included $86.1 million of pretax impairment charges related to the Company's securities portfolio of AAA-rated agency interest-only securities ("IOs"). The Company discontinued this investment activity and sold this portfolio of IO's in July of 1998. See "Changes in Financial Condition - Securities Available for Sale."
o OAC. On October 7, 1999, the Company acquired OAC, a publicly-traded real estate investment trust. Under the terms of the agreement, OAC shareholders (except for OCN or its subsidiaries) received 0.71 shares of OCN stock for each outstanding share of OAC common stock. Effective with the merger, the Company's consolidated financial statements include OAC and its subsidiaries. Previously, the Company accounted for its investment in OAC under the equity method. At September 30, 1999, the Company, through a wholly-owned subsidiary, owned 1,540,000 or 8.12% of the outstanding common stock of OAC and 1,808,733 units or 8.71% of the outstanding partnership units of OPLP. See "Changes in Financial Condition - Investment in Unconsolidated Entities" and Note 2 to the Consolidated Financial Statements (which is incorporated herein by reference).
o UNSECURED COLLECTIONS. Unsecured collections is primarily comprised of activities related to the Company's charged-off unsecured credit card receivables which were acquired at a discount. Collections of unsecured credit card receivables are accounted for under the cost recovery method.
See Note 29 to the Consolidated Financial Statements (which is incorporated herein by reference) for additional information related to the Company's operating segments.
NET INTEREST INCOME: 1999 VERSUS 1998 AND 1998 VERSUS 1997. The operations of the Company are substantially dependent on its net interest income, which is the difference between the interest income received from its interest-earning assets and the interest expense paid on its interest-bearing liabilities. Net interest income is determined by net interest spread (i.e., the difference between the yield earned on its interest-earning assets and the rates paid on its interest-bearing liabilities), the relative amount of interest-earning assets and interest-bearing liabilities and the degree of mismatch in the maturity and repricing characteristics of its interest-earning assets and interest-bearing liabilities.
22

The following table sets forth, for the periods indicated, information regarding the total amount of income from interest-earning assets and the resultant average yields, the interest expense associated with interest-bearing liabilities, expressed in dollars and rates, and the net interest spread and net interest margin. Information is based on average daily balances during the indicated periods.
(1) Excludes effect of unrealized gains or losses on securities available for sale. (2) The average balances of loans available for sale and the loan portfolio include non-performing loans, interest on which is recognized on a cash basis.
23
Year Ended December 31, ------------- --------------------------------------------------- ----------------------------- 1999 1998 1997 ------------- -------------------- ----------------------------- --------------------------- Interest Average Interest Average Interest Average Average Income/ Yield/ Average Income/ Yield/ Average Income/ Yield/ Balance Expense Rate Balance Expense Rate Balance Expense Rate ------------ ----------- -------- ---------- ---------- ------- ---------- -------- ------- AVERAGE ASSETS: (Dollars in Thousands) Federal funds sold and repurchase agreements........................ $ 174,494 $ 8,942 5.12% $ 149,441 $ 7,930 5.31 % $ 163,671 $ 8,975 5.48% Securities available for sale (1) ... 593,399 62,698 10.57 590,367 40,320 6.83 299,558 28,545 9.53 Loans available for sale (2) ........ 234,272 25,724 10.98 520,859 56,791 10.90 171,837 18,368 10.69 Investment securities and other ..... 29,874 2,086 6.98 31,422 3,197 0.17 36,905 4,045 10.96 Loan portfolio (2)................... 181,194 28,683 15.83 266,519 38,609 14.49 410,863 54,701 13.31 Match funded loans and securities ... 30,483 3,237 10.62 -- -- -- -- -- -- Discount loan portfolio ............. 975,439 121,854 12.49 1,295,885 160,847 12.41 1,283,020 157,649 12.29 Securities held for trading ........ -- -- -- -- -- -- 3,295 248 7.53 ------------ ----------- ---------- ---------- ---------- -------- Total interest earning assets .... 2,219,155 253,224 11.41 2,854,493 307,694 10.78 2,369,149 272,531 11.50 ----------- ---------- -------- Non-interest earning cash ........... 96,781 20,928 14,843 Allowance for loan losses ........... (26,597) (25,655) (22,001) Low-income housing tax credit interests ......................... 166,600 130,391 96,096 Investment in unconsolidated entities .......................... 76,146 82,779 34,777 Real estate owned, net .............. 191,694 178,223 131,007 Investment in real estate ........... 90,494 36,922 44,722 Other assets......................... 389,124 314,235 166,921 ------------ ---------- ---------- Total assets...................... $ 3,203,397 $3,592,316 $2,835,514 ============ ========== ========== AVERAGE LIABILITIES AND STOCKHOLDERS' EQUITY: Interest-bearing demand deposits .... $ 37,483 1,313 3.50% $ 36,139 1,434 3.97 % $ 31,719 1,220 3.85% Savings deposits..................... 1,588 38 2.39 1,652 38 2.30 2,121 49 2.31 Certificates of deposit ............. 1,590,553 97,019 6.10 1,844,977 115,112 6.24 1,964,351 120,801 6.15 ------------ ----------- ---------- ---------- ---------- -------- Total interest-bearing deposits .. 1,629,624 98,370 6.04 1,882,768 116,584 6.19 1,998,191 122,070 6.11 Securities sold under agreements to 6.93 repurchase........................ 107,622 7,456 104,980 6,514 6.20 16,717 1,000 5.98 Bonds-match funded agreements ....... 28,904 2,101 7.27 -- -- -- -- -- -- Obligations outstanding under lines of credit ................... 256,300 16,318 6.37 481,212 34,587 7.19 84,272 5,578 6.62 Notes, debentures and other ......... 257,424 31,297 12.16 230,059 27,208 11.83 237,715 27,641 11.63 ------------ ----------- ---------- ---------- ---------- -------- Total interest-bearing liabilities .................... 2,279,874 155,542 6.82 2,699,019 184,893 6.85 2,336,895 156,289 6.69 ----------- ---------- -------- Non-interest bearing deposits ....... 26,316 19,483 23,224 Escrow deposits...................... 228,335 174,237 78,986 Other liabilities.................... 84,559 147,065 57,992 ------------ ---------- ---------- Total liabilities................. 2,619,084 3,039,804 2,497,097 Capital securities................... 122,097 125,000 48,387 Stockholders' equity................. 462,216 427,512 290,030 ------------ ---------- ---------- Total liabilities and stockholders' equity ........... $ 3,203,397 $3,592,316 $2,835,514 ============ ========== ========== Net interest income.................. $ 97,682 $ 122,801 $116,242 =========== ========== ======== Net interest spread.................. 4.59% 3.93 % 4.81% Net interest margin.................. 4.40% 4.30 % 4.91% Ratio of interest-earning assets to interest-bearing liabilities .. 97% 106% 101%

The following table describes the extent to which changes in interest rates and changes in volume of interest-earning assets and interest-bearing liabilities have affected the Company's interest income and expense during the periods indicated. For each category of interest-earning assets and interest-bearing liabilities, information is provided on changes attributable to (i) changes in volume (change in volume multiplied by prior rate), (ii) changes in rate (change in rate multiplied by prior volume) and (iii) total change in rate and volume. Changes attributable to both volume and rate have been allocated proportionately to the change due to volume and the change due to rate.
1999 VERSUS 1998:
The Company's net interest income before provision for loan losses of $97.7 million decreased $25.1 million or 20% during 1999 as compared to the prior year. The decrease was due to a decrease in average interest-earning assets, offset by a decrease in average interest-bearing liabilities and an increase in the net interest spread. Average interest-earning assets decreased by $635.3 million or 22% during 1999 and reduced interest income by $83.4 million. Average interest-bearing liabilities decreased $419.1 million or 16% and reduced interest expense by $26.7 million. The impact of these volume changes resulted in a $56.7 million decrease in net interest income. The net interest spread increased 66 basis points during 1999 as a result of a 63 basis-point increase in the weighted average rate on interest-earning assets and a 3 basis-point decrease in the weighted average rate on interest-bearing liabilities. The impact of these rate changes resulted in a $31.6 million increase in net interest income.
24
Year Ended December 31, ---------------------------------------------- ---------------------- 1999 vs. 1998 1998 vs. 1997 -------------------------------- ---------- ---------------------- Increase (Decrease) Due To Increase (Decrease) Due To -------------------------------- ---------- ---------------------- Rate Volume Total Rate Volume Total -------- -------- -------- -------- -------- -------- (Dollars in Thousands) INTEREST-EARNING ASSETS: Federal funds sold and repurchase agreements ...... .. $ (366) $ 1,283 $ 917 $ (283) $ (762) $ (1,045) Securities available for sale ..................... .. 22,170 208 22,378 (9,859) 21,634 11,775 Loans available for sale .......................... .. 399 (31,466) (31,067) 375 38,048 38,423 Loan portfolio .................................... .. 3,323 (13,249) (9,926) 4,479 (20,571) (16,092) Discount loan portfolio ........................... .. 1,031 (40,024) (38,993) 1,609 1,589 3,198 Match funded loans and securities ................. .. 3,237 -- 3,237 Investment securities and other ................... .. (865) (151) (1,016) (276) (572) (848) Securities held for trading ....................... .. -- -- -- (124) (124) (248) -------- -------- -------- -------- -------- -------- Total interest-earning assets .................. .. 28,929 (83,399) (54,470) (4,079) 39,242 35,163 -------- -------- -------- -------- -------- -------- INTEREST-BEARING LIABILITIES: Interest-bearing demand deposits .................. .. (173) 52 (121) 40 174 214 Savings deposits .................................. .. 2 (2) -- -- (11) (11) Certificates of deposit ........................... .. (2,524) (15,569) (18,093) 1,738 (7,427) (5,689) -------- -------- -------- -------- -------- -------- Total interest-bearing deposits ................ .. (2,695) (15,519) (18,214) 1,778 (7,264) (5,486) Securities sold under agreements to repurchase .... .. 775 167 942 39 5,475 5,514 Obligations outstanding under lines of credit...... .. (3,587) (14,682) (18,269) 519 28,490 29,009 Bonds-match funded agreements ..................... .. 2,101 -- 2,101 -- -- -- Notes, debentures and other interest- bearing obligations ............................ .. 779 3,310 4,089 467 (900) (433) -------- -------- -------- -------- -------- -------- Total interest-bearing liabilities .......... .. (2,627) (26,724) (29,351) 2,803 25,801 28,604 -------- -------- -------- -------- -------- -------- Increase (decrease) in net interest income ......................................... .. $ 31,556 $(56,675) $(25,119) $ (6,882) $ 13,441 $ 6,559 ======== ======== ======== ======== ======== ========

(1) Includes an average balance of $132.1 million and $147.1 million with an average yield earned of 12.28% and 11.81% for 1999 and 1998, respectively, related to Ocwen UK.
Interest income on securities available for sale increased $22.4 million or 56% during 1999 as compared to 1998 primarily as a result of a 374 basis-point increase in the weighted average yield earned. As indicated in the table below, the increase in the weighted average yield during 1999 is due in large part to changes in the composition of the securities available for sale portfolio.
(1) Includes an average balance of $60.7 million and $42.3 million with an average yield earned of 24.45% and 14.23% for 1999 and 1998, respectively, related to Ocwen UK.
During 1998, the Company discontinued its investment in AAA-rated agency IOs and sold its entire portfolio on July 27, 1998. Because collateralized mortgage obligations ("CMOs") have less cash flow variability, their average lives and yields to maturity are more stable, and therefore, CMOs are priced to yield less than a less stable class of mortgage-related securities, such as IOs. See "Changes in Financial Condition - Securities Available for Sale."
Interest income on loans available for sale decreased $31.1 million or 55% during 1999 as compared to 1998 primarily as a result of a $286.6 million or 55% decrease in the average balance. The decrease in the average balance reflects securitizations of foreign and domestic subprime loans and a decline in originations due to the closure of the domestic subprime origination business, as well as the sale of Ocwen UK. See "Changes in Financial Condition - Loans Available for Sale."
Interest income on the loan portfolio decreased by $9.9 million or 26% in 1999 versus 1998 primarily due to an $85.3 million or 32% decrease in the average balance, which was offset in part by a 134 basis-point increase in the average yield. The decrease in the average balance was due to the repayment of multi-family residential and commercial real estate loans. Interest income includes $8.1 million and $12.4 million of additional interest received during 1999 and 1998, respectively, in connection with the repayment of such loans. As of June 30, 1999, the Company ceased origination of multi-family and commercial loans. See "Changes in Financial Condition - Loan Portfolio."
25
Average Balance Increase Average Yield Increase ---- --------------------- (Decrease) --------- ------- (Decrease) For the Year Ended December 31, 1 999 1998 $ 1999 1998 Basis Points ---------------------------------------------- ---- ------- ----------- ----------- ------- ------ ------------ (Dollars in Thousands) Federal funds sold and repurchase agreements.. $ 174,494 $ 149,441 $ 25,053 5.12% 5.31% (19) Securities available for sale ................ 593,399 590,367 3,032 10.57 6.83 374 Loans available for sale (1) ................. 234,272 520,859 (286,587) 10.98 10.90 8 Investment securities and other .............. 29,874 31,422 (1,548) 6.98 10.17 (319) Loan portfolio ............................... 181,194 266,519 (85,325) 15.83 14.49 134 Match funded loans and securities ............ 30,483 -- 30,483 10.62 -- 1,062 Discount loan portfolio ...................... 975,439 1,295,885 (320,446) 12.49 12.41 8 ---- ------- ----------- ----------- $ 2, 219,155 $ 2,854,493 $ (635,338) 11.41% 10.78% 63 ==== ======= =========== ===========
Average Balance Average Yield ------------------------------------------ --- ------------------ For the Year Ended December 31, 1999 1998 1999 1998 --------------------------------------------------- ------ ---------------------- ---------------- --- ------- ------- Amount Percent Amount Perc ent ----------- -------- --------- ---- --- (Dollars in Thousands) CMOs (AAA-rated)................................... ...... $ 366,343 61% $ 291,669 49% 5.71% 5.51% Subordinates and residuals (1) .................... ..... 227,056 39 180,673 31 18.40 13.96 IOs (AAA-rated agency)............................. ...... -- -- 113,347 19 -- (0.87) Other.............................................. ...... -- -- 4,678 1 -- 0.53 ----------- -------- ---------- ---- --- $ 593,399 100% $ 590,367 100% 10.57% 6.83% =========== ======== ========== ==== ===

Interest income on discount loans decreased by $39.0 million or 24% during 1999 primarily as a result of a $320.4 million or 25% decrease in the average balance. Securitizations, through June 30, 1999, as well as a decline in acquisition volume, have contributed significantly to the decline in the average balance. See "Changes in Financial Condition - Discount Loans, Net." The yield on the discount loan portfolio is likely to fluctuate from period to period as a result of the timing of resolutions, particularly the resolution of large multi-family residential and commercial real estate loans, and the mix of the overall portfolio between performing and non-performing loans.
(1) Includes an average balance of $22.9 million and $9.2 million with an average yield of 7.64% and 5.16% for 1999 and 1998, respectively, related to Ocwen UK.
(2) Includes an average balance of $130.4 million and $130.5 million with an average yield of 6.16% and 9.06% for 1999 and 1998, respectively, related to Ocwen UK.
Interest expense on obligations outstanding under lines of credit decreased $18.3 million or 53% during 1999 as compared to 1998 due to a $224.9 million or 47% decrease in the average balance and an 82 basis-point decrease in the weighted average interest rate. Lines of credit have been used primarily to fund the acquisition and origination of subprime single family loans at OFS and Ocwen UK. The decrease in the average balance is consistent with the decline in the average balance of loans available for sale. The declines in the average rates are primarily due to declines in the United Kingdom London Interbank Offered Rate. See "Changes in Financial Condition - Obligations Outstanding Under Lines of Credit."
Interest expense on interest-bearing deposits decreased $18.2 million or 16% during 1999 primarily due to a $253.1 million or 13% decrease in the average balance. The decline in the average balance was primarily related to certificates of deposit.
Interest expense on notes, debentures and other increased $4.1 million or 15% during 1999 primarily due to a $27.4 million increase in the average balance and a 33 basis-point increase in the weighted average interest rate. The increase in the average balance is primarily due to the acquisition of $140.5 million of 11.5% notes as a result of the OAC acquisition in October, offset in part by declines resulting from the Company's repurchases of debt during 1999. See "Changes in Financial Condition - Notes, Debentures and Other."
1998 VERSUS 1997:
The Company's net interest income before provision for loan losses of $122.8 million during 1998 increased $6.6 million or 6% as compared to 1997. The increase was due to an increase in average interest-earning assets, offset by an increase in average interest-bearing liabilities and a decline in the net interest spread. Average interest-earning assets increased by $485.3 million or 20% during 1998 and increased interest income by $39.2 million. Average interest-bearing liabilities increased $362.1 million or 16% and increased interest expense by $25.8 million. The impact of these volume changes resulted in a $13.4 million increase in net interest income. The net interest spread decreased 83 basis points during 1998 as a result of a 72 basis-point decline in the weighted average rate on interest-earning assets and a 15 basis-point increase in the weighted average rate on interest-bearing liabilities. The impact of these rate changes resulted in a $6.9 million decrease in net interest income.
26
Average Balance Increase A verage Rate Increase ------------------------- (Decrease) ---- ------------- (Decrease) For the Year Ended December 31, 1999 1998 $ 19 99 1998 Basis Points --------------------------------------------------- ----------- ----------- ----------- ---- ---- ------- ------------ (Dollars in Thousands) Interest-bearing deposits ......................... . $ 1,629,624 $ 1,882,768 $ (253,144) 6.04% 6.19% (15) Securities sold under agreements to repurchase (1). . 107,622 104,980 2,642 6.93 6.20 73 Bonds-match funded agreements ..................... . 28,904 -- 28,904 7.27 -- 727 Obligations outstanding under lines of credit (2).. . 256,300 481,212 (224,912) 6.37 7.19 (82) Notes, debentures and other ....................... . 257,424 230,059 27,365 1 2.16 11.83 33 ----------- ----------- ----------- $ 2,279,874 $ 2,699,019 $ (419,145) 6.82% 6.85% (3) =========== =========== ===========
Average Balance Increase A verage Rate Increase ------------------------- (Decrease) ---- ------------- (Decrease) For the Year Ended December 31, 1998 1997 $ 19 98 1997 Basis Points --------------------------------------------------- ----------- ----------- ----------- ---- ---- ------- ------------ (Dollars in Thousands) Federal funds sold and repurchase agreements ...... $ 149,441 $ 163,671 $ (14,230) 5 .31% 5.48% (17) Securities available for sale ..................... 590,367 299,558 290,809 6 .83 9.53 (270) Loans available for sale .......................... 520,859 171,837 349,022 10 .90 10.69 21 Investment securities and other ................... 31,422 36,905 (5,483) 10 .17 10.96 (79) Loan portfolio..................................... 266,519 410,863 (144,344) 14 .49 13.31 118 Discount loan portfolio ........................... 1,295,885 1,283,020 12,865 12 .41 12.29 12 Securities held for trading ....................... -- 3,295 (3,295) -- 7.53 (753) ----------- ----------- ----------- $ 2,854,493 $ 2,369,149 $ 485,344 10 .78% 11.50% (72) =========== =========== ===========

Interest income on securities available for sale increased $11.8 million or 41% during 1998 as compared to 1997 as a result of a $290.8 million or 97% increase in the average balance, offset by a 270 basis-point decline in the weighted average yield earned. The increase in the average balance, as well as the decline in the weighted average yield, due in large part to the Company's increased investment in CMOs.
Interest income on loans available for sale increased $38.4 million or 209% during 1998 as compared to 1997 primarily as a result of a $349.0 million or 203% increase in the average balance. The increase in the average balance was due to significant growth in the Company's domestic purchases and originations during this period, as well as those of Ocwen UK, which accounted for the U.S. dollar equivalent of $147.1 million of the increase in the average balance.
Interest income on the loan portfolio decreased by $16.1 million or 29% in 1998 versus 1997 primarily due to a $144.3 million or 35% decrease in the average balance of the loan portfolio, which was offset in part by a 118 basis-point increase in the weighted average yield earned. The decrease in the average balance was due to the repayment of multi-family residential and commercial real estate loans. Interest income includes $12.4 million and $12.3 million of additional interest received during 1998 and 1997, respectively, in connection with the repayment of such loans.
Interest expense on interest-bearing deposits decreased $5.5 million or 4% during 1998 primarily due to a $111.6 million or 6% decrease in the average balance, largely certificates of deposit .
Interest expense on securities sold under agreements to repurchase increased by $5.5 million or 551% during 1998 primarily as a result of an $88.3 million or 528% increase in the average balance. From time to time, the Company utilizes such collateralized borrowings as an additional source of liquidity depending on the cost and availability of alternative sources of funding.
Interest expense on obligations outstanding under lines of credit increased $29.0 million or 520% during 1998 as compared to 1997 due to a $396.9 million or 471% increase in the average balance and a 57 basis-point increase in the weighted average interest rate. The increase in the average balance is primarily due to the Company's use of lines of credit at OFS and Ocwen UK to fund the growth in subprime single family residential loans during this period. Ocwen UK accounted for the US dollar equivalent of $130.5 million of the increase in the average balance. See "Changes in Financial Condition - Obligations Outstanding Under Lines of Credit."
PROVISIONS FOR LOAN LOSSES. Provisions for losses on loans are charged to operations to maintain an allowance for losses on the loan portfolio, the discount loan portfolio and match funded loans at a level which management considers adequate based upon an evaluation of known and inherent risks in such portfolios. Management's periodic evaluation is based on an analysis of the discount loan portfolio, the loan portfolio and match funded loans, historical loss experience, current economic conditions and trends, collateral values and other relevant factors.
27
Average Balance Average Yield ------------------------------------------ --- ------------------ For the Year Ended December 31, 1998 1997 1998 1997 ------------------------------- ---------------------- ---------------- --- ------- ------- Amount Percent Amount Perc ent ----------- -------- --------- ---- --- (Dollars in Thousands) CMOs (AAA-rated)................................... ...... $ 291,669 50% $ 66,337 2 2% 5.51% 5.50% Subordinates and residuals......................... ...... 185,351 31 77,239 2 6 13.96 18.70 IOs (AAA-rated agency)............................. ...... 113,347 19 115,914 3 9 (0.87) 6.59 IOs (Non agency)................................... ...... -- -- 40,068 1 3 -- 7.03 ----------- -------- ---------- ---- - $ 590,367 100% $ 299,558 10 0% 6.83% 9.53% =========== ======== ========== ==== =
Average Balance Increase A verage Rate Increase ------------------------- (Decrease) ---- ------------- (Decrease) For the Year Ended December 31, 1998 1997 $ 19 98 1997 Basis Points ------------------------------- ----------- ----------- ----------- ---- ---- ------- ------------ (Dollars in Thousands) Interest-bearing deposits.......................... $ 1,882,768 $ 1,998,191 $ (115,423) 6 .19% 6.11% 8 Securities sold under agreements to repurchase..... 104,980 16,717 88,263 6 .20 5.98 22 Obligations outstanding under lines of credit...... 481,212 84,272 396,940 7 .19 6.62 57 Notes, debentures and other........................ 230,059 237,715 (7,656) 11 .83 11.63 20 ----------- ----------- ----------- $ 2,699,019 $ 2,336,895 $ 362,124 6 .85% 6.69% 16 =========== =========== ===========

The following table presents the provisions for loan losses by the discount loan, loan portfolio and the match funded loans for the years indicated.
The decline in the provision for losses on the discount loan portfolio during 1999 and 1998 reflects declines in the balance of the discount loan portfolio. Despite declines in the loan portfolio balance, the provision for loan portfolio losses have increased during 1999 and 1998 primarily as a result of an increase in non-performing loans. The negative provision for loan losses on match funded loans reflects a decline in the balance of the portfolio from the acquisition date of OAC. See "Changes in Financial Condition - Loan Portfolio, Net," "Match Funded Loans and Securities" and "Discount Loan Portfolio."
Although management utilizes its best judgment in providing for possible loan losses, there can be no assurance that the Company will not increase or decrease its provisions for possible loan losses in subsequent periods. Changing economic and business conditions, fluctuations in local markets for real estate, future changes in non-performing asset trends, material upward movements in market interest rates or other factors could affect the Company's future provisions for loan losses. In addition, the Office of Thrift Supervision ("OTS"), as an integral part of its examination process, periodically reviews the adequacy of the Company's allowance for loan losses and, as a result, may require the Company to recognize changes to such allowance for losses based on its judgment about information available to it at the time of examination. See "Changes in Financial Condition - Allowance for Loan Losses."
NON-INTEREST INCOME. Non-interest income increased $32.5 million or 29% during 1999 and decreased $10.8 million or 9% during 1998. The following table sets forth the principal components of the Company's non-interest income during the years indicated.
The increases in servicing fees and other charges reflects an increase in loan servicing and related fees as a result of increases in the average balance of loans serviced for others. During 1999, 1998 and 1997, the average unpaid principal balance of loans serviced for others amounted to $11.67 billion, $8.06 billion, and $3.11 billion, respectively. The increases in the average balance of loans serviced for others during those years was primarily related to servicing retained in connection with securitizations (primarily subprime loans) and acquisitions of servicing (including the acquisition of Cityscape UK's servicing business by Ocwen UK in 1998), net of repayments. Acquisitions of servicing during 1999 includes a contract with Southern Pacific Funding Corporation entered into in August to service 17,660 subprime residential mortgage loans with an unpaid principal balance of $1.3 billion. Servicing fees for 1999 and 1998 included $12.2 million and $1.4 million, respectively, of special servicing fees. The Company began entering into special servicing arrangements in 1998 wherein the Company has acted as a special servicer for third parties, typically as part of a securitization. Under these arrangements, the Company services loans that become greater than 90 days past due and receives incentive fees to the extent certain loss mitigation parameters are achieved. See Note 13 to the Consolidated Financial Statement (which is incorporated herein by reference).
28
1999 1 998 1997 ------- -- ----- ------- (Dollars i n Thousands) Provisions for loan losses: Discount loan..................... $ 5,434 $1 7,618 $31,894 Loan portfolio.................... 1,636 891 324 Match funded loans ............... (360) -- -- ------- -- ----- ------- $ 6,710 $1 8,509 $32,218 ======= == ===== =======
1999 1998 1997 ----------- ------- ---- ----------- (Dollars in Th ousands) Servicing fees and other charges................... ......................... $ 75,437 $ 59 ,180 $ 25,962 Gain on interest-earning assets, net............... ......................... 44,298 129 ,988 82,212 Impairment charges on securities available for sale ........................ (58,777) (129 ,714) -- Gain on real estate owned, net..................... ......................... (2,060) 14 ,033 7,277 Amorization of excess of net assets acquired over p urchase price ........... 3,201 -- -- Other income....................................... ......................... 83,620 39 ,696 8,498 ----------- ------- ---- ----------- Total.............................................. ......................... $ 145,719 $ 113 ,183 $ 123,949 =========== ======= ==== ===========

The following table sets forth the Company's loans serviced for others at the dates indicated.
(1) Includes 37,955 loans with an unpaid principal balance of $857.2 million ((pound)504.4 million) which were serviced by Ocwen UK at December 31, 1998.
Net gains on interest-earning assets in 1999 of $44.3 million were primarily comprised of $36.8 million of net gains recognized in connection with the securitization of single family subprime loans and discount loans, as presented in the table below, $4.2 million of gains on sales of commercial discount loans and $3.7 million of gains on sales of commercial securities available for sale.
Net gains on interest-earning assets in 1998 of $130.0 million were primarily comprised of $109.6 million of net gains recognized in connection with the securitization of single family subprime loans and discount loans, as presented in the table below, and $12.2 million of gains on sales of commercial discount loans.
Net gains on interest-earning assets in 1997 of $82.2 million were primarily comprised of $71.9 million of net gains recognized in connection with the securitization of single family subprime loans, single family discount loans and small commercial discount loans, as presented in the table below. Additionally, the Company recorded a $2.6 million gain on the sale of mortgage-related securities to OAC, $2.7 million of gains on sales of single family subprime loans and $3.5 million of gains on sales of commercial discount loans.
29
Discount Lo ans Subprime Loans(1) Other Loans Total ---------------- -------- ------------------------ ----------------- ------ ----------------------- Amount No. of Loans Amount No. of Loans Amount No. of Loans Amount No. of Loans ----------- ---- -------- ---------- ------------ --------- ------ ------ --------- ------------ (Dollars in Thousands) DECEMBER 31, 1999: Loans securitized ................ $ 1,046,340 16,928 $ 1,100,800 10,878 $ -- -- $ 2,147,140 27,806 Loans serviced for third parties.. 967,993 16,342 7,074,426 87,923 915,724 599 8,958,143 104,864 ----------- --- -------- ----------- ----------- ----------- ------ ----- ----------- ----------- $ 2,014,333 33,270 $ 8,175,226 98,801 $ 915,724 599 $11,105,283 132,670 =========== === ======== =========== =========== =========== ====== ===== =========== =========== DECEMBER 31, 1998: Loans securitized ................ $ 1,015,988 16,840 $ 1,809,533 31,607 $ -- -- $ 2,825,521 48,447 Loans serviced for third parties.. 1,573,285 20,835 5,327,441 83,085 866,219 1,091 7,766,945 105,011 ----------- --- -------- ----------- ----------- ----------- ------ ----- ----------- ----------- $ 2,589,273 37,675 $ 7,136,974 114,692 $ 866,219 1,091 $10,592,466 153,458 =========== === ======== =========== =========== =========== ====== ===== =========== =========== DECEMBER 31, 1997: Loans securitized ................ $ 624,591 11,148 $ 555,914 4,976 $ -- -- $ 1,180,505 16,124 Loans serviced for third parties.. 1,682,764 23,181 2,352,352 29,911 294,198 1,092 4,329,314 54,184 ----------- --- -------- ----------- ----------- ----------- ------ ----- ----------- ----------- $ 2,307,355 34,329 $ 2,908,266 34,887 $ 294,198 1,092 $ 5,509,819 70,308 =========== === ======== =========== =========== =========== ====== ===== =========== ===========

The following table sets forth the Company's net gains recognized in connection with the securitization of loans during 1999, 1998 and 1997.
Gains on interest-earning assets (as well as other assets, such as real estate owned, as discussed below) generally are dependent on various factors which are not necessarily within the control of the Company, including market and economic conditions. As a result, there can be no assurance that the gains on interest-earning assets (and other assets) reported by the Company in prior periods will be reported in future periods or that there will not be substantial inter-period variations in the results from such activities. During the third quarter of 1999, the Company made a strategic decision to structure future securitizations as financing transactions which will preclude the use of gain-on-sale accounting. There were no securitizations of loans executed by the Company during the second half of 1999. See "Changes in Financial Condition - Match Funded Loans and Securities."
Impairment charges on securities available for sale represent declines in fair value that were deemed to be other than temporary. See "Changes in Financial Condition - Securities Available for Sale" and the "Securities Available for Sale" section of Note 1 to the Consolidated Financial Statements (which is incorporated herein by reference).
The following table sets forth the results of the Company's real estate owned (which does not include investments in real estate, as discussed below) during the years indicated.
See "Changes in Financial Condition - Real Estate Owned" for additional information regarding real estate owned.
Amortization of the excess of net assets acquired over purchase price resulted from the Company's acquisition of OAC on October 7, 1999. The acquisition resulted in an excess of net assets acquired over the purchase price in the amount of $60.0 million, which is being amortized on a straight-line basis over a period of five years. The unamortized balance of the excess of net assets acquired over purchase price at December 31, 1999 was $56.8 million. See Note 2 to the Consolidated Financial Statements (which is incorporated herein by reference).
30
Book Value of Loans Securitized Secu rities --------------------------------------------------- ----------------------- Re tained Types of Loans Prin cipal No. of Loans Net Gain (Non- Cash Gain) Cash Gain ------------------------------------------- ----- ------ ------------ ----------- ----- ---------- ----------- (Dollars in Thousands) 1999: Single family discount..................... $ 2 27,303 3,137 $ 22,763 $ 4,040 $ 18,723 Single family subprime: Domestic.............................. 2 35,572 2,192 3,834 12,091 -- Foreign (Ocwen UK).................... 2 95,157 8,983 10,207 34,452 -- ----- ------ ----------- ----------- ----- --------- ----------- 5 30,729 11,175 14,041 46,543 -- ----- ------ ----------- ----------- ----- --------- ----------- $ 7 58,032 14,312 $ 36,804 $ 50,583 $ 18,723 ===== ====== =========== =========== ===== ========= =========== 1998: Single family discount..................... $ 4 98,798 7,638 $ 48,085 $ 32,261 $ 15,824 Single family subprime: Domestic.............................. 1,0 45,174 5,905 34,516 81,742 -- Foreign (Ocwen UK).................... 5 81,108 25,330 27,000 57,852 -- ----- ------ ----------- ----------- ----- --------- ----------- 1,6 26,282 31,235 61,516 139,594 -- ----- ------ ----------- ----------- ----- --------- ----------- $ 2,1 25,080 38,873 $ 109,601 $ 171,855 $ 15,824 ===== ====== =========== =========== ===== ========= =========== 1997: Single family discount..................... $ 4 18,795 6,295 $ 51,137 $ 20,635 $ 30,502 Single family subprime (domestic).......... 4 15,830 3,640 18,802 25,334 -- Commercial discount........................ 62,733 302 1,994 4,134 -- ----- ------ ----------- ----------- ----- --------- ----------- $ 8 97,358 10,237 $ 71,933 $ 50,103 $ 30,502 ===== ====== =========== =========== ===== ========= ===========
Year Ended December 31, --------------------------------------------------- ----- 1999 1998 1997 -------------- -------------- --------- ----- (Dollars in Thousands) Gains on sales................................ $ 36,265 $ 43,839 $ 3 0,651 Provision for losses in fair value............ (28,008) (18,626) (1 3,450) Carrying costs, net........................... (10,317) (11,180) ( 9,924) -------------- -------------- --------- ----- Income on real estate owned, net.............. $ (2,060) $ 14,033 $ 7,277 ============== ============== ========= =====

Other income of $83.6 million for 1999 included the $50.4 million gain on the sale of Ocwen UK. See Note 27 to the Consolidated Financial Statements (which is incorporated herein by reference) for a disclosure of the components of other income for 1999, 1998, and 1997.
NON-INTEREST EXPENSE. Non-interest expense decreased $32.1 million or 14% during 1999 and increased $101.4 million or 80% during 1998. The increase in non-interest expense during 1998 was due in part to the acquisition of Ocwen UK and commencement of operations at OTX. Non-interest expense for 1998 included $41.8 million and $11.3 million related to Ocwen UK and OTX, respectively. For 1999, total non-interest expense included $30.8 million and $22.1 million related to Ocwen UK and OTX, respectively.
The following table sets forth the principal components of the Company's non-interest expense during the years indicated.
Compensation and employee benefits decreased during 1999 despite an increase in the average number of employees from 1,512 during 1998 to 1,538 during 1999. The decrease in compensation and employee benefits during 1999 reflects a reduction in profit sharing expense in connection with the Company's decision to grant options under its annual incentive plan at an exercise price equal to fair market value. For the years 1997 and prior, options were granted at exercise prices below fair market value, resulting in the recognition of compensation expense. Also contributing to the decline in compensation and employee benefits was a $5.0 million decrease in commissions incurred by OFS as a result of the closing of the Company's domestic subprime lending operations, and a decrease in recruiting related expenses as a result of an increase in direct and local hiring. These declines were partially offset by an increase in profit sharing expense in connection with the Company's implementation of a long- term incentive plan in 1998. The increases in compensation and employee benefits in 1998 reflects an increase in the average number of employees from 872 during 1997 to 1,512 during 1998. Compensation and employee benefit expense for 1998 includes $12.4 million and $7.4 million related to Ocwen UK and OTX, respectively.
The increase in occupancy and equipment costs during 1998 as compared to 1997, was primarily due to a $3.5 million increase in rent expense and a $2.2 million increase in general office operating expenses. Ocwen UK and OTX accounted for $4.3 million of the $8.9 million increase in occupancy and equipment expenses during 1998.
Technology and communication costs consists primarily of depreciation expense on computer hardware and software, technology-related consulting fees (primarily OTX) and telephone expense.
Net operating losses on investments in real estate and certain low-income housing tax credits during 1999 is reported net of $1.7 million of operating income from investments in real estate acquired as a result of the OAC acquisition in October. See "Changes in Financial Condition - Investments in Real Estate."
Goodwill amortization recognized during 1999 related entirely to OTX, including a charge of $3.4 million reflecting the impact of a reduction in the estimated useful life of the goodwill associated with the acquisitions made by OTX. Of the $11.6 million of goodwill amortization recorded during 1998, $10.3 million related to OFS, including the $10.1 million write-off of the remaining unamortized balance which was deemed by the Company to be impaired.
The decline in loan expenses during 1999 primarily relates to Ocwen UK and OFS and reflects the Company's exit from the subprime mortgage origination business. Loan expenses of $15.2 million incurred by Ocwen UK account for the majority of the total increase in loan expenses in 1998 of $18.3 million.
Other operating expenses are primarily comprised of professional fees, marketing costs and travel costs. See Note 28 to the Consolidated Financial Statements (which is incorporated herein by reference) for a disclosure of the components of other operating expenses for 1999, 1998 and 1997.
31
1999 1998 1997 ----------- ----------- ----------- (Dollars in Thousands) Compensation and employee benefits................. ............. $ 102,173 $ 115,556 $ 77,573 Occupancy and equipment............................ ............. 18,501 17,652 8,742 Technology and communication costs................. ............. 19,647 17,560 9,492 Net operating loss on investment in real estate and certain low-income housing tax credit interests......... ............. 7,368 8,621 4,792 Amortization of excess of purchase price over net assets acquired............................. ............. 4,448 11,614 557 Loan expenses...................................... ............. 12,618 25,373 7,059 Other operating expenses........................... ............. 31,390 31,886 18,659 ----------- ----------- ----------- Total........................................... ............. $ 196,145 $ 228,262 $ 126,874 =========== =========== ===========

DISTRIBUTIONS ON COMPANY OBLIGATED, MANDATORILY REDEEMABLE SECURITIES OF SUBSIDIARY TRUST HOLDING SOLELY JUNIOR SUBORDINATED DEBENTURES OF THE COMPANY. In August 1997, Ocwen Capital Trust I ("OCT"), a wholly-owned subsidiary of the Company, issued $125.0 million of 10-7/8% Capital Securities, of which $15.0 million were repurchased during 1999. Cash distributions on the Capital Securities accrue from the date of original issuance and are payable semi-annually in arrears on February 1 and August 1 of each year, commencing on February 1, 1998, at an annual rate of 10-7/8% of the liquidation amount of $1,000 per Capital Security. The Company recorded $13.1 million, $13.6 million and $5.2 million of distributions to holders of the Capital Securities during 1999, 1998 and 1997, respectively. See Note 20 to the Consolidated Financial Statements and "Changes in Financial Condition - Company-Obligated, Mandatorily Redeemable Securities of Subsidiary Trust Holding Solely Junior Subordinated Debentures of the Company."
EQUITY IN (LOSSES) EARNINGS OF INVESTMENTS IN UNCONSOLIDATED ENTITIES. During 1998 and 1999, the Company recorded equity in (losses) earnings of Kensington of $(9.2) million and $0.4 million, net of goodwill amortization. At December 31, 1999 and 1998, the Company owned 35.84% and 36.07%, respectively, of the total outstanding common stock of Kensington, a leading originator of non-conforming residential mortgages in the U.K.
Prior to the acquisition of OAC on October 7, 1999 and during 1998, the Company recorded equity in the losses of its investments in OAC and OPLP of $(3.6) million and $(8.7) million, respectively. The Company began accounting for its investments in OAC and OPLP on the equity method effective May 5, 1998, upon the acquisition of 1,473,733 OPLP units, which increased its combined ownership in OAC and OPLP to 16.83%. Equity in the losses of OAC relates primarily to losses incurred by those entities in connection with impairment charges recorded on subordinate and residual mortgage-backed securities.
Equity in earnings of investment in unconsolidated entities for 1997 resulted from the Company's 50% joint venture investment in the LLC. All of the assets of the LLC were distributed at the end of 1997, and therefore the Company recorded no income from this investment in 1998 or 1999.
See "Changes in Financial Condition - Investment in Unconsolidated Entities," and Note 2 (the first five paragraphs) and Note 10 to the Consolidated Financial Statements (which is incorporated herein by reference).
INCOME TAX EXPENSE (BENEFIT). Income tax expense (benefit) amounted to $2.6 million, $(30.7) million, and $21.3 million during 1999, 1998 and 1997, respectively. The Company's effective tax rate was 17.6%, (94.8)%, and 21.4% during 1999, 1998 and 1997, respectively. The Company's effective tax rates reflect tax credits resulting from the Company's investment in low-income housing tax credit interests of $18.2 million, $17.7 million, and $14.9 million during 1999, 1998 and 1997, respectively. The Company's effective rate in 1999 reflects the lack of foreign tax payments which would have generated foreign tax credits to reduce the U.S. tax liability resulting from the sale of Ocwen UK. The Company's effective rate in 1999 also includes a provision of $2.5 million related to the deferred tax asset valuation allowance. See Note 23 to the Consolidated Financial Statements (which is incormportated herein by reference) and "Changes in Financial Condition - Investments in Low-Income Housing Tax Credit Interests."
CHANGES IN FINANCIAL CONDITION
SECURITIES AVAILABLE FOR SALE. At December 31, 1999, securities available for sale amounted to $587.5 million as compared to $593.3 million at December 31, 1998, a decrease of $5.8 million or 1%. Securities available for sale are carried at fair value with unrealized gains or losses reported as a separate component of accumulated other comprehensive income in stockholders' equity, net of taxes. Unrealized losses on securities that reflect a decline in value which is other than temporary are charged to earnings. At December 31, 1999, securities available for sale included an aggregate of $1.0 million of unrealized gains ($6.9 million of gross gains and $5.9 million of gross losses), as compared to $21.7 million of unrealized gains ($22.0 million of gross gains and $0.3 million of gross losses) at December 31, 1998.
32

The following table sets forth the fair value of the Company's securities available for sale at the dates indicated.
The decline in securities available for sale during 1999 was due primarily to $553.1 million of maturities and principal repayments, $110.7 million of subprime residuals sold in connection with the sale of Ocwen UK, $58.8 million of impairment charges on certain subordinates and residual securities, $43.9 million of sales and $11.1 million of net premium amortization, offset by $589.8 million of purchases, $133.0 million of subordinate and residual securities acquired as a result of the acquisition of OAC and $50.6 million of subordinates and residual securities acquired in connection with the Company's securitization of loans.
At December 31, 1999, the fair value of the Company's investment in subordinate and residual interests amounted to $195.1 million ($193.1 million amortized cost) or 33 % of total securities available for sale and supported senior classes of securities having an outstanding principal balance of $4.27 billion. During 1999, the Company recorded $58.8 million of impairment charges on its portfolio of subordinate and residual securities as a result of declines in value that were deemed to be "other than temporary." Because of their subordinate position, subordinated and residual classes of mortgage-related securities provide protection to and involve more risk than the senior classes. Specifically, when cash flow is impaired, debt service goes first to the holders of senior classes. In addition, incoming cash flows may be held in a reserve fund to meet any future repayments until the holders of senior classes have been paid and, when appropriate, until a specified level of funds has been contributed to the reserve fund. Further, residual interests exhibit considerably more price volatility than mortgages or ordinary mortgage pass-through securities, due in part to the uncertain cash flows that result from changes in the prepayment rates of the underlying mortgages. Lastly, subordinate and residual interests involve substantially more credit risk than the senior classes of the mortgage-related securities to which such interests relate and generally are not as liquid as the senior classes. See Note 5 to Consolidated Financial Statements (which is incorporated herein by reference).
On July 27, 1998, the Company sold its entire portfolio of AAA-rated agency IOs for $137.5 million, which represented book value. As a result of an increase in prepayment speeds due to declining interest rates, the Company recorded impairment charges of $86.1 million in 1998 prior to the sale resulting from the Company's decision to discontinue this investment activity and write down the book value of the IOs. The AAA-rated agency IOs consisted of IOs, which are classes of mortgage-related securities that
33
December 31, --------------------------------------------- 1999 1998 1997 ---------- ---------- ---------- Mortgage-related securities: (Dollars in Thousands) Single family residential: Collateralized mortgage obligations (AAA-rated ).. $ 392,387 $ 344,199 $ 160,451 BB-rated subordinates......................... ... 5,908 8,517 2,515 B-rated subordinates.......................... ... 6,098 6,344 -- Unrated subordinates ......................... ... 17,287 40,595 39,219 AAA-rated subprime residuals ................. ... -- 6,931 -- BBB-rated subprime residuals ................. ... -- 17,593 -- Unrated subprime residuals ................... ... 124,087 152,951 41,790 Interest only: AAA-rated................................... ... -- -- 13,863 FHLMC....................................... ... -- -- 64,745 FNMA........................................ ... -- -- 59,715 GNMA........................................ ... -- -- 29,766 Futures contracts and swaps................... ... -- -- (94 ) ---------- ---------- ---------- 545,767 577,130 411,970 ---------- ---------- ---------- Multi-family residential and commercial: BB-rated subordinates......................... ... 38,234 8,813 8,512 Unrated subordinates.......................... ... 3,503 7,331 6,795 Interest only: AAA-rated................................... ... -- 71 3,058 BB-rated.................................... ... -- 2 189 Unrated..................................... ... 14 -- -- Futures contracts............................. ... -- -- -- ---------- ---------- ---------- 41,751 16,217 18,554 ---------- ---------- ---------- Marketable equity securities: Common stocks................................. ... -- -- 46,272 ---------- ---------- ---------- Total.................................... ... $ 587,518 $ 593,347 $ 476,796 ========== ========== ==========

are entitled to payments of interest but no (or only nominal) principal, and inverse IOs, which bear interest at a floating rate that varies inversely with (and often at a multiple of) changes in a specified index.
Common stocks at December 31, 1997, were comprised primarily of the Company's investment in OAC. At December 31, 1997, the Company, through a wholly-owned subsidiary, owned 1,715,000 shares or 9.04% of the outstanding common stock of OAC, having a market value of $35.2 million ($25.5 million book value). As a result of a subsequent increase in ownership, the Company began accounting for its investment in OAC under the equity method in 1998. See "Investment in Unconsolidated Entities." The Company's other common stock investment at December 31, 1997 had a market value of $11.1 million ($13.0 million book value), was sold during 1998 for a loss of $0.3 million.
Historically, the Company generally has retained subordinate and residual securities, which are certificated, related to its securitization of loans. Subordinate and residual interests in mortgage-related securities provide credit support to the more senior classes of the mortgage-related securities. Principal from the underlying mortgage loans generally is allocated first to the senior classes, with the most senior class having a priority right to the cash flow from the mortgage loans until its payment requirements are satisfied. To the extent that there are defaults and unrecoverable losses on the underlying mortgage loans, resulting in reduced cash flows, the most subordinate security will be the first to bear this loss. Because subordinate and residual interests generally have no credit support, to the extent there are realized losses on the mortgage loans comprising the mortgage collateral for such securities, the Company may not recover the full amount or, indeed, any of its initial investment in such subordinate and residual interests. The Company generally retains the most subordinate classes of the securities from the securitization and therefore will be the first to bear any credit losses.
Historically, the Company has determined the present value of anticipated cash flows at the time each securitization transaction closes, utilizing valuation assumptions appropriate for each particular transaction. The significant valuation assumptions have included the anticipated prepayment speeds and the anticipated credit losses related to the underlying mortgages. In order to determine the present value of this estimated excess cash flow, the Company currently applies a discount rate of 18% to the projected cash flows on the unrated classes of securities. The annual prepayment rate of the securitized loans is a function of full and partial prepayments and defaults. The Company makes assumptions as to the prepayment rates of the underlying loans, which the Company believes are reasonable, in estimating fair values of the subordinate securities and residual securities retained. During 1999, the Company utilized proprietary prepayment curves (reaching an approximate range of annualized rates of 10.0% - 45.0 %). In its estimates of annual loss rates, the Company utilizes assumptions that it believes are reasonable. During 1999, the Company estimated annual losses of between 0.60 % and 6.85 % of the unpaid principal balance of the underlying loans.
Subordinate and residual interests are affected by the rate and timing of payments of principal (including prepayments, repurchase, defaults and liquidations) on the mortgage loans underlying a series of mortgage-related securities. The rate of principal payments may vary significantly over time depending on a variety of factors, such as the level of prevailing mortgage loan interest rates and economic, demographic, tax, legal and other factors. Prepayments on the mortgage loans underlying a series of mortgage-related securities are generally allocated to the more senior classes of mortgage-related securities. Although in the absence of defaults or interest shortfalls all subordinates receive interest, amounts otherwise allocable to residuals generally are used to make payments on more senior classes or to fund a reserve account for the protection of senior classes until overcollateralization or the balance in the reserve account reaches a specified level. In periods of declining interest rates, rates of prepayments on mortgage loans generally increase, and if the rate of prepayments is faster than anticipated, then the yield on subordinates will be positively affected and the yield on residuals will be negatively affected.
The credit risk of mortgage related securities is affected by the nature of the underlying mortgage loans. In this regard, the risk of loss on securities backed by commercial and multi-family loans and single family residential loans made to borrowers who, because of prior credit problems, the absence of a credit history or other factors, are unable or unwilling to qualify as borrowers under guidelines established by the Federal Home Loan Mortgage Corporation ("FHLMC") and the Federal National Mortgage Association ("FNMA") for purchases of loans by such agencies generally involve more risk than securities backed by single family residential loans which conform to the requirements established by FHLMC and FNMA for their purchase by such agencies.
The Company adjusts its securities portfolio to market value at the end of each month generally based upon the lower of dealer quotations or internal values, subject to an internal review process. For those securities which do not have an available market quotation, the Company will request market values and underlying assumptions from the various securities dealers that underwrote, are currently financing the securities, or have had prior experience with the type of security to be valued.
The Company periodically assesses the carrying value of its subordinate securities and residual securities retained as well as the servicing assets for impairment. There can be no assurance that the Company's estimates used to determine the gain on securitized loan sales, subordinate securities and residual securities retained and servicing asset valuations will remain appropriate for the life of each securitization. If actual loan prepayments or defaults exceed the Company's estimates, the carrying value of the Company's subordinate securities and residual securities retained and/or servicing assets may be decreased during the period management recognized the disparity. Other factors may also result in a write-down of the Company's subordinate securities and residual securities in subsequent periods.
34

It is intended that any securities retained by Ocwen Federal Bank FSB (the "Bank") resulting from the securitization of assets held by it directly will be distributed to the Company as a dividend, subject to the Bank's ability to declare such dividends under applicable limitations. During 1999, subordinate securities with a fair value of $27.7 million were distributed to the Company in the form of dividend. At December 31, 1999, the Bank held no subordinate securities.
Under a regulatory bulletin issued by the OTS, a federally-chartered savings institution such as the Bank generally may invest in "high risk" mortgage securities only to reduce its overall interest rate risk and after it has adopted various policies and procedures, although under specified circumstances such securities also may be acquired for trading purposes. A "high risk" mortgage security for this purpose generally is any mortgage-related security which meets one of three tests which are intended to measure the average life or price volatility of the security in relation to a benchmark fixed rate, 30-year mortgage-backed pass-through security. At December 31, 1999, the Bank held no mortgage-related securities which are classified as "high-risk" mortgage securities by the OTS.
The following tables detail the Company's securities available for sale portfolio at December 31, 1999, and its estimates of expected yields on such securities, taking into consideration expected prepayment and loss rates together with other factors.
35
ANTICIPATED SUBORDI- YIELD TO PROSPECTIVE CLASS SIZE NATION/OC MATURITY AT YIELD TO ISSUE RATING ----------------- INTEREST LEVEL AT: ----------------- MATURITY AT: SECURITIZATION (ISSUER) SECURITY DATE RATING AGENCIES ISSUANCE 12/31/99 PERCENTAGE 12/31/99 PURCHASE 12/31/99 12/31/99 ----------------------- -------- ----- ------ -------- -------- -------- ---------- -------- -------- -------- ------------ SINGLE-FAMILY RESIDENTIAL Subordinates: (Dollars in Thousands) BCF 1996 R1(5) ........ B3 Oct-96 UR (a),(b) $ 70,773 $ 42,455 50.00% None 15.70% 10.96% 33.95% BCF 1997 R1(5) ........ B4 Mar-97 UR (b),(c) 21,784 7,508 49.71 None 13.46 (38.03) 12.73 BCF 1997 R2 (5) ....... B4 Jun-97 Ba2,BB (b),(c) 6,358 5,748 73.54 7.65% 9.58 9.13 41.08 B5 B2,B 6,264 5,664 73.54 3.93 10.74 (9.53) 126.54 B6 UR 13,883 5,999 73.54 None 15.98 3.81 N/A BCF 1997 R3 (5) ....... B4 Dec-97 UR (b),(d) 69,582 37,163 50.24 None 15.84 (40.09) 19.87 ORMBS 1998 R1 (6) ..... B4 Mar-98 UR (b),(d) 101,774 73,828 50.34 None 20.50 (37.93) 7.16 ORMBS 1998 R2 (6) ..... B4A Jun-98 Ba2 (b) 1,056 976 100.00 6.24 13.22 7.59 59.33 B4F Ba2 937 888 100.00 7.55 19.23 3.62 35.05 B5A B2 880 844 100.00 4.58 23.78 2.76 101.86 B5F B2 937 888 100.00 5.36 11.78 2.13 46.87 B6A UR 3,696 2,326 100.00 None 16.72 20.81 335.21 B6F UR 3,345 2,164 100.00 None 19.50 6.60 149.65 ORMBS 1998 R3 (6) ..... B4 Sep-98 Ba2,BB (b),(d) 11,765 486 85.87 10.61 11.71 (36.33) 0.29 B5 B2,B 9,151 8,933 85.87 6.74 16.54 (31.65) 77.18 B6 UR 26,145 15,550 85.87 None 18.00 (21.75) 281.69 ORMBS 1999 RI (6) .... B5A Mar-99 B2,B (b),(d) 1,630 1,551 100.00 5.72 17.73 28.05 19.52 B5F B2,B 1,843 1,698 100.00 5.50 17.74 28.10 23.62 B6A UR 3,586 3,165 100.00 None 18.00 54.86 44.43 B6F UR 4,299 3,866 100.00 None 18.00 67.99 75.48 ORMBS 1999 R2 (6) ..... B4 Jun-99 BB ( a),(c),(d) 10,530 10,359 100.00 10.12 13.45 23.19 18.27 B5 B 4,680 4,604 100.00 5.96 18.45 51.72 55.26 B6 UR 7,020 6,580 100.00 None 18.00 122.07 188.99 CSFB 1996-1R (ITT 94-P1) (7) ....... 4B2 Oct-96 UR (b),(c) 1,046 162 100.00 None N/A N/A N/A Subprime residuals: SBMS 1996 3 (1) ....... R Jun-96 UR (a),(b) 130,062 32,516 100.00 16.10 OC 15.52 2.01 20.97 MLM1 1996 1 (2) ....... R Sep-96 UR (a),(b) 81,142 19,646 100.00 24.49 OC 15.16 3.07 22.97 MS 1997 1 (3).......... X1 Jun-97 UR (a),(b) 17,727 11,211 100.00 5.14 OC 21.47 17.91 24.41 X2 87,118 24,106 100.00 13.53 OC 20.38 2.21 17.15 1997 OFS 2 (4)......... X Sep-97 UR (a),(b) 102,201 38,582 100.00 8.85 OC 19.65 4.17 18.00 1997 OFS 3 (4)......... X Dec-97 UR (a),(b) 208,784 99,063 100.00 9.17 OC 19.59 8.50 10.67 1998 OFS 1 (4)......... X Mar-98 UR (b),(d) 161,400 91,000 100.00 3.04 OC 18.00 5.65 3.25 1998 OFS 2 (4)......... X Jun-98 UR (a),(b) 382,715 191,982 100.00 6.99 OC 19.46 1.18 14.12 1998 OFS 3 (4)......... X Sep-98 UR (a),(d) 261,649 192,656 100.00 4.21 OC 18.00 7.97 9.02 1998 OFS 4 (4)......... X Dec-98 UR (a ),(b),(c) 349,000 298,920 100.00 3.59 OC 18.00 6.61 21.92 1999 OFS 1 (4) ........ X Jun-99 UR (a),(b) 148,628 141,591 100.00 3.95 OC 18.00 16.58 17.32 SASCO 1998-2(11) ...... X Jan-98 UR S&P, Fitch 600,052 284,235 100.00 1.85 OC 16.00 1.26 17.62 SASCO 1998-3(11) ...... X Mar-98 UR S&P, Fitch 769,671 405,880 100.00 3.32 OC 17.04 3.29 17.48 MLMI 1998-FF 1(2) ..... X Jun-98 UR S&P, Fitch 198,155 109,319 100.00 2.72 OC 18.57 10.12 18.60 PANAM 1997-1(12) ...... X Dec-97 UR S&P, 113,544 52,615 100.00 8.48 OC 22.45 3.39 18.38 Moody's Prepay Pen. UR 100.00 25.69 13.58 (7.25) LHELT 1998-2 (13) ..... X Jun-98 UR Mo ody's, Fitch 209,225 128,873 100.00 6.11 OC 18.55 17.17 38.78

36
ANTICIPATED SUBORDI- YIELD TO PROSPECTIVE CLASS SIZE NATION/OC MATURITY AT YIELD TO ISSUE RATING ----------------- INTEREST LEVEL AT: ----------------- MATURITY AT: SECURITIZATION (ISSUER) SECURITY DATE RATING AGENCIES ISSUANCE 12/31/99 PERCENTAGE 12/31/99 PURCHASE 12/31/99 12/31/99 ----------------------- -------- ----- ------ -------- -------- -------- ---------- -------- -------- -------- ------------ EQUICON 1994-2 (14) ...B Fix, B-2 Oct-94 UR S& P, Moody's, 78,846 19,051 100.00 6.15 OC 18.00 103.64 29.46 Fitch QS Fix, QS-2 UR B Var., B-2 UR 32,306 4,024 100.00 25.73 OC 18.00 34.01 26.78 EQUICON 1995-1 (14) ...B Fix, B-2 May-95 UR S& P, Moody's, 70,024 13,899 100.00 12.42 OC 18.00 28.26 122.84 Fitch B Var., B-2 UR 40,519 5,833 100.00 14.76 OC 18.00 98.06 0.00 EQUICON 1995-2 (14) ...B Fix, B-2 Oct-95 UR S&P, 79,288 19,589 100.00 14.22 OC 18.00 33.28 116.83 Moody's B Var., B-2 UR 39,667 5,674 100.00 15.65 OC 18.00 83.76 81.90
CLASS SIZE ISSUE R ATING ---------------------- SECURITIZATION (ISSUER) SECURITY DATE RATING AG ENCIES ISSUANCE 12/31/99 ----------------------- -------- ----- ------ -- ------ -------- -------- (Dollars in Thousands) SINGLE-FAMILY RESIDENTIAL ACCESS 1996-1 (15).. B Fix, B-2 Feb-96 UR S& P, Moody's $ 120,015 $ 31,984 B Var., B-2 UR 55,362 9,190 ACCESS 1996-2 (15).. B-I, B-1 May-96 UR S& P, Moody's 142,259 41,243 BI-S, BI-S-1 UR B-II, B-1 UR 68,345 10,792 BII-S, BII-S-1 UR ACCESS 1996-3 (15).. B-I, B-1 Aug-96 UR S& P, Moody's 107,712 31,768 BI-S, BI-S-1 UR B-II, B-1 UR 99,885 16,411 BII-S, BII-S-1 UR ACCESS 1996-4 (15).. B, B-1 Nov-96 UR S& P, Moody's 239,778 57,446 B-S, B-S-1 UR ACCESS 1997-1 (15).. B, B-1 Feb-97 UR S& P, Moody's 276,442 84,271 B-S, B-S-1 UR ACCESS 1997-2 (15).. B, B-1 May-97 UR S& P, Moody's 185,197 57,774 B-S, B-S-1 UR ACCESS 1997-3 (15).. B, B-1 Oct-97 UR S& P, Moody's 199,884 67,973 B-S, B-S-1 UR OCWEN 98-OAC 1 (16). N/A Nov-98 UR S& P, Moody's 182,178 112,600 CMR1 (17)........... Deferred Comp Apr-96 UR S& P, Duff 47,802(9) 19,180(19) CMR2 (17)........... Deferred Comp Nov-96 UR S& P, Duff, 106,692(18) 41,120(19) Fitch CMR3 (17)........... Deferred Comp Nov-96 UR S& P, Duff, 195,610(18) 79,196(19) Fitch CMR4 (17)........... Deferred Comp Feb-97 UR S& P, Duff, 108,630(18) 49,803(19) Fitch CMR6 (17)........... Deferred Comp May-97 UR S& P, Duff, 91,442(18) 41,745(19) Fitch MULTI-FAMILY RESIDENTIAL Subordinates: SBMS 1997-HUD1 (20). B5 Apr-97 B2, Mo ody's, 9,785 9,271 n.a. DC R B6 Apr-97 UR 16,998 4,185 ORMBS 1998-R1 (21).. B4 Mar-98 UR Mo ody's, 101,774 73,828 DC R GECMS 1994-12 (22).. B4 Mar-94 UR Mo ody's, 2,069 1,395 Fi tch, S&P FNMA 1995 M2 (3).... M Jun-95 UR (c) 100,275 --

ANTICIPATED SUBORDI- YIELD TO PROSPECTIVE NATION/OC MATURITY AT YIELD TO INTEREST LEVEL AT: - ---------------- MATURITY AT: SECURITIZATION (ISSUER) PERCENTAGE 12/31/99 P URCHASE 12/31/99 12/31/99 ----------------------- ---------- ----------- - ------- -------- ------------ SINGLE-FAMILY RESIDENTIAL (Dollars in Thou sands) ACCESS 1996-1 (15).. 100.00% 7.07% OC 18.00% 29.67% 132.43% 100.00 18.79 OC 18.00 30.75 69.90 ACCESS 1996-2 (15).. 100.00 12.95 OC 18.00 18.05 37.59 100.00 17.43 OC 18.00 14.88 38.60 ACCESS 1996-3 (15).. 100.00 16.21 OC 18.00 13.70 68.42 100.00 23.92 OC 18.00 13.11 47.43 ACCESS 1996-4 (15).. 100.00 22.73 OC 18.00 10.77 20.45 ACCESS 1997-1 (15).. 100.00 23.99 OC 18.00 10.71 25.52 ACCESS 1997-2 (15).. 100.00 16.89 OC 18.00 4.68 18.74 ACCESS 1997-3 (15).. 100.00 11.68 OC 18.00 11.92 31.71 OCWEN 98-OAC 1 (16). 100.00 16.70 OC N/A N/A N/A CMR1 (17)........... 100.00 10.70 RF 19.80 19.89 21.68 CMR2 (17)........... 100.00 11.42 RF 18.00 25.39 27.76 CMR3 (17)........... 100.00 15.44 RF 18.00 32.68 35.77 CMR4 (17)........... 100.00 7.73 RF 18.00 25.72 28.65 CMR6 (17)........... 100.00 8.11 RF 18.00 24.67 28.15 MULTI-FAMILY RESIDENTIAL Subordinates: SBMS 1997-HUD1 (20). 100.00 2.17 16.87 5.00 18.39 100.00 None 22.86 (10.06) (1.90) ORMBS 1998-R1 (21).. 100.00 None 13.75 (29.33) 8.76 GECMS 1994-12 (22).. 100.00 None 19.37 21.08 62.98 FNMA 1995 M2 (3).... 100.00 N/A 0.00 (18.50) N/A 36(a)

37
ISSUERS: (1) Salomon Brothers Mortgage Securities VII (14) Equicon Mortgage Loan Trust Rating Agencies: (2) Merrill Lynch Mortgage Investors, Inc. (15)Access Financial Mortgage Loan Trust (a) S&P (3) Morgan Stanley ABS Capital I, Inc. (16) Ocwen Residential Mortgage-Backed Securit ies (b) Moody's (4) Ocwen Mortgage Loan Asset Backed Certificates (17) City Mortgage Receivable (c) Fitch (5) BlackRock Capital Finance L.P. (18) Dollar equivalent of amounts in British (d) DCR (6) Ocwen Residential MBS Corporation pounds at the rate of exchange that (7) Ocwen Mortgage Loans prevailed at the time of Issuance. (8) Credit Suisse First Boston (ITT Federal Bank, FSB) (19) Dollar equivalent of amounts in British Other: (9) Federal National Mortgage Association pounds at the rate of exchange at 12/31/9 9 N/A - Not Available (10) Berkley Federal Bank & Trust (20) Salomon Brothers Mortgage Securities (11) Structured Asset Securities Corp. (21) Ocwen Mortgage Loan Trust. RF -Reserve funds are (12) Pan American Bank, FSB (22) GE Capital Mortgage Services, Inc. actual cash reserves
WEIGHTED WEIGHTED TOTAL ACTUAL LIFE ACTUAL LIFE AVERAGE AVERAGE DELINQUENCY TO DATE TO DATE COLLATERAL BALANCE COUPON AT LTV/DSCR AT CPR AT LOSSES AT PRODUCT TYPE AT --------------------- SECURITIZATION (ISSUER) 12/31/99 AT 12/31/99 12/31/99 12/31/99 12/31/99 12/31/99 ISSUANCE 12/31/99 ----------------------- --------- ----------- ----------- ----------- ----------- ------------ --- -------- -------- SINGLE-FAMILY RESIDENTIAL (Dollars in Thousands) Subordinates: BCF 1996 R1 (5) ........... 10.31% 96.45% 12.14% 13.93% $ 24,817 98%Fixed, 2% ARM $505,513 $287,582 BCF 1997 R1 (5) ........... 10.06 110.61 21.21 13.76 13,518 97%Fixed, 3% ARM 177,823 112,303 BCF 1997 R2 (5) ........... 8.03 84.79 25.84 13.96 6,934 25%Fixed, 75% ARM 251,790 152,507 BCF 1997 R3 (5) ........... 9.61 111.57 20.53 12.05 29,990 98%Fixed, 2% ARM 579,851 424,492 ORMBS 1998 R1 (6) ......... 8.92 119.42 23.45 9.58 23,347 98%Fixed, 2% ARM 565,411 470,738 ORMBS 1998 R2 (6) ......... 8.93 88.54 26.32 14.96 2,218 45%Fixed, 55% ARM 123,917 91,224 ORMBS 1998 R3 (6) ......... 8.95 126.34 35.86 9.37 10,335 99%Fixed, 1% ARM 261,452 230,726 ORMBS 1999 R1 (6) ......... 9.02 86.62 23.38 14.15 315 56%Fixed, 44% ARM 147,101 125,597 ORMBS 1999 R2 (6) ......... 9.38 116.16 22.06 7.67 351 100%Fixed 117,004 110,475 CSFB 1996 1R (ITT 94-P1) (7) ........... 7.26 N/A 2.66 N/A 156 100%1-Year CM T 32,487 5,274 Subprime residuals: SBMS 1996 3 (1) ........... 11.07 68.68 17.19 32.29 3,123 59%Fixed, 41% ARM 130,062 32,516 MLM1 1996 1 (2) ........... 11.33 75.21 22.05 34.98 1,825 35%Fixed, 65% ARM 81,142 19,646 MS 1997 1 (3).............. 10.54 74.80 17.81 34.90 1,521 32%Fixed, 68% ARM 17,727 11,211 11.59 74.06 17.81 34.75 1,521 32%Fixed, 68% ARM 87,118 24,106 1997 OFS 2 (4) ............ 10.99 78.58 19.20 34.75 1,790 21%Fixed, 79% ARM 102,201 38,582 1997 OFS 3 (4) ............ 10.85 78.64 20.07 30.70 2,639 19%Fixed, 81% ARM 208,784 99,063 1998 OFS 1 (4) ............ 10.39 78.76 20.20 27.55 2,674 15%Fixed, 85% ARM 161,400 91,000 1998 OFS 2 (4) ............ 10.94 75.06 16.77 36.38 4,341 41%Fixed, 59% ARM 382,715 191,982 1998 OFS 3 (4) ............ 10.35 79.11 22.13 21.25 1,479 30%Fixed, 70% ARM 261,649 192,565 1998 OFS 4 (4) ............ 10.48 76.47 24.24 13.17 1,135 42%Fixed, 58% ARM 349,000 298,920 1999 OFS 1 (4) ............ 9.88 75.44 12.34 8.61 -- 64%Fixed, 36% ARM 146,628 141,591 SASCO 1998-2(11) .......... 11.10 73.74 17.81 31.84 4,969 31%Fixed, 69% ARM 600,052 284,235 SASCO 1998-3(11) .......... 10.20 75.67 11.81 30.19 4,116 11%Fixed, 89% ARM 769,671 405,880 MLMI 1998-FF 1(2) ......... 9.39 77.63 10.94 30.85 200 100% ARM 198,155 109,319 PANAM 1997-1(12) .......... 10.93 81.93 21.45 31.95 2,828 100% ARM 113,544 52,615 LHELT 1998-2 (13) ......... 10.08 75.81 12.08 25.87 593 43% Fixed, 57 % ARM 209,225 128,873 EQUICON 1994-2 (14) ....... 9.95 71.91 20.67 32.87 1,228 100% Fixed 78,846 19,051 10.97 81.97 100% ARM 32,306 4,024 EQUICON 1995-1 (14) ....... 12.00 70.36 33.41 31.39 2,621 100% Fixed 70,024 13,899 11.73 75.54 100% ARM 40,519 5,833 EQUICON 1995-2 (14) ....... 10.79 75.01 33.54 35.24 2,420 100% Fixed 79,288 19,589 11.42 73.25 100% ARM 39,667 5,674 ACCESS 1996-1 (15) ........ 10.82 75.05 29.93 33.70 3,137 100% Fixed 120,015 31,984 11.47 77.21 100% ARM 55,362 9,190 ACCESS 1996-2 (15) ........ 11.01 76.00 30.15 34.99 4,174 100% Fixed 142,259 41,243 11.63 78.09 100% ARM 68,345 10,792 ACCESS 1996-3 (15) ........ 11.43 78.12 38.15 37.86 3,283 100% Fixed 107,712 31,768 11.68 79.41 100% ARM 99,885 16,411 ACCESS 1996-4 (15) ........ 11.97 78.04 39.15 39.27 4,428 51%Fixed, 49% ARM 239,778 57,446 ACCESS 1997-1 (15) ........ 11.56 80.71 38.27 37.95 6,874 58%Fixed, 42% ARM 276,442 84,271 ACCESS 1997-2 (15) ........ 11.50 79.62 34.73 40.32 3,153 54%Fixed, 46% ARM 185,197 57,774 ACCESS 1997-3 (15) ........ 11.40 81.39 32.94 41.03 2,400 50%Fixed, 50% ARM 199,884 67,973 OCWEN 98 - OAC 1 (16) ..... 8.65 80.30 6.16 33.22 181 26% Fixed, 74 % ARM 182,178 112,600

The following table sets forth the principal amount of mortgage loans by the geographic location of the property securing the mortgages that underlie the Company's subordinated and residual securities available for sale at December 31, 1999.
(1) No other individual state makes up more than 8% of the total of other.
(2) Based on a percentage of the total unpaid principal balance of the underlying loans.
(1) Changes in the December 31, 1999 anticipated yield to maturity from that originally anticipated are primarily the result of changes in prepayment assumptions, loss assumptions and charges taken to reduce the value of the securities.
(2) Equals the weighted average life based on the December 31, 1999 book value.
38
WEIGHTED WEIGHTED TOTAL ACTUAL LIFE ACTUAL LIFE AVERAGE AVERAGE DELINQUENCY TO DATE TO DATE COLLATERAL BALANCE COUPON AT LTV/DSCR AT CPR AT LOSSES AT PRODUCT TYPE AT ------------------------ SECURITIZATION (ISSUER) 12/31/99 AT 12/31/99 12/31/99 12/31/99 12/31/99 12/31/99 ISSUANCE 12/31/99 ----------------------- --------- ----------- ----------- ----------- ----------- ------------ --- -------- -------- CMR1 (17).................. 13.37 N/A 38.12 22.60 814 100% Amortizi ng 47,802(9) 19,180(10) CMR2 (17).................. 12.55 N/A 27.60 24.03 1,548 89.86% Amort 10.14% 106,692(9) 41,120(10) IO mortgages CMR3 (17).................. 13.49 N/A 16.39 20.45 2,917 62.25% Amort 27.75% 195,610(9) 79,196(10) IO mortgages CMR4 (17).................. 13.71 N/A 35.73 22.28 1,548 89.05% Amort 10.95% 108,630(9) 49,803(10) IO mortgages CMR6 (17).................. 13.58 N/A 34.48 24.42 1,063 95.61% Amort 4.39% 91,442(9) 41,745(10) IO mortgages MULTI-FAMILY RESIDENTIAL Subordinates: FNMA 1995 M2 (3) FNMA ..... 9.57 1.35(9 ) -- 12.59 -- 100% Multi-fa mily 216,797 116,413 SBMS 1997-HUD1 (20) ....... 9.79 105.16 11.29 15.85 12,106 97%Fixed 326,147 192,444 ORMBS 1998-R1 (21) ........ 8.92 119.47 23.45 9.58 23,347 98%Fixed 565,411 224,138 GECMS 1994-12 (22) ....... 6.81 45.30 0.24 8.50 -- 100%Fixed 516,732 470,738
DESCRIPTION CALIFORNIA FLO RIDA TEXAS NEW YORK MARYLAND OTHER (1) TOTAL ----------- ---------- ---- ----- --------- --------- --------- ---------- ---------- (Dollars in Thousands) Single family residential....... $ 700,551 $ 31 0,405 $ 295,445 $ 206,948 $ 173,786 $2,063,916 $3,751,051 Multi-family and commercial..... 1,037 -- -- 62 -- 1,699 2,798 Other .......................... 48,217 2 3,137 4,685 27,003 9,763 114,844 227,649 --------- ---- ----- --------- --------- --------- ---------- ---------- Total .......................... $ 749,805 $ 33 3,542 $ 300,130 $ 234,013 $ 183,549 $2,180,459 $3,981,498 ========= ==== ===== ========= ========= ========= ========== ========== Percentage (2).................. 19% 8% 7% 6% 5% 55% 100% ========= ==== ===== ========= ========= ========= ========== ==========
ANTICIPATED ORIGINAL ANTICIPATED WEIGHTED ANTICIPATED YIELD TO AT AVERAGE PROSPECTIVE AMORTIZED PERCENT YIELD TO MATURITY AT REMAINING YIELD AT RATING/DESCRIPTION COST FAIR VA LUE OWNED MATURITY 12/31/99 (1) COUPON LIFE (2) 12/31/99 ------------------------------ ---------- ------- --- ------- ----------- ------------- ------ ------------ ----------- (Dollars in Thousands) SINGLE-FAMILY RESIDENTIAL: BB-rated subordinates.... $ 4,697 $ 5,9 08 87.98% 13.15% (1.24)% 6.92 % 3.06 22.77% B-rated subordinates..... 5,380 6,9 08 95.50 16.84 7.87 7.49 2.66 42.69 Unrated subordinates..... 15,790 17,2 87 52.75 14.48 (11.38) 8.01 2.70 115.44 Unrated subprime 125,452 124,0 87 99.50 18.33 12.52 N/A 5.82 22.15 residuals.................... MULTI-FAMILY AND COMMERCIAL: BB-rated subordinates.... 38,234 38,2 34 100.00 8.50 8.50 7.37 3.33 12.02 Unrated subordinates..... 3,503 3,5 03 100.00 22.15 14.36 0.00 3.16 10.75 Unrated interest only.... -- 14 N/A -- -- -- N/A N/A --------- ------- -- $ 193,056 $ 195,1 31 ========= ======= ==

The following is a glossary of terms included in the above tables.
ACTUAL LIFE TO DATE CPR - The Constant Prepayment Rate is used to measure the average prepayment rate for the underlying mortgage pool(s) over the period of time lapsed since the issuance of the securities through the date indicated and is calculated as follows:
ACTUAL LIFE-TO-DATE LOSSES - Represents cumulative losses of the original collateral at the indicated date.
ANTICIPATED YIELD TO MATURITY AT DECEMBER 31, 1999 - Effective yield based on the purchase price, actual cash flows received from inception until the respective date, and the then current estimate of future cash flows under the assumptions at the respective date.
ANTICIPATED YIELD TO MATURITY AT PURCHASE - Effective yield from inception to maturity based on the purchase price and anticipated future cash flows under pricing assumptions.
CLASS SIZE - Represents the dollar size of a particular class. Class Size for subprime residuals is equal to the Collateral Balance at the respective date.
COLLATERAL BALANCE - Represents, the unpaid principal balance including arrearage of the underlying collateral of the entire securities at the indicated date.
INTEREST ONLY - Interest Only ("IO") securities receive the excess interest remaining after the interest payments have been made on all senior classes of bonds based on their respective principal balances. There is no principal associated with IO securities and they are considered liquidated when the particular class they are contractually tied to is paid down to zero.
INTEREST PERCENTAGE - Represents the percentage of the particular class of security owned by the Company.
ISSUE DATE - Represents the date on which the indicated securities were issued.
OVER-COLLATERIZATION LEVEL - For residual interest in residential mortgage-backed securities, over collaterization ("OC") is the amount by which the collateral balance exceeds the sum of the bond principal amounts. OC is achieved by applying monthly a portion of the interest payments of the underlying mortgages toward the reduction of the class certificate principal amounts, causing them to amortize more rapidly than the aggregate loan balance. The OC percentage, expressed as a percentage of the outstanding collateral balance, represents the first tier of loss protection afforded to the non-residual holders. The OC percentage also determines whether the over-collaterization target has been satisfied as of a specific date, such that cash flows to the residual holder are warranted. To the extend not consumed by losses on more highly rated bonds, OC is remitted to the residual holders.
PROSPECTIVE YIELD - Effective yield based on the amortized cost of the investment, after impairments, and the then current estimate of the future cash flows under the assumptions at the respective date.
RATING - Refers to the credit rating designated by the rating agency for each securitization transaction. Classes designated "A" have a superior claim on payment to those rated "B", which are superior to those rated "C." Additionally, multiple letters have a superior claim to designations with fewer letters. Thus, for example, "BBB" is superior to "BB," which in turn is superior to "B." The lower class designations in any securitization will receive interest payments subsequent to senior classes and will experience losses prior to any senior class. The lowest potential class designation is not rated ("UR") which, if included in a securitization, will always receive interest last and experience losses first.
SECURITIZATION - Series description.
SECURITY - Represents the name of the class associated with each securitization held by the Company. This has no relationship to a formal rating but is for identification purposes (although the names are usually in alphabetical or numeric order from the highest rated to the lowest rated).
39
Actual Life to Date CPR = 100 x [(1 - Final Agg regate Balance actual ) x ( 12 ) ] [( ---------- --------------------------- ) (--------------- ) ] [( Final Agg regate Balance scheduled ) (months in period) ]

SUBORDINATION LEVEL - Represents the credit support for each mortgage-backed security by indicating the percentage of outstanding bonds whose right to receive payment is subordinate to the referenced security. The subordinate classes must experience a complete loss before any additional losses would affect the particular referenced security.
TOTAL DELINQUENCY - Represents the total unpaid principal balance of loans more than 30 days delinquent at the indicated date as a percentage of the unpaid principal balance of the collateral at such date.
WEIGHTED AVERAGE COUPON - Represents the interest rate of the underlying mortgage loans weighted by the unpaid principal balance of the underlying mortgage loans at the respective date.
WEIGHTED AVERAGE DSCR - Represents debt service coverage ratio, which is calculated by dividing cash flow available for debt service by debt service and applies to the multi-family and commercial securities.
WEIGHTED AVERAGE LTV - Represents the ratio of the unpaid principal balance including arrearage to the value of the underlying collateral and applies to the single-family residential securities.
LOANS AVAILABLE FOR SALE. Loans which the Company presently does not intend to hold to maturity are designated as available for sale and are carried at the lower of cost or aggregate market value. Loans available for sale, which are comprised primarily of subprime single family residential loans, decreased by $132.6 million or 75% during 1999. The decrease in 1999 reflects the closure of the Company's domestic subprime origination business in August 1999 and the sale of Ocwen UK on September 30, 1999.
COMPOSITION OF LOANS AVAILABLE FOR SALE. The following table sets forth the composition of the Company's loans available for sale by type of loan at the dates indicated.
ACTIVITY IN LOANS AVAILABLE FOR SALE. The following table sets forth the activity in the Company's net loans available for sale during the periods indicated:
(1) Includes $292.8 million purchased during 1998 from the U.S. operations of Cityscape Financial Corp. and $421.3 million purchased from the UK operations of Cityscape Financial Corp.
40
December 31, -------- --------------------------------------------------- ---------------- 1999 1998 1997 1996 1995 -------- --- ----------- ----------- ----------- ----------- (Dollars in Thousands) Single family residential loans...... $ 45, 084 $ 177,578 $ 176,554 $ 111,980 $ 221,927 Multi-family residential loans....... -- -- -- 13,657 28,694 Consumer loans....................... 129 269 487 729 1,169 -------- --- ----------- ----------- ----------- ----------- $ 45, 213 $ 177,847 $ 177,041 $ 126,366 $ 251,790 ======== === =========== =========== =========== ===========
Year ended December 31, -- --------------------------------------------------- ----------------------------- 1999 1998 1997 1996 1995 -- ---------- ------------ ------------ ------------ ------------ (Dollars in Thousands) Balance at beginning of period............... $ 177,847 $ 177,041 $ 126,366 $ 251,790 $ 102,293 Purchases: Single family residential (1)................ 47,129 795,053 278,081 284,598 230,077 Multi-family residential..................... -- -- -- 10,456 10,056 -- ---------- ------------ ------------ ------------ ------------ 47,129 795,053 278,081 295,054 240,133 -- ---------- ------------ ------------ ------------ ------------ Originations: Single family residential (2)............. 728,509 959,105 316,101 9,447 360 Multi-family residential.................. -- -- -- -- 24,810 -- ---------- ------------ ------------ ------------ ------------ 728,509 959,105 316,101 9,447 25,170 -- ---------- ------------ ------------ ------------ ------------ Sales (3) (4)................................ (865,959) (1,658,773) (501,079) (395,999) (100,104) Decrease (increase) in lower of cost or market valuation allowance ................ 1,282 (4,064) (1,034) (2,455) (118) Loans transferred (to)/from loan portfolio .. -- -- (13,674) 45 (4,353) Principal repayments, net of capitalized interest (30,314) (82,728) (22,151) (27,845) (11,231) Transfer to real estate owned................ (13,281) (7,787) (5,569) (3,671) -- -- ---------- ------------ ------------ ------------ ------------ Net increase (decrease) in loans............. (132,634) 806 50,675 (125,424) 149,497 -- ---------- ------------ ------------ ------------ ------------ Balance at end of period..................... $ 45,213 $ 177,847 $ 177,041 $ 126,366 $ 251,790 == ========== ============ ============ ============ ============

(2) Includes $509.8 million and $254.3 million originated by Ocwen UK during 1999 and 1998, respectively.
(3) Includes $297.5 million related to the sale of Ocwen UK on September 30, 1999.
(4) Includes securitizations of domestic and foreign subprime single family residential loans. See "Results of Operations - Non-interest Income."
The following table presents a summary of the Company's non-performing loans in the loans available for sale portfolio at the dates indicated:
(1) Includes $7.2 million related to Ocwen UK at December 31, 1998.
Non-performing loans available for sale consist primarily of subprime single family residential loans, reflecting the higher risk associated with such loans. See Note 6 to the Consolidated Financial Statements.
LOAN PORTFOLIO, NET. Loans held for investment in the Company's loan portfolio are carried at amortized cost, less an allowance for loan losses, because the Company has the ability and presently intends to hold them to maturity. The Company's net loan portfolio decreased by $72.9 million or 32% during 1999 reflecting the continuing payoff of multi-family and commercial loans and the Company's decision effective June 30, 1999 to cease origination of such loans. The decline was offset in part by the acquisition of loans, primarily multi-family residential and commercial real estate, as a result of the acquisition of OAC.
COMPOSITION OF LOAN PORTFOLIO The following table sets forth the composition of the Company's loan portfolio by type of loan at the dates indicated.
41
December 31, -------- --------------------------------------------------- 1999 1998 1997 1996 1995 ------- ------- ---------- ---------- --------- (Dollars in Thousands) Non-performing loans: Single family loans (1) ............. $15,319 $39,415 $ 13,509 $ 14,409 $ 7,833 Consumer loans ...................... 1 9 25 36 100 ------- ------- ---------- ---------- --------- $15,320 $39,424 $ 13,534 $ 14,445 $ 7,933 ======= ======= ========== ========== ========= Non-performing loans as a percentage of: Total loans available for sale ...... 33.88% 22.17% 7.64% 11.43% 3.15 % Total assets ........................ 0.46% 1.19% 0.44% 0.58% 0.58 %
December 31, ------ --------------------------------------------------- ----------------- 199 9 1998 1997 1996 1995 ------ ----- ----------- ----------- ---------- - ----------- (Dollars in Thousands) Single family residential loans......... $ 4,334 $ 30,361 $ 46,226 $ 73,18 6 $ 75,928 Multi-family residential loans: Permanent........................... 2 3,430 53,311 38,105 31,25 2 41,306 Construction........................ 5 7,936 22,288 33,277 36,59 0 7,741 ------ ----- ----------- ----------- ---------- - ----------- Total multi-family residential... 8 1,366 75,599 71,382 67,84 2 49,047 ------ ----- ----------- ----------- ---------- - ----------- Commercial real estate: Hotels: Permanent........................ -- 29,735 64,040 173,94 7 125,791 Construction..................... 3 8,645 6,896 25,322 26,36 4 -- ------ ----- ----------- ----------- ---------- - ----------- 3 8,645 36,631 89,362 200,31 1 125,791 Office buildings................... 6 4,745 93,068 68,759 128,78 2 61,262 Land............................... 2,238 2,266 2,858 2,33 2 24,904 Other.............................. -- 6,762 16,094 25,62 3 2,494 ------ ----- ----------- ----------- ---------- - ----------- Total commercial real estate..... 10 5,628 138,727 177,073 357,04 8 214,451 Commercial nonmortgage.................. -- -- -- 2,61 4 -- Consumer................................ 82 132 244 42 4 3,223 ------ ----- ----------- ----------- ---------- - ----------- Total loans........................ 19 1,410 244,819 294,925 501,11 4 342,649 Undisbursed loan proceeds............... (2 4,654) (7,099) (22,210) (89,84 0) (39,721) Unamortized deferred fees............... ( 2,089) (2,480) (2,721) (5,16 9) (5,376) Allowance for loan losses............... ( 7,259) (4,928) (3,695) (3,52 3) (1,947) ------ ----- ----------- ----------- ---------- - ------------ Loans, net......................... $ 15 7,408 $ 230,312 $ 266,299 $ 402,58 2 $ 295,605 ====== ===== =========== =========== ========== = ===========
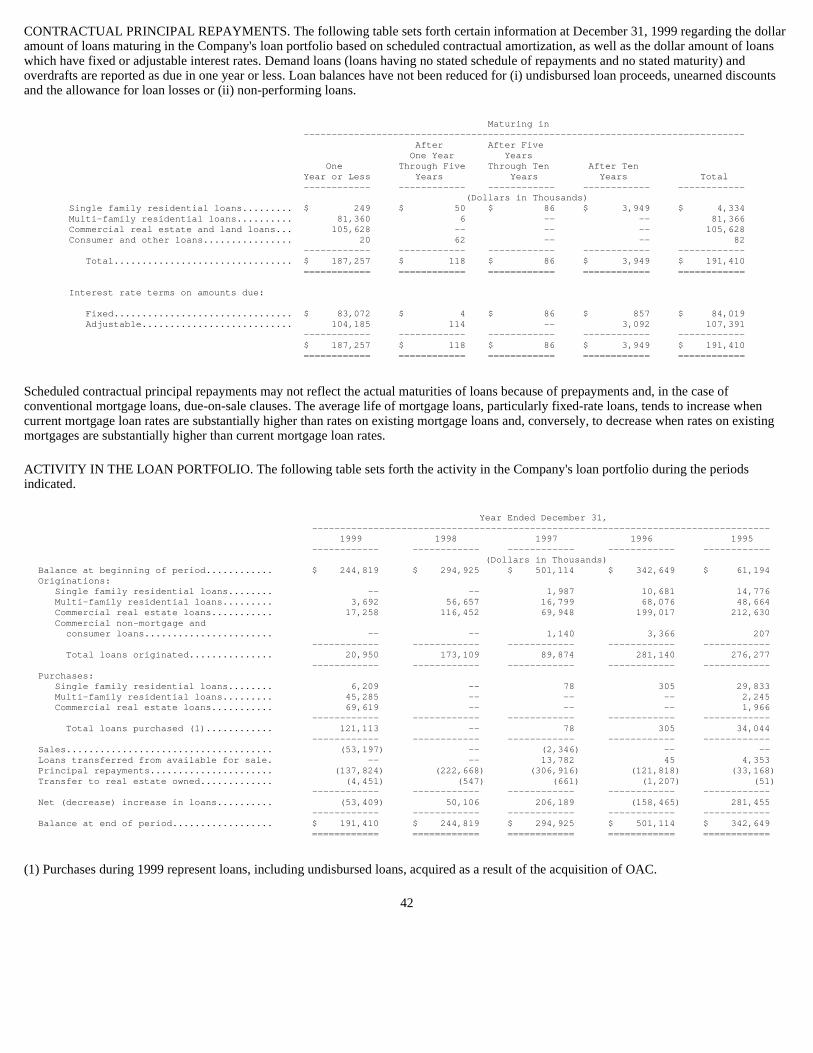
CONTRACTUAL PRINCIPAL REPAYMENTS. The following table sets forth certain information at December 31, 1999 regarding the dollar amount of loans maturing in the Company's loan portfolio based on scheduled contractual amortization, as well as the dollar amount of loans which have fixed or adjustable interest rates. Demand loans (loans having no stated schedule of repayments and no stated maturity) and overdrafts are reported as due in one year or less. Loan balances have not been reduced for (i) undisbursed loan proceeds, unearned discounts and the allowance for loan losses or (ii) non-performing loans.
Scheduled contractual principal repayments may not reflect the actual maturities of loans because of prepayments and, in the case of conventional mortgage loans, due-on-sale clauses. The average life of mortgage loans, particularly fixed-rate loans, tends to increase when current mortgage loan rates are substantially higher than rates on existing mortgage loans and, conversely, to decrease when rates on existing mortgages are substantially higher than current mortgage loan rates.
ACTIVITY IN THE LOAN PORTFOLIO. The following table sets forth the activity in the Company's loan portfolio during the periods indicated.
(1) Purchases during 1999 represent loans, including undisbursed loans, acquired as a result of the acquisition of OAC.
42
Maturing in --------- --------------------------------------------------- ------------------- After After Five One Year Years One Through Five Through Ten After Ten Year or L ess Years Years Years Total --------- --- ------------ ------------ ---------- -- ------------ (Dollars in Thousands) Single family residential loans......... $ 249 $ 50 $ 86 $ 3,9 49 $ 4,334 Multi-family residential loans.......... 81, 360 6 -- -- 81,366 Commercial real estate and land loans... 105, 628 -- -- -- 105,628 Consumer and other loans................ 20 62 -- -- 82 --------- --- ------------ ------------ ---------- -- ------------ Total................................ $ 187, 257 $ 118 $ 86 $ 3,9 49 $ 191,410 ========= === ============ ============ ========== == ============ Interest rate terms on amounts due: Fixed................................ $ 83, 072 $ 4 $ 86 $ 8 57 $ 84,019 Adjustable........................... 104, 185 114 -- 3,0 92 107,391 --------- --- ------------ ------------ ---------- -- ------------ $ 187, 257 $ 118 $ 86 $ 3,9 49 $ 191,410 ========= === ============ ============ ========== == ============
Year Ended December 31, -- --------------------------------------------------- ----------------------------- 1999 1998 1997 1996 1995 -- ---------- ------------ ------------ ------------ ------------ (Dollars in Thousands) Balance at beginning of period............ $ 244,819 $ 294,925 $ 501,114 $ 342,649 $ 61,194 Originations: Single family residential loans........ -- -- 1,987 10,681 14,776 Multi-family residential loans......... 3,692 56,657 16,799 68,076 48,664 Commercial real estate loans........... 17,258 116,452 69,948 199,017 212,630 Commercial non-mortgage and consumer loans....................... -- -- 1,140 3,366 207 -- ---------- ------------ ------------ ------------ ------------ Total loans originated............... 20,950 173,109 89,874 281,140 276,277 -- ---------- ------------ ------------ ------------ ------------ Purchases: Single family residential loans........ 6,209 -- 78 305 29,833 Multi-family residential loans......... 45,285 -- -- -- 2,245 Commercial real estate loans........... 69,619 -- -- -- 1,966 -- ---------- ------------ ------------ ------------ ------------ Total loans purchased (1)............ 121,113 -- 78 305 34,044 -- ---------- ------------ ------------ ------------ ------------ Sales..................................... (53,197) -- (2,346) -- -- Loans transferred from available for sale. -- -- 13,782 45 4,353 Principal repayments...................... (137,824) (222,668) (306,916) (121,818) (33,168) Transfer to real estate owned............. (4,451) (547) (661) (1,207) (51) -- ---------- ------------ ------------ ------------ ------------ Net (decrease) increase in loans.......... (53,409) 50,106 206,189 (158,465) 281,455 -- ---------- ------------ ------------ ------------ ------------ Balance at end of period.................. $ 191,410 $ 244,819 $ 294,925 $ 501,114 $ 342,649 == ========== ============ ============ ============ ============

The following table sets forth certain information relating to the Company's non-performing loans in its loan portfolio at the dates indicated:
(1) Non-performing multi-family residential loans at December 31, 1999 were primarily attributable to 14 loans with an aggregate balance of $11.0 million, all of which management believes are well collateralized.
(2) Non-performing commercial real estate loans at December 31, 1999 were primarily attributable to 13 loans with an aggregate balance of $19.4 million, all of which management believes are well collateralized.
(3) Total loans is net of undisbursed loan proceeds.
For further information on the Company's loan portfolio, see Note 7 to the Consolidated Financial Statements (which is incorporated herein for reference).
MATCH FUNDED LOANS AND SECURITIES. At December 31, 1999, the Company held $105.1 million of single family residential match funded loans acquired as a result of the OAC acquisition. These loans were previously securitized and transferred by OAC to a real estate mortgage investment conduit on November 13, 1998. The transfer did not qualify as a sale under SFAS No. 125, "Accounting for Transfers and Servicing of Financial Assets and Extinguishments of Liabilities." Accordingly, the proceeds received from the transfer are reported as a liability (bonds-match funded agreements).
The $105.1 million of match funded loans at December 31, 1999 includes $1.1 million of non-performing loans and is net of an allowance for loan losses of $0.5 million.
Additionally, at December 31, 1999 the Company held $52.7 million of match funded securities resulting from the Company's transfer of four unrated residual securities to a trust on December 16, 1999 in exchange for non-recourse notes. Upon the transfer, the Company received approximately $40.1 million of proceeds. The transfer did not qualify as a sale under SFAS No. 125. Accordingly, the amount of proceeds from the transfer are reported as a liability (bonds-match funded agreements).
See "Bonds-Match Funded Agreements" and Note 9 to the Consolidated Financial Statements, (which is hereby incorporated for reference).
The following tables detail the Company's match funded securities at December 31, 1999, and its estimates of expected yields on such securities, taking into consideration expected prepayment and loss rates together with other factors.
43
December 31, --------------------------------------------------- ------------- 1999 1998 1997 1996 1995 --------- --------- --------- --------- --------- (Dollars in Thousands) Non-performing loans: Single family residential loans................. $ 982 $ 1,169 $ 1,575 $ 2,123 $ 2,923 Multi-family residential loans (1).............. 11,037 7,392 7,583 106 731 Commercial real estate and other (2)............ 19,360 488 -- 55 202 --------- --------- --------- --------- --------- Total........................................ $ 31,379 $ 9,049 $ 9,158 $ 2,284 $ 3,856 ========= ========= ========= ========= ========= Non-performing loans as a percentage of: Total loans (3)................................. 18.82% 3.81% 3.36% 0.56 % 1.27% Total assets.................................... 0.95% 0.27% 0.30% 0.09 % 0.20% Allowance for loan losses as a percentage of: Total loans(3)............................... 4.35% 2.07% 1.39% 0.87 % 0.65%(3) Non-performing loans......................... 23.13% 54.46% 40.35% 154.25 % 50.49%
ISSUE RATING COLLATERAL BALANCE OVER COLLATERIZATION LEVE L AT PRODUCT TYPE AT SECURITIZATION SECURITY DATE RATING AGENCIES ISSUANCE 12/31/99 12/31/99 12/31/99 -------------- -------- ----- ------ -------- -------- -------- ------------------------- ---- --------------- (Dollars in Thousands) SASCO 1998-21 X Jan-98 NR S&P, Fitc h $ 600,052 $ 284,235 31% Fixed, 69% ARM 1. 85% OC SASCO 1998-31 X Mar-98 NR S&P, Fitc h 769,671 405,880 11% Fixed, 89% ARM 3.32% OC MLMI 1998-FF12 X Jun-98 NR S&P, Fitc h 198,155 109,319 100% ARM 2.72% OC LHELT 1998-23 X Jun-98 NR Moody's, Fi tch 209,225 128,873 43% Fixed, 57% ARM 6.11% OC OCWEN 98-OAC-14 N/A Nov-98 NR S&P, Moody 's 182,178 112,600 26% Fixed, 74% ARM 16.70% OC

ISSUERS:
(1) Structured Asset Securities Corp. (2) Merrill Lynch Mortgage Investors, Inc. (3) Lehman Home Equity Loan Trust. (4) Ocwen Mortgage Loan Trust.
(1) Changes in the December 31, 1999 anticipated yield to maturity from that originally anticipated are primarily the result of changes in prepayment assumptions and, to a lesser extent, loss assumptions.
(2) Equals the weighted average duration based on the December 31, 1999 book value.
For a glossary of the terms included in the above tables, see "Securities Available for Sale."
DISCOUNT LOAN PORTFOLIO, NET. The discount loan portfolio decreased $113.3 million or 11% during 1999. Resolutions and repayments, loans transferred to real estate owned and sales more than offset acquisitions during the year. Substantially all of the Company's discount loan portfolio is secured by first mortgage liens on real estate.
COMPOSITION OF THE DISCOUNT LOAN PORTFOLIO The following table sets forth the composition of the Company's discount loan portfolio by type of loan at the dates indicated:
44
WEIGHTED WEIGHTED ACTUAL ACTUAL AVERAGE AVERAGE TOTAL LIFE TO DATE LIFE TO DATE ANTICIPATED YIELD TO PROSPECTIVE YIELD COUPON LTV AT: DELI NQUENCY AT: CPR AT: LOSSES AT: MATURITY AT: MATURING AT SECURITIZATION SECURITY AT: 12/31/99 12/31/99 1 2/31/99 12/31/99 12/31/99 PURCHASE 1 2/31/99 12/31/99 -------------- -------- ------------ -------- ---- ----------- -------- ------------ -------- - -------- ----------------- (Dollars in Thousands) SASCO 1998-2 X 11.10% 73.74% 1 7.81% 31.84% $ 4,969 16.00% 1.26% 17.62% SASCO 1998-3(1) X 10.20 75.67 1 1.81 30.19 4,116 17.04 3.29 17.48 MLMI 1998-FF1(2) X 9.39 77.63 1 0.94 30.85 200 18.57 10.12 18.60 LHELT 1998-2(3) X 10.08 75.81 1 2.08 25.87 593 18.55 17.17 38.78 OCWEN 98-OAC-1(4) N/A 8.65 80.30 6.16 33.22 181 N/A N/A N/A
ANTICIPATED ORIGINAL ANTICI PATED WEIGHTED ANTICIPATED YIEL D TO AVERAGE YIELD TO MATURI TY AT REMAINING RATING/DESCRIPTION AMORTIZED COST FAIR VALUE PERCENT OWNED MATURITY 12/31/ 99 (1) COUPON LIFE(2) ------------------ --------------- ------------ ------------- ----------- ------ ------ ------ ----------- Match-funded securities......... $ 53,561 $ 52,693 100.00% 17.24% 6.0 7% 0.00% 8.89 years =============== ============
December 31, ------- --------------------------------------------------- ------------------------ 199 9 1998 1997 1 996 1995 ------- ----- ------------ ------------ ----- ------- ------------ (Dollars in Thousands) Single family residential loans.......... $ 59 7,719 $ 597,100 $ 900,817 $ 504,049 $ 376,501 Multi-family residential loans........... 19 1,971 244,172 191,302 341,796 176,259 Commercial real estate loans: Office buildings.................... 9 7,784 154,063 363,681 202,084 169,300 Hotels.............................. 7 5,095 100,407 98,907 46,054 67,600 Retail properties................... 10 5,247 21,230 106,755 138,590 95,000 Other properties.................... 8 7,148 173,310 131,692 79,073 56,666 ------- ----- ------------ ------------ ----- ------- ------------ 36 5,274 449,010 701,035 465,801 388,566 Other loans.............................. 2 1,615 10,144 1,865 2,753 2,203 ------- ----- ------------ ------------ ----- ------- ------------- Total discount loans.................. 1,17 6,579 1,300,426 1,795,019 1, 314,399 943,529 ======= ===== ============ ============ ===== ======= ============ Unaccreted discount: Single family residential loans..... (14 7,630) (161,650) (170,743) (92,167) (105,255) Multi-family residential loans...... (3 7,981) (20,795) (45,944) (71,817) (47,541) Commercial real estate loans........ (5 7,604) (69,747) (120,457) (77,550) (120,367) Other loans......................... (954) (321) (206) (374) (595) -------- ----- ------------- ------------- ------ ------- ------------- (24 4,169) (252,513) (337,350) ( 241,908) (273,758) -------- ----- ------------- ------------- ------ ------- ------------- 93 2,410 1,047,913 1,457,669 1, 072,491 669,771 Allowance for loan losses................ (1 9,181) (21,402) (23,493) (11,538) -- ------- ----- ------------ ------------ ----- ------- ------------ Discount loans, net...................... $ 91 3,229 $ 1,026,511 $ 1,434,176 $ 1, 060,953 $ 669,771 ======= ===== ============ ============ ===== ======= ============

ACTIVITY IN THE DISCOUNT LOAN PORTFOLIO. The following table sets forth the activity in the Company's net discount loan portfolio during the periods indicated:
(1) The decline in acquisitions during 1999 is primarily due to a decline in the volume of non-performing loans brought to market, as a result of the continued strength of the domestic economy.
(2) The 1996 data does not include the Company's pro rata share of the $741.2 million of discount loans acquired by the LLC.
(3) Resolutions and repayments consists of loans which were resolved in a manner which resulted in partial or full repayment of the loan to the Company, as well as principal payments on loans which have been brought current in accordance with their original or modified terms (whether pursuant to forbearance agreements or otherwise) or on other loans which have not been resolved.
(4) Includes securitizations of performing single family discount loans. See "Results of Operations - Non-interest Income."
45
Year Ended December 31, --------- --------------------------------------------------- -------------- 1999 1998 1997 1996 1995 --------- -- ----------- ----------- ----------- ----------- AMOUNT (Dollars in Thousands) Balance at beginning of period.......... $ 1,026,5 11 $ 1,434,176 $ 1,060,953 $ 669,771 $ 529,460 Acquisitions(1)(2): Single family residential loans........ 516,7 44 613,201 1,061,967 365,516 272,799 Multi - family residential loans........ 78,2 44 231,130 57,707 310,423 141,160 Commercial real estate loans............ 157,2 58 264,697 656,904 433,492 374,873 Other................................... 17,4 14 14,699 195 1,456 2,363 --------- -- ----------- ----------- ----------- ----------- 769,6 60 1,123,727 1,776,773 1,110,887 791,195 --------- -- ----------- ----------- ----------- ----------- Resolutions and repayments(3)........... (372,4 42) (539,353) (484,869) (371,228) (300,161) Loans transferred to real estate owned.. (203,0 43) (382,904) (292,412) (138,543) (281,344) Sales (4)............................... (318,0 22) (696,063) (518,872) (230,246) (51,595) Decrease (increase) in discount......... 8,3 44 84,837 (95,442) 31,850 (17,784) Decrease (increase) in allowance........ 2,2 21 2,091 (11,955) (11,538) -- --------- -- ----------- ----------- ----------- ----------- Balance at end of period................ $ 913,2 29 $ 1,026,511 $ 1,434,176 $ 1,060,953 $ 669,771 ========= == =========== =========== =========== =========== Year Ended December 31, --------- --------------------------------------------------- -------------- 1999 1998 1997 1996 1995 --------- -- ----------- ----------- ----------- ----------- NUMBER OF LOANS Balance at beginning of period....... 8,1 00 12,980 5,460 4,543 3,894 Acquisitions(1)(2): Single family residential loans..... 6,6 06 7,779 17,154 4,086 2,745 Multi - family residential loans..... 34 92 173 221 104 Commercial real estate loans......... 2 02 205 354 496 117 Other................................ 6 8 22 9 6 --------- -- ----------- ----------- ----------- ----------- 6,8 48 8,084 17,703 4,812 2,972 --------- -- ----------- ----------- ----------- ----------- Resolutions and repayments(3)........ (1,2 41) (1,918) (1,978) (2,355) (960) Loans transferred to real estate owned (2,3 67) (3,193) (1,596) (860) (984) Sales (4)............................ (3,2 76) (7,853) (6,609) (680) (379) Decrease (increase) in discount...... -- -- -- -- -- Decrease (increase) in allowance..... -- -- -- -- -- --------- -- ----------- ----------- ----------- ----------- Balance at end of period............. 8,0 64 8,100 12,980 5,460 4,543 ========= == =========== =========== =========== ===========

PAYMENT STATUS OF DISCOUNT LOANS. The following table sets forth certain information relating to the payment status of loans in the Company's discount loan portfolio at the dates indicated.
(1) Includes $73.2 million of loans which were less than 90 days past due under the terms of the forbearance agreements at December 31, 1999, of which $52.0 million were current and $21.2 million were past due 31 to 89 days.
(2) Includes $110.1 million of loans which were less than 90 days past due under the terms of the forbearance agreements at December 31, 1998, of which $77.9 million were current and $32.2 million were past due 31 to 89 days.
(3) Includes $316.3 million of loans which were less than 90 days past due under the terms of the forbearance agreements at December 31, 1997, of which $184.5 million were current and $131.8 million were past due 31 to 89 days.
(4) Includes $32.8 million of loans which were less than 90 days past due under the terms of the forbearance agreements at December 31, 1996, of which $17.8 million were current and $15.0 million were past due 31 to 89 days.
For further information on the Company's discount loan portfolio, see Note 8 to the Consolidated Financial Statements (which is incorporated herein by reference).
46
December 31, ----------- --------------------------------------------------- -------------- 1999 1998 1997 1996 1995 ----------- -- ------------- ------------- ------------- ------------- PRINCIPAL AMOUNT (Dollars in Thousands) Loans without Forbearance Agreements: Current.............................. $ 509,8 45 $ 578,269 $ 670,115 $ 572,043 $ 351,630 Past due 31 days to 89 days.......... 23,4 38 35,555 21,098 19,458 86,838 Past due 90 days or more............. 448,3 12 509,838 638,319 506,113 385,112 Acquired and servicing not yet transferred....................... 87,5 38 57,048 28,053 149,564 119,949 ----------- -- ------------- ------------- ------------- ------------- Subtotal.......................... 1,069,1 33 1,180,710 1,357,585 1,247,178 943,529 ----------- -- ------------- ------------- ------------- ------------- Loans with Forbearance Agreements: Current............................. 2,9 58 1,180 3,140 7,554 -- Past due 31 days to 89 days.......... 8,9 04 4,046 1,688 2,703 -- Past due 90 days or more(1)(2)(3)(4). 95,5 84 114,490 432,606 56,964 -- ----------- -- ------------- ------------- ------------- ------------- Subtotal.......................... 107,4 46 119,716 437,434 67,221 -- ----------- -- ------------- ------------- ------------- ------------- Total.................................. $ 1,176,5 79 $ 1,300,426 $ 1,795,019 $ 1,314,399 $ 943,529 =========== == ============= ============= ============= =============
December 31, ----------- --------------------------------------------------- ----- 1999 1998 1997 1996 19 95 --------- --------- --------- --------- ----- ----- PERCENTAGE OF LOANS Loans without Forbearance Agreements: Current........................... 43.33% 44.47% 37.33% 43.52% 37.27% Past due 31 days to 89 days....... 1.99 2.73 1.18 1.48 9.20 Past due 90 days or more.......... 38.10 39.21 35.56 38.51 40.82 Acquired and servicing not yet transferred.................... 7.44 4.39 1.56 11.38 12.71 --------- --------- --------- --------- ----- ----- Subtotal....................... 90.86 90.80 75.63 94.89 1 00.00 --------- --------- --------- --------- ----- ----- Loans with Forbearance Agreements: Current........................... 0.25 0.09 0.18 0.57 -- Past due 31 days to 89 days....... 0.76 0.31 0.09 0.21 -- Past due 90 days or more.......... 8.13 8.80 24.10 4.33 -- --------- --------- --------- --------- ----- ----- Subtotal....................... 9.14 9.20 24.37 5.11 -- --------- --------- --------- --------- ----- ----- Total............................... 100.00% 100.00% 100.00% 100.00% 1 00.00% ========= ========= ========= ========= ===== =====
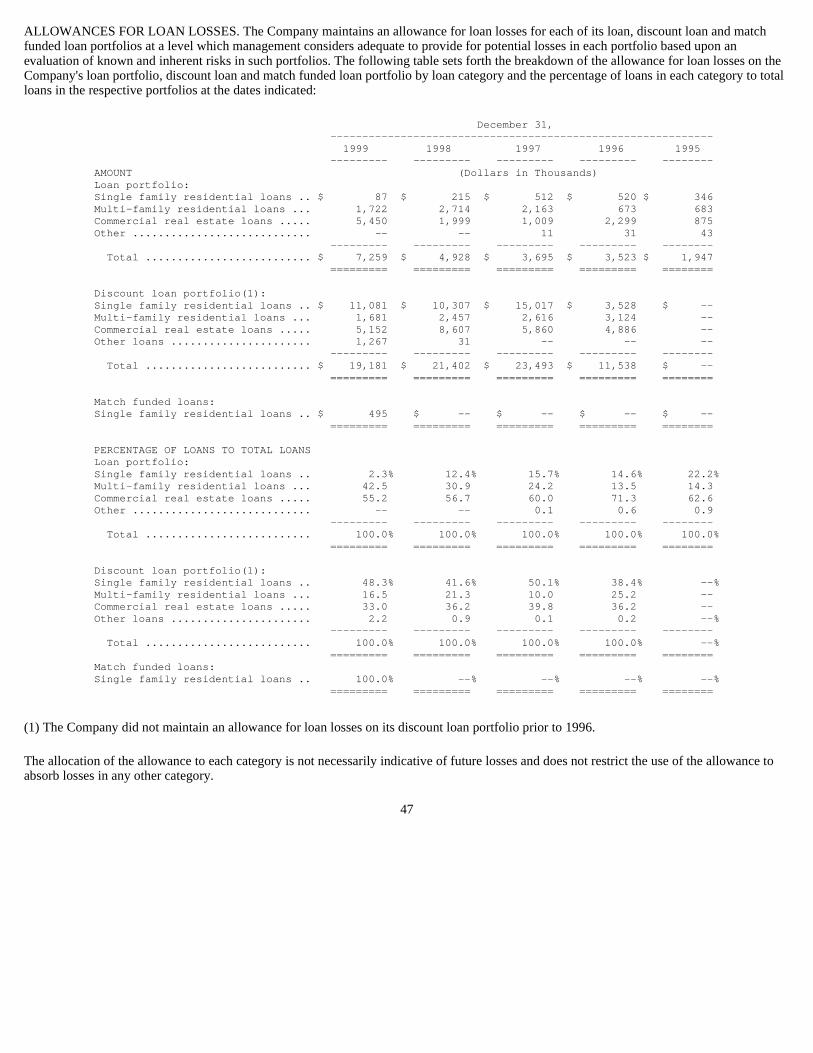
ALLOWANCES FOR LOAN LOSSES. The Company maintains an allowance for loan losses for each of its loan, discount loan and match funded loan portfolios at a level which management considers adequate to provide for potential losses in each portfolio based upon an evaluation of known and inherent risks in such portfolios. The following table sets forth the breakdown of the allowance for loan losses on the Company's loan portfolio, discount loan and match funded loan portfolio by loan category and the percentage of loans in each category to total loans in the respective portfolios at the dates indicated:
(1) The Company did not maintain an allowance for loan losses on its discount loan portfolio prior to 1996.
The allocation of the allowance to each category is not necessarily indicative of future losses and does not restrict the use of the allowance to absorb losses in any other category.
47
December 31, -------------- ---------------------------------------------- 1999 1998 1997 1996 1995 --------- - -------- --------- --------- -------- AMOUNT (Dollars in Thousands) Loan portfolio: Single family residential loans .. $ 87 $ 215 $ 512 $ 520 $ 346 Multi-family residential loans ... 1,722 2,714 2,163 673 683 Commercial real estate loans ..... 5,450 1,999 1,009 2,299 875 Other ............................ -- -- 11 31 43 --------- - -------- --------- --------- -------- Total .......................... $ 7,259 $ 4,928 $ 3,695 $ 3,523 $ 1,947 ========= = ======== ========= ========= ======== Discount loan portfolio(1): Single family residential loans .. $ 11,081 $ 10,307 $ 15,017 $ 3,528 $ -- Multi-family residential loans ... 1,681 2,457 2,616 3,124 -- Commercial real estate loans ..... 5,152 8,607 5,860 4,886 -- Other loans ...................... 1,267 31 -- -- -- --------- - -------- --------- --------- -------- Total .......................... $ 19,181 $ 21,402 $ 23,493 $ 11,538 $ -- ========= = ======== ========= ========= ======== Match funded loans: Single family residential loans .. $ 495 $ -- $ -- $ -- $ -- ========= = ======== ========= ========= ======== PERCENTAGE OF LOANS TO TOTAL LOANS Loan portfolio: Single family residential loans .. 2.3% 12.4% 15.7% 14.6% 22.2% Multi-family residential loans ... 42.5 30.9 24.2 13.5 14.3 Commercial real estate loans ..... 55.2 56.7 60.0 71.3 62.6 Other ............................ -- -- 0.1 0.6 0.9 --------- - -------- --------- --------- -------- Total .......................... 100.0% 100.0% 100.0% 100.0% 100.0% ========= = ======== ========= ========= ======== Discount loan portfolio(1): Single family residential loans .. 48.3% 41.6% 50.1% 38.4% --% Multi-family residential loans ... 16.5 21.3 10.0 25.2 -- Commercial real estate loans ..... 33.0 36.2 39.8 36.2 -- Other loans ...................... 2.2 0.9 0.1 0.2 --% --------- - -------- --------- --------- -------- Total .......................... 100.0% 100.0% 100.0% 100.0% --% ========= = ======== ========= ========= ======== Match funded loans: Single family residential loans .. 100.0% --% --% --% --% ========= = ======== ========= ========= ========

The following table sets forth an analysis of activity in the allowance for loan losses relating to the Company's loan portfolio during the periods indicated:
The following table sets forth an analysis of activity in the allowance for loan losses relating to the Company's discount loan portfolio during the periods indicated:
INVESTMENTS IN LOW-INCOME HOUSING TAX CREDIT INTERESTS. In 1993, the Company commenced a program to invest in multi-family residential projects which have been allocated low-income housing tax credits under Section 42 of the Internal Revenue Code of 1986, as amended, by a state tax credit allocating agency. At December 31, 1999, the Company had $151.0 million of investments in low-income housing tax credit interests, as compared to $144.2 million at December 31, 1998. The increase during 1999 represents the Company's continued investment in existing low-income projects, as well as six new projects, offset by the sale of its investment in nine projects which had a carrying value of $41.7 million for gains of $6.6 million. See Note 14 to the Consolidated Financial Statements (which is incorporated herein by reference).
48
Year Ended December 31, --------------------------------------------------- -------------- 1999 1998 1997 1996 1995 -------- -------- -------- ------ -- -------- (Dollars in Thousands) Balance at beginning of period................... $ 4,928 $ 3,695 $ 3,523 $ 1,9 47 $ 1,071 Provision for loan losses........................ 1,636 891 325 1,8 72 1,121 Charge-offs: Single family residential loans............... (8) (212) (100) (2 61) (131) Multi-family residential loans................ -- -- -- (7) -- Commercial real estate loans.................. -- -- -- -- (40) Consumer loans................................ -- (7) (53) ( 28) (92) -------- --------- -------- ------ -- -------- Total charge-offs........................... (8) (219) (153) (2 96) (263) Recoveries: Single family residential loans............... -- -- -- -- 3 Commercial real estate loans.................. -- 561 -- -- 15 -------- -------- -------- ------ -- -------- Total recoveries............................ -- 561 -- -- 18 -------- -------- -------- ------ -- -------- Net (charge-offs) recoveries................ (8) 342 (153) (2 96) (245) -------- -------- -------- ------ -- -------- Acquired allowance (OAC acquisition)............. 703 -- -- -- -- -------- -------- -------- ------ -- -------- Balance at end of period......................... $ 7,259 $ 4,928 $ 3,695 $ 3,5 23 $ 1,947 ======== ======== ======== ====== == ======== Net (charge-offs) recoveries as a percentage of average loan portfolio ....................... (0.004%) 0.13% (0.04%) (0. 09%) (0.19%)
Year Ended December 31, ----------------------------------------------- ---------------- 1999 1998 1997 1996 ------------ ------------ ------------ ------------ (Dollars in Thousands) Balance at beginning of period..................... . $ 21,402 $ 23,493 $ 11,538 $ -- Provision for loan losses.......................... . 5,434 17,618 31,894 20,578 Charge-offs: Single family residential loans................. . (4,409) (14,574) (13,281 ) (7,009) Multi-family residential loans.................. . (912) (2,648) (2,056 ) (704) Commercial real estate loans.................... . (2,687) (2,888) (5,012 ) (1,503) Other loans..................................... . (44) (20) -- -- ------------ ------------ ------------ ------------ Total charge-offs............................ . (8,052) (20,130) (20,349 ) (9,216) ------------ ------------ ------------ ------------ Recoveries: Single family residential loans................. . 397 421 410 176 Multi-family residential loans.................. . -- -- -- -- Commercial real estate loans.................... . -- -- -- -- Consumer loans.................................. . -- -- -- -- ------------ ------------ ------------ ------------ Total recoveries............................. . 397 421 410 176 ------------ ------------ ------------ ------------ Net charge-offs.............................. . (7,655) (19,709) (19,939 ) (9,040) ------------ ------------ ------------ ------------ Balance at end of period........................... . $ 19,181 $ 21,402 $ 23,493 $ 11,538 ============ ============ ============ ============ Net charge-offs as a percentage of average discount loan portfolio.................................. . (0.83%) (1.53%) (1.55 %) (1.34%)

INVESTMENTS IN UNCONSOLIDATED ENTITIES. Investments in unconsolidated entities decreased $49.8 million during 1999 primarily as a result of the Company's acquisition of OAC on October 7, 1999. The Company's investment in OAC stock amounted to $16.3 million, or 8.12% of the outstanding common stock of OAC, at December 31, 1998. The Company's investment in OPLP units amounted to $22.8 million, or 8.71% of the partnership units of OPLP, at December 31, 1998. Prior to October 7, 1999, the Company accounted for these investments under the equity method. During 1998, the Company recorded equity in the losses of its investment in OAC and OPLP of $4.0 million and $4.7 million, respectively.
Also contributing to the decline in investments in unconsolidated entities during 1999 was a $10.4 million decrease in the Company's 35.84% equity investment in Kensington. The decrease was primarily due to the Company's $9.2 million share of Kensington's losses recorded during 1999.
See Notes 2 (first five paragraphs) and 10 to the Consolidated Financial Statements (which are incorporated herein by reference).
REAL ESTATE OWNED, NET. Real estate owned, net, decreased by $34.0 million or 17% during 1999 due primarily to a decline in foreclosures. Real estate owned consists almost entirely of properties acquired by foreclosure or deed-in-lieu thereof on loans in the Company's discount loan portfolio.
The following table sets forth certain information relating to the Company's real estate owned at the dates indicated.
The following tables set forth the activity in the real estate owned during the periods indicated.
49
December 31, -------------------- -------------------------------- 1999 1998 1997 1996 1995 -------- -------- -------- -------- -------- (Doll ars in Thousands) Discount loan portfolio: Single family residential. $ 72,193 $ 94,641 $ 76,409 $ 49,728 $ 75,144 Multi-family residential.. 2,601 20,130 16,741 14,046 59,932 Commercial real estate .. 85,233 82,591 71,339 36,264 31,218 -------- -------- -------- -------- -------- Total ............... 160,027 197,362 164,489 100,038 166,294 Loan portfolio .............. 2,183 227 357 592 262 Loans available for sale .... 5,296 3,962 2,419 3,074 -- -------- -------- -------- -------- -------- Total ............... $167,506 $201,551 $167,265 $103,704 $166,556 ======== ======== ======== ======== ========
Year Ended December 31, ---------- --------------------------------------------------- 1999 1998 1997 1996 1995 --------- --------- --------- --------- --------- AMOUNT (Dollars in Thousands) Balance at beginning of period ....... $ 201,551 $ 167,265 $ 103,704 $ 166,556 $ 96,667 Properties acquired through foreclosure or deed-in-lieu thereof: Discount loans ..................... 203,043 382,904 292,412 138,543 281,344 Loans available for sale ........... 13,281 7,787 5,569 3,671 -- Loan portfolio ..................... 4,451 547 661 1,207 51 Less discount transferred .......... (63,664) (110,716) (93,021) (41,323) (96,221 ) --------- --------- --------- --------- --------- 157,111 280,522 205,621 102,098 185,174 --------- --------- --------- --------- --------- Acquired in connection with acquisitions of discount loans ..... 47,808 19,949 38,486 2,529 24,617 Sales ................................ (237,108) (263,206) (179,693) (160,592) (139,233 ) Change in valuation allowance ........ (1,856) (2,979) (853) (6,887) (669 ) --------- --------- --------- --------- --------- Balance at end of period ............. $ 167,506 $ 201,551 $ 167,265 $ 103,704 $ 166,556 ========= ========= ========= ========= =========

The following table sets forth the amount of time that the Company had held its real estate owned at the dates indicated.
The Company actively manages its real estate owned. Sales of real estate owned resulted in gains, net of the provision for loss, of $8.3 million, $25.2 million and $17.2 million during 1999, 1998 and 1997, respectively, which are included in determining the Company's income (loss) on real estate owned. The increase in the amount of real estate owned which the Company has held in excess of one year as of December 31, 1999 primarily reflects the anticipated migration of a large retail property which is currently being repositioned for sale. The average period during which the Company held the $237.1 million, $263.2 million and $179.7 million of real estate owned which was sold during the years ended December 31, 1999, 1998, and 1997, respectively, was 6 months, 6 months and 9 months, respectively.
Properties acquired through foreclosure or by deed-in-lieu thereof are valued at the lower of amortized cost or fair value. Properties included in the Company's real estate owned portfolio are periodically re-evaluated to determine that they are being carried at the lower of cost or fair value less estimated costs to sell. Holding and maintenance costs related to properties are recorded as expenses in the period incurred. Deficiencies resulting from valuation adjustments to real estate owned subsequent to acquisition are recognized as a valuation allowance. Subsequent increases related to the valuation of real estate owned are reflected as a reduction in the valuation allowance, but not below zero. Increases and decreases in the valuation allowance are charged or credited to income, respectively.
The following table sets forth the activity, in aggregate, in the valuation allowances on real estate owned during the periods indicated.
(1) The increase at December 31, 1999 reflects a decline in the balance of real estate owned and an increase in the amount of real estate owned which the Company has held in excess of one year.
50
Year Ended December 31, -------- --------------------------------------------------- -- 1999 1998 1997 1996 1995 -------- - --------- --------- --------- ------- -- NUMBER OF PROPERTIES Balance at beginning of period ....... 1,99 9 1,505 825 1,070 1,0 18 Properties acquired through foreclosure or deed-in-lieu thereof: Discount loans ..................... 2,36 7 3,193 1,596 860 9 69 Loans available for sale ........... 15 7 82 54 51 -- Loan portfolio ..................... 1 0 3 6 7 1 Less discount transferred .......... - - -- -- -- -- -------- - --------- --------- --------- ------- -- 2,53 4 3,278 1,656 918 9 70 -------- - --------- --------- --------- ------- -- Acquired in connection with acquisitions of discount loans ..... 93 1 303 545 12 3 11 Sales ................................ (3,79 2) (3,087) (1,521) (1,175) (1,2 29) Change in valuation allowance ........ - - -- -- -- -- -------- - --------- --------- --------- ------- -- Balance at end of period ............. 1,67 2 1,999 1,505 825 1,0 70 ======== = ========= ========= ========= ======= ==
December 31, ---------------- --------------------------------------------------- ----------- 1999 1998 1997 1996 1995 ------------ ------------ ------------ ------------ - ----------- (Dollars in Thousands) One to two months............... $ 30,695 $ 38,444 $ 83,144 $ 17,695 $ 25,398 Three to four months............ 26,532 79,264 28,912 15,291 22,672 Five to six months.............. 11,263 27,115 20,929 14,348 25,742 Seven to 12 months.............. 28,606 26,122 23,621 13,004 76,782 Over 12 months.................. 70,410 30,606 10,659 43,366 15,962 ------------ ------------ ------------ ------------ - ----------- $ 167,506 $ 201,551 $ 167,265 $ 103,704 $ 166,556 ============ ============ ============ ============ = ===========
Year Ended December 31, -------------------------------------------------- -------------------- 1999 1998 1997 199 6 1995 ---------- ---------- ---------- ----- ----- ---------- (Dollars in Thousands) Balance at beginning of year..................... $ 15,325 $ 12,346 $ 11,493 $ 4,606 $ 3,937 Provisions for losses............................ 28,008 18,626 13,450 1 8,360 10,510 Charge-offs and sales............................ (26,152) (15,647) (12,597) (1 1,473) (9,841) ---------- ---------- ---------- ----- ----- ---------- Balance at end of year........................... $ 17,181 $ 15,325 $ 12,346 $ 1 1,493 $ 4,606 ========== ========== ========== ===== ===== ========== Valuation allowance as a percentage of total gross real estate owned (1)............. 9.30% 7.07% 6.87% 9.98% 2.69%

Although the Company evaluates the potential for significant environmental problems prior to acquiring or originating a loan, there is a risk for any mortgage loan, particularly a multi-family residential and commercial real estate loan, that hazardous substances or other environmentally restricted substances could be discovered on the related real estate. In such event, the Company might be required to remove such substances from the affected properties or to engage in abatement procedures at its sole cost and expense. There can be no assurance that the cost of such removal or abatement will not substantially exceed the value of the affected properties or the loans secured by such properties, that the Company would have adequate remedies against the prior owners or other responsible parties or that the Company would be able to resell the affected properties either prior to or following completion of any such removal or abatement procedures. If such environmental problems are discovered prior to foreclosure, the Company generally will not foreclose on the related loan; however, the value of such property as collateral will generally be substantially reduced, and as a result, the Company may suffer a loss upon collection of the loan.
From time to time, the Company makes loans to finance the sale of real estate owned. At December 31, 1999, such loans amounted to $1.8 million and consisted of $1.6 million of multi-family residential loans and $0.2 million of commercial loans. All of the Company's loans to finance the sale of real estate owned were performing in accordance with their terms at December 31, 1999.
INVESTMENTS IN REAL ESTATE. At December 31, 1999, the Company's investments in real estate was primarily comprised of eight properties with an aggregate carrying value of $252.6 million which were acquired as a result of the acquisition of OAC in October 1999. Four of the properties currently owned by the Company with an aggregate carrying value of approximately $190.3 million are located in San Francisco, California. Three of these properties are located in the financial district of San Francisco, and one property is located in the adjacent civic center district of San Francisco. The Company believes that the office market in San Francisco, particularly the financial district, is characterized by limited new supply and significant barriers to entry. Low vacancy rates, coupled with lack of new construction, are leading to increased rental rates. Government regulation of development in conjunction with local construction costs and a lack of developable land provide significant barriers to entry to this area. The Company believes that its investments in real estate in San Francisco are well located and benefit from their proximity to the majority of the city's office, retail and hotel accommodations.
The Company's earthquake insurance relating to its four properties in San Francisco is in the aggregate amount of $50 million, which is the probable maximum loss estimated to be sustained in the event the most powerful earthquake recorded in California were to occur at the properties, as determined by an independent structural engineer. In the event of such probable maximum loss of $50 million, such damage would be insured, less a deductible of approximately 5% of total value at risk. In the event of a more catastrophic earthquake or damages in excess of $50 million, the Company would not be insured for such losses.
The Company's net investment in the above eight properties at December 31, 1999 is comprised of the following:
Set forth below is a brief description of each of the above real estate investments at December 31, 1999.
225 BUSH STREET. In April 1998, OAC acquired an existing 570,637 square foot, 22-story office building located at 225 Bush Street in the financial district of San Francisco for $100.2 million. Bush Street was originally constructed in 1923 and brought up to 1992 building code seismic standards during 1992-94. Originally built as the world headquarters of Chevron of USA, Inc. ("Chevron"), it was sold in 1994 as Chevron sought to relocate its executive offices. OAC is projecting to make tenant improvements, leasing commissions, and to upgrade mechanical, HVAC, electrical, fire, and life/safety systems under the Americans with Disabilities Act of 1990 (the "ADA"), as well as upgrades and improvements to the ground floor retail and annex entrance lobby. Approximately $9.0 million of the capital budget will be spent for tenant improvements and other upgrades to the premises as a result of a new 10-year lease executed in August 1999 with XOOM.com for approximately 187,000 square feet. As of December 31, 1999, the Bush street property was 95% leased.
51
Date Acquired Property Locatio n Square Feet Property Type December 31, 1999 -------- ----------------------- ----------- --------- ----------- ------------- ----------------- (Do llars in Thousands) 04/08/98 225 Bush Street........ San Francis co, CA 570,637 Office Bldg. $ 127,640 09/23/97 450 Sansome Street..... San Francis co, CA 130,437 Office Bldg. 28,913 01/23/98 690 Market Street...... San Francis co, CA 124,692 Office Bldg. 21,381 09/03/97 10 U.N. Plaza.......... San Francis co, CA 71,636 Office Bldg. 12,349 07/22/98 841 Prudential Drive... Jacksonvill e, FL 550,000 Office Bldg. 32,366 11/10/97 Cortez Plaza........... Bradenton, FL 289,686 Shopping Ctr. 22,617 04/09/98 7075 Bayers Road....... Halifax, No va Scotia 402,529 Shopping Ctr. 14,844 10/01/98 Holiday Village........ Havre, MT 223,355 Shopping Ctr. 1,505 ------------- 261,615 Accumulated depreciati on (9,011) ------------- $ 252,604 =============

450 SANSOME STREET. In September 1997, OAC acquired a 130,437 square foot, 16-story office building located at 450 Sansome Street in the financial district of San Francisco. OAC purchased this property for $17.2 million. The property was built in 1967 and upgraded in certain respects in 1989 and 1990. The property was acquired from a lender who had taken title through foreclosure. Average rent per square foot was approximately $18.00 at the date of acquisition. OAC has to date renovated the entrance lobby, elevator cabs, life safety systems, and certain building systems on four floors, completed improvements required for compliance with the ADA, as well as paid tenant improvements and leasing commissions. The building was fully leased as of December 31, 1999 with average contract rents of $24.78 per square foot.
690 MARKET STREET. In January 1998, OAC acquired a 124,692 square foot, 16-story, office building located at 690 Market Street in the financial district of San Francisco. The property was purchased for $13.7 million. The property was originally constructed in 1888 and has undergone numerous renovations. At the date of acquisition existing rents averaged $14.06 per square foot. Since the date of acquisition, OAC has executed new leases totaling approximately 35,000 square feet, which increased building occupancy to 97% as of December 31, 1999, and average rents have increased to approximately $24.60 per square foot. The Company is continuing to invest in structural upgrades, a sprinkler system and ADA upgrades, deferred maintenance, tenant improvements and leasing commissions from the date at acquisition through its ownership period.
10 UNITED NATIONS PLAZA. In September 1997, OAC acquired a 71,636 square foot, six-story, office building located at 10 United Nations Plaza in the Civic Center district of San Francisco. OAC purchased this property, which was built in 1982, for $9.1 million. At the date of acquisition, the property was substantially leased and the average rent per square foot was $13.76. The building was 64% leased as of December 31, 1999 at average rents of approximately $24.19 per square foot. The remaining space is currently being marketed. OAC has invested additional funds in this property to fund improvements to enhance the appearance of the lobby and hallways, install ADA upgrades, fund deferred maintenance and tenant improvements, and pay leasing commissions.
PRUDENTIAL BUILDING. In July 1998, OAC purchased the Prudential Building, a 550,000 square foot, 22-story office building located in the central business district of Jacksonville, Florida for an aggregate purchase price of $36.0 million, plus closing costs. The purchase price was funded with cash on hand and advances from a line of credit. Simultaneously with this closing, OAC also leased 98% of the building back to the Prudential Insurance Co. of America and sold two adjacent parking areas to a neighboring hospital for approximately $4.1 million. The Prudential lease has a term of four years with options to vacate the premises during the term of the lease, as well as three subsequent five-year extension options. On August 6, 1999, Prudential Healthcare was sold to Aetna.
CORTEZ PLAZA. In November 1997, OAC purchased Cortez Plaza, a 289,686 square foot shopping center located in Bradenton, Florida, a suburb of Tampa. OAC purchased this property, which was built in 1956 and renovated in 1988, for $18.4 million. In a separate transaction, the fee simple title to a large portion of the shopping center that had been subject to a ground lease was purchased simultaneously for $0.9 million, which resulted in a total investment in this property of $19.3 million. By simultaneously acquiring fee simple title to a ground lease that encumbered a large part of the shopping center's parking lot, OAC believes that it immediately improved the value and marketability of the project. As of December 31, 1999, the shopping center was 94.5% leased with national and regional tenants, comprising 75% of the leaseable area. Below market leases covering approximately 2.2% of the center expire during 2000.
BAYER'S ROAD SHOPPING CENTRE. In April 1998, OAC acquired the Bayers Road Shopping Centre, which is located at 7075 Bayers Road in Halifax, Nova Scotia. The property was acquired by foreclosure on the loans secured by the property, which were acquired by OAC at a discount in September 1997. The property contains 402,529 square feet of space, which consists primarily of retail space but also includes some office space and storage space. The original buildings were built in 1956 and were enclosed and expanded in several phases between 1971 and 1987. The property was approximately 67% leased at December 31, 1999. OAC currently is implementing a renovation plan to establish the second level as a community shopping center anchored value-oriented retailers, while filling the lower level with service providers, discount retailers and entertainment uses. The third level will remain office space. In August 1999, OAC purchased for $1.9 million the neighboring IGA Store which will be destroyed in order to increase visibility to the Shopping Centre.
HOLIDAY VILLAGE SHOPPING CENTRE. In October 1998, OAC acquired the Holiday Village Shopping Centre, which is located at 1753 Highway 2 West in Havre, Montana. The property was acquired by foreclosure on the loan secured by the property, which was acquired by OAC at a discount in November 1997. The property contains 223,355 square feet of retail space. The original building was built in 1978. The property was approximately 47% leased at December 31, 1999. OAC currently is developing a leasing plan to stabilize the property.
52

The following table sets forth the cost of improvements for each investment in real estate through December 31, 1999.
The following table sets forth a summary schedule of the total lease expirations for the Company's investments in real estate for leases in place as of December 31, 1999, assuming that none of the tenants exercise renewal options or termination rights, if any, at or prior to the scheduled expirations.
(1) Lease year runs from January 1 to December 31 for all years. (2) Annualized base rent is calculated based on the amount of rent scheduled from January 1 of the listed year to the lease expiration. (3) Average base rent per square foot is calculated using the annualized base rent divided by the square footage. (4) In October 1999, tenant IGA exercised a termination option effective April 30, 2000 at Bayers Road Shopping Center, which requires IGA to pay termination fees following expiration of the lease agreement. (5) On August 13, 1999, XOOM.com, a new tenant, executed a 10-year lease at 225 Bush Street for approximately 187,000 square feet. However, the table only includes space that was occupied on December 31, 1999. As of December 31, 1999, XOOM.com physically occupied 24,157 square feet. The remaining square footage is under construction with occupancy scheduled during the first quarter of 2000.
The Company regularly engages in negotiations with existing tenants to extend leases due to expire as well as to enter into new leases with other interested parties. Square footage involved in such negotiations may vary from a small sub-tenancy to substantially all the available space at any given property.
53
Budgeted 1999 Cost of Ac tual Cost of Impairment Gross Book Rents due Total Initial Cost Improvements I mprovements Write down/ Fair Value Value at Ac cumulated and accrued Rental Property to OAC for 1999 to Date Sales Adjustments 12/31/99 Dep reciation at end Income -------- ------------ ------------ -- ------------ ----------- ----------- ---------- --- --------- ----------- -------- (Dollars in Thousands) 225 Bush Street ..... $ 101,632 $ 6,514 $ 9,962 $ -- $ 16,046 $127,640 $ 4,372 $ 894 $ 2,605 450 Sansome Street .. 17,205 3,988 4,010 -- 7,698 28,913 1,038 562 825 690 Market Street ... 13,707 5,014 3,433 -- 4,241 21,381 673 70 673 10 U.N. Plaza ....... 9,080 3,414 2,529 -- 740 12,349 576 104 252 841 Prudential Dr. .. 32,827 484 275 -- (736) 32,366 838 2,148 2,059 Cortez Plaza ........ 19,244 1,354 285 -- 3,088 22,617 886 235 731 7075 Bayers Road .... 15,219 12,755 5,444 (3,902) (1,917) 14,844 581 125 569 Holiday Village ..... 1,791 350 860 (1,601) 455 1,505 47 13 129 Park Center I ....... 1,534 -- -- (1,534) -- -- -- -- -- --------- -------- -------- -------- -------- -------- ------- -------- -------- Total............. $ 212,239 $ 33,873 $ 26,798 $ (7,037) $ 29,615 $261,615 $ 9,011 $ 4,151 $ 7,843 ========= ======== ======== ======== ======== ======== ======= ======== ========
Percentage of Average Base Percentage of Aggregate Annualized Rent per Aggregate Number of Square Footage Portfolio Base Rent of Square Foot o f Portfolio Year of Lease Leases of Expiring Leased Square Expiring Expiring Annualized Base Expiration(1) Expiring Leases Feet Leases(2) Leases(3) Rent ------------- --------- -------------- ------------- ------------ ------------- - --------------- (Do llars in Thousands) 2000(4) 47 173,653 10.22% $ 1,177 6.78 7.35% 2001 46 136,405 8.03% 1,625 11.92 10.14% 2002 52 604,393 35.57% 5,321 8.80 33.19% 2003 21 55,999 3.30% 1,045 18.66 6.52% 2004 24 119,827 7.05% 1,448 12.08 9.03% 2005 5 42,901 2.52% 365 8.50 2.27% 2006 10 118,123 6.95% 494 4.18 3.08% 2007 5 94,556 5.56% 778 8.23 4.86% 2008 6 137,027 8.06% 1,810 13.21 11.29% 2009 4 34,356 2.02% 625 18.18 3.90% Thereafter (5) 7 182,116 10.72% 1,342 7.37 8.37% -------- -------------- --------------- --------- 227 1,699,356 100.00% $ 16,030 100.00% ======== ============== =============== =========

Noncancelable operating leases with tenants expire on various dates through 2028. The future minimum rental income (base rent) to be received under leases existing as of December 31, 1999, are as follows (Dollars in Thousands):
The Company's investments in real estate also included $15.6 million and $32.9 million at December 31, 1999 and 1998, respectively, of property (land and buildings) held for lease. The decline in the balance of $17.3 million during 1999 was primarily due to the sale of four properties which resulted in an aggregate gain of $1.5 million.
See Note 12 (which is incorporated herein by reference) to the Consolidated Financial Statements for additional disclosures regarding the Company's investments in real estate.
DEFERRED TAX ASSET. At December 31, 1999, the deferred tax asset, net of deferred tax liabilities and valuation allowance, amounted to $136.9 million, an increase of $69.9 million from the $67.0 million net deferred tax asset at December 31, 1998. See Note 23 to the Consolidated Financial Statements (which is incorporated herein by reference) for a disclosure of the components of gross deferred tax assets and liabilities, as well as valuation allowances.
DEPOSITS. Deposits decreased $352.5 million or 16% during 1999 primarily as a result of a $376.7 million decrease in certificates of deposit. Brokered deposits obtained through national investment banking firms which solicit deposits from their customers, amounted to $1.21 billion at December 31, 1999, as compared to $1.48 billion at December 31, 1998. Deposits obtained as a result of the Company's direct solicitation and marketing efforts to regional and local investment banking firms and institutional investors and high net worth individuals amounted to $243.0 million at December 31, 1999, as compared to $371.0 million at December 31, 1998. See Note 16 to the Consolidated Financial Statements (which is incorporated herein by reference).
The following table sets forth information related to the Company's deposits at the dates indicated.
(1) At December 31, 1999, 1998, and 1997, certificates of deposit issued on an uninsured basis (greater than $100,000) amounted to $100.4 million, $100.5 million, and $133.7 million, respectively. Of the $100.4 million of uninsured deposits at December 31, 1999, $57.5 million were from political subdivisions in New Jersey and secured or collateralized as required under state law.
54
2000................................. $ 25,572 2001................................. 23,768 2002................................. 18,411 2003................................. 13,212 2004................................. 11,173 Thereafter........................... 41,526 ---------- Total $ 133,662 ==========
Year Ended December 31, -------------------- --------------------------------------------------- ----------------------------- 1999 1998 1997 -------------------- ------------ ---------------------------------- -- ----------------------------- Weight ed % of Weighted % of Weighted % of Avera ge Total Average Total Average Total Amount Rate Deposits Amount Rate Deposits Amount Rate Deposits ----------- ------ -- -------- ------------ -------- -------- -- --------- -------- -------- (Dollars in Thousands) Non-interest bearing checking accounts................... $ 280,273 - -% 15% $ 251,429 --% 11% $ 133,546 --% 7% NOW and money market checking accounts.......... 30,343 3.9 5% 2 35,070 3.40% 2 27,624 4.73% 1 Savings accounts.............. 1,361 2.3 8% -- 1,326 2.30% -- 1,664 2.30% -- ----------- ------ ------------ ------- -- --------- ------- 311,977 17 287,825 13 162,834 8 ----------- ------------ -- --------- Certificates of deposit(1).... 1,536,997 1,916,548 1,834,899 Unamortized deferred fees..... (6,688) (9,557) (11,737) ----------- ------------ -- --------- Total certificates of deposit. 1,530,309 5.9 2% 83 1,906,991 5.78% 87 1,823,162 6.00% 92 ----------- ------ ------------ ------- -- --------- ------- Total deposits............. $ 1,842,286 100% $ 2,194,816 100% $ 1,985,996 100% =========== ====== ============ ======= == ========= =======
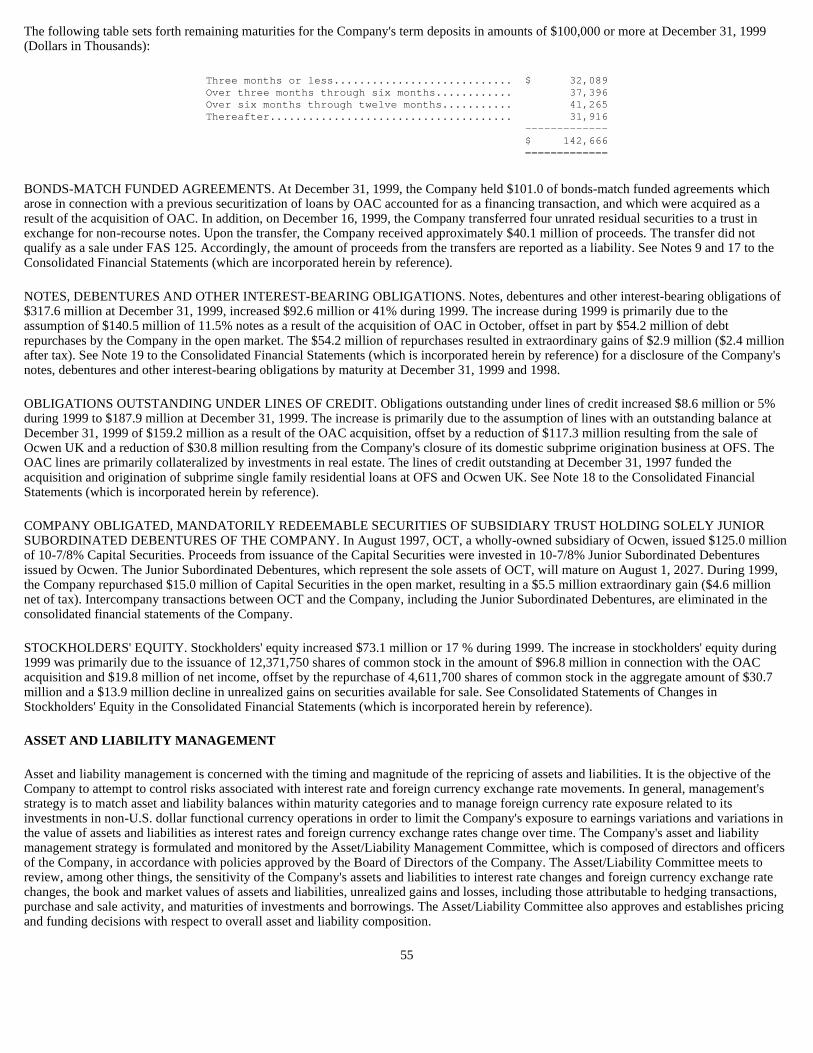
The following table sets forth remaining maturities for the Company's term deposits in amounts of $100,000 or more at December 31, 1999 (Dollars in Thousands):
BONDS-MATCH FUNDED AGREEMENTS. At December 31, 1999, the Company held $101.0 of bonds-match funded agreements which arose in connection with a previous securitization of loans by OAC accounted for as a financing transaction, and which were acquired as a result of the acquisition of OAC. In addition, on December 16, 1999, the Company transferred four unrated residual securities to a trust in exchange for non-recourse notes. Upon the transfer, the Company received approximately $40.1 million of proceeds. The transfer did not qualify as a sale under FAS 125. Accordingly, the amount of proceeds from the transfers are reported as a liability. See Notes 9 and 17 to the Consolidated Financial Statements (which are incorporated herein by reference).
NOTES, DEBENTURES AND OTHER INTEREST-BEARING OBLIGATIONS. Notes, debentures and other interest-bearing obligations of $317.6 million at December 31, 1999, increased $92.6 million or 41% during 1999. The increase during 1999 is primarily due to the assumption of $140.5 million of 11.5% notes as a result of the acquisition of OAC in October, offset in part by $54.2 million of debt repurchases by the Company in the open market. The $54.2 million of repurchases resulted in extraordinary gains of $2.9 million ($2.4 million after tax). See Note 19 to the Consolidated Financial Statements (which is incorporated herein by reference) for a disclosure of the Company's notes, debentures and other interest-bearing obligations by maturity at December 31, 1999 and 1998.
OBLIGATIONS OUTSTANDING UNDER LINES OF CREDIT. Obligations outstanding under lines of credit increased $8.6 million or 5% during 1999 to $187.9 million at December 31, 1999. The increase is primarily due to the assumption of lines with an outstanding balance at December 31, 1999 of $159.2 million as a result of the OAC acquisition, offset by a reduction of $117.3 million resulting from the sale of Ocwen UK and a reduction of $30.8 million resulting from the Company's closure of its domestic subprime origination business at OFS. The OAC lines are primarily collateralized by investments in real estate. The lines of credit outstanding at December 31, 1997 funded the acquisition and origination of subprime single family residential loans at OFS and Ocwen UK. See Note 18 to the Consolidated Financial Statements (which is incorporated herein by reference).
COMPANY OBLIGATED, MANDATORILY REDEEMABLE SECURITIES OF SUBSIDIARY TRUST HOLDING SOLELY JUNIOR SUBORDINATED DEBENTURES OF THE COMPANY. In August 1997, OCT, a wholly-owned subsidiary of Ocwen, issued $125.0 million of 10-7/8% Capital Securities. Proceeds from issuance of the Capital Securities were invested in 10-7/8% Junior Subordinated Debentures issued by Ocwen. The Junior Subordinated Debentures, which represent the sole assets of OCT, will mature on August 1, 2027. During 1999, the Company repurchased $15.0 million of Capital Securities in the open market, resulting in a $5.5 million extraordinary gain ($4.6 million net of tax). Intercompany transactions between OCT and the Company, including the Junior Subordinated Debentures, are eliminated in the consolidated financial statements of the Company.
STOCKHOLDERS' EQUITY. Stockholders' equity increased $73.1 million or 17 % during 1999. The increase in stockholders' equity during 1999 was primarily due to the issuance of 12,371,750 shares of common stock in the amount of $96.8 million in connection with the OAC acquisition and $19.8 million of net income, offset by the repurchase of 4,611,700 shares of common stock in the aggregate amount of $30.7 million and a $13.9 million decline in unrealized gains on securities available for sale. See Consolidated Statements of Changes in Stockholders' Equity in the Consolidated Financial Statements (which is incorporated herein by reference).
ASSET AND LIABILITY MANAGEMENT
Asset and liability management is concerned with the timing and magnitude of the repricing of assets and liabilities. It is the objective of the Company to attempt to control risks associated with interest rate and foreign currency exchange rate movements. In general, management's strategy is to match asset and liability balances within maturity categories and to manage foreign currency rate exposure related to its investments in non-U.S. dollar functional currency operations in order to limit the Company's exposure to earnings variations and variations in the value of assets and liabilities as interest rates and foreign currency exchange rates change over time. The Company's asset and liability management strategy is formulated and monitored by the Asset/Liability Management Committee, which is composed of directors and officers of the Company, in accordance with policies approved by the Board of Directors of the Company. The Asset/Liability Committee meets to review, among other things, the sensitivity of the Company's assets and liabilities to interest rate changes and foreign currency exchange rate changes, the book and market values of assets and liabilities, unrealized gains and losses, including those attributable to hedging transactions, purchase and sale activity, and maturities of investments and borrowings. The Asset/Liability Committee also approves and establishes pricing and funding decisions with respect to overall asset and liability composition.
55
Three months or less............................ $ 32,089 Over three months through six months............ 37,396 Over six months through twelve months........... 41,265 Thereafter...................................... 31,916 - ------------ $ 142,666 = ============
The Asset/Liability Committee is authorized to utilize a wide variety of off-balance sheet financial techniques to assist it in the management of interest rate risk and foreign currency exchange rate risk. These techniques include interest rate exchange or "swap" agreements, Eurodollar and U.S. Treasury interest rate futures contracts, foreign currency futures contracts and foreign currency swap agreements.
INTEREST RATE RISK MANAGEMENT. Under interest rate swaps, the parties exchange the difference between fixed-rate and floating-rate interest payments on a specified principal amount (referred to as the "notional amount") for a specified period without the exchange of the underlying principal amount. Interest rate swaps are utilized by the Company to protect against the decrease in value of a fixed-rate asset or the increase in borrowing cost from a short-term, fixed-rate liability, such as reverse repurchase agreements, in an increasing interest-rate environment. At December 31, 1999, the Company had entered into interest rate swaps with an aggregate notional amount of $200.8 million.
The Company also enters into interest rate futures contracts, which are commitments to either purchase or sell designated financial instruments at a future date for a specified price and may be settled in cash or through delivery. Eurodollar futures contracts have been sold by the Company to hedge the repricing or maturity risk of certain short duration mortgage-related securities, and U.S. Treasury futures contracts have been sold by the Company to offset declines in the market value of its fixed-rate loans and certain fixed-rate mortgage-backed and related securities available for sale in the event of an increasing interest rate environment. At December 31, 1999, the Company had entered into futures contracts with an aggregate notional amount of $19.0 million. The Company had no futures contracts outstanding at December 31, 1998.
During 1999, the Company entered into swaption and put option contracts to mitigate its interest rate exposure on anticipated future funding related to certain of its investments in low-income housing tax credit interests. Swaption contracts are options to enter into an interest rate swap agreement at a future date at a specific interest rate. A European put option allows the Company to sell a specified quantity of an asset at a specified price at a specific date. At December 31, 1999, the Company had entered into European swaptions and put options with an aggregate notional amount of $20.9 million.
See Note 22 to the Consolidated Financial Statements. For additional disclosures regarding the Company's interest rate derivative financial instruments (which is incorporated herein by reference).
The Asset/Liability Committee's methods for evaluating interest rate risk include an analysis of the Company's interest rate sensitivity "gap," which is defined as the difference between interest-earning assets and interest-bearing liabilities maturing or repricing within a given time period. A gap is considered positive when the amount of interest-rate sensitive assets exceeds the amount of interest-rate sensitive liabilities. A gap is considered negative when the amount of interest-rate sensitive liabilities exceeds interest-rate sensitive assets. During a period of rising interest rates, a negative gap would tend to adversely affect net interest income, while a positive gap would tend to result in an increase in net interest income. During a period of falling interest rates, a negative gap would tend to result in an increase in net interest income, while a positive gap would tend to affect net interest income adversely. Because different types of assets and liabilities with the same or similar maturities may react differently to changes in overall market rates or conditions, changes in interest rates may affect net interest income positively or negatively even if an institution were perfectly matched in each maturity category.
The following table sets forth the estimated maturity or repricing of the Company's interest-earning assets and interest-bearing liabilities at December 31, 1999. The amounts of assets and liabilities shown within a particular period were determined in accordance with the contractual terms of the assets and liabilities, except (i) adjustable-rate loans, performing discount loans, securities and FHLB advances are included in the period in which they are first scheduled to adjust and not in the period in which they mature, (ii) fixed-rate mortgage-related securities reflect estimated prepayments, which were estimated based on analyses of broker estimates, the results of a prepayment model utilized by the Company and empirical data, (iii) non-performing discount loans reflect the estimated timing of resolutions which result in repayment to the Company, (iv) NOW and money market checking deposits and savings deposits, which do not have contractual maturities, reflect estimated levels of attrition, which are based on detailed studies of each such category of deposit by the Company, and (v) escrow deposits and other non-interest bearing checking accounts, which amounted to $280.3 million at December 31, 1999, are excluded. Management believes that these assumptions approximate actual experience and considers them reasonable; however, the interest rate sensitivity of the Company's assets and liabilities in the table could vary substantially if different assumptions were used or actual experience differs from the historical experience on which the assumptions are based.
56

(1) Balances have not been reduced for non-performing loans.
Although the interest rate sensitivity gap analysis is a useful measurement and contributes toward effective asset and liability management, it is difficult to predict the effect of changing interest rates based solely on that measure. The OTS has established specific minimum guidelines for thrift institutions to observe in the area of interest rate risk as described in Thrift Bulletin No. 13a, "Management of Interest Rate Risk, Investment Securities, and Derivative Activities" ("TB 13a"). Under TB 13a, institutions are required to establish and demonstrate quarterly compliance with board-approved limits on interest rate risk that are defined in terms of net portfolio value ("NPV"), which is defined as the net present value of an institution's existing assets, liabilities and off-balance sheet instruments. These limits specify the minimum net portfolio value ratio ("NPV Ratio") allowable under current interest rates and hypothetical interest rate scenarios. An institution's NPV Ratio for a given interest rate scenario is calculated by dividing the NPV that would result in that scenario by the present value of the institution's assets in that same scenario. The hypothetical scenarios are represented by immediate, permanent, parallel movements in the term structure of interest rates of plus and minus 100, 200 and 300 basis points from the actual term structure observed at quarter end. The current
57
December 31, 1999 ------------------------------------------------- ------------------------- More Than Within Three Four to One Year to Thr ee Years Months Twelve Months Three Years a nd Over Total ------------ ------------- ----------- --- --------- ----------- (Dollars in Thousands) RATE-SENSITIVE ASSETS: Interest-earning deposits ....................... $ 116,399 $ -- $ -- $ -- $ 116,399 Federal funds sold .............................. 112,000 -- -- -- 112,000 Securities available for sale ................... 173,526 190,103 101,623 122,266 587,518 Loans available for sale (1) .................... 1,784 24,491 9,622 9,316 45,213 Investment securities, net ...................... 10,965 -- -- -- 10,965 Loan portfolio, net (1) ......................... 97,697 30,860 18,267 10,584 157,408 Match funded loan and securities ................ 10,483 61,389 39,919 46,003 157,794 Discount loan portfolio, net .................... 85,274 430,679 235,932 161,344 913,229 ----------- ----------- ----------- -- --------- ----------- Total rate-sensitive assets .................... 608,128 737,522 405,363 349,513 2,100,526 ----------- ----------- ----------- -- --------- ----------- RATE-SENSITIVE LIABILITIES: NOW and money market checking deposits .......... 28,630 197 421 1,095 30,343 Savings deposits ................................ 109 193 381 678 1,361 Certificates of deposit ......................... 176,883 583,711 634,745 134,970 1,530,309 ----------- ----------- ----------- -- --------- ----------- Total interest-bearing deposits ................. 205,622 584,101 635,547 136,743 1,562,013 Securities sold under agreements to repurchase .. 47,365 -- -- -- 47,365 Bond-match funded loan agreements ............... 106,097 10,971 24,447 -- 141,515 Obligations outstanding under lines of credit ... 187,866 -- -- -- 187,866 Notes, debentures and other ..................... 6,236 -- -- 311,337 317,573 ----------- ----------- ----------- -- --------- ----------- Total rate-sensitive liabilities ............... 553,186 595,072 659,994 448,080 2,256,332 ----------- ----------- ----------- -- --------- ----------- Interest rate sensitivity gap before off- balance sheet financial instruments ..................... 54,492 142,450 (254,631) (98,567) (155,806) FINANCIAL INSTRUMENTS: Interest rate swaps ............................... 200,780 -- (100,780) (100,000) -- Swaption and put option contracts ................. 399 327 -- -- 726 Futures contracts ................................. 19,000 -- (12,000) (7,000) -- ----------- ----------- ----------- -- --------- ----------- Total rate-sensitive financial instruments ........ 220,179 327 (112,780) (107,000) 726 ----------- ----------- ----------- -- --------- ----------- Interest rate sensitivity gap before financial instruments ..................................... $ 220,179 $ 142,777 $ (367,411) $ (205,567) $ (155,080) =========== =========== =========== == ========= =========== Cumulative interest rate sensitivity gap .......... $ 275,121 $ 417,898 $ 50,487 $ (155,080) =========== =========== =========== == ========= Cumulative interest rate sensitivity gap as a percentage of total rate-sensitive assets ....... 13.10% 19.89% 2.40% (7.38)%

NPV Ratio for each of the seven rate scenarios and the corresponding limits approved by the Board of Directors, and as applied to OCN, is as follows at December 31, 1999:
The Asset/Liability Committee also regularly reviews interest rate risk by forecasting the impact of alternative interest rate environments on net interest income and NPV and evaluating such impacts against the maximum potential changes in net interest income and NPV that is authorized by the Board of Directors, and as applied to OCN. The following table quantifies the potential changes in net interest income and net portfolio value should interest rates go up or down (shocked) 300 basis points, assuming the yield curves of the rate shocks will be parallel to each other. The cash flows associated with the loan portfolios and securities available for sale are calculated based on prepayment and default rates that vary by asset. Projected losses, as well as prepayments, are generated based upon the actual experience with the subject pool, as well as similar, more seasoned pools. To the extent available, loan characteristics such as loan-to-value ratio, interest rate, credit history, prepayment penalty terms and product types are used to produce the projected loss and prepayment assumptions that are included in the cash flow projections of the securities. When interest rates are shocked, these projected loss and prepayment assumptions are further adjusted. For example, under current market conditions, a 100-basis-point decline in the market interest rate is estimated to result in a 200-basis-point increase in the prepayment rate of a typical subprime residential loan. Most commercial and multi-family loans are not subject to prepayments as a result of prepayment penalties and contractual terms which prohibit prepayments during specified periods. However, for those commercial and multi-family loans where prepayments are not currently precluded by contract, declines in interest rates are associated with steep increases in prepayment speeds in computing cash flows. A risk premium is then calculated for each asset, which, when added to the interest rate being modeled, results in a matrix of discount rates that are applied to the cash flows computed by the model. The base interest rate scenario assumes interest rates at December 31, 1999. Actual results could differ significantly from the OCN results estimated in the following table:
Management of the Company believes that the assumptions used by it to evaluate the vulnerability of the Company's operations to changes in interest rates approximate actual experience and considers them reasonable; however, the interest rate sensitivity of the Company's assets and liabilities and the estimated effects of changes in interest rates on the Company's net interest income and NPV could vary substantially if different assumptions are used or actual experience differs from the historical experience on which they are based.
58
Rate Shock Board Limits Current (in basis points) (minimum NPV Ratios) NPV Ratios ----------------- -------------------- ---------- +300 5.00% 20.93% +200 6.00% 20.66% +100 7.00% 20.38% 0 8.00% 20.14% -100 7.00% 19.90% -200 6.00% 19.67% -300 5.00% 19.53%
Change in Interest Rates Estimated Change s in (Rate Shock in basis points) Net Interest NPV ---------------------------- ---------------- ----- --- +300 22.34% 0.89% +200 14.89% 0.54% +100 7.45% 0.15% 0 0.00% 0.00% -100 (7.45)% (0.17)% -200 (14.89)% (0.30)% -300 (22.34)% 0.09%

The following table shows the Company's financial instruments that are sensitive to changes in interest rates, categorized by expected maturity, and the instruments' fair values at December 31, 1999.
(1) Expected maturities are contractual maturities adjusted for prepayments of principal. The Company uses certain assumptions to estimate fair values and expected maturities. For assets, expected maturities are based upon contractual maturity, projected repayments and prepayments of principal. The prepayment experience reflected herein is based on the Company's historical experience. The Company's average Constant Prepayment Rate ("CPR") is 11.49% and 11.78% on its fixed-rate and adjustable-rate portfolios, respectively, for interest-earning assets (excluding investment securities, which do not have prepayment features). The actual maturities of these instruments could vary substantially if future prepayments differ from the Company's historical experience.
(2) Balances have not been reduced for non-performing loans.
59
Expected Maturity Date At December 31, 1999(1) ------- --------------------------------------------------- ----------------------------- Total Fair 2000 2001 2002 2003 2004 The reafter Balance Value ------- --- ---------- ---------- ---------- ---------- --- ------- ---------- ---------- (Dollars in Thousands) Rate-Sensitive Assets: Interest-earning deposits ............. $ 116, 399 $ -- $ -- $ -- $ -- $ -- $ 116,399 $ 116,399 Average interest rate ............... 3 .34% -- -- -- -- -- 3.34% -- Federal funds sold .................... 112, 000 -- -- -- -- -- 112,000 112,000 Average interest rate ............... 4 .30% -- -- -- -- -- 4.30% -- Securities available for sale ......... 363, 628 73,600 28,023 47,028 12,903 62,336 587,518 587,518 Average interest rate ............... 6 .68% 7.70% 7.85% 8.84% 11.32% 13.50% 7.86% Loans available for sale(2) ........... 26, 275 6,079 3,543 1,897 1,161 6,258 45,213 45,213 Average interest rate ............... 10 .78% 10.99% 11.16% 11.15% 11.03% 11.04% 10.90% Investment securities, net ............ 10, 965 -- -- -- -- -- 10,965 10,965 Average interest rate ............... -- -- -- -- -- -- -- Loan portfolio, net(2) ................ 128, 557 11,843 6,424 3,458 2,007 5,119 157,408 157,184 Average interest rate ............... 9 .74% 10.33% 10.26% 10.27% 10.31% 10.38% 9.85% Discount loan portfolio, net(2) ....... 515, 953 173,195 62,737 41,731 28,913 90,700 913,229 935,336 Average interest rate ............... 8 .54% 8.31% 8.31% 8.21% 8.12% 8.32% 8.35% Match funded loans and securities ..... 71, 872 25,747 14,172 5,783 4,773 35,447 157,794 154,623 Average interest rate ............... 8 .55% 7.62% 7.91% 7.17% 7.12% 6.67% 7.83% ------- --- ---------- ---------- ---------- ---------- --- ------- ---------- ---------- Total rate-sensitive assets ....... $1,345, 649 $ 290,464 $ 114,899 $ 99,897 $ 49,757 $ 199,860 $2,100,526 $2,119,238 ======= === ========== ========== ========== ========== === ======= ========== ========== Rate-Sensitive Liabilities: NOW and money market checking deposits. $ 28, 826 $ 227 $ 193 $ 164 $ 140 $ 793 $ 30,343 $ 30,043 Average interest rate ............... 4 .13% 0.48% 0.48% 0.48% 0.48% 0.48% 3.95% Savings deposits ...................... 302 212 169 136 108 434 1,361 1,297 Average interest rate ............... 2 .38% 2.38% 2.38% 2.38% 2.38% 2.38% 2.38% Certificates of deposit ............... 760, 594 400,619 234,126 73,646 37,294 24,030 1,530,309 1,536,726 Average interest rate ............... 5 .80% 5.97% 6.16% 5.79% 6.51% 5.86% 5.92% ------- --- ---------- ---------- ---------- ---------- --- ------- ---------- ---------- Total interest-bearing deposits ... 789, 722 401,058 234,488 73,946 37,542 25,257 1,562,013 1,568,066 Securities sold under agreements to repurchase........................... 47, 365 -- -- -- -- -- 47,365 47,365 Average interest rate ............... 8 .28% -- -- -- -- -- 8.28% Obligations outstanding under lines of credit........................... 187, 866 -- -- -- -- -- 187,866 187,866 Average interest rate ............... 7 .52% -- -- -- -- -- 7.52% Notes, debentures and other ........... 6, 236 -- -- 103,850 -- 207,487 317,573 290,244 Average interest rate ............... 8 .32% -- -- 11.88% -- 11.66% 11.67% Bond funded loan agreements ........... 117, 067 24,448 -- -- -- -- 141,515 141,557 Average Interest rate ............... 7 .17% 9.50% -- -- -- -- 7.58% ------- --- ---------- ---------- ---------- ---------- --- ------- ---------- ---------- Total rate-sensitive liabilities .. $1,148, 256 $ 425,506 $ 234,488 $ 177,796 $ 37,542 $ 232,744 $2,256,332 $2,235,098 ======= === ========== ========== ========== ========== === ======= ========== ==========
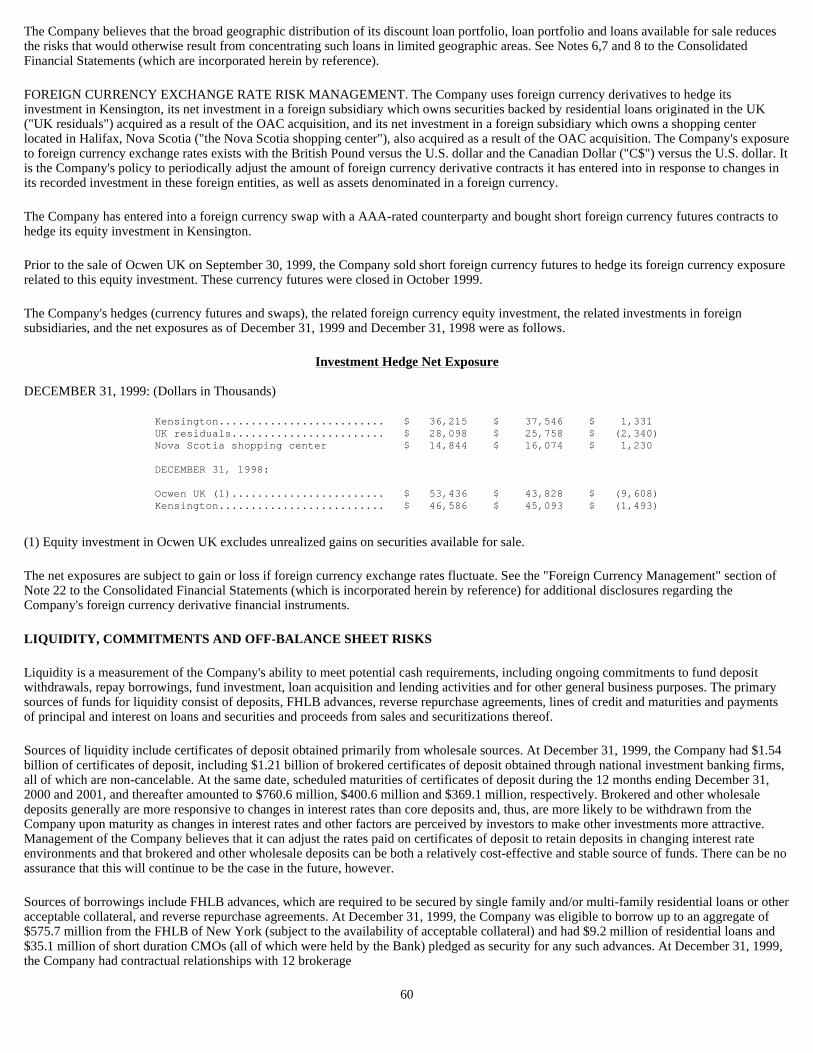
The Company believes that the broad geographic distribution of its discount loan portfolio, loan portfolio and loans available for sale reduces the risks that would otherwise result from concentrating such loans in limited geographic areas. See Notes 6,7 and 8 to the Consolidated Financial Statements (which are incorporated herein by reference).
FOREIGN CURRENCY EXCHANGE RATE RISK MANAGEMENT. The Company uses foreign currency derivatives to hedge its investment in Kensington, its net investment in a foreign subsidiary which owns securities backed by residential loans originated in the UK ("UK residuals") acquired as a result of the OAC acquisition, and its net investment in a foreign subsidiary which owns a shopping center located in Halifax, Nova Scotia ("the Nova Scotia shopping center"), also acquired as a result of the OAC acquisition. The Company's exposure to foreign currency exchange rates exists with the British Pound versus the U.S. dollar and the Canadian Dollar ("C$") versus the U.S. dollar. It is the Company's policy to periodically adjust the amount of foreign currency derivative contracts it has entered into in response to changes in its recorded investment in these foreign entities, as well as assets denominated in a foreign currency.
The Company has entered into a foreign currency swap with a AAA-rated counterparty and bought short foreign currency futures contracts to hedge its equity investment in Kensington.
Prior to the sale of Ocwen UK on September 30, 1999, the Company sold short foreign currency futures to hedge its foreign currency exposure related to this equity investment. These currency futures were closed in October 1999.
The Company's hedges (currency futures and swaps), the related foreign currency equity investment, the related investments in foreign subsidiaries, and the net exposures as of December 31, 1999 and December 31, 1998 were as follows.
Investment Hedge Net Exposure DECEMBER 31, 1999: (Dollars in Thousands)
(1) Equity investment in Ocwen UK excludes unrealized gains on securities available for sale.
The net exposures are subject to gain or loss if foreign currency exchange rates fluctuate. See the "Foreign Currency Management" section of Note 22 to the Consolidated Financial Statements (which is incorporated herein by reference) for additional disclosures regarding the Company's foreign currency derivative financial instruments.
LIQUIDITY, COMMITMENTS AND OFF-BALANCE SHEET RISKS
Liquidity is a measurement of the Company's ability to meet potential cash requirements, including ongoing commitments to fund deposit withdrawals, repay borrowings, fund investment, loan acquisition and lending activities and for other general business purposes. The primary sources of funds for liquidity consist of deposits, FHLB advances, reverse repurchase agreements, lines of credit and maturities and payments of principal and interest on loans and securities and proceeds from sales and securitizations thereof.
Sources of liquidity include certificates of deposit obtained primarily from wholesale sources. At December 31, 1999, the Company had $1.54 billion of certificates of deposit, including $1.21 billion of brokered certificates of deposit obtained through national investment banking firms, all of which are non-cancelable. At the same date, scheduled maturities of certificates of deposit during the 12 months ending December 31, 2000 and 2001, and thereafter amounted to $760.6 million, $400.6 million and $369.1 million, respectively. Brokered and other wholesale deposits generally are more responsive to changes in interest rates than core deposits and, thus, are more likely to be withdrawn from the Company upon maturity as changes in interest rates and other factors are perceived by investors to make other investments more attractive. Management of the Company believes that it can adjust the rates paid on certificates of deposit to retain deposits in changing interest rate environments and that brokered and other wholesale deposits can be both a relatively cost-effective and stable source of funds. There can be no assurance that this will continue to be the case in the future, however.
Sources of borrowings include FHLB advances, which are required to be secured by single family and/or multi-family residential loans or other acceptable collateral, and reverse repurchase agreements. At December 31, 1999, the Company was eligible to borrow up to an aggregate of $575.7 million from the FHLB of New York (subject to the availability of acceptable collateral) and had $9.2 million of residential loans and $35.1 million of short duration CMOs (all of which were held by the Bank) pledged as security for any such advances. At December 31, 1999, the Company had contractual relationships with 12 brokerage
60
Kensington.......................... $ 36,215 $ 37,546 $ 1,331 UK residuals........................ $ 28,098 $ 25,758 $ (2,340) Nova Scotia shopping center $ 14,844 $ 16,074 $ 1,230 DECEMBER 31, 1998: Ocwen UK (1)........................ $ 53,436 $ 43,828 $ (9,608) Kensington.......................... $ 46,586 $ 45,093 $ (1,493)
firms and the FHLB of New York pursuant to which it could obtain funds from reverse repurchase agreements. At December 31, 1999, the Company had unrestricted cash and cash equivalents of $334.6 million, $357.1 million of short duration CMOs and $105.1 million of subordinate and residual mortgages which could be used to secure additional borrowings. At December 31, 1999, the Company had no outstanding FHLB advances.
The Company believes that its existing sources of liquidity, including internally generated funds, will be adequate to fund planned activities for the foreseeable future, although there can be no assurances in this regard. Moreover, the Company continues to evaluate other sources of liquidity, such as lines of credit from unaffiliated parties, which will enhance the management of its liquidity and the costs thereof. Please also see the "Short-Term Highly Liquid Investments," "Securities Sold Under Agreements to Repurchase," and "Derivative Financial Instruments" sections of Note 1 and Notes 3, 9, 16, 17, 18, 20, 31 and 32 to the Consolidated Financial Statements (which are incorporated herein by reference).
The Company's operating activities (used) provided $(180.5) million, $288.3 million and $60.7 million of cash flows during 1999, 1998 and 1997, respectively. During the foregoing years, cash resources were provided primarily by net income and proceeds from sales of loans available for sale, and cash resources were used primarily to purchase and originate loans available for sale.
The Company's investing activities provided (used) cash flows totaling $482.4 million, $(220.3) million and $(443.6) million during 1999, 1998 and 1997, respectively. During the foregoing years, cash flows from investing activities were provided primarily by principal payments on discount loans and loans held for investment, maturities of and principal payments received on securities available for sale and proceeds from sales of discount loans, securities available for sale and real estate owned. Cash flows from investing activities were primarily utilized to purchase discount loans and securities available for sale. Cash flows from investing activities for 1999 included $122.1 million of proceeds from the sale of Ocwen UK. Cash flows used for investing activities in 1998 included $426.1 million for the acquisitions of subsidiaries, primarily Ocwen UK.
The Company's financing activities (used) provided cash flows of $(365.2) million, $225.3 million, and $482.5 million during 1999, 1998 and 1997, respectively. Cash flows from financing activities were primarily related to changes in the Company's deposits, issuance of obligations outstanding under lines of credit and issuance of common stock and the Capital Securities in 1997. Cash flows from financing activities were primarily utilized to repay reverse repurchase agreements and obligations outstanding under lines of credit, as well as the repurchase of debt and common stock in 1999.
The Bank is required under applicable federal regulations to maintain specified levels of "liquid" investments in qualifying types of U.S. government, federal agency and other investments having maturities of five years or less. Current OTS regulations require that a savings association maintain liquid assets of not less than 4% of its average daily balance of net withdrawable deposit accounts and borrowings payable in one year or less. Monetary penalties may be imposed for failure to meet applicable liquidity requirements. The Bank's liquidity, as measured for regulatory purposes, averaged 11.73%, 8.34%, 5.6%, 8.8% and 12.9% during the years ended December 31, 1999, 1998, 1997, 1996 and 1995, respectively, and amounted to 10.92% at December 31, 1999.
The Bank's ability to make capital distributions pursuant to the OTS capital distribution regulations is limited by the regulatory capital levels which it has committed to the OTS it would maintain, commencing on June 30, 1997. As a result of a verbal agreement between the Bank and the OTS to dividend subordinate and residual mortgage-related securities resulting from securitization activities conducted by the Bank, the Bank has been limited in its ability to pay cash dividends to the Company. The Bank held no subordinate or residual mortgage-related securities at December 31, 1999. See "Regulatory Capital Requirements." In addition to the foregoing OTS limitations, there are certain contractual restrictions on the Bank's ability to pay dividends as set forth in the indenture governing the Bank's 12% Debentures. See Note 19 to the Consolidated Financial Statements (which is incorporated herein by reference). Future cash dividends depend on future operating results of the Bank.
There are restrictions on OAC's ability to pay dividends under the Indenture governing OAC's 11.5% Redeemable Notes. As of December 31, 1999, OAC was not permitted to pay dividends under the Indenture. See Note 19 to the Consolidated Financial Statements (which is incorporated herein by reference).
At December 31, 1999, the Company had $26.0 million of unfunded commitments related to the origination of loans and funding of construction loans. Management of the Company believes that the Company has adequate resources to fund all such unfunded commitments to the extent required and that substantially all of such unfunded commitments will be funded during 1999. See Note 30 to the Consolidated Financial Statements (which is incorporated herein by reference).
In addition to commitments to extend credit, the Company is party to various off-balance sheet financial instruments in the normal course of the Company's business in order to manage its interest rate risk and foreign currency exchange rate risk. See "Asset and Liability Management" above.
The Company conducts business with a variety of financial institutions and other companies in the normal course of business, including counterparties to its off-balance sheet financial instruments. The Company is subject to potential financial loss if the counterparty is unable to complete an agreed upon transaction. The Company seeks to limit counterparty risk through financial analysis, dollar limits and other monitoring procedures.
61

REGULATORY CAPITAL AND OTHER REQUIREMENTS
Federally-insured institutions such as the Bank are required to maintain minimum levels of regulatory capital. These standards generally must be as stringent as the comparable capital requirements imposed on national banks. In addition to regulatory capital requirements of general applicability, a federally-chartered savings association such as the Bank may be required to meet individual minimum capital requirements established by the OTS on a case-by-case basis upon a determination that a savings association's capital is or may become inadequate in view of its circumstances.
Following an examination in late 1996 and early 1997, the Bank committed to the OTS to maintain a core capital (leverage) ratio and a total risk-based capital ratio of at least 9% and 13%, respectively. The Bank continues to be in compliance with this commitment as well as the regulatory capital requirements of general applicability, as indicated in Note 26 to the Consolidated Financial Statements (which is incorporated herein by reference). The Bank's core capital, Tier 1 risk-based capital and total risk-based capital ratios at December 31, 1999, were 10.67%, 14.02% and 19.12%, respectively, placing the Bank in the "well-capitalized" category as defined by federal regulations. Based on discussions with the OTS, the Bank believes that this commitment does not affect its status as a "well-capitalized" institution, assuming the Bank's continued compliance with the regulatory capital requirements required to be maintained by it pursuant to such commitment.
Although the above individual regulatory capital requirements have been agreed to by the OTS, there can be no assurance that in the future the OTS will agree to a decrease in such requirements or will not seek to increase such requirements or will not impose these or other individual regulatory capital requirements in a manner which affects the Bank's status as a "well-capitalized" institution under applicable laws and regulations.
RECENT ACCOUNTING DEVELOPMENTS
For information relating to the effects on the Company of the adoption of recent accounting standards, see Note 1 to the Consolidated Financial Statements (which is incorporated herein by reference).
YEAR 2000 DATE CONVERSION
The Company did not experience any significant malfunctions or errors in its computer systems and applications when the year changed from 1999 to 2000, nor were business operations disrupted. Prior to December 31, 1999, the Company completed its project plan to achieve year 2000 readiness of its mission critical and non-mission critical systems, including hardware infrastructure and software applications. The project plan was divided into six phases: identification, evaluation, remediation, validation, risk assessment and contingency planning.
During the course of the project, the Company expended approximately 131% of budgeted manhours and incurred costs of approximately $2.7 million, which included approximately $309,000 for Year 2000 testing tools, additional hardware, and outside consulting assistance, while the remainder consisted of labor and overhead expense from within the Company.
During 1998 and 1999, the Company substantially completed the systems identification and evaluation phases of the project as well as remediation and validation of its mission critical systems. The Company also focused on any remaining validation tasks, including remediation and validation of its non-mission critical systems and end-to-end testing with third parties.
As part of the identification and evaluation phases of the project, the Company documented critical operating functions within each business unit, as well as strategic third-party and vendor relationships. These efforts also served as the basis of the Company's year 2000 risk assessment and contingency planning efforts. The Company retained in a business continuity expert to prepare contingency plans and assist with the testing and validation of these plans. The business continuity expert reviewed the Company's year 2000 customer disclosure, mission critical systems testing results, critical vendor listings, software and hardware inventories, and disaster recovery plans for critical business units. On the basis of this review, the business continuity expert built a Company intranet business continuity template and database and established roles and responsibilities for key personnel in the business continuity plan.
The Company believes that any Year 2000 problems that may still occur in its computer systems and applications are likely to be minor and correctable. In addition, the Company still could be negatively affected by potential failures in non-critical vendor or customer computer systems or end-to-end disruptions involving as yet unidentified, and hence untested, third-party systems and records stored on those systems. The Company is currently not aware of any significant Year 2000 or related problems that have arisen for its customers or vendors.
FORWARD-LOOKING STATEMENTS
CERTAIN STATEMENTS CONTAINED HEREIN ARE NOT, AND CERTAIN STATEMENTS CONTAINED IN FUTURE FILINGS BY THE COMPANY WITH THE SECURITIES AND EXCHANGE COMMISSION (THE "COMMISSION"), IN THE COMPANY'S PRESS RELEASES OR IN THE COMPANY'S OTHER PUBLIC OR SHAREHOLDER COMMUNICATIONS MAY NOT BE, BASED ON HISTORICAL FACTS AND ARE "FORWARD-LOOKING STATEMENTS" WITHIN THE MEANING OF SECTION 27A OF THE SECURITIES ACT OF 1933, AS AMENDED, AND SECTION 21E OF THE SECURITIES EXCHANGE ACT OF 1934, AS AMENDED.

62

THESE FORWARD-LOOKING STATEMENTS, WHICH ARE BASED ON VARIOUS ASSUMPTIONS (SOME OF WHICH ARE BEYOND THE COMPANY'S CONTROL), MAY BE IDENTIFIED BY REFERENCE TO A FUTURE PERIOD(S) OR BY THE USE OF FORWARD-LOOKING TERMINOLOGY SUCH AS "ANTICIPATE," "BELIEVE," "COMMITMENT," "CONSIDER," "CONTINUE," "COULD," "ENCOURAGE," "ESTIMATE," "EXPECT," "FORESEE," "INTEND," "IN THE EVENT OF," "MAY," "PLAN," "PRESENT," "PROPOSE," "PROSPECT," "UPDATE," "WHETHER," "WILL," "WOULD," FUTURE OR CONDITIONAL VERB TENSES, SIMILAR TERMS, VARIATIONS ON SUCH TERMS OR NEGATIVES OF SUCH TERMS. ALTHOUGH THE COMPANY BELIEVES THE ANTICIPATED RESULTS OR OTHER EXPECTATIONS REFLECTED IN SUCH FORWARD-LOOKING STATEMENTS ARE BASED ON REASONABLE ASSUMPTIONS, IT CAN GIVE NO ASSURANCE THAT THOSE RESULTS OR EXPECTATIONS WILL BE ATTAINED. ACTUAL RESULTS COULD DIFFER MATERIALLY FROM THOSE INDICATED IN SUCH STATEMENTS DUE TO RISKS, UNCERTAINTIES AND CHANGES WITH RESPECT TO A VARIETY OF FACTORS, INCLUDING, BUT NOT LIMITED TO, INTERNATIONAL, NATIONAL, REGIONAL OR LOCAL ECONOMIC ENVIRONMENTS (PARTICULARLY IN THE MARKET AREAS WHERE THE COMPANY OPERATES), GOVERNMENT FISCAL AND MONETARY POLICIES (PARTICULARLY IN THE MARKET AREAS WHERE THE COMPANY OPERATES), PREVAILING INTEREST OR CURRENCY EXCHANGE RATES, EFFECTIVENESS OF INTEREST RATE, CURRENCY AND OTHER HEDGING STRATEGIES, LAWS AND REGULATIONS AFFECTING FINANCIAL INSTITUTIONS, INVESTMENT COMPANIES AND REAL ESTATE (INCLUDING REGULATORY FEES, CAPITAL REQUIREMENTS, ACCESS FOR DISABLED PERSONS AND ENVIRONMENTAL COMPLIANCE), UNCERTAINTY OF FOREIGN LAWS, COMPETITIVE PRODUCTS, PRICING AND CONDITIONS (INCLUDING FROM COMPETITORS THAT HAVE SIGNIFICANTLY GREATER RESOURCES THAN THE COMPANY), CREDIT, PREPAYMENT, BASIS, DEFAULT, SUBORDINATION AND ASSET/LIABILITY RISKS, LOAN SERVICING EFFECTIVENESS, ABILITY TO IDENTIFY ACQUISITIONS AND INVESTMENT OPPORTUNITIES MEETING THE COMPANY'S INVESTMENT STRATEGY, THE COURSE OF NEGOTIATIONS AND THE ABILITY TO REACH AGREEMENT WITH RESPECT TO THE MATERIAL TERMS OF ANY PARTICULAR TRANSACTION, SATISFACTORY DUE DILIGENCE RESULTS, SATISFACTION OR FULFILLMENT OF AGREED UPON TERMS AND CONDITIONS OF CLOSING OR PERFORMANCE, THE TIMING OF TRANSACTION CLOSINGS, SOFTWARE INTEGRATION, DEVELOPMENT AND LICENSING, AVAILABILITY OF AND COSTS ASSOCIATED WITH OBTAINING ADEQUATE AND TIMELY SOURCES OF LIQUIDITY, ABILITY TO REPAY OR REFINANCE INDEBTEDNESS (AT MATURITY OR UPON ACCELERATION), TO MEET COLLATERAL CALLS BY LENDERS (UPON RE-VALUATION OF THE UNDERLYING ASSETS OR OTHERWISE), TO GENERATE REVENUES SUFFICIENT TO MEET DEBT SERVICE PAYMENTS AND OTHER OPERATING EXPENSES, AVAILABILITY OF DISCOUNT LOANS FOR PURCHASE, SIZE OF, NATURE OF AND YIELDS AVAILABLE WITH RESPECT TO THE SECONDARY MARKET FOR MORTGAGE LOANS, FINANCIAL, SECURITIES AND SECURITIZATION MARKETS IN GENERAL, ALLOWANCES FOR LOAN LOSSES, CHANGES IN REAL ESTATE CONDITIONS (INCLUDING LIQUIDITY, VALUATION, REVENUES, RENTAL RATES, OCCUPANCY LEVELS AND COMPETING PROPERTIES), ADEQUACY OF INSURANCE COVERAGE IN THE EVENT OF A LOSS, OTHER FACTORS GENERALLY UNDERSTOOD TO AFFECT THE REAL ESTATE ACQUISITION, MORTGAGE AND LEASING MARKETS AND SECURITIES INVESTMENTS, AND OTHER RISKS DETAILED FROM TIME TO TIME IN THE COMPANY'S REPORTS AND FILINGS WITH THE COMMISSION, INCLUDING ITS REGISTRATION STATEMENTS ON FORMS S-1 AND S-3 AND PERIODIC REPORTS ON FORMS 10-Q, 8-K AND 10-K AND EXHIBIT 99.1, RISK FACTORS, TO THE COMPANY'S FORM 10-K FOR THE YEAR ENDED DECEMBER 31, 1999. GIVEN THESE UNCERTAINTIES, READERS ARE CAUTIONED NOT TO PLACE UNDUE RELIANCE ON SUCH STATEMENTS. THE COMPANY DOES NOT UNDERTAKE, AND SPECIFICALLY DISCLAIMS ANY OBLIGATION, TO PUBLICLY RELEASE THE RESULT OF ANY REVISIONS THAT MAY BE MADE TO ANY FORWARD-LOOKING STATEMENTS TO REFLECT THE OCCURRENCE OF ANTICIPATED OR UNANTICIPATED EVENTS OR CIRCUMSTANCES AFTER THE DATE OF SUCH STATEMENTS.
63
REPORT OF MANAGEMENT
The management of Ocwen is responsible for the preparation and fair presentation of the financial statements and other financial information contained in this annual report. The accompanying consolidated financial statements have been prepared in conformity with accounting principles generally accepted in the United States applied on a consistent basis and include amounts based on management's best estimates and judgments. Nonfinancial information included in this annual report has also been prepared by management and is consistent with the consolidated financial statements. In the opinion of management, the consolidated financial statements fairly reflect the Company's financial position, results of operations and cash flows.
To assure that financial information is reliable and assets are safeguarded, management has established and maintains an effective system of internal accounting controls and procedures that provide reasonable assurance as to the integrity and reliability of the financial statements, the protection of assets against loss from unauthorized use or disposition and the prevention and detection of errors and irregularities on a timely basis.
PricewaterhouseCoopers LLP conducts its audit of the consolidated financial statements in accordance with auditing standards generally accepted in the United States. Such standards include the evaluation of internal accounting controls to establish a basis for developing the scope of its examination of the consolidated financial statements. In addition to the use of independent certified public accountants, the Company maintains a professional staff of internal auditors who conduct financial, procedural and special audits. To ensure their independence, both PricewaterhouseCoopers LLP and the internal auditors have direct access to the Audit Committee of the Board of Directors.
The Audit Committee, which consists solely of independent directors of the Company, makes recommendations to the Board of Directors concerning the appointment of the independent certified public accountants and meets with PricewaterhouseCoopers LLP and the internal auditors to discuss the results of their audits, the Company's internal accounting controls and financial reporting matters.
64
/s/ WILLIAM C. ERBEY /s/ MARK S. ZEIDMAN -------------------------------------------------------------------------------- William C. Erbey Mark S. Zeidman Chairman and Chief Executive Officer Senior Vice President and Chief Financial Officer --------------------------------------------------------------------------------

OCWEN FINANCIAL CORPORATION
PRICEWATERHOUSECOOPERS LLP
PRICEWATERHOUSECOOPERS LLP 200 East Las Olas Boulevard
Suite 1700 Fort Lauderdale, FL 33301 Telephone (954) 764-7111
REPORT OF INDEPENDENT CERTIFIED PUBLIC ACCOUNTANTS
To the Board of Directors and Stockholders of Ocwen Financial Corporation
In our opinion, the accompanying consolidated statements of financial condition and the related consolidated statements of operations, of comprehensive income, of changes in stockholders' equity and of cash flows present fairly, in all material respects, the financial position of Ocwen Financial Corporation (the "Company") and its subsidiaries at December 31, 1999 and 1998, and the results of their operations and their cash flows for each of the three years in the period ended December 31, 1999, in conformity with accounting principles generally accepted in the United States. These financial statements are the responsibility of the Company's management; our responsibility is to express an opinion on these financial statements based on our audits. We conducted our audits of these statements in accordance with auditing standards generally accepted in the United States, which require that we plan and perform the audits to obtain reasonable assurance about whether the financial statements are free of material misstatement. An audit includes examining, on a test basis, evidence supporting the amounts and disclosures in the financial statements, assessing the accounting principles used and significant estimates made by management, and evaluating the overall financial statement presentation. We believe that our audits provide a reasonable basis for the opinion expressed above.
65
/s/ PRICEWATERHOUSECOOPERS LLP PRICEWATERHOUSECOOPERS LLP Fort Lauderdale, Florida February 9, 2000

66
OCWEN FINANCIA L CORPORATION AND SUBSIDIARIES CONSOLIDATED ST ATEMENTS OF FINANCIAL CONDITION (DOLLARS IN T HOUSANDS, EXCEPT SHARE DATA) December 31, 1999 Dec ember 31, 1998 ----------------- --- -------------- ASSETS: Cash and amounts due from depository institutions . ............................. $ 153,459 $ 120,805 Interest earning deposits ......................... ............................. 116,399 49,374 Federal funds sold ................................ ............................. 112,000 275,000 Securities available for sale, at fair value ...... ............................. 587,518 593,347 Loans available for sale, at lower of cost or marke t ........................... 45,213 177,847 Investment securities ............................. ............................. 10,965 10,825 Loan portfolio, net ............................... ............................. 157,408 230,312 Match funded loans and securities, net ............ ............................. 157,794 -- Discount loan portfolio, net ...................... ............................. 913,229 1,026,511 Investments in low-income housing tax credit intere sts ......................... 150,989 144,164 Investments in unconsolidated entities ............ ............................. 37,118 86,893 Real estate owned, net ............................ ............................. 167,506 201,551 Investment in real estate ......................... ............................. 268,241 36,860 Premises and equipment, net ....................... ............................. 49,038 33,823 Income taxes receivable ........................... ............................. -- 34,333 Deferred tax asset, net ........................... ............................. 136,920 66,975 Excess of purchase price over net assets acquired . ............................. 13,207 12,706 Principal, interest and dividends receivable ...... ............................. 10,024 18,993 Escrow advances on loans and loans serviced for oth ers ......................... 162,548 108,078 Other assets ...................................... ............................. 59,737 98,711 ----------- ----------- $ 3,309,313 $ 3,327,108 =========== =========== LIABILITIES AND STOCKHOLDERS' EQUITY LIABILITIES: Deposits ........................................ ............................. $ 1,842,286 $ 2,194,816 Securities sold under agreements to repurchase .. ............................. 47,365 72,051 Bonds-match funded agreements ................... ............................. 141,515 -- Obligations outstanding under lines of credit ... ............................. 187,866 179,285 Notes, debentures and other interest bearing obli gations ..................... 317,573 225,000 Accrued interest payable ........................ ............................. 32,569 33,706 Excess of net assets acquired over purchase price ............................ 56,841 -- Income taxes payable ............................ ............................. 6,369 -- Accrued expenses, payables and other liabilities ............................. 57,487 60,282 ----------- ----------- Total liabilities ........................... ............................. 2,689,871 2,765,140 ----------- ----------- Company obligated, mandatorily redeemable securitie s of subsidary trust holding solely junior subordinated deben tures of the Company ........ 110,000 125,000 Minority interest ................................. ............................. -- 592 COMMITMENTS AND CONTINGENCIES (NOTE 30) STOCKHOLDERS' EQUITY: Preferred stock, $.01 par value; 20,000,000 shar es authorized; 0 shares issued and outstanding ....................... ............................. -- -- Common stock, $.01 par value; 200,000,000 share s authorized; 68,571,575 and 60,800,357 shares issued and outstanding at De cember 31, 1999, and December 31, 1998, respectively ....................... ............................. 686 608 Additional paid-in capital ..................... ............................. 232,340 166,234 Retained earnings .............................. ............................. 277,002 257,170 Accumulated other comprehensive income, net of t axes: Net unrealized gain on securities available fo r sale ...................... 163 14,057 Net unrealized foreign currency translation lo ss .......................... (749) (1,693) ----------- ----------- Total stockholders' equity ..................... ............................. 509,442 436,376 ----------- ----------- $ 3,309,313 $ 3,327,108 =========== =========== THE ACCOMPANYING NOTES ARE AN INTEGR AL PART OF THESE CONSOLIDATED FINANCIAL STATEMENTS.

OCWEN FINANCIA L CORPORATION AND SUBSIDIARIES CONSOLIDATE D STATEMENTS OF OPERATIONS (DOLLARS IN T HOUSANDS, EXCEPT SHARE DATA) For the Years Ended Dece mber 31, ------------------------------ -------------- 1999 1998 1997 ------------ ------------ ------------ INTEREST INCOME: Federal funds sold and repurchase agreements .... .................. $ 8,942 $ 7,930 $ 8,975 Securities available for sale ................... .................. 62,698 40,320 28,545 Loans available for sale ........................ .................. 25,724 56,791 18,368 Investment securities and other ................. .................. 2,086 3,197 4,045 Loans ........................................... .................. 28,683 38,609 54,701 Match funded loans and securities ............... .................. 3,237 -- -- Discount loans .................................. .................. 121,854 160,847 157,649 Securities held for trading ..................... .................. -- -- 248 ------------ ------------ ------------ 253,224 307,694 272,531 ------------ ------------ ------------ INTEREST EXPENSE: Deposits ........................................ .................. 98,370 116,584 122,070 Securities sold under agreements to repurchase .. .................. 7,456 6,514 1,000 Obligations outstanding under lines of credit ... .................. 16,318 34,587 5,578 Bonds-match funded agreements ................... .................. 2,101 -- -- Notes, debentures and other interest bearing obli gations .......... 31,297 27,208 27,641 ------------ ------------ ------------ 155,542 184,893 156,289 ------------ ------------ ------------ Net interest income before provision for loan los ses .............. 97,682 122,801 116,242 Provision for loan losses ....................... .................. 6,710 18,509 32,218 ------------ ------------ ------------ Net interest income after provision for loan loss es ............... 90,972 104,292 84,024 ------------ ------------ ------------ NON-INTEREST INCOME: Servicing fees and other charges ................ .................. 75,437 59,180 25,962 Gain on interest earning assets, net ............ .................. 44,298 129,988 82,212 Impairment charges on securities available for sa le ............... (58,777) (129,714) -- (Loss) gain on real estate owned, net ........... .................. (2,060) 14,033 7,277 Amortization of excess of net assets acquired ove r purchase price . 3,201 -- -- Other income .................................... .................. 83,620 39,696 8,498 ------------ ------------ ------------ 145,719 113,183 123,949 ------------ ------------ ------------ NON-INTEREST EXPENSE: Compensation and employee benefits .............. .................. 102,173 115,556 77,573 Occupancy and equipment ......................... .................. 18,501 17,652 8,742 Technology and communication costs .............. .................. 19,647 17,560 9,492 Loan expenses ................................... .................. 12,618 25,373 7,059 Net operating losses on investments in real estat e and certain low-income housing tax credit interests ....... .................. 7,368 8,621 4,792 Amortization and write-off of excess of purchase price over net assets acquired ...................... .................. 4,448 11,614 557 Other operating expenses ........................ .................. 31,390 31,886 18,659 ------------ ------------ ------------ 196,145 228,262 126,874 ------------ ------------ ------------ Distributions on Company-obligated, mandatory redee mable securities of subsidiary trust holding solely j unior subordinated debentures ....................... .................. 13,111 13,594 5,249 Equity in (losses) earnings of investments in uncon solidated entities (12,616) (7,985) 23,688 ------------ ------------ ------------ Income (loss) before income taxes and extraordinary gain ............ 14,819 (32,366) 99,538 Income tax (expense) benefit ...................... .................. (2,608) 30,699 (21,309) Minority interest in net loss of consolidated subsi diary ............ 638 467 703 ------------ ------------ ------------ Income (loss) before extraordinary gain ........... .................. 12,849 (1,200) 78,932 Extraordinary gain on repurchase of debt, net of ta xes .............. 6,983 -- -- ------------ ------------ ------------ Net income (loss) ................................. .................. $ 19,832 $ (1,200) $ 78,932 ============ ============ ============ EARNINGS (LOSS) PER SHARE: Basic: Net income (loss) before extraordinary gain ... .................. $ 0.20 $ (0.02) $ 1.40 Extraordinary gain ............................ .................. 0.11 -- -- ------------ ------------ ------------ Net income (loss) ............................. .................. $ 0.31 $ (0.02) $ 1.40 ============ ============ ============

67
Diluted: Net income (loss) before extraordinary gain ... .................. $ 0.20 $ (0.02) $ 1.39 Extraordinary gain ............................ .................. 0.11 -- -- ------------ ------------ ------------ Net income (loss) ............................. .................. $ 0.31 $ (0.02) $ 1.39 ============ ============ ============ Weighted average common shares outstanding: Basic ........................................... .................. 63,051,015 60,736,950 56,185,956 Diluted ......................................... .................. 63,090,282 60,736,950 56,836,484 THE ACCOMPANYING NOTES ARE AN INTEGR AL PART OF THESE CONSOLIDATED FINANCIAL STATEMENTS.

68
OCWEN FINANCIA L CORPORATION AND SUBSIDIARIES CONSOLIDATE STA TEMENTS OF COMPREHENSIVE INCOME (DO LLARS IN THOUSANDS) For the Years Ended De cember 31, ------------------------- ------------ 1999 1998 1997 -------- -------- -------- Net income (loss) ................................. ..................... $ 19,832 $ (1,200) $ 78,932 -------- -------- -------- Other comprehensive (loss) income, net of taxes: Change in unrealized loss (gain) on securities av ailable for sale arising during the year ....................... ..................... (9,338) 1,493 (8,500) Less: Reclassification adjustment ............... ..................... (4,556) 17,578 -- -------- -------- -------- Net change in unrealized loss (gain) on secur ities available for sale (net of a tax benefit (ex pense) of $7,771 and $(16,673) for 1999 and 1998, resp ectively) ........... (13,894) 19,071 (8,500) -------- -------- -------- Change in unrealized foreign currency translation adjustment arising during the year ............................... ..................... (240) (1,693) -- Less: Reclassification adjustment for losses on f oreign currency translation adjustment included in net income . ..................... 1,184 -- -- -------- -------- -------- Net change in unrealized foreign currency transla tion loss (net of tax (expense) benefit of $(514) and $912 for 1999 and 1998, respectively) ................................. ..................... 944 (1,693) -- -------- -------- -------- Other comprehensive (loss) income ............... ..................... (12,950) 17,378 (8,500) -------- -------- -------- Comprehensive income .............................. ..................... $ 6,882 $ 16,178 $ 70,432 ======== ======== ======== Disclosure of reclassification adjustment: Unrealized holding losses arising during the year on securities sold or impaired ................................... ..................... $(36,671) $(37,390) Add: Adjustment for realized losses and impairmen t charges on securities available for sale included in net i ncome (loss) ........ 32,115 54,968 -------- -------- Net reclassification adjustment for (gains) losse s recognized in other comprehensive income (loss) in prior years (net of tax benefit (expense) of $2,558 and $(27,448) for 1999 and 1998, respectively).. $ (4,556) $ 17,578 ======== ======== THE ACCOMPANYING NOTES ARE AN INTEGR AL PART OF THESE CONSOLIDATED FINANCIAL STATEMENTS.

69
OCWEN F INANCIAL CORPORATION AND SUBSIDIARIES CONSOLIDATED S TATEMENTS OF CHANGES IN STOCKHOLDERS' EQUITY FOR THE YEA RS ENDED DECEMBER 31, 1999, 1998, AND 1997 (DOLLARS IN THOUSANDS) Notes Accumulated Receivable Other on Exercise Common Stock Additional Comprehensi ve of Common ------------ ------------- Paid-in Retained Income, Stock Shares Amount Capital Earnings Net of Taxe s Options Total ------------ ------------ ------------ ------------ ----------- -- ------------ ------------ > Balances at December 31, 1996 ....... 53,488,340 $ 535 $ 22,990 $ 180,417 $ 3,48 6 $ (3,832) $ 203,596 Net income .......................... -- -- -- 78,932 - - -- 78,932 Issuance of common stock ............ 6,906,198 69 141,934 -- - - -- 142,003 Repurchase of common stock options .. -- -- (3,208) -- - - -- (3,208) Exercise of common stock options .... 171,297 2 3,035 -- - - -- 3,037 Notes receivable on exercise of common stock options, net of advances .................. -- -- -- -- - - 3,832 3,832 Other comprehensive income, net of taxes: Change in unrealized gain (loss) on securities, available for sale....................... -- -- -- -- (8,50 0) -- (8,500) ------------ ------------ ------------ ------------ ----------- - ------------ ------------ Balances at December 31, 1997 ....... 60,565,835 606 164,751 259,349 (5,01 4) -- 419,692 Net loss ............................ -- -- -- (1,200) - - -- (1,200) Conversion of investment in an unconsolidated entity to the equity method .................... -- -- -- (979) - - -- (979) Repurchase of common stock .......... (318,311 ) (3) (7,769) -- - - -- (7,772) Issuance of common stock ............ 320,550 3 7,825 -- - - -- 7,828 Repurchase of common stock options .. -- -- (6,502) -- - - -- (6,502) Exercise of common stock options .... 232,283 2 7,929 -- - - -- 7,931 Other comprehensive income, net of taxes: Change in unrealized gain (loss) on securities available for sale .... -- -- -- -- 19,07 1 -- 19,071 Change in unrealized foreign currency translation loss ........ -- -- -- -- (1,69 3) -- (1,693) ------------ ------------ ------------ ------------ ----------- - ------------ ------------ Balances at December 31, 1998 ....... 60,800,357 608 166,234 257,170 12,36 4 -- 436,376 Net income .......................... -- -- -- 19,832 - - -- 19,832 Repurchase of common stock........... (4,611,700 ) (46) (30,645) -- - - -- (30,691) Exercise of common stock options .... 5,069 -- 23 -- - - -- 23 Directors' compensation ............. 6,099 -- 43 -- - - -- 43 Issuance of common stock for acquisition of Ocwen Asset Investment Corp................... 12,371,750 124 96,685 -- - - -- 96,809 Other comprehensive income, net of taxes: Change in unrealized gain (loss) on securities available for sale ...................... -- -- -- -- (13,89 4) -- (13,894) Change in unrealized foreign currency translation loss ..... -- -- -- -- 94 4 -- 944 ------------ ------------ ------------ ------------ ----------- - ------------ ------------ Balances at December 31, 1999........ 68,571,575 $ 686 $ 232,340 $ 277,002 $ (58 6) $ -- $ 509,442 ============ ============ ============ ============ =========== = ============ ============ THE ACCOMPANYING NOTES ARE A N INTEGRAL PART OF THESE CONSOLIDATED FINANCIAL STA TEMENTS.

70
For the Years Ended December 31, ------------------------ ----------------- 1999 1998 1997 ----------- --------- -- ----------- CASH FLOWS FROM OPERATING ACTIVITIES: Net income (loss) ................................. ........................ $ 19,832 $ (1,2 00) $ 78,932 Adjustments to reconcile net income to net cash pro vided (used) by operating activities: Net cash provided by trading activities ......... ........................ 18,723 15,2 84 106,108 Proceeds from sales of loans available for sale . ........................ 568,490 1,659,3 68 519,163 Purchases of loans available for sale ........... ........................ (47,129) (370,8 65) (278,081) Origination of loans available for sale ......... ........................ (728,509) (959,1 05) (316,101) Principal payments received on loans available fo r sale ................. 25,949 82,7 28 22,240 Premium amortization on securities, net ......... ........................ 11,074 56,4 87 63,506 Depreciation and amortization ................... ........................ 28,327 26,2 29 10,865 Provision for loan losses ....................... ........................ 6,710 18,5 09 32,218 Provision for real estate owned ................. ........................ 28,008 18,6 26 13,450 Gain on interest-earning assets, net ............ ........................ (44,298) (129,9 88) (82,212) Impairment charges on securities available for sa le ..................... 58,777 129,7 14 -- Loss on sales of premises and equipment ......... ........................ -- 47 1 Gain on sale of low-income housing tax credit int erests ................. (6,591) (7,3 66) (6,053) Gain on real estate owned, net .................. ........................ (36,265) (43,8 39) (30,651) Gain on sale of investment in real estate held .. ........................ (1,753) (10,3 83) -- Impairment loss on investment in real estate .... ........................ 2,817 -- -- Equity in losses (earnings) of unconsolidated ent ities .................. 12,616 7,9 85 (23,688) Gain on sale of Ocwen UK ........................ ........................ (50,371) -- -- Decrease (increase) in principal, interest and di vidends receivable ..... 7,762 (1,7 13) (459) Decrease (increase) in income taxes receivable .. ........................ 39,322 (37,4 65) 18,247 Increase in deferred tax asset .................. ........................ (53,273) (21,8 27) (39,288) Increase in escrow advances ..................... ........................ (54,313) (57,0 16) (23,468) Decrease in other assets, net ................... ........................ 30,126 (82,2 19) (28,161) (Decrease) increase in accrued expenses, interest payable and other liabilities ........................ ........................ (16,547) (4,2 57) 24,118 ----------- --------- -- ----------- Net cash (used) provided by operating activities .. ........................ (180,516) 288,2 75 60,686 ----------- --------- -- ----------- CASH FLOWS FROM INVESTING ACTIVITIES: Proceeds from sales of securities available for s ale .................... 43,923 269,8 28 202,670 Purchase of securities available for sale ....... ........................ (589,845) 820,4 55 (389,330) Maturities of and principal payments received on securities available for sale ............................ ........................ 553,136 359,5 25 46,084 Purchase of securities held for investment ...... ........................ (140) -- (42,166) Acquisition of subsidiaries ..................... ........................ 30,068 (426,0 96) (11,635) Proceeds from the sale of Ocwen UK .............. ........................ 122,101 -- -- Purchase of low-income housing tax credit interes ts ..................... (56,174) (49,0 63) (54,573) Proceeds from sales of low-income housing tax cre dit interests .......... 44,233 37,9 18 22,026 Proceeds from sales of discount loans, net ...... ........................ 275,732 626,4 23 500,151 Proceeds from sale of real estate held for invest ment ................... 23,436 47,6 44 14,905 Proceeds from sales of loans held for investment ........................ 51,691 -- 2,384 Purchase and originations of loans held for inves tment, net of undisbursed loan funds ................. ........................ (36,991) (188,7 16) (138,884) Purchase of discount loans, net ................. ........................ (584,328) (938,8 59) (1,464,611) Decrease (increase) in investment in unconsolidat ed entities ............ 10,687 (70,1 90) 90,541 Principal payments received on loans held for inv estment ................ 137,199 227,3 49 291,998 Principal payments received on discount loans ... ........................ 301,826 446,5 66 382,781 Purchase of and capital improvements to real esta te held for investment . (19,115) -- (39,844) Proceeds from sale of real estate owned ......... ........................ 251,621 301,4 85 196,180 Purchase of real estate owned in connection with discount loan purchase . (47,340) (19,9 49) (38,486) Additions to premises and equipment ............. ........................ (29,285) (23,6 80) (13,745) ----------- --------- -- ----------- Net cash provided (used) by investing activities .. ........................ $ 482,435 $ (220,2 70) $ (443,554) =========== ========= == =========== THE ACCOMPANYING NOTES ARE AN INTEG RAL PART OF THESE CONSOLIDATED FINANCIAL STATEMENTS.

71
OCWEN FINANCIAL CORPORATION AND SUBSIDIARIES CONSOLIDATED STATEM ENTS OF CASH FLOWS - (CONTINUED) (DOLL ARS IN THOUSANDS) For the Years Ended Decem ber 31, ------------------------------ ----------- 1999 1998 1997 ----------- ----------- ----------- CASH FLOWS FROM FINANCING ACTIVITIES: (Decrease) increase in deposits ................. .................... (348,012) 208,821 66,069 (Decrease) increase in securities sold under agreements to repurchase ..................... .................... (34,059) (36,199) 33,704 Repurchase of Capital Securities ................ .................... (15,000) -- -- Proceeds from obligations under lines of credit, net of repayments... 110,413 60,981 118,304 Payments of obligations assumed in connection wit h acquisition of subsidiary ................................... .................... -- -- (3,000) Proceeds from issuance of other interest bearing obligations ........ 6,236 -- -- Payments on advances from Federal Home Loan Bank .................... -- -- (399) Repayments and repurchases of notes, debentures and other, net ..... (54,150) (1,975) -- Repayments of loans made to executive officers, n et ................. -- -- 3,832 Exercise of common stock options ................ .................... 23 7,931 3,037 Advances from the Federal Home Loan Bank ........ .................... -- -- -- Proceeds from issuance of Capital Trust Securitie s .................. -- -- 125,000 Payment of Capital Trust Securities issuance cost s .................. -- -- (4,262) Issuance of shares of common stock .............. .................... -- 56 142,003 Repurchase of common stock options .............. .................... -- (6,502) (3,208) Repurchase of common stock ...................... .................... (30,691) (7,772) -- ----------- ----------- ----------- Net cash (used) provided by financing activities .. .................... (365,240) 225,341 482,482 ----------- ----------- ----------- Net (decrease) increase in cash and cash equivalent s .................. (63,321) 293,346 99,614 Cash and cash equivalents at beginning of period .. .................... 445,179 151,833 52,219 ----------- ----------- ----------- Cash and cash equivalents at end of period ........ .................... $ 381,858 $ 445,179 $ 151,833 =========== =========== =========== RECONCILIATION OF CASH AND CASH EQUIVALENTS AT END OF PERIOD: Cash and amounts due from depository institutions ................... $ 153,459 $ 120,805 $ 11,832 Interest-earning deposits ....................... .................... 116,399 49,374 140,001 Federal funds sold and repurchase agreements .... .................... 112,000 275,000 -- ----------- ----------- ----------- $ 381,858 $ 445,179 $ 151,833 =========== =========== =========== SUPPLEMENTAL DISCLOSURE OF CASH FLOW INFORMATION: Cash paid during the period for: Interest ........................................ .................... $ 153,891 $ 183,424 $ 148,895 Income taxes .................................... .................... $ 633 $ 36,754 $ 28,228 Supplemental schedule of non-cash investing and fin ancing activities: Real estate owned acquired through foreclosure .. .................... $ 157,111 $ 280,522 $ 205,621 Exchange of discount loans and loans available fo r sale for securities ............................... .................... $ 758,032 $ 2,125,080 $ 897,358 Transfer of securities available for sale to inve stment in unconsolidated entities ...................... .................... $ $ 35,158 $ -- Acquisition of businesses: Fair value of assets acquired ................... .................... $ (706,329) $ (449,420) $ (15,052) Liabilities assumed ............................. .................... 599,855 15,069 3,399 Stock issued .................................... .................... 96,809 7,772 -- ----------- ----------- ----------- Cash paid ....................................... .................... (9,665) (426,579) (11,653) Less cash acquired .............................. .................... 39,733 483 18 ----------- ----------- ----------- Net cash acquired (paid) for assets acquired .... .................... $ 30,068 $ (426,096) $ (11,635) =========== =========== =========== Sale of subsidiary: Fair value of assets sold ....................... .................... $ 413,121 $ -- $ -- Liabilities sold ................................ .................... (345,327) -- -- Cash sold ....................................... .................... 3,936 -- -- Gain on sale .................................... .................... 50,371 -- -- Net cash received for assets sold ................. .................... -- -- ----------- ----------- ----------- $ 122,101 $ -- $ -- =========== =========== =========== THE ACCOMPANYING NOTES ARE AN INTEGRA L PART OF THESE CONSOLIDATED FINANCIAL STATEMENTS.

OCWEN FINANCIAL CORPORATION AND SUBSIDIARIES NOTES TO CONSOLIDATED FINANCIAL STATEMENTS
DECEMBER 31, 1999, 1998, AND 1997 (DOLLARS AND BRITISH POUNDS IN THOUSANDS, EXCEPT SHARE DATA)
NOTE 1: SUMMARY OF SIGNIFICANT ACCOUNTING POLICIES
PRINCIPLES OF CONSOLIDATION
Ocwen Financial Corporation ("OCN" or the "Company") is a specialty financial services company whose primary business activities consist of the acquisition, servicing and resolution of subperforming and non-performing residential and commercial mortgage loans, as well as the related development of loan servicing technology and business-to-business e-commerce solutions for the mortgage and real estate industries. The Company's consolidated financial statements include the accounts of OCN and its subsidiaries. The Company owns directly and indirectly all of the outstanding common and preferred stock of its primary subsidiaries, Ocwen Federal Bank FSB (the "Bank"), Investors Mortgage Insurance Holding Company ("IMI"), Ocwen Technology Xchange, Inc. ("OTX") and Ocwen Asset Investment Corp. ("OAC"). As more fully described in Note 2, the Company acquired OAC on October 7, 1999. The Company's consolidated financial statements include OAC and its subsidiaries as of that date. The Company also owns 98.9% of Ocwen Financial Services, Inc. ("OFS"), with the remaining 1.1% owned by the shareholders of Admiral Home Loan and reported in the consolidated financial statements as a minority interest. As more fully described in Note 2, the Company sold its investment in its foreign subsidiary, Ocwen UK, on September 30, 1999. Ocwen UK's results of operations for 1999 have been included in the consolidated statements of operations through that date. All significant intercompany transactions and balances have been eliminated in consolidation.
The Bank is a federally chartered savings bank regulated by the Office of Thrift Supervision ("OTS").
RECLASSIFICATION
Certain amounts included in the 1998 and 1997 consolidated financial statements have been reclassified in order to conform to the 1999 presentation.
CONSOLIDATED STATEMENTS OF CASH FLOWS
For purposes of reporting cash flows, cash and cash equivalents include cash on hand, interest-bearing and non-interest-bearing deposits and all highly liquid debt instruments purchased with an original maturity of three months or less. Cash flows associated with items intended as hedges of identifiable transactions or events are classified in the same category as the cash flows from the items being hedged.
SHORT-TERM HIGHLY LIQUID INVESTMENTS
The Company's short-term highly liquid investments generally consist of federal funds sold and assets purchased under agreements to resell. The Company invests in these assets to maximize its return on liquid funds. At December 31, 1999 and 1998, such investments amounted to $112,000 and $275,000, respectively, of federal funds sold which had an overnight maturity. The average investment in federal funds sold and assets purchased under agreements to resell amounted to $174,494 and $149,441 during 1999 and 1998, respectively.
The Bank is required by the Federal Reserve System to maintain non-interest-earning cash reserves against certain of its transaction accounts and time deposit accounts. Such reserves totaled $32,189 and $5,557 at December 31, 1999 and 1998, respectively.
TRADING ACTIVITIES
Securities acquired and sold shortly thereafter resulting from the securitization of loans available for sale are accounted for as the sale of loans and the purchase and sale of trading securities. Securities held for trading purposes are carried at fair value with the unrealized gains or losses included in gains on sales of interest-earning assets, net.
SECURITIES AVAILABLE FOR SALE
Certain mortgage-related securities are designated as assets available for sale because the Company does not intend to hold them to maturity. Securities available for sale are carried at fair value with the net unrealized gains or losses reported as a separate component of accumulated comprehensive income in stockholders' equity. At disposition, the realized net gain or loss is included in earnings on a specific identification basis. The amortization of premiums and accretion of discounts are computed using the interest method after considering actual and estimated prepayment rates, if applicable. Actual prepayment experience is
72

OCWEN FINANCIAL CORPORATION AND SUBSIDIARIES NOTES TO CONSOLIDATED FINANCIAL STATEMENTS - (CONTI NUED)
DECEMBER 31, 1999, 1998, AND 1997 (DOLLARS AND BRITISH POUNDS IN THOUSANDS, EXCEPT SHARE DATA)
periodically reviewed and effective yields are recalculated when differences arise between prepayments originally anticipated and amounts actually received plus anticipated future prepayments.
On a quarterly basis the Company evaluates each individual security in its available for sale portfolio to determine whether a decline in value below amortized cost has occurred which is other than temporary. In making this assessment, the Company considers several factors, including but not limited to the following:
o Determining whether the present value of estimated future cash flows discounted at a risk-free rate (the rate on monetary assets of a comparable duration which are essentially risk free, such as the three-month Treasury bill rate) is less than the amortized cost basis of the instrument;
o Examining whether the duration of the decline in market value has exceeded six consecutive months; and
o Identifying and understanding the reasons for significant declines in value (i.e., greater than 20%).
For each security where the Company concludes that all or a portion of the decrease in value is other than temporary, such amount is charged to earnings, thereby establishing a new cost basis for the security.
LOANS AVAILABLE FOR SALE AND HELD FOR INVESTMENT
Loans originated or purchased by the Company which the Company presently does not intend to hold to maturity are designated as loans available for sale upon origination or purchase and are stated at the lower of cost, after considering deferred loan fees and costs, or aggregate market value. Unrealized losses are recorded as a reduction in earnings and are included under the caption "Gain on interest-earning assets, net" in the consolidated statements of operations. Loan origination fees and certain direct loan origination costs are deferred and included in the carrying value. Upon the sale of a loan, any unamortized deferred loan fees, net of costs, are included in the gain or loss on sale of interest earning assets. Gains and losses on disposal of such loans are computed on a specific identification basis.
Loans held for investment are stated at amortized cost, less an allowance for loan losses, discount, deferred loan fees and undisbursed loan funds. To qualify for this treatment, upon origination or purchase the Company must have both the ability and the intent to hold such loans to maturity. Loan origination fees and certain direct loan origination costs are deferred and recognized over the lives of the related loans as a yield adjustment and included in interest income using the interest method applied on a loan-by-loan basis.
Interest income is accrued as it is earned. Loans are placed on non-accrual status after being delinquent greater than 89 days or earlier if the borrower is deemed by management to be unable to continue performance. When a loan is placed on non-accrual status, interest accrued but not received is reversed. Loans are returned to accrual status only when the loan is reinstated and ultimate collectibility is no longer in doubt. In addition, the amortization of deferred loan fees is suspended when a loan is placed on nonaccrual status.
ALLOWANCE FOR ESTIMATED LOAN LOSSES
The allowance for estimated loan losses is maintained at a level that management, based upon an evaluation of known and inherent risks in the portfolio, considers adequate to provide for losses. Specific valuation allowances are established for impaired loans in the amount by which the carrying value, before allowance for estimated losses, exceeds the fair value of collateral less costs to dispose on an individual loan basis, except for single family residential mortgage loans and consumer loans which are generally evaluated for impairment as homogeneous pools of loans. The Company considers a loan to be impaired when, based upon current information and events, it believes that it is probable that the Company will be unable to collect all amounts due according to the contractual terms of the loan agreement on a timely basis. The Company measures these impaired loans at the fair value of the loans' underlying collateral less estimated disposal costs. Impaired loans may be left on accrual status during the period the Company is pursuing repayment of the loan. These loans are placed on non-accrual status at such time that the loans either: (i) become 90 days delinquent; or (ii) the Company determines the borrower is incapable of, or has ceased efforts toward, curing the cause of the impairment. Impairment losses are recognized through an increase in the allowance for loan losses and a corresponding charge to the provision for loan losses. When an impaired loan is either sold, transferred to real estate owned ("REO") or charged off, any related valuation allowance is removed from the allowance for loan losses. Charge-offs occur when loans, or a portion thereof, are considered uncollectible and of such little value that their continuance as bankable assets is not warranted. Management's periodic evaluation of the allowance for estimated loan losses is based upon an analysis of the portfolio, historical loss experience, economic conditions and trends, collateral values and other relevant factors. Future
73

OCWEN FINANCIAL CORPORATION AND SUBSIDIARIES NOTES TO CONSOLIDATED FINANCIAL STATEMENTS - (CONTI NUED)
DECEMBER 31, 1999, 1998, AND 1997 (DOLLARS AND BRITISH POUNDS IN THOUSANDS, EXCEPT SHARE DATA)
adjustments to the allowance may be necessary if economic conditions and trends, collateral values and other relevant factors differ substantially from the assumptions used in making the evaluation.
DISCOUNT LOAN PORTFOLIO
Certain mortgage loans, for which the borrower is not current as to principal and interest payments or for which there is a reason to believe the borrower will be unable to continue to make its scheduled principal and interest payments, are acquired at a discount. The Company accounts for its initial investment in a pool of loans based upon the pricing methodologies used to bid on the pool. The acquisition cost is allocated to each loan within the pool when the bid price was determined based upon an analysis of the expected future cash flows of each individual loan. The acquisition cost is accounted for in the aggregate when the bid price was determined using assumptions concerning the expected future cash flows from groups of loans within the pool. For those single family residential mortgage loans which are brought current by the borrower and certain multi-family and commercial real estate loans which are current and which the Company believes will remain current, the remaining unamortized discount is accreted into interest income as a yield adjustment using the interest method over the contractual maturity of the loan. For all other loans, interest is reported as cash is received. Gains on the repayment and discharging of loans are reported as interest income. In situations where the collateral is foreclosed upon, the loans are transferred to real estate owned upon receipt of title to the property and accretion of the related discount is discontinued.
REAL ESTATE OWNED
Properties acquired through foreclosure are valued at the lower of the adjusted cost basis of the loan or fair value less estimated costs of disposal of the property after the date of foreclosure. Properties held are periodically re-evaluated to determine that they are being carried at the lower of cost or fair value less estimated costs to dispose. Sales proceeds and related costs are recognized with passage of title to the buyer and, in cases where the Company finances the sale, receipt of sufficient down payment. Rental income related to properties is reported as income as earned. Holding and maintenance costs related to properties are reported as period costs as incurred. No depreciation expense related to the properties has been recorded. Decreases in the market value of foreclosed real estate subsequent to foreclosure are recognized as a valuation allowance on a property specific basis. Subsequent increases in market value of the foreclosed real estate are reflected as reductions in the valuation allowance, but not below zero. Such changes in the valuation allowance are charged or credited to income.
MORTGAGE SERVICING RIGHTS
In connection with the securitization and sale of loans, the Company generally retains the rights to service such loans for investors. A servicing asset or liability and other retained interests are recognized as an allocation of the carrying amount of the assets sold between the asset sold and the servicing obligation and other retained interests based on the relative fair value of the assets sold to the interests retained. The Company also acquires mortgage servicing rights which are recorded at cost. Mortgage servicing assets are amortized in proportion to and over the period of estimated net servicing income or loss. The Company evaluates the mortgage servicing assets for impairment based on the fair value of the servicing asset. The Company estimates fair values by discounting servicing assets cash flows using discount and prepayment rates that it believes market participants would use.
The Company receives fees from investors for servicing mortgage loans. Servicing fees, generally expressed as a percent of the unpaid principal balance, are collected from the borrowers' payments. During any period in which the borrower is not making payments, the Company is required under certain servicing agreements to advance its own funds to meet contractual principal and interest remittance requirements for certain investors, maintain property taxes and insurance, and process foreclosures. The Company generally recovers such advances from borrowers for reinstated and performing loans and from investors for foreclosed loans.
74

OCWEN FINANCIAL CORPORATION AND SUBSIDIARIES NOTES TO CONSOLIDATED FINANCIAL STATEMENTS - (CONTI NUED)
DECEMBER 31, 1999, 1998, AND 1997 (DOLLARS AND BRITISH POUNDS IN THOUSANDS, EXCEPT SHARE DATA)
INVESTMENT IN REAL ESTATE
Investment in real estate is recorded at cost less accumulated depreciation. The Company reviews its investment in real estate for impairment whenever events or changes in circumstances indicate that the carrying amount may not be recoverable.
Depreciation is computed on a straight-line basis over the estimated useful lives of the assets as follows:
Expenditures for repairs and maintenance are charged to operations as incurred. Significant improvements are capitalized. The leases are classified as operating leases in accordance with SFAS No. 13 "Accounting for Leases." Fees and costs incurred in the successful negotiation of leases are deferred and amortized on a straight-line basis over the terms of the respective leases. Rental income is reported on a straight-line basis over the terms of the respective leases.
INVESTMENTS IN LOW -INCOME HOUSING TAX CREDIT INTERESTS
Low-income housing tax credit partnerships own multi-family residential properties which have been allocated tax credits under the Internal Revenue Code of 1986, as amended (the "Internal Revenue Code"). The obligations of the partnership to sustain qualifying status of the properties covers a 15-year period; however, tax credits accrue over a 10-year period on a straight-line basis. Investments by the Company in low-income housing tax credit partnerships made on or after May 18, 1995, in which the Company invests solely as a limited partner, are accounted for using the equity method in accordance with the consensus of the Emerging Issues Task Force through issue number 94-1. For the Company's limited partnership investments made prior to this date, the Company records its receipt of income tax credits and other tax benefits on a level yield basis over the 15-year obligation period and reports the tax credits and tax benefits net of amortization of its investment in the limited partnership as a reduction of income tax expense. Low-income housing tax credit partnerships in which the Company has invested as a limited partner, and through which a subsidiary acts as the general partner, are consolidated and included in the Company's consolidated financial statements. For all investments in low-income housing tax credit partnerships made after May 18, 1995, the Company capitalizes interest expense and certain direct costs incurred during the pre-operating period.
EXCESS OF COST OVER NET ASSETS ACQUIRED
The excess of purchase price over net assets of acquired businesses is stated at cost and is amortized on a straight-line basis over the estimated future periods to be benefited, not to exceed 15 years. The carrying value of cost in excess of net assets acquired is reviewed for impairment whenever events or changes in circumstances indicate that it may not be recoverable. Additionally, the Company periodically evaluates the amortization periods to determine whether events or circumstances warrant revised amortization periods. The results of operations of acquired companies are included in the consolidated statements of operations beginning with the acquisition date.
PREMISES AND EQUIPMENT
Premises and equipment are carried at cost and, except for land, are depreciated over their estimated useful lives on the straight-line method. The estimated useful lives of the related assets range from three to 39 years.
CAPITALIZED SOFTWARE COSTS
Certain costs attributable to developing, modifying and enhancing its software revenue products are capitalized in accordance with SFAS No. 86, "Accounting for the Costs of Computer Software to be Sold, Leased or Otherwise Marketed." Costs incurred up to the establishment of technological feasibility are expensed as research and development costs. Once the products are made available for general release to customers, the capitalized costs are amortized using the straight-line method over the estimated economic lives of the individual products. The unamortized costs by product are reduced to an amount not to exceed the future net realizable value by product at each financial statement date.
75
Buildings and improvements 39 - 40 years Tenant improvements Lesser o f lease term or usefu l life Land improvements 20 years Furniture, fixtures and equipment 5 -10 ye ars

OCWEN FINANCIAL CORPORATION AND SUBSIDIARIES NOTES TO CONSOLIDATED FINANCIAL STATEMENTS - (CONTI NUED)
DECEMBER 31, 1999, 1998, AND 1997 (DOLLARS AND BRITISH POUNDS IN THOUSANDS, EXCEPT SHARE DATA)
SECURITIES SOLD UNDER AGREEMENTS TO REPURCHASE
The Company periodically enters into sales of securities under agreements to repurchase the same securities ("reverse repurchase agreements"). Reverse repurchase agreements are treated as financings, and the obligations to repurchase securities sold are reflected as a liability in the accompanying consolidated statements of financial condition. All securities underlying reverse repurchase agreements are reflected as assets in the accompanying consolidated statements of financial condition and are held in safekeeping by custodians.
EXCESS OF NET ASSETS ACQUIRED OVER PURCHASE PRICE
The effects of the acquisition of OAC resulted in a new basis of accounting reflecting fair values of assets and liabilities at the date of acquisition. The excess of assets over the purchase price of acquired net assets resulting from the acquisition is stated at cost and is being amortized on a straight-line basis over the estimated future periods to be benefited of five years.
DERIVATIVE FINANCIAL INSTRUMENTS
The Company uses derivative financial instruments for the purpose of managing its exposure to adverse fluctuations in interest and foreign currency exchange rates. While these instruments are subject to fluctuations in value, such fluctuations are generally offset by the change in value of the underlying exposures being hedged. The Company does not enter into any derivative financial instruments for trading purposes. To qualify for hedge accounting, the asset or liability to be hedged must be specifically identified and expose the Company to interest rate or currency risk, and the hedging instrument must substantially reduce or alter the risk of loss from the asset or liability being hedged. If the derivative financial instrument fails or ceases to qualify for hedge accounting, it is accounted for at fair value with changes in fair value recorded in earnings in the consolidated statements of operations.
The Company manages its exposure to interest rate movements by seeking to match asset and liability balances within maturity categories, both directly and through the use of derivative financial instruments. These derivative instruments include interest rate swaps ("swaps") and interest rate futures contracts that are designated and effective as hedges, as well as swaps that are designated and effective in modifying the interest rate and/or maturity characteristics of specified assets or liabilities. Gains and losses on swaps are accounted for on the accrual basis.
The net interest received or paid on swaps is reflected as interest income or expense of the related hedged position. Gains and losses resulting from the termination of swaps are recognized over the shorter of the remaining contract lives of the swaps or the lives of the related hedged positions or, if the hedged positions are sold, are recognized in the current period as gains on sales of interest-earning assets, net. Gains and losses on futures contracts are deferred as an adjustment of the carrying value of the related asset or liability and amortized over the terms of the related assets or liabilities and reflected as interest income or expense of the related hedged positions. If the hedged positions are sold, any unamortized deferred gains or losses on futures contracts are recognized in the current period as gains on sales of interest-earning assets, net. Interest rate contracts are measured at fair value.
The Company enters into foreign currency futures contracts and foreign currency swap agreements to hedge its investments in foreign entities. The Company's periodically adjusts the amount of foreign currency derivative contracts it has entered into in response to changes in its recorded investment. The discount on the currency swap, representing the difference between the contracted forward rate and the spot rate at the date of inception, is amortized over the life of the currency swap on a straight-line basis. The value of the currency swap is calculated as the notional amount of the currency swap multiplied by the difference between the spot rate at the date of inception and the spot rate at the financial statement date. The unamortized discount related to foreign currency swaps and the values of financial hedge instruments are reported as translation adjustments and are included as a component of accumulated other comprehensive income in stockholders' equity.
FOREIGN CURRENCY TRANSLATION
In accordance with SFAS No. 52, "Foreign Currency Translation," assets and liabilities of foreign entities where the functional currency is not the U.S. dollar are translated into U.S. dollars at the current rate of exchange existing at the statement of financial condition date and revenues and expenses are translated at average monthly rates. The resulting translation adjustments are included as a component of accumulated comprehensive income in stockholders' equity.
76

OCWEN FINANCIAL CORPORATION AND SUBSIDIARIES NOTES TO CONSOLIDATED FINANCIAL STATEMENTS - (CONTI NUED)
DECEMBER 31, 1999, 1998, AND 1997 (DOLLARS AND BRITISH POUNDS IN THOUSANDS, EXCEPT SHARE DATA)
INCOME TAXES
The Company files consolidated Federal income tax returns with its subsidiaries. Consolidated income tax is allocated among the subsidiaries participating in the consolidated returns as if each subsidiary of the Company, which has one or more subsidiaries, filed its own consolidated return and those with no subsidiaries filed separate returns.
The Company accounts for income taxes using the asset and liability method which requires the recognition of deferred tax liabilities and assets for the expected future tax consequences of temporary differences between the carrying amounts and the tax bases of assets and liabilities. Additionally, deferred taxes are adjusted for subsequent tax rate changes.
INVESTMENT IN UNCONSOLIDATED ENTITIES
The Company's investments in unconsolidated entities are accounted for under the equity method of accounting. Under the equity method of accounting, an investment in the shares or other interests of an investee is initially recorded at the cost of the shares or interests acquired and thereafter is periodically increased (decreased) by the investor's proportionate share of the earnings (losses) of the investee and decreased by the dividends or distributions received by the investor from the investee.
BASIC AND DILUTED EARNINGS PER SHARE
Basic earnings per share is calculated based upon the weighted average number of shares of common stock outstanding during the year. Diluted earnings per share is calculated based upon the weighted average number of shares of common stock outstanding and all dilutive potential common shares outstanding during the year. The computation of diluted earnings per share includes the impact of the exercise of the outstanding options to purchase common stock and assumes that the proceeds from such issuance are used to repurchase common shares at fair value. Common stock equivalents would be excluded from the diluted calculation if a net loss was incurred for the period as they would be antidilutive.
COMPREHENSIVE INCOME
Comprehensive income is defined as the change in equity of a business enterprise during a period from transactions and other events and circumstances, excluding those resulting from investments by and distributions to owners. SFAS No. 130 requires that comprehensive income be presented beginning with net income, adding the elements of comprehensive income not included in the determination of net income, to arrive at comprehensive income. Accumulated other comprehensive income is presented net of income taxes and is comprised of unrealized gains and losses on securities available for sale, and unrealized foreign currency translation gains and losses.
RISKS AND UNCERTAINTIES
In the normal course of business, the Company encounters two significant types of risk: economic and regulatory. There are three main components of economic risk: credit risk, market risk and concentration of credit risk. Credit risk is the risk of default on the Company's loan portfolios that results from a borrowers' inability or unwillingness to make contractually required payments. Market risk includes interest rate risk, foreign currency exchange rate risk, and equity price risk. The Company is exposed to interest rate risk to the degree that its interest-bearing liabilities mature or reprice at different speeds, or different bases, than its interest-earning assets. The Company is exposed to foreign currency exchange rate risk in connection with its investment in non-U.S. dollar functional currency operations and to the extent its foreign exchange positions remain unhedged. The Company is exposed to equity price risk as a result of its investments in the equity securities of other entities. Market risk also reflects the risk of declines in the valuation of loans held for sale and securities available for sale, and in the value of the collateral underlying loans and the value of real estate held by the Company. Concentration of credit risk refers to the risk that, if the Company extends a significant portion of its total outstanding credit to borrowers in a specific geographical area or industry or on the security of a specific form of collateral, the Company may experience disproportionately high levels of default and losses if those borrowers, or the value of such type of collateral, is adversely affected by economic or other factors that are particularly applicable to such borrowers or collateral.
The Bank is subject to the regulations of various government agencies. These regulations can and do change significantly from period to period. The Bank also undergoes periodic examinations by the regulatory agencies, which may subject it to further changes with respect to asset valuations, amounts of required loss allowances and operating restrictions resulting from the regulators' judgments based on information available to them at the time of their examination.
77

OCWEN FINANCIAL CORPORATION AND SUBSIDIARIES NOTES TO CONSOLIDATED FINANCIAL STATEMENTS - (CONTI NUED)
DECEMBER 31, 1999, 1998, AND 1997 (DOLLARS AND BRITISH POUNDS IN THOUSANDS, EXCEPT SHARE DATA)
The preparation of financial statements in conformity with generally accepted accounting principles requires management to make estimates and assumptions that affect the reported amounts of assets and liabilities and disclosure of contingent assets and liabilities at the date of the financial statements and the reported amounts of revenues and expenses during the reporting period. Actual results could differ from those estimates. Material estimates that are particularly susceptible to significant change in the near or medium term relate to the determination of the allowance for losses on loans and discount loans.
CURRENT ACCOUNTING PRONOUNCEMENTS
In June 1998, the FASB issued SFAS No. 133, "Accounting for Derivative Instruments and Hedging Activities." SFAS No. 133 establishes accounting and reporting standards for derivative and hedging activities and supersedes and amends a number of existing standards. Initial application of SFAS No. 133 should be as of the beginning of an entity's fiscal quarter; on that date, hedging relationships must be designated anew and documented pursuant to the provisions of SFAS No. 133. Earlier application of SFAS No. 133 is encouraged but is permitted only as of the beginning of any fiscal quarter that begins after issuance of SFAS No. 133. The Company has not yet adopted SFAS No. 133 nor has it determined the impact on the results of operations, financial position or cash flows as a result of implementing SFAS No. 133.
In June 1999, the FASB issued SFAS No. 137 "Accounting for Derivative Instruments and Hedging Activities - Deferral of Effective Date of SFAS No. 133 an amendment of SFAS No. 133." SFAS No. 137 defers the effective date of SFAS No. 133 to all fiscal quarters of all fiscal years beginning after June 15, 2000.
SFAS No. 133 requires that an entity recognize all derivatives as either assets or liabilities in the statement of financial condition. The gain or loss recognition is determined on the intended use and resulting designation of the financial instruments as follows:
o Gains or losses on derivative instruments not designated as hedging instruments are recognized in the period of change in fair value.
o Gains or losses on derivative instruments designated as hedging the exposure to changes in the fair value of a recognized asset, liability or firm commitment are recognized in earnings in the period of the fair value change, together with the offsetting fair value loss or gain on the hedged item.
o Gains or losses on derivative instruments designated as hedging exposure to variable cash flows arising from a forecasted transaction are initially reported, to the extent the fair value change is offset by the change in the forecasted cash flows, as a component of other comprehensive income. The portion of the change in fair value in excess of the offsetting change in forecasted cash flows is reported in earnings in the period of the change.
o Gains or losses on derivative instruments designated as foreign currency hedges of net investments in foreign operations are reported in other comprehensive income as part of the foreign currency translation adjustment.
SFAS No. 133 precludes the use of nonderivative financial instruments as hedging instruments, except that nonderivative financial instruments denominated in a foreign currency may be designated as a hedge of the foreign currency exposure of an unrecognized firm commitment denominated in a foreign currency or a net investment in a foreign operation.
Under SFAS No. 133, an entity that elects to apply hedge accounting is required to establish at the inception of the hedge the method it will use for assessing the effectiveness of the hedging derivative and the measurement approach for determining the ineffective aspect of the hedge. Those methods must be consistent with the entity's approach to managing risk.
NOTE 2: ACQUISITION AND DISPOSITION TRANSACTIONS
On October 7, 1999, Ocwen Acquisition Company ("Acquisition Sub"), a Virginia corporation and an indirect wholly-owned subsidiary of OCN, merged (the "Merger") with and into OAC, a Virginia corporation, in accordance with the Agreement of Merger (the "Merger Agreement") dated as of July 25, 1999 among OAC, OCN, and Acquisition Sub. In accordance with the Merger Agreement, OAC shareholders (except for OCN or its subsidiaries) received 0.71 shares of OCN stock for each outstanding share of OAC common stock. A total of 12,371,750 shares of OCN stock at a value of $96,809 were issued to OAC shareholders. Prior to the Merger, the Company, through IMI, owned 1,540,000 or 8.12% of the outstanding common stock of OAC and 1,808,733 units or 8.71% of the outstanding partnership units of Ocwen Partnership L.P. ("OPLP"). OPLP is the operating partnership subsidiary of OAC.
78

OCWEN FINANCIAL CORPORATION AND SUBSIDIARIES NOTES TO CONSOLIDATED FINANCIAL STATEMENTS - (CONTI NUED)
DECEMBER 31, 1999, 1998, AND 1997 (DOLLARS AND BRITISH POUNDS IN THOUSANDS, EXCEPT SHARE DATA)
The Merger, which resulted in OCN acquiring the remaining interest in OAC, reflects an aggregate purchase price of $101,271, including direct costs of the acquisition. The Merger was accounted for as a purchase and the purchase price has been allocated to OAC's assets and liabilities based on their fair market values as follows:
The excess of net assets acquired over the purchase price is being amortized on a straight-line basis over a period of five years and amounted to $56,841, net of accumulated amortization of $3,201, at December 31, 1999. Results of operations from OAC from the date of merger to December 31, 1999 are included in OCN's consolidated statement of operations for 1999.
On October 20, 1999, OAC merged into Small Commercial Properties Corporation I ("SCP"), a Florida corporation and an indirect wholly-owned subsidiary of OCN. Immediately thereafter, SCP changed its name to Ocwen Asset Investment Corp. As a result of the merger on October 20, 1999, OAC ceased to qualify as a real estate investment trust ("REIT") under the Internal Revenue Code of 1986, as amended (the "Code").
The following unaudited pro forma results of operations of OCN are presented as if the acquisition of OAC had occurred at January 1, 1998:
The pro forma consolidated results of operations include adjustments to give effect to the purchase accounting adjustments as if the acquisition occurred on January 1, 1998 and to eliminate material intercompany transactions. The unaudited pro forma information is not necessarily indicative of the results of operations that would have occurred had the acquisition occurred on January 1, 1998, or the future results of the combined operations.
79
Purchase price..................................... .. $ 101,271 Fair value of net assets........................... .. 161,313 ------------ Excess of net assets acquired over purchase price.. .. $ 60,042 ============
For the Years E nded December 31, --------------- ----------------- 1999 1998 ------------ ------------ Interest income.................................... ............................ $ 311,327 $ 371,775 Interest expense................................... ............................ 121,149 152,630 ------------ ------------ Net interest income before provision for loan los ses......................... 113,362 133,479 Provision for loan losses........................ ............................ 7,787 19,151 ------------ ------------ Net interest income after provision for loan loss es.......................... 109,973 128,961 ------------ ------------ Non-interest income................................ ............................ 112,672 36,322 Non-interest expense............................... ............................ 195,042 225,153 Distributions on Company-obligated, mandatory redee mable securities of subsidiary trust holding solely junior subordinated debentures................. ............................ 13,111 13,594 Equity in (losses) earnings of investments in uncon solidated entities.......... (9,010) 716 ------------ ------------ Income (loss) before income taxes and extrordinary gain........................ 8,871 (68,230) Income tax (expense) benefit....................... ............................ (2,608) 37,647 Minority interest in net loss of consolidated subsi diary....................... 638 467 ------------ ------------ Income (loss) before extraordinary gain............ ............................ 6,901 (30,116) Extraordinary gain on repurchase of debt, net of ta xes......................... 6,983 615 ------------ ------------ Net income (loss).................................. ............................ $ 13,884 $ (29,501) ============ ============ Earnings (loss) per share.......................... ............................ Basic: Net income (loss) before extraordinary gain.... ............................ $ 0.10 $ (0.41) Extraordinary gain............................. ............................ 0.10 0.01 ------------ ------------ Net income (loss).............................. ............................ $ 0.20 $ (0.40) ============ =========== Diluted: Net income (loss) before extraordinary gain.... ............................ $ 0.10 $ (0.41) Extraordinary gain............................. ............................ 0.10 0.01 ------------ ------------ Net income (loss).............................. ............................ $ 0.20 $ (0.40) ============ ===========

OCWEN FINANCIAL CORPORATION AND SUBSIDIARIES NOTES TO CONSOLIDATED FINANCIAL STATEMENTS - (CONTI NUED)
DECEMBER 31, 1999, 1998, AND 1997 (DOLLARS AND BRITISH POUNDS IN THOUSANDS, EXCEPT SHARE DATA)
On September 30, 1999, the Company sold all the shares of its wholly-owned subsidiary, Ocwen UK, to Malvern House Acquisition Limited for the pound sterling equivalent of $122,101 in cash. Ocwen UK was originally formed to acquire substantially all of the assets, and certain of the liabilities, of the United Kingdom operations of Cityscape Financial Corp., and commenced operations on April 24, 1998. As a result of the transaction, the Company recorded a pretax gain on sale of $50,371.
On June 2, 1999, OTX acquired substantially all of the assets of Synergy Software, LLC ("Synergy"), a developer of commercial and multi-family mortgage servicing systems, for $10,000 of which $5,000 has been paid and $5,000 is a holdback which will be released over time if certain performance objectives are attained. The acquisition was accounted for as a purchase. The excess of purchase price over net assets acquired related to this transaction amounted to $4,547, net of accumulated amortization of $401 at December 31, 1999 and is being amortized on a straight-line basis over a period of seven years. Synergy is a wholly-owned subsidiary of OTX.
NOTE 3: FAIR VALUE OF FINANCIAL INSTRUMENTS
A majority of the Company's assets, liabilities and off-balance sheet instruments and commitments are considered financial instruments. For the majority of the Company's financial instruments, principally loans and deposits, fair values are not readily available since there are no available trading markets as characterized by current exchanges between willing parties. Accordingly, fair values can only be derived or estimated using various valuation techniques, such as computing the present value of estimated future cash flows using discount rates commensurate with the risks involved. However, the determination of estimated future cash flows is inherently subjective and imprecise. In addition, for those financial instruments with option-related features, prepayment assumptions are incorporated into the valuation techniques. It should be noted that minor changes in assumptions or estimation methodologies can have a material effect on these derived or estimated fair values.
The fair values reflected below are indicative of the interest rate environments as of December 31, 1999 and 1998, and do not take into consideration the effects of interest rate fluctuations. In different interest rate environments, fair value results can differ significantly, especially for certain fixed-rate financial instruments and non-accrual assets. In addition, the fair values presented do not attempt to estimate the value of the Company's fee generating businesses and anticipated future business activities. In other words, they do not represent the Company's value as a going concern. Furthermore, the differences between the carrying amounts and the fair values presented may not be realized.
Reasonable comparability of fair values among financial institutions is difficult due to the wide range of permitted valuation techniques and numerous estimates that must be made in the absence of secondary market prices. This lack of objective pricing standards introduces a degree of subjectivity to these derived or estimated fair values. Therefore, while disclosure of estimated fair values of financial instruments is required, readers are cautioned in using this data for purposes of evaluating the financial condition of the Company.
The methodologies used and key assumptions made to estimate fair value, the estimated fair values determined and recorded carrying values follow:
CASH AND CASH EQUIVALENTS
Cash and cash equivalents have been valued at their carrying amounts as these are reasonable estimates of fair value given the relatively short period of time between origination of the instruments and their expected realization.
SECURITIES AVAILABLE FOR SALE
The Company adjusts its securities portfolio to fair value at the end of each month based upon the lower of dealer quotations or internal values, subject to an internal review process. For those securities which do not have an available market quotation, the Company will request market values and underlying assumptions from the various securities dealers that underwrote, are currently financing the securities, or have had prior experience with the type of security to be valued. When quotations are obtained from two or more dealers, the average dealer quote is generally utilized.
LOANS, MATCH FUNDED LOANS AND SECURITIES, AND DISCO UNT LOANS
The fair value of performing loans is estimated based upon quoted market prices for similar whole loan pools. The fair value of non-performing loans is based on estimated cash flows discounted using a rate commensurate with the risk associated with the estimated cash flows. The fair value of the match funded loans and the discount loan portfolio is estimated based upon current
80

OCWEN FINANCIAL CORPORATION AND SUBSIDIARIES NOTES TO CONSOLIDATED FINANCIAL STATEMENTS - (CONTI NUED)
DECEMBER 31, 1999, 1998, AND 1997 (DOLLARS AND BRITISH POUNDS IN THOUSANDS, EXCEPT SHARE DATA)
market yields at which recent pools of similar mortgages have traded taking into consideration the timing and amount of expected cash flows. The match funded securities are marked to fair value at the end of each month in the same manner as securities available for sale.
INVESTMENT SECURITIES
Investment securities represent required holdings of specified levels of common stock issued by the Federal Home Loan Bank. These securities are subject to regulatory restrictions that limit the Company's ability to dispose of them freely and are carried at cost.
DEPOSITS
The fair value of demand deposits, savings accounts and money market deposits is the amount payable on demand at the reporting date. The fair value of fixed-maturity certificates of deposit is estimated by discounting the required cash payments at the market rates offered for deposits with similar maturities on the respective financial statement dates.
BORROWINGS
The fair value of the Company's bond-match funded loan agreements, notes and debentures and capital securities are based upon quoted market prices. The fair value of the Company's other borrowings, including securities sold under agreements to repurchase and obligations outstanding under lines of credit, approximate carrying value.
DERIVATIVE FINANCIAL INSTRUMENTS
The fair values of all derivative financial instruments are based on quoted market prices.
LOAN COMMITMENTS AND LETTERS OF CREDIT
The fair value of loan commitments and letters of credit are estimated considering the difference between interest rates on the respective financial statement dates and the committed rates.
81

OCWEN FINANCIAL CORPORATION AND SUBSIDIARIES NOTES TO CONSOLIDATED FINANCIAL STATEMENTS - (CONTI NUED)
DECEMBER 31, 1999, 1998, AND 1997 (DOLLARS AND BRITISH POUNDS IN THOUSANDS, EXCEPT SHARE DATA)
The carrying amounts and the estimated fair values of the Company's financial instruments are as follows:
NOTE 4: SECURITIES HELD FOR TRADING
The Company traded assets totaling $820,235, $2,250,831, and $1,023,965 in aggregate sales proceeds during the years ended December 31, 1999, 1998 and 1997, respectively, primarily in connection with the Company's securitizations of loans, resulting in realized net gains of $36,804, $109,601, and $72,214 for the years ended December 31, 1999, 1998 and 1997, respectively. The Company held no securities for trading at December 31, 1999 or 1998.
82
December 31, 1999 December 31, 199 8 -------------------------- --------------------- ----- Carrying Fair Carrying Fai r Amount Value Amount Val ue ----------- ----------- ----------- ------ ----- FINANCIAL ASSETS: Cash and cash equivalents ...................... $ 381,858 $ 381,858 $ 445,179 $ 44 5,179 Securities available for sale .................. 587,518 587,518 593,347 59 3,347 Loans available for sale ....................... 45,213 45,213 177,847 17 7,847 Investment securities .......................... 10,965 10,965 10,825 1 0,825 Loan portfolio, net ............................ 157,408 157,184 230,312 23 2,242 Match funded loans and securities, net ......... 157,794 154,623 -- -- Discount loan portfolio, net ................... 913,229 935,336 1,026,511 1,04 6,945 FINANCIAL LIABILITIES: Deposits ....................................... 1,842,286 1,848,339 2,194,816 2,21 8,542 Securities sold under agreements to repurchase.. 47,365 47,365 72,051 7 2,051 Bond-match funded loan agreements .............. 141,515 141,557 -- -- Obligations outstanding under lines of credit... 187,866 187,866 179,285 17 9,285 Notes, debentures and other interest-bearing obligations .................................. 317,573 290,244 225,000 20 5,750 Capital securities ............................. 110,000 72,600 125,000 9 7,500 DERIVATIVE FINANCIAL INSTRUMENTS: Interest rate swaps ............................ 1,274 3,702 -- ( 2,283) U.S. Treasury futures .......................... 178 178 -- -- Swaptions and put options ...................... 726 726 -- -- Currency Swap .................................. (976) (976) (2,096) ( 2,096) British Pound futures .......................... 121 121 (187) (187) Canadian Dollar futures ........................ (320) (320) -- -- OTHER: Loan commitments ............................... -- 25,985 -- 13 3,489 Letters of credit .............................. -- 30,205 -- 1 5,878

OCWEN FINANCIAL CORPORATION AND SUBSIDIARIES NOTES TO CONSOLIDATED FINANCIAL STATEMENTS - (CONTI NUED)
DECEMBER 31, 1999, 1998, AND 1997 (DOLLARS AND BRITISH POUNDS IN THOUSANDS, EXCEPT SHARE DATA)
NOTE 5: SECURITIES AVAILABLE FOR SALE
The amortized cost, fair value and gross unrealized gains and losses on the Company's securities available for sale are as follows at the periods ended:
The amortized cost of mortgage-related securities at December 31, 1999, was net of unaccreted (discounts) and unamortized premiums of $(104,425).
One security in the available for sale portfolio, with a fair value of $13,210, is pledged as collateral to the State of New Jersey in connection with the Bank's sales of certificates of deposit over $100 to New Jersey municipalities. Mortgage-related securities with an amortized cost of $108,234 and a fair value of $105,615 were posted as collateral for securities sold under agreements to repurchase at December 31, 1999.
A profile of the maturities of securities available for sale at December 31, 1999, follows. Mortgage-backed securities are included based on their weighted-average maturities, reflecting anticipated future prepayments.
83
Gross G ross Amortized Unrealized Unr ealized Fair Cost Gains L osses Value ----------- ------------ --- -------- ----------- DECEMBER 31, 1999 Mortgage-related securities Single family residenti al: AAA-rated collateralized mortgage obligations $ 393,426 $ 50 $ (1,089) $ 392,387 BB-rated subordinates.......................... ......... 4,697 1,244 (33) 5,908 B-rated subordinates........................... ......... 5,380 990 (272) 6,098 Unrated subordinates........................... ......... 15,790 2,543 (1,046) 17,287 Unrated subprime residuals .................... ......... 125,452 2,126 (3,491) 124,087 ----------- ----------- --- -------- ----------- 544,745 6,953 (5,931) 545,767 ----------- ----------- --- -------- ----------- Multi-family and commercial: B-rated subordinates........................... ......... 38,234 -- -- 38,234 Unrated subordinates........................... ......... 3,503 -- -- 3,503 Unrated interest-only.......................... ......... -- 14 -- 14 ----------- ------------ --- -------- ----------- 41,737 14 -- 41,751 ----------- ------------ --- -------- ----------- $ 586,482 $ 6,967 $ (5,931) $ 587,518 =========== =========== === ======== ===========
Amorti zed Cost Fair Value ------ -------- ---------- Due within one year ..................... $ 363,195 $ 363,672 Due after 1 through 5 years ............. 162,155 161,609 Due after 5 through 10 years ............ 41,993 43,045 Due after 10 years ...................... 19,139 19,192 ----- -------- ---------- $ 586,482 $ 587,518 ===== ======== ==========

OCWEN FINANCIAL CORPORATION AND SUBSIDIARIES NOTES TO CONSOLIDATED FINANCIAL STATEMENTS - (CONTI NUED)
DECEMBER 31, 1999, 1998, AND 1997 (DOLLARS AND BRITISH POUNDS IN THOUSANDS, EXCEPT SHARE DATA)
(1) Includes subprime residuals with a total fair value of $87,334 ((pound)51,274) and amortized cost of $73,615 ((pound)44,354) relating to Ocwen UK.
One security in the available for sale portfolio, with a fair value of $9,929 is pledged as collateral to the State of New Jersey in connection with the Bank's sales of certificates of deposit over $100 to New Jersey municipalities. Mortgage-related securities with an amortized cost of $137,705 and a fair value of $148,839 were posted as collateral for securities sold under agreements to repurchase at December 31, 1998.
The amortized cost of mortgage-related securities at December 31, 1998, was net of unaccreted (discounts) and unamortized premiums of $(65,546).
A profile of the maturities of mortgage-related securities at December 31, 1998, follows. Mortgage-backed securities are included based on their weighted-average maturities, reflecting anticipated future prepayments based on consensus of dealers in the market.
84
Gross Gross Amortized Unrealized Unrealized Fair Cost Gains Losses Value --------- ---------- ---------- --------- DECEMBER 31, 1998 Mortgage-related securities Single family residenti al: AAA-rated collateralized mortgage obligations . ... $ 343,686 $ 552 $ (39) $ 344,199 BB-rated subordinates ......................... ... 8,517 -- -- 8,517 B-rated subordinates .......................... ... 6,344 -- -- 6,344 Unrated subordinates .......................... ... 37,872 2,723 -- 40,595 AAA-rated subprime residuals (1) .............. ... 6,178 753 -- 6,931 BBB-rated subprime residuals (1) .............. ... 15,681 1,912 -- 17,593 Unrated subprime residuals (1) ................ ... 141,526 11,425 -- 152,951 --------- --------- --------- --------- 559,804 17,365 (39) 577,130 --------- --------- --------- --------- Multi-family and commercial: B-rated subordinates .......................... ... 7,684 1,290 (161) 8,813 Unrated subordinates .......................... ... 4,126 3,340 (135) 7,331 AAA-rated interest-only ....................... ... 71 -- -- 71 BB-rated interest-only ........................ ... -- 2 -- 2 --------- --------- --------- --------- 11,881 4,632 (296) 16,217 --------- --------- --------- --------- $ 571,685 $ 21,997 $ (335) $ 593,347 ========= ========= ========= =========
Amortiz ed Cost Fair Value ------- ------- ---------- Due within one year .................... $ 328,551 $ 332,338 Due after 1 through 5 years ............ 151,625 160,659 Due after 5 through 10 years ........... 55,780 61,615 Due after 10 years ..................... 35,729 38,735 ------ ------- ---------- $ 571,685 $ 593,347 ====== ======= ==========
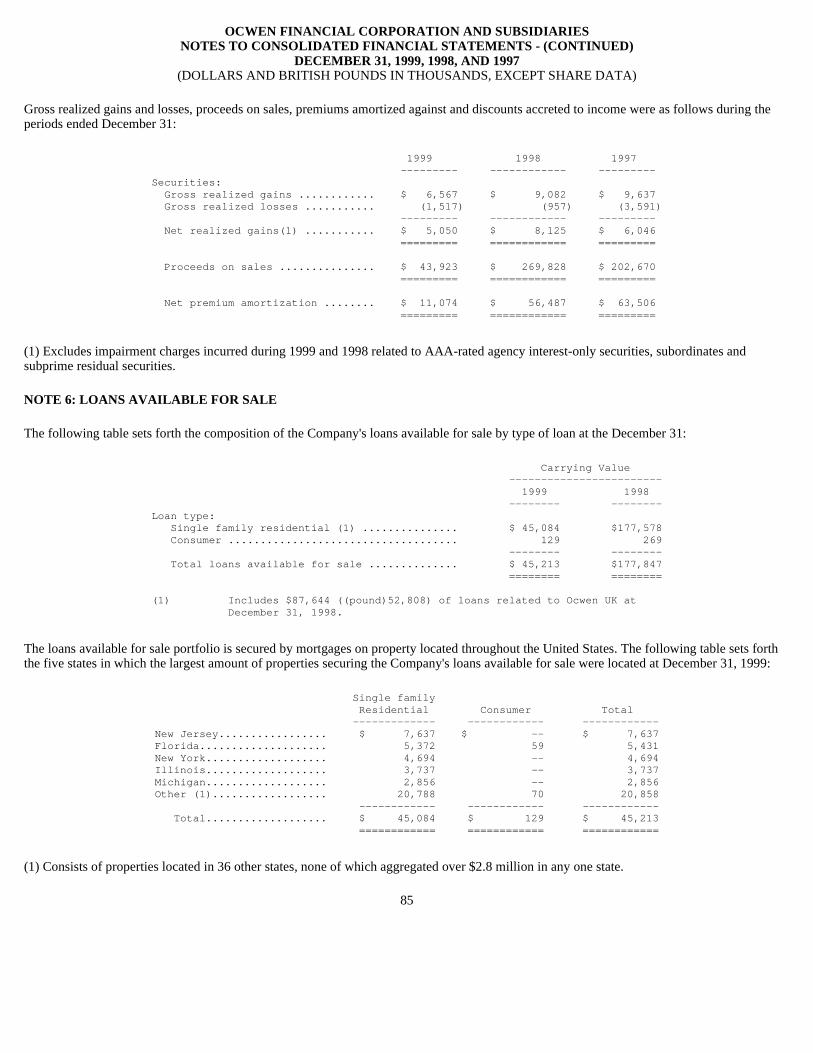
OCWEN FINANCIAL CORPORATION AND SUBSIDIARIES NOTES TO CONSOLIDATED FINANCIAL STATEMENTS - (CONTI NUED)
DECEMBER 31, 1999, 1998, AND 1997 (DOLLARS AND BRITISH POUNDS IN THOUSANDS, EXCEPT SHARE DATA)
Gross realized gains and losses, proceeds on sales, premiums amortized against and discounts accreted to income were as follows during the periods ended December 31:
(1) Excludes impairment charges incurred during 1999 and 1998 related to AAA-rated agency interest-only securities, subordinates and subprime residual securities.
NOTE 6: LOANS AVAILABLE FOR SALE
The following table sets forth the composition of the Company's loans available for sale by type of loan at the December 31:
The loans available for sale portfolio is secured by mortgages on property located throughout the United States. The following table sets forth the five states in which the largest amount of properties securing the Company's loans available for sale were located at December 31, 1999:
(1) Consists of properties located in 36 other states, none of which aggregated over $2.8 million in any one state.
85
1999 1998 1997 --------- ------------ --------- Securities: Gross realized gains ............ $ 6,567 $ 9,082 $ 9,637 Gross realized losses ........... (1,517) (957) (3,591) --------- ------------ --------- Net realized gains(1) ........... $ 5,050 $ 8,125 $ 6,046 ========= ============ ========= Proceeds on sales ............... $ 43,923 $ 269,828 $ 202,670 ========= ============ ========= Net premium amortization ........ $ 11,074 $ 56,487 $ 63,506 ========= ============ =========
Carrying Value ------------------------ 1999 1998 -------- -------- Loan type: Single family residential (1) ............... $ 45,084 $177,578 Consumer .................................... 129 269 -------- -------- Total loans available for sale .............. $ 45,213 $177,847 ======== ======== (1) Includes $87,644 ((pound)52,808) of loa ns related to Ocwen UK at December 31, 1998.
Single family Residential Consumer Total ------------- -- ---------- ------------ New Jersey................. $ 7,637 $ -- $ 7,637 Florida.................... 5,372 59 5,431 New York................... 4,694 -- 4,694 Illinois................... 3,737 -- 3,737 Michigan................... 2,856 -- 2,856 Other (1).................. 20,788 70 20,858 ------------ -- ---------- ------------ Total................... $ 45,084 $ 129 $ 45,213 ============ == ========== ============

OCWEN FINANCIAL CORPORATION AND SUBSIDIARIES NOTES TO CONSOLIDATED FINANCIAL STATEMENTS - (CONTI NUED)
DECEMBER 31, 1999, 1998, AND 1997 (DOLLARS AND BRITISH POUNDS IN THOUSANDS, EXCEPT SHARE DATA)
The following table presents a summary of the Company's non-performing loans (loans which were past due 90 days or more) in the loans available for sale portfolio at December 31:
(1) Includes $7,245 ((pound)4,365) of non-performing loans related to Ocwen UK at December 31, 1998.
NOTE 7: LOAN PORTFOLIO
The Company's loan portfolio consisted of the following at December 31:
At December 31, 1999 the Company had $1.6 million of multi-family residential loans outstanding at market interest rates and terms which were issued to facilitate the sale of the Company's real estate owned and real estate held for development. At December 31, 1998 the Company had $3.6 million of single family residential loans and $3.6 million of multi-family residential loans outstanding at market interest rates and terms, which were issued to facilitate the sale of the Company's real estate owned and real estate held for development.
Included in the loan portfolio at December 31, 1999 and 1998, was $0.5 million and $12.3 million, respectively, of loans in which the Company participated in the residual profits of the underlying real estate. The Company records any residual profits as part of interest income when received.
86
1 999 1998 --- ------- ---------- Non-performing loans: Single family (1)........................... $ 15,319 $ 39,415 Consumer.................................... 1 9 --- ------- ---------- $ 15,320 $ 39,424 === ======= ========== Non-performing loans as a percentage of: Total loans available for sale.............. 33.88% 22.17% Total assets................................ 0.46% 1.18%
Carrying Value ------------------------------------ 1999 1998 --------------- --------------- LOAN TYPE: Single family residential........................ $ 4,334 $ 30,361 Multi-family residential: Permanent...................................... 23,430 53,311 Construction................................... 57,936 22,288 --------------- --------------- Total multi-family residential................. 81,366 75,599 --------------- --------------- Commercial real estate: Hotel: Permanent.................................... -- 29,735 Construction................................. 38,645 6,896 Office ........................................ 64,745 93,068 Land .......................................... 2,238 2,266 Other ......................................... -- 6,762 --------------- --------------- Total commercial real estate................. 105,628 138,727 --------------- --------------- Consumer ........................................ 82 132 --------------- --------------- Total loans.................................. 191,410 244,819 Undisbursed loan funds........................... (24,654) (7,099) Unamortized deferred fees........................ (2,089) (2,480) Allowance for loan losses........................ (7,259) (4,928) --------------- --------------- Loans, net................................... $ 157,408 $ 230,312 =============== ===============

OCWEN FINANCIAL CORPORATION AND SUBSIDIARIES NOTES TO CONSOLIDATED FINANCIAL STATEMENTS - (CONTI NUED)
DECEMBER 31, 1999, 1998, AND 1997 (DOLLARS AND BRITISH POUNDS IN THOUSANDS, EXCEPT SHARE DATA)
The following table presents a summary of the Company's non-performing loans, allowance for loan losses and significant ratios for its loan portfolio at and for the years ended December 31:
If non-accrual loans had been current in accordance with their original terms, interest income for the years ended December 31, 1999, 1998, and 1997, would have been greater by approximately $1,139, $284 and $515, respectively. No interest has been accrued on loans greater than 89 days past due.
At December 31, 1999, the Company had two commercial loans with an aggregate carrying value of $1,793, net of allowance for loan losses of $1,982, which were impaired as defined in accordance with SFAS No. 114, and as amended by SFAS No. 118. The Company had no such impaired loans at December 31, 1998.
The loan portfolio is secured by mortgages on properties located throughout the United States. The following table sets forth the five states in which the largest amount of properties securing the Company's loans were located at December 31, 1999:
NOTE 8: DISCOUNT LOAN PORTFOLIO
The Company has acquired, through private sales and auctions, mortgage loans at a discount because the borrowers are either not current as to principal and interest payments or there is doubt as to the borrowers' ability to pay in full the contractual principal and interest. The Company estimates the amounts it will realize through foreclosure, collection efforts or other resolution of each loan and the length of time required to complete the collection process in determining the amounts it will bid to acquire such loans.
87
1 999 1998 1997 --- ----- -------- -------- NON-PERFORMING LOANS: Single family residential ................... $ 982 $ 1,169 $ 1,575 Multi-family residential .................... 1 1,037 7,392 7,583 Commercial real estate and other ............ 1 9,360 488 -- --- ----- -------- -------- $ 3 1,379 $ 9,049 $ 9,158 === ===== ======== ======== ALLOWANCE FOR LOAN LOSSES: Balance, beginning of year .................. $ 4,928 $ 3,695 $ 3,523 Provision for loan losses ................... 1,636 891 325 Charge-offs ................................. (8) (219) (153) Recoveries .................................. -- 561 -- Acquired allowance (OAC acquisition) ........ 703 -- -- --- ----- -------- -------- Balance, end of year ........................ $ 7,259 $ 4,928 $ 3,695 === ===== ======== ======== SIGNIFICANT RATIOS: Non-performing loans as a percentage of: Total loans .............................. 18.82% 3.81% 3.36% Total assets ............................. 0.95% 0.27% 0.30% Allowance for loan losses as a percentage of: Total loans .............................. 4.35% 2.07% 1.35% Non-performing loans ..................... 23.13% 54.46% 40.35%
Single Family Multi-family Commercial Residential Residential Real Estate Consumer Total ------------- ------------ ------------ ----------- - ------------ New York.................. $ 651 $ 37,973 $ 19,773 $ 3 2 $ 58,429 California................ 404 17,432 3,515 - - 21,351 Florida................... 89 -- 14,124 - - 14,213 Delaware.................. 504 50 13,300 - - 13,854 Massachusetts............. 66 -- 10,229 - - 10,295 Other..................... 2,620 25,911 44,687 5 0 73,268 ------------ ------------ ------------ ----------- - ------------ Total.................. $ 4,334 $ 81,366 $ 105,628 $ 8 2 $ 191,410 ============ ============ ============ =========== = ============

OCWEN FINANCIAL CORPORATION AND SUBSIDIARIES NOTES TO CONSOLIDATED FINANCIAL STATEMENTS - (CONTI NUED)
DECEMBER 31, 1999, 1998, AND 1997 (DOLLARS AND BRITISH POUNDS IN THOUSANDS, EXCEPT SHARE DATA)
The resolution alternatives applied to the discount loan portfolio are: (i) the borrower brings the loan current in accordance with original or modified terms; (ii) the borrower repays the loan or a negotiated amount; (iii) the borrower agrees to a deed-in-lieu of foreclosure, in which case it is classified as real estate owned and held for sale by the Company and (iv) the Company forecloses on the loan and the property is either acquired at the foreclosure sale by a third-party or by the Company, in which case it is classified as real estate owned and held for sale. Upon receipt of title to the property, the loans are transferred to real estate owned.
The Company's discount loan portfolio consists of the following at December 31:
The discount loan portfolio is secured by mortgages on property located throughout the United States. The following table sets forth the five states in which the largest amount of properties securing the Company's discount loans were located at December 31, 1999:
88
1999 1998 --------------- --------------- Single family residential loans.................. $ 597,719 $ 597,100 Multi-family residential loans................... 191,971 244,172 Commercial real estate loans: Office buildings............................ 97,784 154,063 Hotels...................................... 75,095 100,407 Retail properties........................... 105,247 21,230 Other properties............................ 87,148 173,310 --------------- --------------- 365,274 449,010 Other loans...................................... 21,615 10,144 --------------- --------------- Total discount loans........................ 1,176,579 1,300,426 --------------- --------------- Unaccreted discount: Single family residential loans............. (147,630) (161,650) Multi-family residential loans............. (37,981) (20,795) Commercial real estate loans................ (57,604) (69,747) Other loans................................. (954) (321) --------------- --------------- (244,169) (252,513) --------------- --------------- 932,410 1,047,913 Allowance for loan losses........................ (19,181) (21,402) --------------- --------------- Discount loans, net.............................. $ 913,229 $ 1,026,511 =============== ===============
Commercial Single Family Multi-Family Real Estate Residential Residential and Other Tota l ------------- -------------- ----------- ------- ---- California.............. $ 47,164 $ 7,633 $ 87,186 $ 141 ,983 New York................ 50,125 2,201 36,475 88 ,801 Illinois................ 19,905 55,721 1,298 76 ,924 Michigan................ 16,100 36,697 21,573 74 ,370 Florida................. 38,745 17,514 13,116 69 ,375 Other................... 278,050 34,223 168,684 480 ,957 ----------- -------------- ----------- ------- ---- Total................ $ 450,089 $ 153,989 $ 328,332 $ 932 ,410 =========== ============== =========== ======= ====
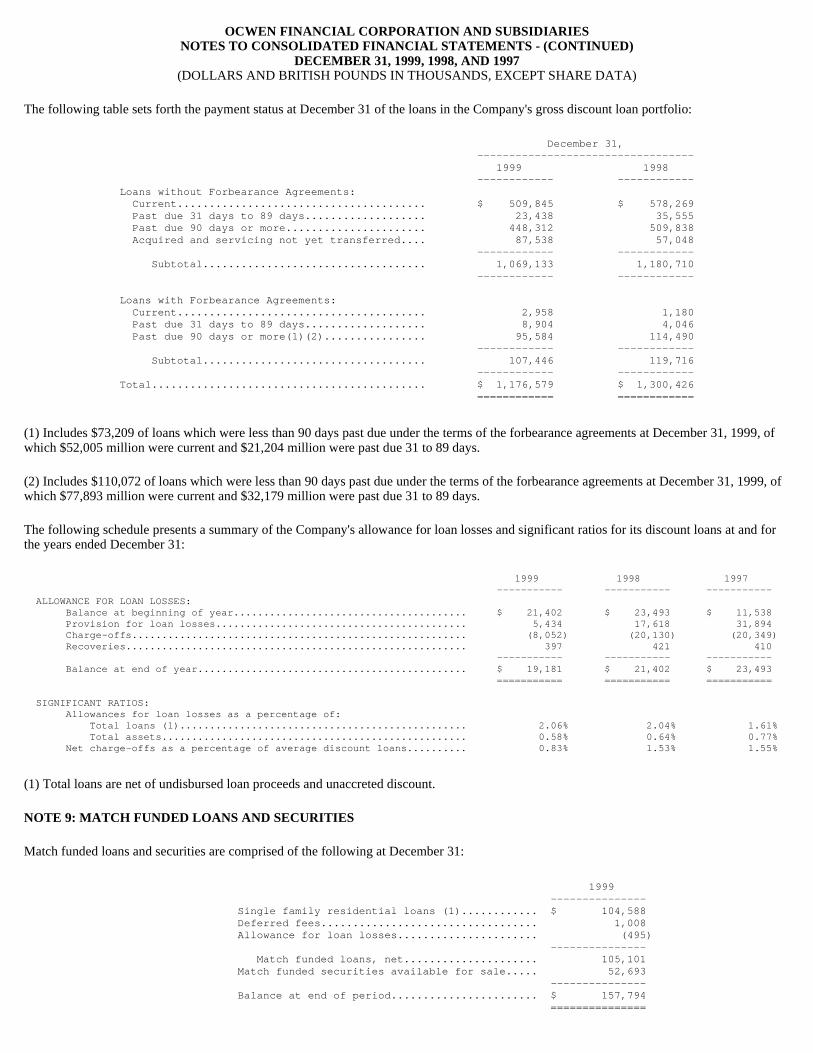
OCWEN FINANCIAL CORPORATION AND SUBSIDIARIES NOTES TO CONSOLIDATED FINANCIAL STATEMENTS - (CONTI NUED)
DECEMBER 31, 1999, 1998, AND 1997 (DOLLARS AND BRITISH POUNDS IN THOUSANDS, EXCEPT SHARE DATA)
The following table sets forth the payment status at December 31 of the loans in the Company's gross discount loan portfolio:
(1) Includes $73,209 of loans which were less than 90 days past due under the terms of the forbearance agreements at December 31, 1999, of which $52,005 million were current and $21,204 million were past due 31 to 89 days.
(2) Includes $110,072 of loans which were less than 90 days past due under the terms of the forbearance agreements at December 31, 1999, of which $77,893 million were current and $32,179 million were past due 31 to 89 days.
The following schedule presents a summary of the Company's allowance for loan losses and significant ratios for its discount loans at and for the years ended December 31:
(1) Total loans are net of undisbursed loan proceeds and unaccreted discount.
NOTE 9: MATCH FUNDED LOANS AND SECURITIES
Match funded loans and securities are comprised of the following at December 31:
December 31, ---------------------------------- 1999 1998 ------------ ------------ Loans without Forbearance Agreements: Current....................................... $ 509,845 $ 578,269 Past due 31 days to 89 days................... 23,438 35,555 Past due 90 days or more...................... 448,312 509,838 Acquired and servicing not yet transferred.... 87,538 57,048 ------------ ------------ Subtotal................................... 1,069,133 1,180,710 ------------ ------------ Loans with Forbearance Agreements: Current....................................... 2,958 1,180 Past due 31 days to 89 days................... 8,904 4,046 Past due 90 days or more(1)(2)................ 95,584 114,490 ------------ ------------ Subtotal................................... 107,446 119,716 ------------ ------------ Total........................................... $ 1,176,579 $ 1,300,426 ============ ============
1999 1998 1997 ----------- ------- ---- ----------- ALLOWANCE FOR LOAN LOSSES: Balance at beginning of year.................. ..................... $ 21,402 $ 23 ,493 $ 11,538 Provision for loan losses..................... ..................... 5,434 17 ,618 31,894 Charge-offs................................... ..................... (8,052) (20 ,130) (20,349) Recoveries.................................... ..................... 397 421 410 ----------- ------- ---- ----------- Balance at end of year........................ ..................... $ 19,181 $ 21 ,402 $ 23,493 =========== ======= ==== =========== SIGNIFICANT RATIOS: Allowances for loan losses as a percentage of: Total loans (1)........................... ..................... 2.06% 2.04% 1.61% Total assets.............................. ..................... 0.58% 0.64% 0.77% Net charge-offs as a percentage of average dis count loans.......... 0.83% 1.53% 1.55%
1999 --------------- Single family residential loans (1).... ........ $ 104,588 Deferred fees.......................... ........ 1,008 Allowance for loan losses.............. ........ (495) --------------- Match funded loans, net............. ........ 105,101 Match funded securities available for s ale..... 52,693 --------------- Balance at end of period............... ........ $ 157,794 ===============

89
(1) Includes $1,127 of non-performing loans .

OCWEN FINANCIAL CORPORATION AND SUBSIDIARIES NOTES TO CONSOLIDATED FINANCIAL STATEMENTS - (CONTI NUED)
DECEMBER 31, 1999, 1998, AND 1997 (DOLLARS AND BRITISH POUNDS IN THOUSANDS, EXCEPT SHARE DATA)
At December 31, 1999, the Company held match funded loans acquired as a result of the OAC acquisition. These loans were securitized and transferred by OAC to OAC Mortgage Residential Securities, Inc., a real estate mortgage investment conduit (the "Trust") on November 13, 1998. On that date, the Trust issued two classes of notes secured by the related group of mortgage loans. At December 31, 1999, Loan Group I consisted of approximately 705 mortgage loans original terms of up to 30 years and which are secured by first liens on single family residential properties. At that same date, Loan Group II consisted of approximately 467 mortgage loans with original terms of up to 30 years and which are secured by first or second liens on single family residential properties. Upon the transfer, OAC received approximately $173,900 of proceeds. The transfer did not qualify as a sale under SFAS No. 125, "Accounting for Transfers and Servicing of Financial Assets and Extinguishments of Liabilities." Accordingly, the proceeds received from the transfer are reported as a liability (bonds-match funded agreements) in the Consolidated Statement of Financial Condition. See Note 17.
The match funded loans are secured by mortgages on properties located throughout the United States. The following table sets forth the five states in which the largest amount of properties securing the Company's loans were located at December 31, 1999:
Additionally, at December 31, 1999, the Company held match funded securities, with an amortized cost of $53,561 and a fair value of $52,693 (net of gross unrealized losses of $868) resulting from the Company's transfer of four unrated residual securities to Ocwen NIM Corp. on December 16, 1999 in exchange for $43,000 in non-recourse notes (Series 1999-OAC1). Upon the transfer, the Company received approximately $40,100 of proceeds. The transfer did not qualify as a sale under SFAS No. 125. Accordingly, the amount of proceeds from the transfer are reported as a liability (bonds-match funded agreements) in the Consolidated Statement of Financial Condition. See Note 17.
The following table summarizes the maturities of the match-funded securities at December 31, 1999. Maturities are based on weighted-average unpaid principal balance and reflect anticipated future prepayments based on a consensus of dealers in the market.
At December 31, 1998, the Company, through IMI, owned 1,540,000 shares or 8.12% of the outstanding common stock of OAC. Also at December 31, 1998, the Company, through IMI, owned 1,808,733 units or 8.71% of the partnership units of OPLP. The Company began accounting for these entities under the equity method effective May 5, 1998 upon the increase in the combined
90
Michigan..................... $ 22,8 09 California................... 11,2 63 Florida...................... 6,7 92 Texas........................ 5,8 07 Other........................ 57,9 17 ---------- -- Total........................ $ 104,5 88 ========== ==
Entity Amortized Cost Fair Value ------ ---------------- ----------------- Due within one year.................... $ 8,669 $ 8,490 Due after 1 through 5 years............ 23,115 22,761 Due after 5 through 10 years........... 9,162 9,025 Due after 10 years..................... 12,615 12,417 ---------------- ----------------- $ 53,561 $ 52,693 ================ ================= NOTE 10: INVESTMENT IN UNCONSOLIDATED ENTITIES Carrying Value ------------------------------------ Entity 1999 1998 ------ ---------------- ----------------- OAC .................................. $ -- $ 16,268 OPLP .................................. -- 22,820 Kensington............................. 36,215 46,586 Other.................................. 903 1,219 ---------------- ----------------- $ 37,118 $ 86,893 ================ =================

OCWEN FINANCIAL CORPORATION AND SUBSIDIARIES NOTES TO CONSOLIDATED FINANCIAL STATEMENTS - (CONTI NUED)
DECEMBER 31, 1999, 1998, AND 1997 (DOLLARS AND BRITISH POUNDS IN THOUSANDS, EXCEPT SHARE DATA)
ownership of OAC and OPLP to 16.83%. An adjustment to reduce retained earnings in the amount of $979 (net of income taxes of $526) was recorded upon conversion to the equity method to reflect the cumulative effect of the accounting change. As more fully described in Note 2, the Company acquired the remaining outstanding shares of OAC on October 7, 1999. During 1999, prior to the acquisition of OAC, the Company recorded equity in losses of its investment in OAC and OPLP of $(1,809) and $(1,797), respectively. During 1998, the Company recorded equity in the losses of its investment in OAC and OPLP of $(4,007) and $(4,694), respectively.
The Company's investment in unconsolidated entities at December 31, 1999 includes 35.84% of the total outstanding common stock of Kensington, an originator of non-conforming residential mortgages in the U.K., purchased on February 25, 1998, for $45,858 ((pound)27,837). The Company's investment in Kensington amounted to $36,215 and $46,586 at December 31, 1999 and 1998, respectively, net of the excess of the purchase price over the net investment. The excess of the purchase price over the net investment amounted to $32,057 ((pound)19,456) and $34,492 ((pound)20,933) at December 31, 1999 and 1998, respectively, net of accumulated amortization of $4,464 ((pound)2,709) and $2,029 ((pound)1,231), for 1999 and 1998, respectively, and is being amortized over a period of 15 years. The Company recorded equity in (losses) earnings of Kensington of ($9,154) and $439 during 1999 and 1998, respectively, including $2,435 and $2,029 amortization of excess cost over purchase price during 1999 and 1998, respectively.
The below financial data is presented under U.K. GAAP. For purposes of recording the Company's equity in earnings of Kensington, the Company adjusts this financial data to conform to U.S. GAAP. The principal adjustment made to conform to U.S. GAAP is related to the accounting for securitizations in accordance with SFAS No. 125.
On December 12, 1997, BCBF, LLC ("LLC"), a limited liability company formed in March 1996 between the Company and BlackRock Capital Finance LP, distributed all of its assets. The Company's equity in earnings of the LLC of $23,688 for 1997 includes 50% of the net income of the LLC before deduction of the Company's 50% share of loan servicing fees which were paid 100% to the Company. Equity in earnings for 1997 also includes the recapture of $5,114 of valuation allowances established in 1996 by the Company on its equity investment in the joint venture as a result of the resolution and securitization of loans. The Company has recognized 50% of the loan servicing fees not eliminated in consolidation in servicing fees and other charges. Because the LLC was a pass-through entity for federal income tax purposes, provisions for income taxes were established by each of the Company and its co-investor, and not the LLC.
91
1999 1998 - ---------- ----------- AT NOVEMBER 30, Total assets................................... $ 275,177 $ 232,160 = ========== =========== Total liabilities.............................. $ 243,108 $ 202,775 = ========== =========== FOR THE TWELVE MONTHS ENDED NOVEMBER 30, Total operating income......................... $ 57,972 $ 31,047 = ========== =========== Total operating expenses....................... $ 49,339 $ 24,530 = ========== =========== Income before income taxes..................... $ 8,633 $ 6,517 = ========== =========== Net income..................................... $ 3,544 $ 6,517 = ========== ===========

OCWEN FINANCIAL CORPORATION AND SUBSIDIARIES NOTES TO CONSOLIDATED FINANCIAL STATEMENTS - (CONTI NUED)
DECEMBER 31, 1999, 1998, AND 1997 (DOLLARS AND BRITISH POUNDS IN THOUSANDS, EXCEPT SHARE DATA)
Set forth below is the statement of operation of the LLC for the year ended December 31, 1997.
In March 1997, as part of a larger transaction involving the Company and an affiliate of BlackRock, the LLC securitized 1,196 loans with an unpaid principal balance of $51,714, past due interest of $14,209 and a net book value of $40,454. Proceeds from the sale of the related securities amounted to $58,866. In December 1997, as part of a larger transaction involving the Company and BlackRock, the LLC securitized 534 loans with an unpaid principal balance of $26,644, past due interest of $8,303 and a net book value of $20,139. Proceeds from the sale of the related securities amounted to $30,178.
The Company's investment in unconsolidated entities also includes a joint venture investment in BCFL, L.L.C. ("BCFL"), a limited liability corporation formed in January 1997 between the Company and BlackRock. The Company owns a 10% interest in BCFL which was formed to acquire multi-family loans. At December 31, 1999 and 1998, the Company's investment amounted to $449 and $1,133, respectively. Equity in earnings of BCFL amounted to $144 and $277 during 1999 and 1998, respectively.
NOTE 11: REAL ESTATE OWNED
Real estate owned consists almost entirely of properties acquired by foreclosure or deed-in-lieu thereof on loans in the Company's discount loan portfolio. Real estate owned, net of valuation allowance, is held for sale and was provided from the following portfolios at December 31:
92
Interest income............................. $ 8,928 Interest expense............................ -- ----- ----- Net interest income...................... 8,928 ----- ----- Non-interest income: Gain on sale of loans held for sale...... 2 7,994 Loss on real estate owned, net........... (93) Loan fees................................ 23 ----- ----- 2 7,924 Operating expenses: Loan servicing fees...................... 1,850 Other loan expenses...................... 13 ----- ----- 1,863 Net income.................................. $ 3 4,989 ===== =====
De cember 31, -------- ---------------- 1999 1998 -------- -- ---------- Discount loan portfolio: Single family residential............. $ 72,1 93 $ 94,641 Multi-family residential.............. 2,6 01 20,130 Commercial real estate................ 85,2 33 82,591 -------- -- ---------- Total............................. 160,0 27 197,362 Loan portfolio........................... 2,1 83 227 Loans available for sale................. 5,2 96 3,962 -------- -- ---------- Total............................. $ 167,5 06 $ 201,551 ======== == ==========

OCWEN FINANCIAL CORPORATION AND SUBSIDIARIES NOTES TO CONSOLIDATED FINANCIAL STATEMENTS - (CONTI NUED)
DECEMBER 31, 1999, 1998, AND 1997 (DOLLARS AND BRITISH POUNDS IN THOUSANDS, EXCEPT SHARE DATA)
The following table sets forth certain geographical information by type of property at December 31, 1999 related to the Company's real estate owned.
(1) Consists of properties located in 44 other states, none of which aggregated over $6,293 in any one state.
The following schedule presents the activity, in aggregate, in the valuation allowance on real estate owned for the years ended December 31:
93
Multi-family Residential Single Family Resid ential and Commercial Tota l ------------------- ------ ------------------------- ------------- ----------- No. of No. of No. of Amount Prope rties Amount Properties Amount Properties -------- ----- ----- --------- ---------- --------- ---------- Florida ................. $ 5,523 110 $ 48,291 6 $ 53,814 116 Georgia ................. 2,405 32 14,393 1 16,798 33 Connecticut ............. 2,959 51 12,612 2 15,571 53 California .............. 7,527 95 3,066 4 10,593 99 New York ................ 5,715 108 789 2 6,504 110 Other (1)................ 54,043 1 ,237 10,183 24 64,226 1,261 -------- ---- ---- --------- -------- --------- -------- Total................. $ 78,172 1 ,633 $ 89,334 39 $ 167,506 1,672 ======== ==== ==== ========= ======== ========= ========
1999 1998 1997 ----------- ----------- ----------- Balance at beginning of year....................... $ 15,325 $ 12,346 $ 11,493 Provision for losses............................... 28,008 18,626 13,450 Charge-offs and sales.............................. (26,152) (15,647) (12,597 ) ----------- ----------- ----------- Balance at end of year............................. $ 17,181 $ 15,325 $ 12,346 =========== =========== ===========

OCWEN FINANCIAL CORPORATION AND SUBSIDIARIES NOTES TO CONSOLIDATED FINANCIAL STATEMENTS - (CONTI NUED)
DECEMBER 31, 1999, 1998, AND 1997 (DOLLARS AND BRITISH POUNDS IN THOUSANDS, EXCEPT SHARE DATA)
NOTE 12: INVESTMENT IN REAL ESTATE
The Company's investment in real estate consisted of the following at December 31:
(1) Acquired as a result of the acquisition of OAC.
During 1999, the Company recognized an impairment charge of $2,817 on one nonresidential property.
NOTE 13: MORTGAGE SERVICING RIGHTS
The Company services for other investors mortgage loans which it does not own. The total unpaid principal balance of such loans serviced for others was $11,105,283 and $10,592,466 at December 31, 1999 and 1998, respectively. Servicing fee income on such loans amounted to $58,698, $49,229, and $22,056 for the years ended December 31, 1999, 1998 and 1997, respectively.
The unamortized balance of mortgage servicing rights, which are included in other assets, is as follows at December 31:
94
1999 1998 ------------- ------------- Properties held for investment (1): Office buildings................................ ......... $ 202,607 $ -- Retail.......................................... ......... 33,224 -- Building improvements........................... ......... 17,590 -- Tenant improvements and lease commissions....... ......... 8,150 -- Furniture and fixtures.......................... ......... 44 -- ------------- ------------- 261,615 -- Accumulated depreciation........................ ......... (9,011) -- ------------- ------------- 252,604 -- ------------- ------------- Properties held for lease: Land and land improvements 1,256 5,173 Building 14,629 28,059 Accumulated depreciation........................ ......... (248) (350) ------------- ------------- 15,637 32,882 ------------- ------------- Other investments in real estate: Nonresidential.................................. ......... -- 3,978 ------------- ------------- $ 268,241 $ 36,860 ============= =============
1999 1998 -------------- ------------- Unamortized balance................................ ..................... $ 13,313 $ 8,690 Valuation allowance................................ ..................... (1,630) (1,630) -------------- ------------- $ 11,683 $ 7,060 ============== ============= The following table summarizes the acti vity in mortgage servicing assets for the years ended December 31: 1999 1998 -------------- ------------- Balance at the beginning of year................... ..................... $ 7,060 $ 5,738 Purchases.......................................... ..................... 9,415 1,191 Servicing rights arising from the sale of loans wit h servicing rights retained........................ ..................... -- 2,886 Amortization....................................... ..................... (4,792) (2,755) -------------- ------------- $ 11,683 $ 7,060 ============== =============

OCWEN FINANCIAL CORPORATION AND SUBSIDIARIES NOTES TO CONSOLIDATED FINANCIAL STATEMENTS - (CONTI NUED)
DECEMBER 31, 1999, 1998, AND 1997 (DOLLARS AND BRITISH POUNDS IN THOUSANDS, EXCEPT SHARE DATA)
Escrow advances related to loans serviced for others consisted of the following at December 31:
NOTE 14: INVESTMENTS IN LOW INCOME HOUSING TAX CRED IT INTERESTS
The carrying value of the Company's investments in low-income housing tax credit interests are as follows at December 31:
The qualified affordable housing projects underlying the Company's investments in low-income housing tax credit interests are geographically located throughout the United States. At December 31, 1999, the Company's largest single investment was $8,242, which related to a project located in Columbia, South Carolina.
Income on the Company's limited partnership investments made prior to May 18, 1995 is recorded under the level yield method as a reduction of income tax expense, and amounted to $2,953, $4,651 and $6,846 for the years ended December 31, 1999, 1998 and 1997, respectively. Had these investments been accounted for under the equity method, net income would have been reduced by $60, $1,113 and $665 for the years ended December 31, 1999, 1998 and 1997, respectively. For limited partnership investments made after May 18, 1995, and for investments as a limited and, through subsidiaries, as a general partner, the Company recognized tax credits of $15,289, $13,017, and $8,035 for the years ended December 31, 1999, 1998 and 1997, respectively, and recorded a loss after depreciation of $6,291, $6,905 and $4,935 from operations on the underlying real estate for the years ended December 31, 1999, 1998 and 1997, respectively.
Included in other income for the years ended December 31, 1999, 1998 and 1997, are gains of $6,591, $7,366 and $6,053, respectively, on the sales of certain investments in low-income housing tax credit interests which had carrying values of $41,744, $28,887 and $15,728, respectively, at time of sale.
NOTE 15: PREMISES AND EQUIPMENT
Premises and equipment at December 31, 1999 are summarized as follows:
Depreciation expense amounted to $13,546, $11,703 and $6,821 for 1999, 1998 and 1997, respectively. Buildings represents the Company's nationwide customer service and collection facility in Orlando, Florida, construction of which was completed during 1999.
95
1999 1998 -------------- ------------- Principal and interest advances.................... .................. $ 59,118 $ 28,853 Taxes and insurance advances....................... .................. 41,569 24,751 Other advances..................................... .................. 30,921 20,091 -------------- ------------- $ 131,608 $ 73,695 ============== =============
1999 1998 --------------- --------------- Investments solely as a limited partner made prior to May 18, 1995.............. $ 17,327 $ 19,607 Investments solely as a limited partner made on or after May 18, 1995........... 59,541 56,299 Investments both as a limited and, through subsidia ries, as a general partner... 74,121 68,258 --------------- --------------- $ 150,989 $ 144,164 =============== ===============
1999 1998 -------------- ------------- Computer hardware and software..................... .......................... $ 39,224 $ 36,000 Buildings.......................................... .......................... 19,192 -- Leasehold improvements............................. .......................... 9,651 9,062 Land and land improvements......................... .......................... 4,782 4,782 Furniture and fixtures............................. .......................... 6,704 7,203 Office equipment................................... .......................... 2,269 1,625 Construction in progress........................... .......................... -- 951 Less accumulated depreciation and amortization..... .......................... (32,784) (25,800) -------------- ------------- $ 49,038 $ 33,823 ============== =============

OCWEN FINANCIAL CORPORATION AND SUBSIDIARIES NOTES TO CONSOLIDATED FINANCIAL STATEMENTS - (CONTI NUED)
DECEMBER 31, 1999, 1998, AND 1997 (DOLLARS AND BRITISH POUNDS IN THOUSANDS, EXCEPT SHARE DATA)
NOTE 16: DEPOSITS
The Company's deposits consist of the following at December 31:
At December 31, 1999 and 1998, certificates of deposit, net of unamortized deferred fees, include $1,449,873 and $1,847,335, respectively, of deposits originated through national, regional and local investment banking firms which solicit deposits from their customers, all of which are non-cancelable. Additionally, at December 31, 1999 and 1998, $100,366 and $100,463, respectively, of certificates of deposit were issued on an uninsured basis. Of the $100,366 of uninsured deposits at December 31, 1999, $57,455 were from political subdivisions in New Jersey and are secured or collateralized as required under state law. Non-interest bearing deposits at December 31, 1999 and 1998 included $259,406 and $232,917, respectively, of escrow balances primarily related to principal and interest collected but not yet remitted in accordance with loan servicing agreements.
The contractual remaining maturity of the Company's certificates of deposit at December 31, 1999 is as follows:
Deferred fees on certificates of deposits are amortized on a straight-line basis over the term of the respective certificates of deposit. Such amortization amounted to $5,098, $6,353 and $6,619 for the years ended December 31, 1999, 1998 and 1997, respectively, and is included in interest expense on deposits. Interest expense by type of deposit account is as follows for the years ended December 31:
Accrued interest payable on deposits amounted to $15,078 and $22,687 at December 31, 1999 and 1998, respectively.
NOTE 17: BONDS - MATCH FUNDED AGREEMENTS
Bonds-match funded agreements were comprised of the following at December 31, 1999:
1999 1998 ----------------- ----------------- Non-interest-bearing deposits.................... $ 280,273 $ 251,429 NOW and money market checking accounts........... 30,343 35,070 Savings accounts................................. 1,361 1,326 ----------------- ----------------- 311,977 287,825 ----------------- ----------------- Certificates of deposit.......................... 1,536,997 1,916,548 Unamortized deferred fees........................ (6,688) (9,557) ----------------- ----------------- 1,530,309 1,906,991 ----------------- ----------------- Total deposits................................... $ 1,842,286 $ 2,194,816 ================= =================
Within one year................................ $ 760,594 Within two years............................... 400,619 Within three years............................. 234,126 Within four years.............................. 73,646 Within five years.............................. 37,294 Thereafter..................................... 24,030 ------------- $ 1,530,309 =============
1 999 1998 1997 --- ----- -------- -------- NOW accounts and money market checking ..... $ 1,313 $ 1,434 $ 1,220 Savings .................................... 38 38 49 Certificates of deposit .................... 9 7,019 115,112 120,801 --- ----- -------- -------- $ 9 8,370 $116,584 $122,070 === ===== ======== ========
OAC Mortgage Residential Securities, Inc. .... $ 100,968 Ocwen NIM Corp................................ 40,547 --- -------- $ 141,515 === ========

96

OCWEN FINANCIAL CORPORATION AND SUBSIDIARIES NOTES TO CONSOLIDATED FINANCIAL STATEMENTS - (CONTI NUED)
DECEMBER 31, 1999, 1998, AND 1997 (DOLLARS AND BRITISH POUNDS IN THOUSANDS, EXCEPT SHARE DATA)
At December 31, 1999, the Company held $100,968 of bonds-match funded agreements which were acquired as a result of the acquisition of OAC. See Note 9. In addition, on December 16, 1999, the Company transferred four unrated residual securities to Ocwen NIM Corp. in exchange for non-recourse notes (Series 1999-OAC1). Upon the transfer, the Company received approximately $40,100 of proceeds. The transfer did not qualify as a sale under FAS 125. Accordingly, the amount of proceeds from the transfers are reported as a liability. See Note 9.
At December 31, 1999, bonds-match funded agreements had a weighted average interest rate of 6.86%. Accrued interest payable on bonds-match funded agreements at that date amounted to $264. Interest expense on bonds-match funded agreement amounted to $2,101 during 1999.
NOTE 18: OBLIGATIONS OUTSTANDING UNDER LINES OF CRE DIT
The Company through its subsidiaries has obtained secured lines of credit arrangements from various unaffiliated financial institutions as follows:
(1) These lines were used to fund subprime mortgage loan originations, generally advanced at a rate of 80% to 98% of the principal balance of the mortgage loan and are secured by such mortgage loans.
(2) These lines are collateralized by commercial loans and investments in real estate.
(3) Line was collateralized by the OAC shares held by the Company.
(4) LIBOR was 5.82% and 5.06% at December 31, 1999 and 1998, respectively.
Accrued interest payable on obligations outstanding under lines of credit amounted to $200 and $930 at December 31, 1999 and 1998, respectively. Interest expense on obligations outstanding under lines of credits amounted to $16,318, $34,587, and $5,578 during 1999, 1998, and 1997, respectively.
97
Balance Amount of Committed Maturity Entity Outstanding Facili ty Amount Date Interest Rate(4) ------ ------------- -------- ----- ------------- --------------- --- -------------------------- DECEMBER 31, 1999: OFS (1)............. $ 2,041 $ 20 0,000 $ 100,000 July 2001 LIB OR + 75 basis points 3,770 11 5,000 100,000 May 2000 LIB OR + 95 - 150 basis points 15,227 5 0,000 50,000 May 2000 LIB OR + 137.5 basis points 7,658 2 5,000 -- May 2000 LIB OR + 175 basis points OAC (2)............. 84,170 20 0,000 200,000 June 2001 LIB OR + 175 basis points 75,000 7 5,000 75,000 April 2001 LIB OR + 175 basis points ------------- $ 187,866 ============= DECEMBER 31, 1998: OFS (1)............. $ 8,321 $ 20 0,000 $ 100,000 July 2001 LIB OR + 75 basis points 9,757 18 5,000 100,000 April 1999 LIB OR + 60 basis points 30,666 5 0,000 50,000 May 1999 LIB OR + 112 basis points 2,276 2 0,000 -- month to month LIB OR + 250 basis points 8,472 1 5,000 -- April 1999 LIB OR + 150 basis points IMI (3) ............ 2,477 Lesser o f $15,000 N/A N/A LIB OR + 150 basis points or 60% o f market value of collater al Ocwen UK (1)........ 92,753 16 6,000 73,247 April 1999 LIB OR + 87.5 basis points 24,563 12 4,500 99,937 November 1999 LIB OR + 80 basis points ------------- $ 179,285 =============

OCWEN FINANCIAL CORPORATION AND SUBSIDIARIES NOTES TO CONSOLIDATED FINANCIAL STATEMENTS - (CONTI NUED)
DECEMBER 31, 1999, 1998, AND 1997 (DOLLARS AND BRITISH POUNDS IN THOUSANDS, EXCEPT SHARE DATA)
NOTE 19: NOTES, DEBENTURES AND OTHER INTEREST-BEARI NG OBLIGATIONS
Notes, debentures and other interest-bearing obligations mature as follows:
The 12% Subordinated Debentures due 2005 (the "Debentures") were issued by the Bank in the original amount of $100,000 with interest payable semiannually on June 15 and December 15. The Debentures are unsecured general obligations of the Bank and are subordinated in right of payment to all existing and future senior debt.
The Debentures may not be redeemed prior to June 15, 2000, except as described below. On or after such date, the Debentures may be redeemed at any time at the option of the Bank, in whole or in part, together with accrued and unpaid interest, if any, on not less than 30 nor more than 60 days notice at the following redemption prices (expressed as a percentage of the principal amount), if redeemed during the twelve-month period beginning June 15 of the years indicated below:
In connection with the issuance of the Debentures, the Bank incurred certain costs which have been capitalized and are being amortized on a straight-line basis over the expected life of the Debentures. The unamortized balance of these issuance costs amounted to $1,468 and $1,894, at December 31, 1999 and 1998, respectively, and is included in other assets. Accrued interest payable on the Debentures amounted to $335 and $500 at December 31, 1999 and 1998, respectively. During 1999, the Bank repurchased $33,000 of its Debentures in the open market, resulting in an extraordinary gain of $1,605 ($1,323 net of taxes).
The 11.875% Notes due October 1, 2003, ("the Notes") were issued by the Company in the original amount of $125,000 with interest payable semiannually on April 1 and October 1. The Notes are unsecured general obligations of the Company and are subordinated in right of payment to the claims of creditors of the Company's subsidiaries.
The Notes may not be redeemed prior to October 1, 2001, except as described below. On or after such date, the Notes may be redeemed at any time at the option of the Company, in whole or in part, at the following redemption prices (expressed as a percentage of the principal amount) plus accrued and unpaid interest, if redeemed during the twelve-month period beginning October 1 of the years indicated below:
During 1999, the Company repurchased $21,150 of its Notes in the open market, resulting in an extraordinary gain of $1,322 ($1,090 net of taxes).
The indenture governing the Notes requires the Company to maintain, at all times when the Notes are not rated in an investment grade category by one or more nationally recognized statistical rating organizations, unencumbered liquid assets with a value equal to 100% of the required interest payments due on the Notes on the next two succeeding semiannual interest payment dates. The Company maintained an investment in cash and cash equivalents of $15,054 and $14,844 at December 31,
December 31, ---------------------- 1999 1998 ---------- ---------- 2003: 11.875% Notes due October 1........................ .. $ 103,850 $ 125,000 2004: Loan due May 24 (LIBOR plus 150 basis points)...... .. 6,236 -- 2005: 12% Subordinated Debentures due June 15............ .. 67,000 100,000 11.5% Notes due July 1............................. .. 140,487 -- ---------- ---------- $ 317,573 $ 225,000 ========== ==========
Year Redemption Price ---- ---------------- 2001 ....................... 104.000% 2002 ....................... 102.667% 2003........................ 101.333% 2004 and thereafter ........ 100.000%
Year Redemption Price ---- ---------------- 2001........................ 105.938% 2002........................ 102.969%

98

OCWEN FINANCIAL CORPORATION AND SUBSIDIARIES NOTES TO CONSOLIDATED FINANCIAL STATEMENTS - (CONTI NUED)
DECEMBER 31, 1999, 1998, AND 1997 (DOLLARS AND BRITISH POUNDS IN THOUSANDS, EXCEPT SHARE DATA)
1999 and 1998, respectively, that is restricted for purposes of meeting this liquidity requirement. The indenture further provides that the Company shall not sell, transfer or otherwise dispose of shares of common stock of the Bank or permit the Bank to issue, sell or otherwise dispose of shares of its common stock unless in either case the Bank remains a wholly-owned subsidiary of the Company.
In connection with the issuance of the Notes, the Company incurred certain costs which have been capitalized and are being amortized on a straight-line basis over the life of the Notes. The unamortized balance of these issuance costs amounted to $3,030 and $3,838 at December 31, 1999 and 1998, respectively, and is included in other assets. Accrued interest payable on the Notes amounted to $3,083 and $3,711 at December 31, 1999 and 1998, respectively.
As a result of the acquisition of OAC, the Company acquired the 11.5% Redeemable Notes ("the Redeemable Notes") due 2005 which were issued by OAC during 1998 in the original amount of $150,000. Interest on the Redeemable Notes is payable semi-annually on January 1 and July 1, beginning January 1, 1999. The Redeemable Notes will mature on July 1, 2005 and will be redeemable, at the option of the Company, in whole or in part, on or after July 1, 2002, at the redemption prices specified below (expressed as percentages of the principal amount thereof), in each case, together with accrued and unpaid interest, if any, thereon to the date of redemption, upon not less than 30 nor more than 60 days' notice, if redeemed during the twelve-month period beginning on July 1 of the years indicated below:
During the first 36 months after the date of original issue of the Redeemable Notes, the Company may use the net proceeds of one or more offerings of its common stock to redeem up to 25% of the aggregate principal amount of the Redeemable Notes at a redemption price of 111.50% of the principal amount thereof, plus accrued and unpaid interest to the date of redemption, provided that, after any such redemption, the aggregate principal amount of the Redeemable Notes outstanding must equal at least $112,500. At December 31, 1999, the outstanding balance of the Redeemable Notes was $140,487. Accrued interest payable on the Redeemable Notes amounted to $8,223. Interest expense on the Redeemable Notes amounted to $4,226 during 1999.
OAC is subject to various restrictive covenants under the Indenture governing the Redeemable Notes (the "Redeemable Note Indenture"). The Redeemable Note Indenture prohibits OAC from incurring or issuing debt, other than certain permitted indebtedness ("Permitted Indebtedness"), if certain financial tests are not satisfied. One such test requires that the ratio of adjusted Funds From Operations ("FFO") to adjusted fixed charges for the previous four fiscal quarters exceeds 1.25 to 1.00. Given that adjusted FFO to adjusted fixed charges for the four quarters ended December 31, 1999 was 0.56, OCN does not expect this financial test to be satisfied for some time to come. Permitted Indebtedness, the incurrence of which is not limited under the Redeemable Note Indenture, includes: (i) up to $150 million of debt that may be incurred under certain warehouse lines of credit or mortgage loan repurchase agreements; (ii) match funded debt that may be incurred by a special purpose, bankruptcy remote subsidiary of OAC; (iii) renewals or refinancings of existing debt structured to meet certain conditions; (iv) debt that may be incurred in hedge transactions; (v) up to $10 million of capital lease and purchase money financing; and (vi) up to $50 million of additional debt. OCN believes that OAC can meet its financing needs from sources of Permitted Indebtedness during 2000 although there can be no assurance that this will be the case. The Redeemable Note Indenture also prohibits OAC from making certain restricted payments, including dividends. As of December 31, 1999, OAC was not permitted to pay dividends under the Redeemable Note Indenture.
NOTE 20: CAPITAL SECURITIES
In August 1997, Ocwen Capital Trust ("OCT") issued $125,000 of 10-7/8% Capital Securities (the "Capital Securities"). Proceeds from issuance of the Capital Securities were invested in 10-7/8% Junior Subordinated Debentures issued by Ocwen. The Junior Subordinated Debentures, which represent the sole assets of OCT, will mature on August 1, 2027. During 1999, OCT repurchased $15,000 of its Capital Securities in the open market, resulting in extraordinary gains of $5,548 ($4,570 net of taxes).
Holders of the Capital Securities are entitled to receive cumulative cash distributions accruing from the date of original issuance and payable semiannually in arrears on February 1 and August 1 of each year, commencing on February 1, 1998, at an annual rate of 10-7/8% of the liquidation amount of $1,000 per Capital Security. Payment of distributions out of moneys held by OCT, and payments on liquidation of OCT or the redemption of Capital Securities, are guaranteed by the Company to the extent OCT has funds available. If the Company does not make principal or interest payments on the Junior Subordinated Debentures, OCT will not have sufficient funds to make distributions on the Capital Securities, in which event the guarantee shall not apply to
99
Year Redemption Price ---- ---------------- 2002........................ 105.750% 2003........................ 102.875 2004 and thereafter......... 100.000

OCWEN FINANCIAL CORPORATION AND SUBSIDIARIES NOTES TO CONSOLIDATED FINANCIAL STATEMENTS - (CONTI NUED)
DECEMBER 31, 1999, 1998, AND 1997 (DOLLARS AND BRITISH POUNDS IN THOUSANDS, EXCEPT SHARE DATA)
such distributions until OCT has sufficient funds available therefore. Accumulated distributions payable on the Capital Securities amounted to $4,815 and $5,664 at December 31, 1999 and 1998, respectively, and is included in accrued interest payable.
The Company has the right to defer payment of interest on the Junior Subordinated Debentures at any time or from time to time for a period not exceeding 10 consecutive semiannual periods with respect to each deferral period, provided that no extension period may extend beyond the stated maturity of the Junior Subordinated Debentures. Upon the termination of any such extension period and the payment of all amounts then due on any interest payment date, the Company may elect to begin a new extension period. Accordingly, there could be multiple extension periods of varying lengths throughout the term of the Junior Subordinated Debentures. If interest payments on the Junior Subordinated Debentures are deferred, distributions on the Capital Securities will also be deferred and the Company may not, and may not permit any subsidiary of the Company to, (i) declare or pay any dividends or distributions on, or redeem, purchase, acquire, or make a liquidation payment with respect to, the Company's capital stock or (ii) make any payment of principal, interest or premium, if any, on or repay, repurchase or redeem any debt securities that rank pari passu with or junior to the Junior Subordinated Debentures. During an extension period, interest on the Junior Subordinated Debentures will continue to accrue at the rate of 10-7/8% per annum, compounded semiannually.
The Junior Subordinated Debentures are redeemable prior to maturity at the option of the Company, subject to the receipt of any necessary prior regulatory approval, (i) in whole or in part on or after August 1, 2007, at a redemption price equal to 105.438% of the principal amount thereof on August 1, 2007, declining ratably on each August 1 thereafter to 100% on or after August 1, 2017, plus accrued interest thereon, or (ii) at any time, in whole (but not in part), upon the occurrence and continuation of a special event (defined as a tax event, regulatory capital event or an investment company event) at a redemption price equal to the greater of (a) 100% of the principal amount thereof or (b) the sum of the present values of the principal amount and premium payable with respect to an optional redemption of such Junior Subordinated Debentures on August 1, 2007, together with scheduled payments of interest from the prepayment date to August 1, 2007, discounted to the prepayment date on a semiannual basis at the adjusted Treasury rate plus accrued interest thereon to the date of prepayment. The Capital Securities are subject to mandatory redemption, in whole or in part, upon repayment of the Junior Subordinated Debentures at maturity or their earlier redemption, in an amount equal to the amount of the related Junior Subordinated Debentures maturing or being redeemed and at a redemption price equal to the redemption price of the Junior Subordinated Debentures, plus accumulated and unpaid distributions thereon to the date of redemption.
For financial reporting purposes, OCT is treated as a subsidiary of the Company and, accordingly, the accounts of OCT are included in the consolidated financial statements of the Company. Intercompany transactions between OCT and the Company, including the Junior Subordinated Debentures, are eliminated in the consolidated financial statements of the Company. The Capital Securities are presented as a separate caption between liabilities and stockholders' equity in the consolidated statement of financial condition of the Company as "Company-obligated, mandatorily redeemable securities of subsidiary trust holding solely Junior Subordinated Debentures of the Company." Distributions on the Capital Securities are recorded as a separate caption immediately following non-interest expense in the consolidated statement of operations of the Company. The Company intends to continue this method of accounting going forward.
In connection with the issuance of the Capital Securities, the Company incurred certain costs which have been capitalized and are being amortized over the term of the Capital Securities. The unamortized balance of these issuance costs amounted to $4,041 and $4,187 at December 31, 1999 and 1998, respectively, and is included in other assets.
NOTE 21: BASIC AND DILUTED EARNINGS PER SHARE
Under SFAS No. 128, the Company is required to present both basic and diluted EPS on the face of its statement of operations. Basic EPS excludes common stock equivalents and is calculated by dividing net income by the weighted average number of common shares outstanding during the year. Diluted EPS is calculated by dividing net income by the weighted average number of common shares outstanding, including the dilutive potential common shares related to outstanding stock options. In computing diluted net loss per share for 1998, the conversion of common stock equivalents was not assumed as the effect would be antidilutive.
100

OCWEN FINANCIAL CORPORATION AND SUBSIDIARIES NOTES TO CONSOLIDATED FINANCIAL STATEMENTS - (CONTI NUED)
DECEMBER 31, 1999, 1998, AND 1997 (DOLLARS AND BRITISH POUNDS IN THOUSANDS, EXCEPT SHARE DATA)
The following is a reconciliation of the calculation of basic EPS to diluted EPS.
(1) Excludes the effect of 1,565,343 and 1,763,250 of options that are antidilutive for 1999 and 1998, respectively.
NOTE 22: DERIVATIVE FINANCIAL INSTRUMENTS
The Company uses derivative financial instruments for the purpose of managing its exposure to adverse fluctuations in interest and foreign currency exchange rates. While these hedging instruments are subject to fluctuations in value, such fluctuations are generally offset by the change in value of the underlying exposures being hedged.
When entering into these derivative financial instruments, it is the Company's intent to account for them under current hedge accounting guidelines . None of these instruments are entered into for trading purposes.
In certain instances, although the instruments are economic hedges of the underlying risks, they do not meet the hedge accounting criteria. In these instances, the gain or loss on the derivative financial instrument is included in earnings.
Because interest rate futures, swaptions, put options and foreign currency futures contracts are exchange traded, holders of these instruments look to the exchange for performance under these contracts and not the entity holding the offsetting futures contract, thereby minimizing the risk of nonperformance under these contracts. The Company is exposed to credit loss in the event of nonperformance by the counterparty to the interest and currency swaps and controls this risk through credit monitoring procedures. The notional principal amount does not represent the Company's exposure to credit loss.
INTEREST RATE MANAGEMENT
In managing its interest rate risk, the Company enters into interest rate swaps ("interest swaps"). Under interest swaps, the Company agrees with other parties to exchange, at specified intervals, the difference between fixed-rate and floating-rate interest amounts calculated by reference to an agreed notional amount. The terms of the interest swaps provide for the Company to receive a floating rate of interest based on the London Interbank Offered Rate ("LIBOR") and to pay fixed interest rates. The interest rates swaps are used to alter the interest rate on current LIBOR rate debt incurred to fund the Company's acquisitions of real estate, subordinate and residual securities, and securities sold under agreements to repurchase. The fair value of the interest rate swaps are not recognized in the consolidated financial statements as the swaps are accounted for on the accrual basis of accounting.
The Company is exposed to credit loss if: (i) the counterparties to the interest rate swap do not perform and (ii) the floating interest rate received by the Company exceeds the fixed interest rate paid by it. All of the counterparties have long-term debt ratings of A+ or above by Standard and Poor's and A1 or above by Moody's. Although a swap generally may not be sold or transferred without the consent of the counterparty, management does not believe that this consent would be withheld. Although none of the Company's interest rate swaps are exchange-traded, there are a number of financial institutions which enter into these types of transactions as part of their day-to-day activities.
1999 1998 1997 --------- -- ------------ ----------- Net income (loss) ....................... $ 19,8 32 $ (1,200) $ 78,932 ========= == ============ =========== Basic EPS: Weighted average shares of common stock.. 63,051,0 15 60,736,950 56,185,956 ========= == ============ =========== Basic EPS .......................... $ 0. 31 $ (0.02) $ 1.40 ========= == ============ =========== Diluted EPS: Weighted average shares of common stock.. 63,051,0 15 60,736,950 56,185,956 Effect of dilutive securities: Stock options(1) ................... 39,2 67 -- 650,528 --------- -- ------------ ----------- 63,090,2 82 60,736,950 56,836,484 ========= == ============ =========== Diluted EPS ........................ $ 0. 31 $ (0.02) $ 1.39 ========= == ============ ===========

101

OCWEN FINANCIAL CORPORATION AND SUBSIDIARIES NOTES TO CONSOLIDATED FINANCIAL STATEMENTS - (CONTI NUED)
DECEMBER 31, 1999, 1998, AND 1997 (DOLLARS AND BRITISH POUNDS IN THOUSANDS, EXCEPT SHARE DATA)
The terms of the outstanding interest swaps at December 31, 1999, are as follows. At December 31, 1998, the Company had no interest swaps outstanding.
The swaps had the effect of decreasing net interest income by $72, $115, and $198 for the years ended December 31, 1999, 1998 and 1997, respectively.
The Company also enters into short sales of U.S. Treasury interest rate futures contracts as part of its overall interest rate risk management activity. Interest rate futures contracts are commitments to either purchase or sell designated financial instruments at a future date for a specified price and may be settled in cash or through delivery. U.S. Treasury futures have been sold by the Company to economically hedge the risk of a reduction in the market value of fixed rate mortgage loans and certain fixed rate mortgage-backed and related securities available for sale in a rising interest rate environment. While qualifying for hedge accounting the gain or loss on the futures contracts are accounted for as an adjustment to the basis of the underlying hedged item. During the fourth quarter of 1999, these financial instruments ceased to qualify for hedge accounting and subsequent gains or losses are included in earnings. The terms of the outstanding interest rate futures at December 31, 1999 are as follows. At December 31, 1998, the Company had no interest rate futures contracts outstanding.
The realized gains and (losses) on these financial instruments included in earnings amounted to $208, $(5,819) and $(6,808) for the years ended December 31, 1999, 1998 and 1997, respectively.
The Company also manages its interest rate risk by purchasing European swaptions and put options to hedge anticipated future fundings related to low-income housing tax credit projects. A European swaption is an option to enter into an interest rate swap at a future date at a specific rate. A European put option allows the Company to sell a specified quantity of an asset, at a specified price at a specified date. While qualifying for hedge accounting, the gain or loss on the swaptions and put options are deferred to be accounted for as an adjustment to the basis of the underlying hedged item when it is incurred. During the fourth quarter of 1999, these financial instruments ceased to qualify for hedge accounting and gains or losses are included in earnings. The following table sets forth the terms and values of these financial instruments at December 31, 1999. The Company held no such financial instruments at December 31, 1998.
The realized gains on these financial instruments included in earnings amounted to $588 for the year ended December 31, 1999.
102
Notional LIB OR Floating Rate Maturity Amount Ind ex Fixed Rate at End of Year Fair Value --------------------------- ----------- ---- --- ---------- -------------- ---------- 2001........................ $ 75,000 1-Mo nth 6.00% 6.48% $ 482 2001........................ 17,000 1-Mo nth 6.00 6.48 108 2002........................ 8,780 1-Mo nth 6.04 6.48 129 2003........................ 100,000 1-Mo nth 5.75 6.46 2,983 ----------- ---------- $ 200,780 $ 3,702 =========== ==========
N otional Strike Amount Maturity Price Fair V alue ---- ----------- -------- ----------- --------- ------ U.S. 2-year Treasury futures............... $ 12,000 2000 $ 99.31 $ 62 U.S. 10-year Treasury futures.............. 7,000 2000 $ 95.86 116 ---- ----------- --------- ------ $ 19,000 $ 178 ==== =========== ========= ======
Notional Strike Amount Maturity Rate/Pric e Fair Value ----------- -------- --------- - ----------- European 10-year treasury swaptions................ ......... $ 7,500 2000 6.78 % $ 282 5,800 2000 6.72 % 264 2,800 2000 7.20 % 34 2,300 2000 7.11 % 63 ----------- ----------- $ 18,400 $ 643 =========== =========== European 10-year treasury put options, 4.75% due 11 /05/08... $ 2,500 2000 $ 91.45 $ 83 =========== ===========

OCWEN FINANCIAL CORPORATION AND SUBSIDIARIES NOTES TO CONSOLIDATED FINANCIAL STATEMENTS - (CONTI NUED)
DECEMBER 31, 1999, 1998, AND 1997 (DOLLARS AND BRITISH POUNDS IN THOUSANDS, EXCEPT SHARE DATA)
The fair value of the interest rate swaps, the U.S. Treasury futures and European swaptions and put options represent the estimated amount that the Company would receive or pay to terminate these agreements taking into account current interest rates. Market quotes are available for these agreements. The following table summarizes the Company's use of interest rate risk management instruments.
(1) Purchases include $48,000 of U.S. Treasury futures sold short and $200,780 of interest rate swaps acquired as a result of the OAC acquisition.
FOREIGN CURRENCY MANAGEMENT
The Company enters into foreign currency derivatives to hedge its equity investment in Kensington, its investments in foreign subsidiaries which own residual interests backed by residential loans originated in the UK ("UK residuals") and in the shopping center located in Halifax, Nova Scotia ("the Nova Scotia shopping center"). It is the Company's policy to periodically adjust the amount of foreign currency derivative contracts it has entered into in response to changes in its recorded investments in these assets.
The Company has determined that the local currency of its previously owned foreign subsidiary, Ocwen UK, its equity investment in Kensington, its investment in UK residuals and its investment in the Nova Scotia Shopping Center, is the functional currency. In accordance with SFAS No. 52, "Foreign Currency Translation," assets and liabilities of a foreign entity denominated in a foreign currency are translated into U.S. dollars at the current rate of exchange existing at the statement of financial condition date and revenues and expenses are translated at average monthly rates. The Company's foreign currency derivative financial instruments qualify for hedge accounting. Accordingly, the gains or losses are included in the net unrealized foreign currency translation in accumulated other comprehensive income in stockholders' equity.
As a result of the acquisition of OAC, the Company acquired foreign currency futures contracts ("currency futures") that hedge the currency exposure related to the acquired investments in foreign subsidiaries which own UK residuals and the Nova Scotia shopping center. Currency futures are commitments to either purchase or sell foreign currency at a future date for a specified price.
The Company entered into a foreign currency swap agreement ("currency swap") with a AAA-rated counterparty to hedge its equity investment in Kensington. Under the terms of the currency swap, the Company will swap (pound)27,500 for $43,546 in five years based on the exchange rate on the date the contract became effective.
In addition, during 1998 the Company sold short currency futures to further hedge its foreign currency exposure related to its equity investment in Kensington. These currency futures were closed during January 1999.
Prior to the sale of Ocwen UK, the Company sold short foreign currency futures contracts ("currency futures") to hedge its foreign currency exposure related to its investment in Ocwen UK. Periodically, the Company adjusted the amount of currency futures contracts it had entered into in response to changes in its investment in Ocwen UK. In connection with the sale of Ocwen UK, the currency futures were closed in October 1999.
103
Notional Amount ------ --------------------------------------------------- ------------------------- Sho rt U.S. Treasury Eurod ollar Futures Interest European T reasury European Treasury Swa ps Sold Short Rate Swaps Swapti ons Put Options ------ ------ ------------- ------------ ---------- ------- ----------------- BALANCE, DECEMBER 31, 1997 $ 36,860 $ 194,500 $ -- $ -- $ -- Purchases................................. -- 440,500 -- -- -- Maturities................................ ( 36,860) -- -- -- -- Terminations.............................. -- (635,000) -- -- -- ------ ------ ------------- ------------ ------- --- ---------- BALANCE, DECEMBER 31, 1998 -- -- -- -- -- Purchases(1).............................. -- 244,000 200,780 20, 400 13,200 Maturities................................ -- (14,000) -- (2, 000) (10,700) Terminations.............................. -- (211,000) -- -- -- ------ ------ ------------- ------------ ------- --- ---------- BALANCE, DECEMBER 31, 1999 $ -- $ 19,000 $ 200,780 $ 18, 400 $ 2,500 ====== ====== ============= ============ ======= === ==========

OCWEN FINANCIAL CORPORATION AND SUBSIDIARIES NOTES TO CONSOLIDATED FINANCIAL STATEMENTS - (CONTI NUED)
DECEMBER 31, 1999, 1998, AND 1997 (DOLLARS AND BRITISH POUNDS IN THOUSANDS, EXCEPT SHARE DATA)
The following table sets forth the terms and values of these foreign currency financial instruments at December 31, 1999 and 1998:
On January 1, 1999, eleven of the fifteen member countries of the European Union converted to a common currency (the "Euro"). Since such time transactions have been conducted using either the Euro or the countries' existing currencies. The Euro conversion had no effect on the Company's financial condition or results of operations.
NOTE 23: INCOME TAXES
Total income tax expense (benefit) was allocated as follows:
104
Notional Amount ---------------------------- Contract Unamortized Matur ity Pay Receive Rate Discount Fair Value ----- --- ------------- ---------- -------- ----------- ---------- DECEMBER 31, 1999: Currency swaps................................ 20 03 (pound)27,500 $ 43,546 1.5835 $ 1,119 $ (976) ============= ========== ========= ======== DECEMBER 31, 1998: Currency swaps................................ 20 03 (pound)27,500 $ 43,546 1.5835 $ 1,562 $ (2,096) ============= ========== ========= ========
Matur ity Notional Amount Strike Rate Fair Value ----- --- --------------- ----------- ---------- DECEMBER 31, 1999: Canadian Dollar currency futures.............. 20 00 C$ 22,100 .6786 $ (300) 20 00 1,600 .6796 (20) ------------- British Pound currency futures................ 20 00 (pound) 3,750 1.6005 65 20 00 15,875 1.6225 56 --------- $ 199 ========= DECEMBER 31, 1998: British Pound currency futures................ 19 99 (pound) 938 1.6500 $ (6) 19 99 (pound)26,563 1.6500 (181) --------- $ (187) =========
Years Ended December 31, -------------------------------- 1999 1998 1997 -------- -------- -------- Income (loss) before extraordinary gain ........... ........... $ 2,608 $(30,699) $ 21,309 Benefit of tax deduction in excess of amounts recog nized for financial reporting purposes related to e mployee stock options reflected in stockholders' equ ity ....... (8) (2,398) (1,965) Benefit of tax deduction in excess of amounts recog nized for financial reporting purposes related to dir ector restricted stock reflected in stockholders' e quity ..... (13) (13) -- -------- -------- -------- $ 2,587 $(33,110) $ 19,344 ======== ======== ========

OCWEN FINANCIAL CORPORATION AND SUBSIDIARIES NOTES TO CONSOLIDATED FINANCIAL STATEMENTS - (CONTI NUED)
DECEMBER 31, 1999, 1998, AND 1997 (DOLLARS AND BRITISH POUNDS IN THOUSANDS, EXCEPT SHARE DATA)
The components of income tax expense (benefit) attributable to income before extraordinary gain were as follows:
Income tax expense differs from the amounts computed by applying the U.S. Federal corporate income tax rate of 35% as follows:
For taxable years beginning prior to January 1, 1996, a savings institution that met certain definitional tests relating to the composition of its assets and the sources of its income (a "qualifying savings institution") was permitted to establish reserves for bad debts and make annual additions thereto under the experience method. Alternatively, a qualifying savings institution could elect, on an annual basis, to use the percentage of taxable income method to compute its allowable addition to its bad debt reserve on qualifying real property loans (generally loans secured by an interest in improved real estate). The applicable percentage was 8% for tax periods after 1987. The Bank utilized the percentage of taxable income method for these years.
On August 20, 1996, President Clinton signed the Small Business Job Protection Act (the "Act") into law. One provision of the Act repealed the reserve method of accounting for bad debts for savings institutions effective for taxable years beginning after 1995. The Bank, therefore, was required to use the specific charge-off method on its 1996 and subsequent federal income tax returns. The Bank will be required to recapture its "applicable excess reserves," which are its federal tax bad debt reserves in excess of the base year reserve amount described in the following paragraph. The Bank will include one-sixth of its applicable excess reserves in taxable income in each year from 1996 through 2001. As of December 31, 1995, the Bank had approximately $42,400 of applicable excess reserves. As of December 31, 1996, the Bank had fully provided for the tax related to this recapture.
The base year reserves will continue to be subject to recapture and the Bank could be required to recognize a tax liability if: (1) the Bank fails to qualify as a "bank" for federal income tax purposes, (2) certain distributions are made with respect to the stock of the Bank, (3) the bad debt reserves are used for any purpose other than to absorb bad debt losses, or (4) there is a change in federal tax law. The enactment of this legislation is expected to have no material impact on the Bank's or the Company's operations or financial position.
105
Years En ded December 31, ----------------- ------------------------ 1999 1998 1997 -------- -------- -------- CURRENT: Federal ....................... $ 33,930 $(11,668) $ 42,482 State ......................... 3,293 4,608 3,579 -------- -------- -------- 37,223 (7,060) 46,061 -------- -------- -------- DEFERRED: Federal ....................... (39,234) (27,443) (23,085) Foreign ....................... 5,987 5,995 -- State ......................... (1,368) (2,191) (1,667) -------- -------- -------- (34,615) (23,639) (24,752) -------- -------- -------- Total ......................... $ 2,608 $(30,699) $ 21,309 ======== ======== ========
Years Ended December 31, ------------------------------------ ------- 1999 1998 1997 ---------- ---------- --- ------- Expected income tax expense at statutory rate...... ............ $ 5,187 $ (11,328) $ 34,838 Differences between expected and actual tax: Excess of cost over net assets acquired, net.... ............ 1,249 19 (30) Tax effect of utilization of net operating loss. ............ -- (3,003) (906) State tax (after Federal tax benefit)........... ............ 1,251 1,571 1,243 Low-income housing tax credits.................. ............ (18,242) (17,666) (14,881) Sale of Ocwen UK................................ ............ 9,730 -- -- OAC loss not included in OCN consolidated tax gr oup......... 223 -- -- Deferred tax asset valuation allowance.......... ............ 2,500 -- -- Adjustments resulting from IRS audit............ ............ -- -- 921 Other........................................... ............ 710 (292) 124 ---------- ---------- --- ------- Actual income tax (benefit) expense........... ............ $ 2,608 $ (30,699) $ 21,309 ========== ========== === =======

OCWEN FINANCIAL CORPORATION AND SUBSIDIARIES NOTES TO CONSOLIDATED FINANCIAL STATEMENTS - (CONTI NUED)
DECEMBER 31, 1999, 1998, AND 1997 (DOLLARS AND BRITISH POUNDS IN THOUSANDS, EXCEPT SHARE DATA)
In accordance with SFAS No. 109, "Accounting for Income Taxes," a deferred tax liability has not been recognized for the tax bad debt base year reserves of the Bank. The base year reserves are generally the balance of reserves as of December 31, 1987, reduced proportionately for reductions in the Bank's loan portfolio between that date and December 31, 1995. At December 31, 1999 and 1998, the amount of those reserves was approximately $5,700. This reserve could be recognized in the future under the conditions described in the preceding paragraph.
The net deferred tax asset was comprised of the following as of:
Deferred tax assets, net of deferred fees, include tax residuals which result from the ownership of Real Estate Mortgage Investment Conduits ("REMIC"). While a tax residual is anticipated to have little or no future cash flows from the REMIC from which it has been issued, the tax residual does bear the income tax liability and benefit resulting from the annual differences between the interest paid on the debt instruments issued by the REMIC and the interest received on the mortgage loans held by the REMIC. Typically this difference generates taxable income to the Company in the first several years of the REMIC and equal amounts of tax losses thereafter, thus resulting in the deferred tax asset.
International Hotel Group ("IHG"), a wholly-owned subsidiary of IMI, and IHG's subsidiaries had at December 31, 1999, approximately $1,079 of Separate Return Limitation Year ("SRLY") net operating loss carryforwards. The SRLY net operating loss
106
December 31, -------------------- 1999 1998 --------- ------- DEFERRED TAX ASSETS: Tax residuals and deferred income on tax residua ls ..... $ 2,438 $ 5,328 State taxes .................................... ........ 2,654 2,511 Application of purchase accounting ............. ........ 1,697 127 Accrued profit sharing ......................... ........ 5,710 3,861 Accrued other liabilities ...................... ........ 365 773 Interest expense related to discount loan portfo lio .... 13,728 12,554 Valuation allowance on real estate owned ....... ........ 5,969 3,828 Gain on loan foreclosure ....................... ........ 12,308 6,246 Bad debt and allowance for loan losses ......... ........ 11,923 7,857 Impairment on securities available for sale .... ........ 69,333 16,308 Mortgage servicing rights impairment and amortiz ation .. 1,540 787 Goodwill impairment and amortization ........... ........ 84 3,521 Foreign currency exchange ...................... ........ 1,068 -- Capital loss carryforward ...................... ........ 4,160 -- Net U.S. tax benefit on undistributed foreign in come ... 3,050 -- Contingent interest income on equity participati on loans 1,757 2,673 Impairment on real estate investments .......... ........ -- 4,978 Partnership losses and low-income housing tax cr edits .. 35,896 7,113 Foreign currency translation adjustments ....... ........ 398 912 Other .......................................... ........ 13,591 2,068 --------- ------- 187,669 81,445 --------- ------- DEFERRED TAX LIABILITIES: Net U.S. tax on undistributed foreign income ... ........ -- 784 Deferred interest income on discount loan portfo lio .... 6,647 4,698 Research and development cost .................. ........ 1,823 -- Unrealized gain on securities available for sale ....... 123 7,894 Other .......................................... ........ 783 1,094 --------- ------- 9,376 14,470 --------- ------- 178,293 66,975 Deferred tax asset valuation allowance ............ ........ (41,373) -- --------- ------- Net deferred tax assets ........................... ........ $ 136,920 $66,975 ========= =======
OCWEN FINANCIAL CORPORATION AND SUBSIDIARIES NOTES TO CONSOLIDATED FINANCIAL STATEMENTS - (CONTI NUED)
DECEMBER 31, 1999, 1998, AND 1997 (DOLLARS AND BRITISH POUNDS IN THOUSANDS, EXCEPT SHARE DATA)
carryforward can only offset the future taxable income of IHG and its subsidiaries. The $1,079 operating loss carryforward will expire, if unused, in the year 2008. At December 31, 1999, the Company had tax credit carryforwards of $11.2 million related to low-income housing tax credits.
As discussed further in the following paragraphs, as of December 31, 1999, the Company had a deferred tax asset valuation allowance totaling $41,373. This allowance is comprised of $38,873 relating to built-in loss limitations arising from the acquisition of OAC, and $2,500 relating to management's evaluation of the future realization of the deferred tax asset.
Management conducts periodic evaluations to determine whether it is more likely than not that the deferred tax asset can be realized in future periods. Among the factors considered in this evaluation are estimates of future earnings, the future reversal of temporary differences and the impact of tax planning strategies that can be implemented if warranted. As a result of this evaluation, the Company included in its tax provision an increase of $2,500 to its valuation allowance.
Prior to the acquisition of OAC, OAC was a REIT for federal tax purposes and will file a REIT federal income tax return through October 20, 1999. OAC will be included in the Company's consolidated federal income tax return beginning on October 21, 1999. OAC had at October 6, 1999, approximately $131,567 of net unrealized built-in losses. Any such loss recognized within the five-year period beginning on October 7, 1999 (the "recognition period") is treated as a pre-change loss and, as such, is subject to an annual limit as to the amount which may offset the taxable income of the Company and its subsidiaries ("the IRC section 382 limitation"). A net unrealized built-in loss is an amount by which the tax basis of the corporation's assets at the time of the change in ownership exceeds the aggregate fair market value of those assets at that time. The IRC section 382 limitation is determined by multiplying the value of OAC's stock by the federal long-term tax-exempt rate and amounts to approximately $5,300. If a deduction is denied for any recognized built-in loss in any post-change year, the loss is carried forward to subsequent years under rules similar to the standard loss carryforward rules. As a result of these limitations, a corresponding deferred tax asset valuation allowance was established at acquisition date as part of purchase accounting in the amount of $38,873.
NOTE 24: EMPLOYEE BENEFIT AND COMPENSATION PLANS
The Company maintains a defined contribution plan to provide postretirement benefits to eligible employees. The Company also adopted a number of compensation plans for certain employees. These plans were designed to facilitate a pay-for-performance policy, further align the interests of officers and key employees with the interests of the Company's shareholders and assist in the attraction and retention of employees vital to the Company's long-term success. These plans are summarized below.
RETIREMENT PLAN
The Company maintains a defined contribution 401(k) plan. The Company matches 50% of each employee's contributions, limited to 2% of the employee's compensation. The Company's contributions to the 401(k) plan in the years ended December 31, 1999, 1998, and 1997, were $702, $611, and $368, respectively.
In connection with its acquisition of Berkeley Federal Savings Bank in June 1993, the Bank assumed the obligations under a noncontributory defined benefit pension plan (the "Plan") covering substantially all employees upon their eligibility under the terms of the Plan. The Plan was frozen after the plan year ended December 31, 1993, and has been fully funded.
ANNUAL INCENTIVE PLAN
In May 1998, the Company's shareholders approved the Ocwen Financial Corporate 1998 Annual Incentive Plan (the "AIP") to replace the Company's former annual incentive plan. Participation in the AIP is limited to officers and other key employees of the Company and designated subsidiaries that are selected by the AIP Committee. Performance targets are established based on the achievement of specified levels of increases in net earnings, return in equity, average net equity used or growth in assets, as well as individual participant performance targets. Awards under the AIP are based on achieving the performance targets and are paid in cash or a combination of cash and non-qualified stock options to purchase OCN's common stock. Such non-qualified stock options are granted pursuant to the Ocwen Financial Corporation Non-Qualified Stock Option Plan.
107

OCWEN FINANCIAL CORPORATION AND SUBSIDIARIES NOTES TO CONSOLIDATED FINANCIAL STATEMENTS - (CONTI NUED)
DECEMBER 31, 1999, 1998, AND 1997 (DOLLARS AND BRITISH POUNDS IN THOUSANDS, EXCEPT SHARE DATA)
Stock options awarded to key employees under the AIP (both the 1998 plan and former plan) to purchase shares of OCN common stock are summarized as follows.
Stock options awarded under the AIP prior to 1998 have a one-year vesting period. Stock options awarded under the AIP in 1998 and 1999 vest ratably over a three-year period. The difference, if any, between the fair market value of the stock at the date of grant and the exercise price is treated as compensation expense. There was no compensation for the year ended December 31, 1999 and 1998 related to options granted. Included in compensation expense for the year ended December 31, 1997 is $5,514 related to options granted.
LONG-TERM INCENTIVE PLAN
In May 1998 the Company's shareholders approved the Ocwen Financial Corporation Long-Term Incentive Plan (the "LIP"). Participation in the LIP is limited to officers and other key employees of the Company and designated subsidiaries that are selected by the LIP Administrator. The LIP provides for the grant of basis points to participants. In connection with this grant, the LIP Administrator has established a five-year performance cycle as well as Company and individual participant performance targets for such period. At the end of the performance cycle, the Company is to determine the value of the Basis Points held by each participant based on the extent to which the related performance targets are achieved and is to pay each participant their respective value in restricted common stock of the Company. The number of shares received is to be determined based on the fair market value, as defined, of the common stock on the last day of the performance cycle. The restricted stock issued to participants is to vest over a five-year period and, upon vesting, certificates representing the shares are to be held by the Company in a nonqualified irrevocable trust established by the Company for the benefit of the participant and is to be issued to participants in 20% increments in each year over a five-year pay-out period. While the shares are held by the Company, the participant is to have all the rights of a shareholder, including the right to vote except that (i) the participant will not be entitled to receive a certificate representing the shares and (ii) the shares may not be transferred, sold, assigned, pledged or otherwise encumbered. Any cash dividends paid on common stock are to be reinvested to purchase additional shares of common stock, subject to the same restrictions that apply to restricted stock. Compensation expense of $3,645 and $2,369 was recorded in 1999 and 1998, respectively, for future distributions under the Plan.
108
Optio ns Exercise Options Forfeited or O ptions Grant ed Price Exercised Repurchased V ested ------ --- ---------- --------- ------------ - ------ 1995...................................... 594, 760 $ 2.880 223,919 281,841 89,000 1995...................................... 14, 220 0.472 10,137 4,083 -- 1996...................................... 1,147, 370 11.000 174,573 395,953 5 76,844 1997...................................... 1,083, 794 20.350 -- 237,034 8 46,760 1998...................................... 80, 000 24.875 -- 80,000 -- 1998...................................... 181, 945 12.313 -- 40,206 47,246 1999...................................... 358, 858 6.250 -- -- --

OCWEN FINANCIAL CORPORATION AND SUBSIDIARIES NOTES TO CONSOLIDATED FINANCIAL STATEMENTS - (CONTI NUED)
DECEMBER 31, 1999, 1998, AND 1997 (DOLLARS AND BRITISH POUNDS IN THOUSANDS, EXCEPT SHARE DATA)
PRO FORMA EFFECT OF SFAS NO. 123
In accordance with the provisions of SFAS No. 123, the Company has retained its current accounting method for its stock-based employee compensation plans under the provisions of APB 25. However, entities continuing to apply APB 25 are required to disclose pro forma net income and earnings per share as if the fair value method of accounting for stock-based employee compensation plans as prescribed by SFAS No. 123 had been utilized. The following is a summary of the Company's pro forma information:
NOTE 25: STOCKHOLDERS' EQUITY
On October 7, 1999, as a result of the Company's acquisition of OAC, the Company issued to OAC shareholders (except for OCN or its subsidiaries) 0.71 shares of OCN stock for each outstanding share of OAC common stock, or a total of 12,371,750 shares. See Note 2.
On April 16, 1999, the Company announced that its Board of Directors authorized the repurchase of up to six million of its issued and outstanding shares of common stock. As of December 31, 1999, the Company had repurchased 4,611,700 shares at an average price of $6.61 per share.
On October 29, 1997, the Company's Board of Directors approved a 2-for-1 stock split of its issued and outstanding common stock. The stock split was effected through the distribution of authorized but unissued shares of its common stock on November 20, 1997, to holders of record of its common stock at the close of business on November 12, 1997. All references in the consolidated financial statements to the number of shares and per share amounts have been adjusted retroactively for the recapitalization and the stock splits.
On August 12, 1997, the Company completed a secondary stock offering to the public of 6,900,000 shares which resulted in net proceeds of $141,898. Effective August 1, 1997, shares of the Company's common stock began trading on the New York Stock Exchange ("NYSE") under the symbol "OCN." Upon effectiveness of the NYSE listing, the Company delisted its common stock from NASDAQ.
NOTE 26: REGULATORY REQUIREMENTS
The Financial Institutions Reform, Recovery and Enforcement Act of 1989 ("FIRREA") and the regulations promulgated thereunder established certain minimum levels of regulatory capital for savings institutions subject to OTS supervision. The Bank must follow specific capital guidelines stipulated by the OTS which involve quantitative measures of the Bank's assets, liabilities and certain off-balance sheet items. An institution that fails to comply with its regulatory capital requirements must obtain OTS
109
Years Ended December 31, --------------------- ----------------------- 1999 1998 1997 -------- --- ----- -------- Net income (loss), as reported..................... ...................... $ 19,832 $ ( 1,200) $ 78,932 Pro forma net income (loss)........................ ...................... $ 18,917 $ ( 2,638) $ 72,668 Earnings per share, as reported: Basic........................................... ...................... $ 0.31 $ (0.02) $ 1.40 Diluted......................................... ...................... $ 0.31 $ (0.02) $ 1.39 Pro forma earnings per share: Basic........................................... ...................... $ 0.30 $ (0.04) $ 1.29 Diluted......................................... ...................... $ 0.30 $ (0.04) $ 1.28 The fair value of the option grants wer e estimated using the Black-Scholes option-pricing model with the followi ng assumptions: Years Ended December 31, --------------------- ----------------------- 1999 1998 1997 -------- --- ----- -------- Expected dividend yield............................ ...................... 0.00% 0.00% 0.00% Expected stock price volatility.................... ...................... 47.00% 57.00% 48.00% Risk-free interest rate............................ ...................... 6.34% 4.54% 5.71% Expected life of options........................... ...................... 5 years 5 years 5 years

OCWEN FINANCIAL CORPORATION AND SUBSIDIARIES NOTES TO CONSOLIDATED FINANCIAL STATEMENTS - (CONTI NUED)
DECEMBER 31, 1999, 1998, AND 1997 (DOLLARS AND BRITISH POUNDS IN THOUSANDS, EXCEPT SHARE DATA)
approval of a capital plan and can be subject to a capital directive and certain restrictions on its operations. At December 31, 1999, the minimum regulatory capital requirements were:
o Tangible and core capital of 1.50 percent and 3.00 percent of total adjusted assets, respectively, consisting principally of stockholders' equity, but excluding most intangible assets, such as goodwill and any net unrealized gains or losses on debt securities available for sale.
o Risk-based capital consisting of core capital plus certain subordinated debt and other capital instruments and, subject to certain limitations, general valuation allowances on loans receivable, equal to 8.00 percent of the value of risk-weighted assets.
At December 31, 1999 and 1998, the Bank was "well capitalized" under the prompt corrective action ("PCA") regulations adopted by the OTS pursuant to the Federal Deposit Insurance Corporation Improvement Act of 1991 ("FDICIA"). To be categorized as "well capitalized," the Bank must maintain minimum core capital, Tier 1 risk-based capital and risk-based capital ratios as set forth in the following table. The Bank's capital amounts and classification are subject to review by federal regulators about components, risk-weightings and other factors. There are no conditions or events since December 31, 1999 that management believes have changed the institution's category.
Following an examination by the OTS in late 1996 and early 1997, the Bank committed to the OTS to maintain a core capital (leverage) ratio and a total risk-based capital ratio of at least 9% and 13%, respectively. The Bank continues to be in compliance with this commitment as well as the regulatory capital requirements of general applicability (as indicated below). Based on discussions with the OTS, the Bank believes that this commitment does not affect its status as a "well-capitalized" institution, assuming the Bank's continued compliance with the regulatory capital requirements required to be maintained by it pursuant to such commitment.
The following tables summarize the Bank's actual and required regulatory capital at December 31, 1999 and 1998.
110
To B e Well Capit alized Committed Minimum For Capital For Promp t Corrective Capital DECEMBER 31, 1999 Actual Adequacy Purposes Action Provisions Requirements - ------------------- ------------------- --------- ------------ ------------ Ratio Amount Ratio Amount Ratio Amount Ratio - ----- ---------- ------ --------- ------ -------- ------- Stockholders' equity, and ratio to total assets.. 11.33% $ 261,014 Net unrealized loss on certain available for sale securities............................... 601 ---------- Non-includable subsidiary........................ (12,013) Acquired real estate............................. (4,631) Excess mortgage servicing rights................. (969) ---------- Tangible capital, and ratio to adjusted total assets........................................ 10.67% $ 244,002 1.50% $ 34,287 ========== ========= Tier 1 (core) capital, and ratio to adjusted total assets.................................. 10.67% $ 244,002 3.00% $ 68,573 5.00% $ 114,289 9.00% ========== ========= ========= Tier 1 capital, and ratio to risk-weighted assets........................................ 14.02% $ 244,002 6.00% $ 104,426 ========== ========= Allowance for loan and lease losses.............. 21,783 Subordinated debentures.......................... 67,000 ---------- Tier 2 Capital................................... 88,783 ---------- Total risk-based capital, and ratio to risk- weighted assets............................... 19.12% $ 332,785 8.00% $ 139,235 10.00% $ 174,043 13.00% ========== ========= ========= Total regulatory assets.......................... $2,302,793 ========== Adjusted total assets............................ $2,285,781 ========== Risk-weighted assets............................. $1,740,436 ==========

OCWEN FINANCIAL CORPORATION AND SUBSIDIARIES NOTES TO CONSOLIDATED FINANCIAL STATEMENTS - (CONTI NUED)
DECEMBER 31, 1999, 1998, AND 1997 (DOLLARS AND BRITISH POUNDS IN THOUSANDS, EXCEPT SHARE DATA)
The OTS has promulgated a regulation governing capital distributions. The Bank is considered to be a Tier 1 association under this regulation because it met or exceeded its fully phased-in capital requirements at December 31, 1996. A Tier 1 association that before and after a proposed capital distribution meets or exceeds its fully phased-in capital requirements may make capital distributions during any calendar year equal to the greater of (i) 100% of net income for the calendar year to date plus 50% of its "surplus capital ratio" at the beginning of the year or (ii) 75% of its net income over the most recent four-quarter period. In order to make these capital distributions, the Bank must submit written notice to the OTS 30 days in advance of making the distribution.
The OTS published amendments to its capital distribution regulation effective April 1, 1999. Under the revised regulation, the Bank is required to file either an application or a notice with the OTS at least 30 days prior to making a capital distribution. The OTS may deny the Bank's application or disapprove its notice if the OTS determines that (a) the Bank will be "undercapitalized," "significantly undercapitalized" or "critically under capitalized," as defined in the OTS capital regulations, following the capital distribution, (b) the proposed capital distribution raises safety and soundness concerns or (c) the proposed capital distribution violates a prohibition contained in any statute, regulation or agreement between the Bank and the OTS or a condition imposed on the Bank in an application or notice approved by the OTS.
In addition to these OTS regulations governing capital distributions, the indenture governing the 12% subordinated debentures the ("Debentures") due 2005 and issued by the Bank on June 12, 1995 in the original amount of $100,000, limits the declaration or payment of dividends and the purchase or redemption of common or preferred stock in the aggregate to the sum of 50% of consolidated net income and 100% of all capital contributions and proceeds from the issuance or sale (other than to a subsidiary) of common stock, since the date the Debentures were issued (see Note 19).
111
To B e Well Capit alized Committed Minimum For Capital For Promp t Corrective Capital DECEMBER 31, 1998 Actual Adequacy Purposes Action Provisions Requirements - ------------------- ------------------- --------- ------------ ------------ Ratio Amount Ratio Amount Ratio Amount Ratio - ----- ---------- ------ --------- ------ -------- ------- Stockholders' equity, and ratio to total assets 9.30% $ 241,419 Net unrealized gain on certain available for sale securities........................... (303) ---------- Non-includable subsidiary................. (6,030) Excess mortgage servicing rights............. (411) ---------- Tangible capital, and ratio to adjusted total assets.................................... 9.07% $ 234,675 1.50% $ 38,821 ========== ========= Tier 1 (core) capital, and ratio to adjusted total assets.............................. 9.07% $ 234,675 3.00% $ 77,641 5.00% $ 129,402 9.00% ========== ========= ========= Tier 1 capital, and ratio to risk-weighted assets.................................... 11.71% $ 234,675 6.00% $ 120,221 ========== ========= Allowance for loan and lease losses.......... 25,047 Subordinated debentures...................... 100,000 ---------- Tier 2 Capital............................... 125,047 ---------- Low-level recourse reduction................. (13,897) ---------- Total risk-based capital, and ratio to risk- weighted assets........................... 17.26% $ 345,825 8.00% $ 160,295 10.00% $ 200,368 13.00% ========== ========= ========= Total regulatory assets...................... $2,594,792 ========== Adjusted total assets........................ $2,588,048 ========== Risk-weighted assets......................... $2,003,684 ==========
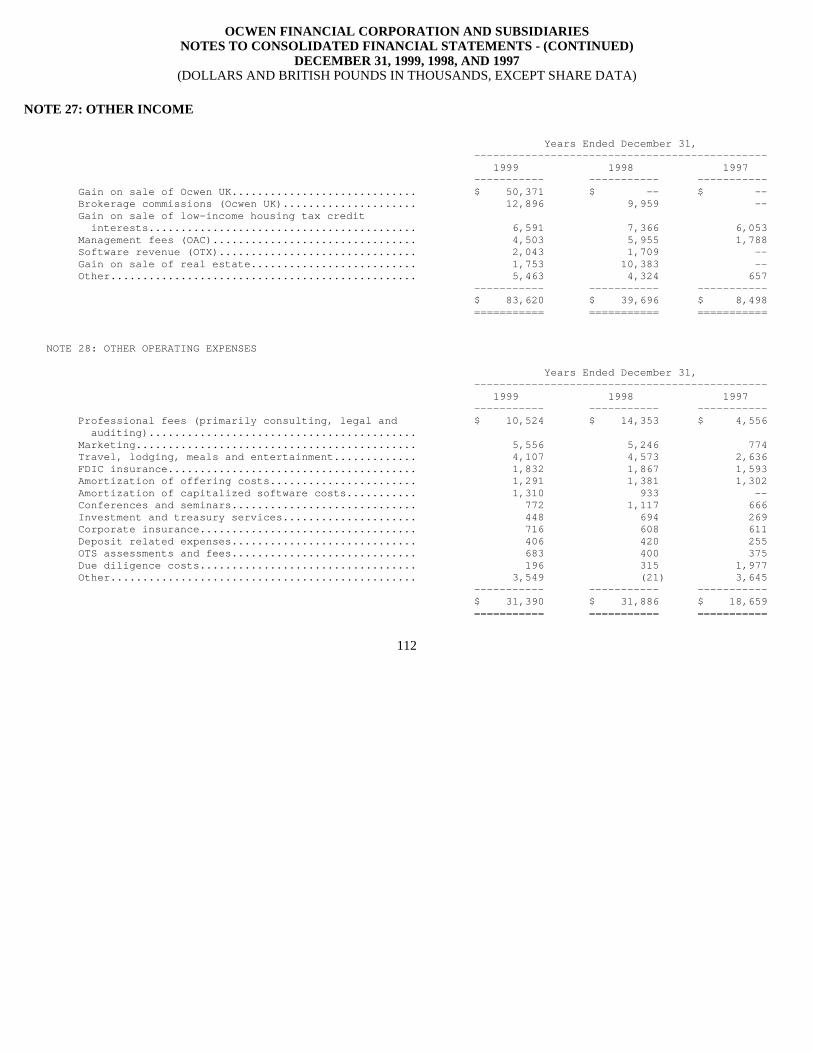
OCWEN FINANCIAL CORPORATION AND SUBSIDIARIES NOTES TO CONSOLIDATED FINANCIAL STATEMENTS - (CONTI NUED)
DECEMBER 31, 1999, 1998, AND 1997 (DOLLARS AND BRITISH POUNDS IN THOUSANDS, EXCEPT SHARE DATA)
NOTE 27: OTHER INCOME
112
Years Ended December 31, ----------------------------------- ----------- 1999 1998 1997 ----------- ----------- ----------- Gain on sale of Ocwen UK...................... ....... $ 50,371 $ -- $ -- Brokerage commissions (Ocwen UK).............. ....... 12,896 9,959 -- Gain on sale of low-income housing tax credit interests................................... ....... 6,591 7,366 6,053 Management fees (OAC)......................... ....... 4,503 5,955 1,788 Software revenue (OTX)........................ ....... 2,043 1,709 -- Gain on sale of real estate................... ....... 1,753 10,383 -- Other......................................... ....... 5,463 4,324 657 ----------- ----------- ----------- $ 83,620 $ 39,696 $ 8,498 =========== =========== =========== NOTE 28: OTHER OPERATING EXPENSES Years Ended December 31, ----------------------------------- ----------- 1999 1998 1997 ----------- ----------- ----------- Professional fees (primarily consulting, legal and $ 10,524 $ 14,353 $ 4,556 auditing)................................... ....... Marketing..................................... ....... 5,556 5,246 774 Travel, lodging, meals and entertainment...... ....... 4,107 4,573 2,636 FDIC insurance................................ ....... 1,832 1,867 1,593 Amortization of offering costs................ ....... 1,291 1,381 1,302 Amortization of capitalized software costs.... ....... 1,310 933 -- Conferences and seminars...................... ....... 772 1,117 666 Investment and treasury services.............. ....... 448 694 269 Corporate insurance........................... ....... 716 608 611 Deposit related expenses...................... ....... 406 420 255 OTS assessments and fees...................... ....... 683 400 375 Due diligence costs........................... ....... 196 315 1,977 Other......................................... ....... 3,549 (21) 3,645 ----------- ----------- ----------- $ 31,390 $ 31,886 $ 18,659 =========== =========== ===========

OCWEN FINANCIAL CORPORATION AND SUBSIDIARIES NOTES TO CONSOLIDATED FINANCIAL STATEMENTS - (CONTI NUED)
DECEMBER 31, 1999, 1998, AND 1997 (DOLLARS AND BRITISH POUNDS IN THOUSANDS, EXCEPT SHARE DATA)
NOTE 29: BUSINESS SEGMENT REPORTING
SFAS No. 131 requires public enterprises to report financial and descriptive information about its reportable operating segments. Operating segments are defined as components of an enterprise that (a) engages in business activities from which it may earn revenues and incur expenses, (b) whose operating results are regularly reviewed by the enterprise's chief operating decision maker to make decisions about resources to be allocated to the segment and assess its performance, and (c) for which discrete financial information is available. An operating segment may engage in business activities for which it has yet to earn revenues. The Company conducts a variety of business activities within the following segments:
113
Net Interest Non-Interest Non-Interest Net (Loss) Total Income Income Expense Income Assets --------- --------- --------- --------- ---------- DECEMBER 31, 1999 Discount loans: Single family residential loans.................. .... $ 25,189 $ (12,552) $ 15,989 $ (10,996) $ 596,400 Commercial real estate loans..................... .... 37,432 16,377 20,448 14,747 841,307 --------- --------- --------- --------- ---------- 62,621 3,825 36,437 3,751 1,437,707 Domestic residential mortgage loan servicing....... .... 5,630 58,976 42,626 12,939 219,188 Investment in low-income housing tax credits....... .... (10,472) 10,013 12,364 8,960 185,346 Commercial real estate lending..................... .... 10,675 211 3,190 5,630 13,580 UK operations...................................... .... 21,964 85,097 36,691 36,429 34,869 OTX 22 2,838 22,050 (19,190) 26,702 Domestic subprime single family residential lending .... 10,560 (27,391) 12,000 (18,234) 109,793 Investment securities.............................. .... 3,022 (1,628) 4,822 (3,874) 9,334 OAC 2,777 7,497 4,855 365 691,323 Unsecured collections.............................. .... 477 18 6,111 (4,110) 16,401 Corporate items and other.......................... .... (9,594) 6,263 14,999 (2,834) 565,070 --------- --------- --------- --------- ---------- $ 97,682 $ 145,719 $ 196,145 $ 19,832 $ 3,309,313 ========= ========= ========= ========= ===========
Net Interest Non-Interest Non-Interest Net (Lo ss) Total Income Income Expense Income Assets ------------ ------------ ------------ ------- --- ---------- DECEMBER 31, 1998 Discount loans: Single family residential loans ................ .. $ 22,761 $ 35,523 $ 17,606 $ 15, 444 661,647 Commercial real estate loans ................... .. 58,368 39,120 23,357 37, 001 748,204 ---------- ---------- ---------- ------- --- ---------- 81,129 74,643 40,963 52, 445 1,409,851 Domestic residential mortgage loan servicing ...... .. 6,604 46,751 39,946 8, 148 76,079 Investment in low-income housing tax credits ...... .. (8,246) 9,137 11,498 9, 662 200,566 Commercial real estate lending .................... .. 16,066 10,409 4,491 13, 549 74,439 UK operations ..................................... .. 12,045 48,159 41,772 12, 246 298,198 OTX ............................................... .. 5 1,711 11,335 (9, 619) 21,659 Domestic subprime single family residential lending .. 14,080 5,807 52,381 (21, 951) 158,676 Investment securities ............................. .. (214) (85,031) 5,184 (59, 281) 384,779 OAC ............................................... .. -- 5,872 7,529 (9, 750) 43,216 Unsecured collections ............................. .. 75 -- 2,130 (1, 036) 8,254 Corporate items and other ......................... .. 1,257 (4,275) 11,033 4, 387 651,391 ---------- ---------- ---------- ------- --- ---------- $ 122,801 $ 113,183 $ 228,262 $ (1,2 00) 3,327,108 ========== ========== ========== ======= === ==========

OCWEN FINANCIAL CORPORATION AND SUBSIDIARIES NOTES TO CONSOLIDATED FINANCIAL STATEMENTS - (CONTI NUED)
DECEMBER 31, 1999, 1998, AND 1997 (DOLLARS AND BRITISH POUNDS IN THOUSANDS, EXCEPT SHARE DATA)
The Company's discount loan activities include asset acquisition and resolution of single family residential, large commercial and small commercial loans and the related real estate owned. Investment in low-income housing tax credits includes the Company's investments, primarily through limited partnerships, in qualified low-income rental housing for the purpose of obtaining Federal income tax credits pursuant to Section 42 of the Code. Low-income housing tax credits and benefits of $18,242, $17,666, and $14,881 are included as credits against income tax expense for the years ended December 31, 1999, 1998, and 1997, respectively. Commercial real estate lending includes the Company's origination of multi-family and commercial real estate loans held for investment, is a business which the Company ceased in 1999. Domestic subprime single residential family lending includes the Company's acquisition and origination of single family residential loans to non-conforming borrowers, which are recorded as available for sale. In August 1999, the Company closed its domestic subprime origination business, which had been conducted primarily through OFS. Domestic residential mortgage loan servicing includes the Company's fee-for-services business of providing loan servicing, including asset management and resolution services, to third-party owners of non-performing, underperforming and subprime assets. UK operations include the Company's equity investment in Kensington, as well as the activities of the Company's previously owned subsidiary, Ocwen UK, which was sold on September 30, 1999. Ocwen UK was primarily engaged in the origination and servicing of subprime loans in the United Kingdom. OTX, which was formed in 1998, develops and markets advanced software solutions for mortgage and real estate transactions, including residential and commercial mortgage servicing systems. Investment securities includes the results of the securities portfolio, whether available for sale or investment, other than subprime residuals and subordinate interests related to the Company's securitization activities which have been included in the related business activity. OAC is a real estate investment company which has invested in several categories of real estate and related assets, including subordinate interests in commercial and residential mortgage-backed securities and distressed commercial and multi-family real properties. Unsecured collections is primarily comprised of activities related to the Company's charged-off unsecured credit card receivables, which were acquired at a discount. Corporate items and other consist primarily of individually insignificant business activities, amounts not allocated to the operating segments, distributions on the Capital Securities, transfer pricing mismatches and other general corporate expenses.
Interest income and expense have been allocated to each business segment for the investment of funds raised or funding of investments made taking into consideration the duration of such liabilities or assets. Allocations of non-interest expense generated by corporate support services were made to each business segment based upon management's estimate of time and effort spent in the respective activity. Income taxes are allocated to each business segment based on the Company's statutory tax rate, exclusive of low-income housing tax credit interests. As such, the resulting amounts represent estimates of the contribution of each business activity to the Company.
114
Net Interest Non-Interest Non-Interest Net (Loss) Total Income Income Expense Income Assets ----------- ----------- ----------- ----------- ----------- DECEMBER 31, 1997 Discount loans: Single family residential loans ................ .. $ 16,099 $ 45,768 $ 12,848 $ 25,100 $ 903,539 Commercial real estate loans ................... .. 57,630 21,575 16,788 28,398 870,465 ----------- ----------- ----------- ----------- ----------- 73,729 67,343 29,636 53,498 1,774,004 Domestic residential mortgage loan servicing ...... .. 2,718 25,021 29,163 (954) 14,334 Investment in low-income housing tax credits ...... .. (4,178) 6,113 9,241 11,300 168,567 Commercial real estate lending .................... .. 27,520 (207) 4,967 11,545 230,682 UK operations ..................................... .. -- -- -- -- -- OTX ............................................... .. -- (2) 389 (391) 5,117 Domestic subprime single family residential lending .. 7,159 18,457 24,694 1,841 224,859 Investment securities ............................. .. 4,581 5,209 2,147 2,894 344,544 OAC ............................................... .. -- 1,779 1,527 153 1,129 Unsecured collections ............................. .. -- -- 112 185 4 Corporate items and other ......................... .. 4,713 236 24,998 (1,139) 305,061 ----------- ----------- ----------- ----------- ----------- $ 116,242 $ 123,949 $ 126,874 $ 78,932 3,068,301 =========== =========== =========== =========== ===========
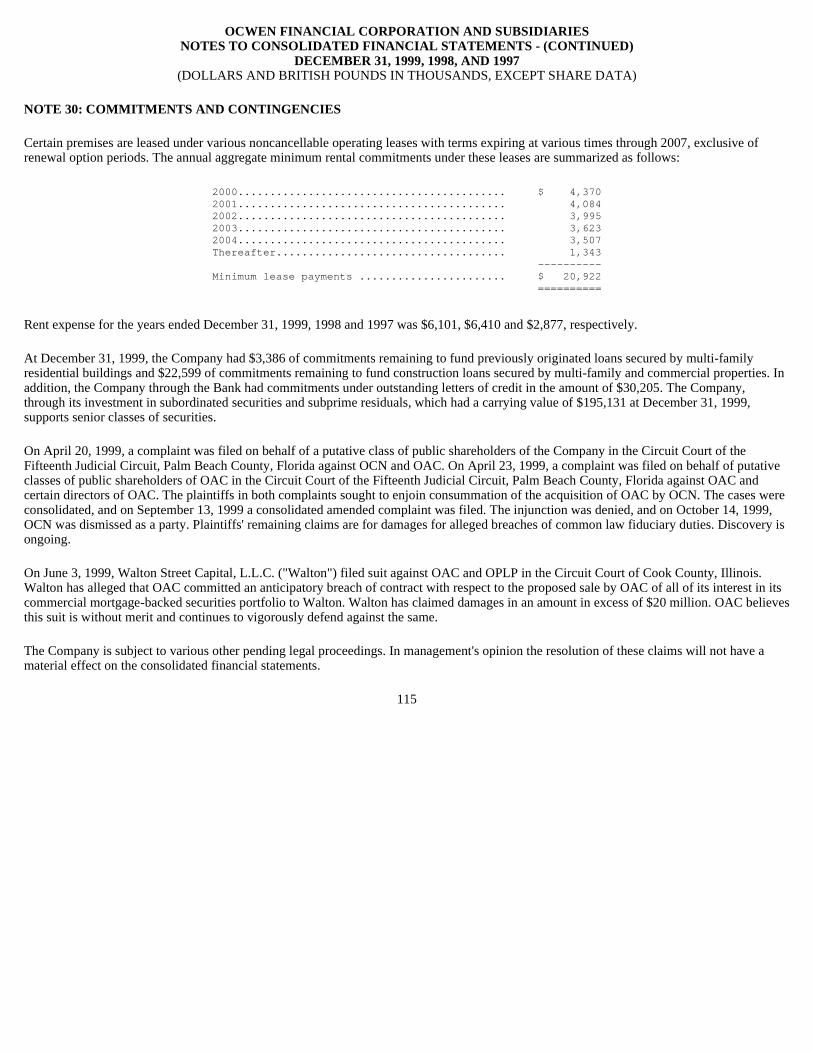
OCWEN FINANCIAL CORPORATION AND SUBSIDIARIES NOTES TO CONSOLIDATED FINANCIAL STATEMENTS - (CONTI NUED)
DECEMBER 31, 1999, 1998, AND 1997 (DOLLARS AND BRITISH POUNDS IN THOUSANDS, EXCEPT SHARE DATA)
NOTE 30: COMMITMENTS AND CONTINGENCIES
Certain premises are leased under various noncancellable operating leases with terms expiring at various times through 2007, exclusive of renewal option periods. The annual aggregate minimum rental commitments under these leases are summarized as follows:
Rent expense for the years ended December 31, 1999, 1998 and 1997 was $6,101, $6,410 and $2,877, respectively.
At December 31, 1999, the Company had $3,386 of commitments remaining to fund previously originated loans secured by multi-family residential buildings and $22,599 of commitments remaining to fund construction loans secured by multi-family and commercial properties. In addition, the Company through the Bank had commitments under outstanding letters of credit in the amount of $30,205. The Company, through its investment in subordinated securities and subprime residuals, which had a carrying value of $195,131 at December 31, 1999, supports senior classes of securities.
On April 20, 1999, a complaint was filed on behalf of a putative class of public shareholders of the Company in the Circuit Court of the Fifteenth Judicial Circuit, Palm Beach County, Florida against OCN and OAC. On April 23, 1999, a complaint was filed on behalf of putative classes of public shareholders of OAC in the Circuit Court of the Fifteenth Judicial Circuit, Palm Beach County, Florida against OAC and certain directors of OAC. The plaintiffs in both complaints sought to enjoin consummation of the acquisition of OAC by OCN. The cases were consolidated, and on September 13, 1999 a consolidated amended complaint was filed. The injunction was denied, and on October 14, 1999, OCN was dismissed as a party. Plaintiffs' remaining claims are for damages for alleged breaches of common law fiduciary duties. Discovery is ongoing.
On June 3, 1999, Walton Street Capital, L.L.C. ("Walton") filed suit against OAC and OPLP in the Circuit Court of Cook County, Illinois. Walton has alleged that OAC committed an anticipatory breach of contract with respect to the proposed sale by OAC of all of its interest in its commercial mortgage-backed securities portfolio to Walton. Walton has claimed damages in an amount in excess of $20 million. OAC believes this suit is without merit and continues to vigorously defend against the same.
The Company is subject to various other pending legal proceedings. In management's opinion the resolution of these claims will not have a material effect on the consolidated financial statements.
115
2000.......................................... $ 4,370 2001.......................................... 4,084 2002.......................................... 3,995 2003.......................................... 3,623 2004.......................................... 3,507 Thereafter.................................... 1,343 ---------- Minimum lease payments ....................... $ 20,922 ==========

OCWEN FINANCIAL CORPORATION AND SUBSIDIARIES NOTES TO CONSOLIDATED FINANCIAL STATEMENTS - (CONTI NUED)
DECEMBER 31, 1999, 1998, AND 1997 (DOLLARS AND BRITISH POUNDS IN THOUSANDS, EXCEPT SHARE DATA)
NOTE 31: PARENT COMPANY ONLY FINANCIAL INFORMATION
CONDENSED STATEMENTS OF FINANCIAL CONDITION
116
December 31, ---- ------------------------ 1999 1998 ---- ------- ----------- Assets: Cash and cash equivalents.......................... ...................................... $ 77,197 $ 32,516 Investment in bank subsidiary...................... ...................................... 247,093 230,720 Investments in non-bank subsidiaries............... ...................................... 316,708 328,179 Investment in unconsolidated entity................ ...................................... 36,216 46,586 Loan portfolio, net................................ ...................................... 405 2,484 Discount loan portfolio, net....................... ...................................... 16,397 6,876 Income taxes receivable............................ ...................................... 14,556 35,321 Deferred tax asset................................. ...................................... 44,313 19,780 Other assets....................................... ...................................... 3,483 4,945 ---- ------- ----------- $ 756,368 $ 707,407 ==== ======= =========== Liabilities and Stockholders' Equity: Notes payable...................................... ...................................... $ 228,850 $ 250,000 Other liabilities.................................. ...................................... 18,076 21,031 ---- ------- ----------- Total liabilities............................. ...................................... 246,926 271,031 Stockholders' equity............................... ...................................... 509,442 436,376 ---- ------- ----------- $ 756,368 $ 707,407 ==== ======= ===========
CONDENSED STATEMENTS OF OPERATIONS For the Years En ded December 31, ---------------------- ------------------------ 1999 1 998 1997 ----------- ---- ------- ----------- Interest income.................................... ..................... $ 2,510 $ 11,534 $ 9,416 Interest expense................................... ..................... (29,846) (33,178) (20,367) Non-interest income (loss)......................... ..................... 51,079 (3,073) (1,240) Impairment charges on securities available for sale ..................... -- (45,737) -- Non-interest expense............................... ..................... (8,760) (5,004) (3,401) Equity in (losses) earnings in unconsolidated entit ies.................. (9,154) 439 -- ----------- ---- ------- ----------- Income (loss) before income taxes and extraord inary gain........... 5,829 (68,873) (15,592) Income tax benefit................................. ..................... 3,990 42,942 5,083 ----------- ---- ------- ----------- Income (loss) before equity in net income of s ubsidiaries and ..... extraordinary gain................................. ..................... 9,819 (25,931) (10,509) Equity in net income of bank subsidiary............ ..................... 45,166 55,714 82,420 Equity in net (loss) income of non-bank subsidiarie s.................... (35,580) (30,983) 7,021 Extraordinary gain on repurchase of debt, net of ta x.................... 427 -- -- ----------- ---- ------- ----------- Net income (loss).................................. ..................... $ 19,832 $ (1,200) $ 78,932 =========== ==== ======= ===========

OCWEN FINANCIAL CORPORATION AND SUBSIDIARIES NOTES TO CONSOLIDATED FINANCIAL STATEMENTS - (CONTI NUED)
DECEMBER 31, 1999, 1998, AND 1997 (DOLLARS AND BRITISH POUNDS IN THOUSANDS, EXCEPT SHARE DATA)
CONDENSED STATEMENTS OF CASH FLOWS
117
For the Years Ended December 31, ----------------------------------- 1999 1998 1997 --------- --------- --------- Cash flows from operating activities: Net income (loss) ............................... ............. $ 19,832 $ (1,200) $ 78,932 Adjustments to reconcile net income to net cash (used) provided by operating activities: Equity in income of bank subsidiary .......... ............. (45,166) (56,124) (88,598 ) Equity in loss of non-bank subsidiaries ...... ............. 35,580 38,107 459 Equity in loss (income) of unconsolidated enti ty, net ..... 9,154 (439) -- Premium amortization, net .................... ............. (5,913) 18,383 11,467 Provision for loan losses .................... ............. 1,177 162 -- Loss on interest-earning assets .............. ............. -- 44,998 -- Gain on sale of real estate held for investmen t ........... -- (2,389) -- Gain on sale of Ocwen UK ..................... ............. (50,371) -- -- Increase in deferred tax assets .............. ............. (24,533) (13,144) (6,830 ) Decrease (increase) in other assets .......... ............. 6,982 1,151 (4,658 ) Decrease (increase) in income taxes receivable ............ 20,765 (21,582) (3,736 ) (Decrease) increase in accrued expenses, payab les and other liabilities ...................... ............. (2,955) 6,023 9,970 --------- --------- --------- Net cash (used) provided by operating activiti es .......... (35,448) 11,644 (2,994 ) --------- --------- --------- Cash flows from investing activities: Purchase of securities available for sale .... ............. -- (34,755) (146,643 ) Maturities of and principal payments received on securities available for sale ........... ............. -- 8 579 --------- --------- --------- Net distributions from bank subsidiary ....... ............. 955 96,189 37,291 Net investments in non-bank subsidiaries ..... ............. (2,799) (203,241) (87,603 ) Proceeds from sale of Ocwen UK ............... ............. 122,101 -- -- Investment in unconsolidated entity .......... ............. -- (45,886) -- Proceeds from sales of securities available fo r sale ...... -- 70,080 15,574 Principal payments received on loans held for investment .. 2,119 -- -- Principal payments received on discount loans ............. 17,596 -- -- Purchase of securities held for investment ... ............. -- -- (11,115 ) Proceeds from sales of securities held for inv estment ..... -- 13,025 -- Purchase of discount loans ................... ............. (8,788) (2,557) (48,413 ) Proceeds from sales of loans held for investme nt .......... -- 53,949 5,080 Proceeds from real estate held for investment ............. -- 13,064 -- Purchase of real estate held for investment .. ............. -- -- (995 ) --------- --------- --------- Net cash provided (used) by financing activiti es .......... 131,184 (40,124) (236,245 ) --------- --------- --------- Cash flows from financing activities: (Repurchase) issuance of notes and debentures ............. (21,150) -- 120,738 Increase (decrease) in securities sold under agreements to repurchase ................... ............. -- (3,075) 3,075 Repayments of loans to executive officers, net ............ 763 -- 3,832 Exercise of common stock options ............. ............. 23 7,931 3,037 Issuance of shares of communion stock ........ ............. -- 7,828 142,003 Repurchase of common stock options ........... ............. -- (6,502) (3,208 ) Repurchase of common stock ................... ............. (30,691) (7,772) -- --------- --------- --------- Net cash (used) provided by investing activities .. ............. (51,055) (1,590) 269,477 --------- --------- --------- Net increase (decrease) in cash and cash equivalent s ........... 44,681 (30,070) 30,238 Cash and cash equivalents at beginning of year .... ............. 32,516 62,586 32,348 --------- --------- --------- Cash and cash equivalents at end of year .......... ............. $ 77,197 $ 32,516 $ 62,586 ========= ========= =========

OCWEN FINANCIAL CORPORATION AND SUBSIDIARIES NOTES TO CONSOLIDATED FINANCIAL STATEMENTS - (CONTI NUED)
DECEMBER 31, 1999, 1998, AND 1997 (DOLLARS AND BRITISH POUNDS IN THOUSANDS, EXCEPT SHARE DATA)
NOTE 32: QUARTERLY RESULTS OF OPERATIONS (UNAUDITED )
118
Quarters En ded ------------------------------------ ----------------------------- December 31, September 30, June 30, March 31, 1999 1999 1999 1999 ------------ ------------- ----------- ----------- Interest income.................................... ....... $ 68,124 $ 56,019 $ 63,547 $ 65,534 Interest expense................................... ....... (42,119) (36,787) (37,838) (38,798) Provision for loan losses.......................... ....... (1,522) (826) (623) (3,739) ----------- ----------- ----------- ----------- Net interest income after provision for loan los ses.... 24,483 18,406 25,086 22,997 Non-interest income................................ ....... 10,920 64,412 24,812 45,575 Non-interest expense............................... ....... (41,939) (54,298) (47,785) (52,123) Distributions on Capital Securities................ ....... (2,915) (3,399) (3,398) (3,399) Equity in losses investments in unconsolidated enti ties... (3,133) (4,768) (3,470) (1,245) ----------- ----------- ----------- ----------- (Loss) income before income taxes and extraordinary gain............................ ....... (12,584) 20,353 (4,755) 11,805 Income taxes benefit (expense)..................... ....... 6,987 (8,199) 972 (2,368) Minority interest in net loss of consolidated subsidiary......................... ....... 140 369 96 33 ----------- ----------- ----------- ----------- Income (loss) before extraordinary gain............ ....... (5,457) 12,523 (3,687) 9,470 Extraordinary gain on repurchase of debt, net of ta x...... 6,730 253 -- -- ----------- ----------- ----------- ----------- Net income (loss).................................. ....... $ 1,273 $ 12,776 (3,687) $ 9,470 =========== =========== =========== ========== Earnings (loss) per share: Basic........................................... ....... $ 0.02 $ 0.21 $ (0.06) $ 0.16 =========== =========== =========== ========== Diluted......................................... ....... $ 0.02 $ 0.21 $ (0.06) $ 0.16 =========== =========== =========== ========== Quarters En ded ------------------------------------ ----------------------------- December 31, September 30, June 30, March 31, 1998 1998 1998 1998 ------------ ------------- ----------- ----------- Interest income.................................... ....... $ 66,237 $ 88,542 $ 90,891 $ 62,024 Interest expense................................... ....... (43,602) (47,859) (52,576) (40,856) Provision for loan losses.......................... ....... (4,775) (1,806) (9,675) (2,253) ----------- ----------- ----------- ----------- Net interest income after provision for loan los ses.... 17,860 38,877 28,640 18,915 Non-interest income................................ ....... 30,610 54,942 (13,750) 41,381 Non-interest expense............................... ....... (72,486) (65,516) (56,249) (34,011) Distributions on Capital Securities................ ....... (3,399) (3,398) (3,398) (3,399) Equity in (losses) earnings of investments in unconsolidated entities......................... ....... (11,443) 2,915 543 -- ----------- ----------- ----------- ----------- (Loss) income before income taxes............... ....... (38,858) 27,820 (44,214) 22,886 Income taxes benefit (expense)..................... ....... 27,811 (2,922) 6,383 (573) Minority interest in net loss (earnings) of consolidated subsidiary......................... ....... 469 33 (68) 33 ----------- ----------- ----------- ----------- Net (loss) income.................................. ....... $ (10,578) $ 24,931 $ (37,899) $ 22,346 =========== =========== =========== =========== (Loss) earnings per share: Basic........................................... ....... $ (0.17) $ 0.41 $ (0.62) $ 0.37 =========== =========== =========== ========== Diluted......................................... ....... $ (0.17) $ 0.41 $ (0.62) $ 0.36 =========== =========== =========== ==========

SHAREHOLDER INFORMATION
PRICE RANGE OF THE COMPANY'S COMMON STOCK
The Company's common stock is traded under the symbol "OCN" on the New York Stock Exchange ("NYSE"). The following table sets forth for the high and low sales prices for the common stock, as traded on the NYSE.
At the close of business on March 15, 2000, the Company's common stock price was $6.1875.
The Company does not currently pay cash dividends on common stock and has no current plans to do so in the future. In the future, the timing and amount of dividends, if any, will be determined by the Board of Directors of the Company and will depend, among other factors, upon the Company's earnings, financial condition, cash requirements, the capital requirements of the Bank and other subsidiaries and investment opportunities at the time any such payment is considered. In addition, the indentures relating to the Notes and the Junior Subordinated Debentures contain certain limitations on the payment of dividends by the Company.
As a holding company, the payment of any dividends by the Company will be significantly dependent on dividends and other payments received by the Company from its subsidiaries, including the Bank. For a description of limitations on the ability of the Company to pay dividends on the common stock and on the ability of the Bank to pay dividends on its capital stock to the Company, see Notes 19, 20 and 26 to the Consolidated Financial Statements.
NUMBER OF HOLDERS OF COMMON STOCK
At March 9, 2000, 67,733,475 shares of Company common stock were outstanding and held by approximately 1,315 holders of record. Such number of stockholders does not reflect the number of individuals or institutional investors holding stock in nominee name through banks, brokerage firms and others.
119
High Low - ----------- ------------ 1998: First quarter.................................. $ 30.7500 $ 22.2500 Second quarter................................. 28.3750 22.3125 Third quarter.................................. 27.8750 8.5000 Fourth quarter................................. 16.1875 5.6875 1999: First quarter.................................. $ 11.8750 $ 7.6875 Second quarter................................. 9.5625 7.5000 Third quarter.................................. 8.4375 5.8125 Fourth quarter................................. 7.4375 5.5625

EXHIBIT 21.0
SUBSIDIARIES OF OCWEN FINANCIAL CORPORATION
27
Name State of Organization ---- ----- ---------------- Ocwen Federal Bank FSB New Jersey Ocwen Partnership, L.P. Virginia Ocwen Asset Investment Corp. Florida Ocwen Limited, Inc. Virginia Investors Mortgage Insurance Holding Company Delaware Ocwen Financial Services, Inc. Florida Ocwen Capital Trust I Delaware OAIC Mortgage Residential Securities Holdings, LLC Delaware OAIC Bush Street, LLC Delaware OAIC Mortgage Holdings, LLC Delaware Ocwen Asset Investment - UK, LLC Delaware NHP Affordable Housing Partners, L.P. Pennsylvania OAIC Jacksonville, LLC Delaware OAIC California Partnership, L.P. California First Service Corporation Delaware Ocwen Technology Xchange, Inc. Florida

EXHIBIT 23.0
CONSENT OF INDEPENDENT CERTIFIED PUBLIC ACCOUNTANTS
We hereby consent to the incorporation by reference in the Registration Statement on Form S-8 filed on January 27, 1998 (Registration No. 333-44999), Registration Statement on Form S-8 filed on August 25, 1998 (Registration No. 333-62217) and Registration Statement on Form S-3 filed on November 5, 1998 (Registration No. 333-64915) of Ocwen Financial Corporation of our report dated February 9, 2000 appearing on page 65 of the 1999 Annual Report to Shareholders which is incorporated by reference into this Annual Report on Form 10-K.
PricewaterhouseCoopers LLP Fort Lauderdale, Florida March 30, 2000

EXHIBIT 99.1
RISK FACTORS
Each of the factors set forth below could, directly or indirectly, affect the Company's results of operations and financial condition. Capitalized terms that are not defined herein shall have the meanings ascribed to them in the Annual Report on Form 10-K of the Company to which this Exhibit relates.
CHANGING NATURE OF RISKS; NO ASSURANCES AS TO CONSISTENCY OF EARNINGS
CHANGING NATURE OF RISKS. The Company's corporate strategy emphasizes the identification, development and management of specialized businesses which the Company believes are not accurately evaluated and priced by the marketplace due to market, economic and competitive conditions. This strategy can result in the entry into or development of businesses and investment in assets which produce substantial initial returns, which may be followed by an exit from any of those businesses or the sale of those assets if, for example, results decrease because markets become more efficient in the evaluation and pricing of such businesses and assets. For example, historically, the Company's efforts have focused on lending, the acquisition and resolution of discounted loans, and investment in various types of mortgage-related securities. However, on October 26, 1998, the Company announced that it would refocus its resources on its core competencies, namely the acquisition and management of servicing-intensive assets and the development of exportable loan serving technology for the mortgage and real estate industries. Given that this strategy involves the potential of entering and exiting different businesses, past financial performance may not be considered a reliable indicator of future performance and historical trends may not be reliable indicators of anticipated results or trends in future periods. In addition, there can be no assurance that the Company will be able to accomplish its strategic objectives as a result of changes in the nature of the Company's operations over time or that such changes will not have a material adverse effect from time to time or generally on the Company's business, financial condition or results of operations.
INCONSISTENCY OF RESULTS AND NON-RECURRING ITEMS. In addition to inconsistency in results caused by the entry or exit of businesses by the Company, the consistency of the operating results of the Company has and may continue to be significantly affected by inter-period variations in its current operations, including in respect of (i) the amount of assets acquired, particularly discounted loans; (ii) the amount of resolutions of discounted loans, particularly large multi-family residential and commercial real estate loans; (iii) the amount of multi-family residential and commercial real estate loans which mature or are prepaid, particularly loans with terms pursuant to which the Company participates in the profits of the underlying real estate; and (iv) sales by the Company of loans and/or securities acquired from the Company's securitization of loans. In addition, the Company's operating results have been significantly affected by certain non-recurring items. For example, the Company has earned significant non-interest income from gains on sales of interest-earning assets and real estate owned. Gains on sales of interest-earning assets and real estate owned generally are dependent on various factors which are not within the control of the Company, including market and economic conditions and accounting regulations. In addition, in the third quarter of 1999, the Company decided to discontinue the practice of structuring securitizations as sales transactions, thus precluding recognition of gain-on-sale accounting. There can be no assurance that the level of gains on sales of interest-earning assets and real estate owned reported by the Company in prior periods will be repeated in future periods or that there will not be substantial inter-period variations in the results from such activities or as a result of other non-recurring items.
RISKS RELATED TO NON-TRADITIONAL OPERATING ACTIVITI ES
As discussed below, the Company is engaged in a variety of businesses which generally involve more uncertainties and risks than the single-family residential lending activities historically emphasized by savings institutions. In addition, many of the Company's business activities, including its lending activities, are conducted on a nationwide basis, which reduces the risks associated with concentration in any one particular market area but involves other risks because, among other things, the Company may not be as familiar with market conditions and other relevant factors as it would be in the case of activities which are conducted in the market areas in which its executive offices and branch office are located.
DISCOUNTED LOAN ACQUISITION AND RESOLUTION ACTIVITIES. The Company's lending activities include the acquisition and resolution of non-performing or underperforming single-family (one to four units) residential loans, multi-family (over four units) residential loans and commercial real estate loans which are purchased at a discount. Non-performing and subperforming mortgage loans may be in default or may have a greater than normal risk of future defaults and delinquencies, as compared to newly-originated, high-quality loans of comparable type, size and geographic concentration. Returns on an investment of this type

depend on the borrower's ability to make required payments or, in the event of default, the ability of the loan's servicer to foreclose and liquidate the mortgage loan. There can be no assurance that the servicer can liquidate a defaulted mortgage loan successfully or in a timely fashion.
The Company acquires discounted loans from governmental agencies, which in the early years of the program consisted primarily of the Federal Deposit Insurance Corporation (the "FDIC") and the Resolution Trust Corporation, a federal agency formed to resolve failed savings institutions which has since ceased operations, and in recent years has consisted primarily of the U.S. Department of Housing and Urban Development. In addition to governmental agencies, the Company acquires discounted loans from various private sector sellers, such as banks, savings institutions, mortgage companies and insurance companies. Although the Company believes that a permanent market for the acquisition of non-performing and underperforming mortgage loans at a discount has emerged in recent years, there can be no assurance that the Company will be able to acquire the desired amount and type of discounted loans in future periods or that there will not be significant inter-period variations in the amount of such acquisitions. There also can be no assurance that the discount on the non-performing and underperforming loans acquired by the Company will enable the Company to resolve discounted loans in the future as profitably as in prior periods. Adverse changes in national economic conditions or in the economic conditions in regions in which the Company acquires pools of loans could impair its ability to resolve successfully loans and could have an adverse effect on the value of those loan pools. The yield on the Company's discounted portfolio also is subject to significant inter-period variations as a result of the timing of resolutions of discounted loans, particularly multi-family residential and commercial real estate loans and non-performing single-family residential loans, interest on which is recognized on a cash basis, and the mix of the overall portfolio between performing and non-performing loans. In addition, the volume of discounted loans acquired by the Company may vary over time, thereby affecting results of operations in future periods as the quantity of loans resolved in any one time period may be affected.
MULTI-FAMILY RESIDENTIAL, COMMERCIAL REAL ESTATE AND CONSTRUCTION LENDING ACTIVITIES. The Company's lending activities have included (though to a lesser extent than in previous years) nationwide loans secured by existing commercial real estate, particularly hotels and office buildings, and existing multi-family residential real estate. In addition, from time to time the Company has originated loans for the construction of multi-family residential real estate and land acquisition and development loans (again, to a lesser extent than in previous years). Multi-family residential real estate, commercial real estate and construction lending generally are considered to involve a higher degree of risk than single-family residential lending due to a variety of factors, including generally larger loan balances, the dependency on successful completion or operation of the project for repayment, the difficulties in estimating construction costs and loan terms which often require little or no amortization of the loan over its term (typically five years) and, instead, provide for a balloon payment at stated maturity. Furthermore, mezzanine loans, which are subordinate to senior loans, and construction loans generally have higher loan-to-value ratios than conventional loans. Although the Company's borrowers generally have an equity investment of 10% to 15% of total project costs, such equity may not be sufficient to protect the Company's investment in these higher-yielding loans. There can be no assurance that any multi-family residential, commercial real estate and construction lending activities engaged in by the Company previously or in the future will not be adversely affected by these and the other risks related to such activities.
SUBPRIME FAMILY RESIDENTIAL LENDING ACTIVITIES. The Company's lending activities have also included the origination (the Company closed its domestic subprime origination business in August 1999) or purchase on a nationwide basis of single family residential loans made to borrowers who have significant equity in the properties which secure the loans but who, because of prior credit problems, the absence of a credit history or other factors, are unable or unwilling to qualify as borrowers under federal agency guidelines. These loans were offered pursuant to various programs, including programs which provide for reduced or no documentation for verifying a borrower's income and employment. Subprime loans present a higher level of risk of delinquency or default than loans made to more creditworthy borrowers, and may not be as saleable as loans which conform to the guidelines established by various federal agencies. While the Company believes that the business practices it employs enable it to reduce higher risks inherent in these loans, no assurance can be given that such practices will afford adequate protection against higher delinquencies, foreclosures or losses than anticipated, and as a result, the Company's financial condition or results of operation could be adversely affected.
ENVIRONMENTAL RISKS OF LOAN ACQUISITION AND LENDING ACTIVITIES. The Company evaluates the potential for significant environmental problems prior to acquiring or originating a loan because there is a risk for any mortgage loan, particularly a multifamily residential and commercial real estate loan, that hazardous substances or other environmentally restricted substances could be discovered on the related real estate. Through foreclosure, the Company could become the owner of the real estate that secured its loan and might be required to remove such substances from the affected properties or to engage in abatement
2

procedures at its sole cost and expense. There can be no assurance that the cost of such removal or abatement will not substantially exceed the value of the affected properties or the loans secured by such properties, that the Company would have adequate remedies against the prior owners or other responsible parties or that the Company would be able to resell the affected properties either prior to or following completion of any such removal or abatement procedures. If such environmental problems are discovered prior to foreclosure, the Company generally will not foreclose on the related loan; however, the value of such property as collateral will generally be substantially reduced, and as a result, the Company may suffer a loss upon collection of the loan.
INVESTMENTS IN LOW-INCOME HOUSING TAX CREDIT INTERESTS. The Company invests in low-income housing tax credit interests (generally limited partnerships) in order to obtain federal income tax credits which are allocated pursuant to Section 42 of the Internal Revenue Code of 1986, as amended (the "Code"). There are many uncertainties and risks associated with an investment in low-income housing tax credit interests, including the risks involved in the construction, lease-up and operation of multi-family residential real estate, the investor's ability to earn sufficient income to utilize the tax credits resulting from such investments in accordance with the requirements of the Code and the possibility of required recapture of previously-earned tax credits. In addition, there are numerous tax risks associated with tax credits resulting from potential changes to the Code. For example, the Balanced Budget Act of 1995, which was vetoed by the President of the United States in December 1995 for reasons which were unrelated to the tax credit program, generally would have established a sunset date for the affordable housing tax credit program of the Code for housing placed in service after December 31, 1997 and would have required a favorable vote by Congress to extend the credit program. Although this change would not have impacted the Company's existing investments, other potential changes in the Code, which have been discussed from time to time, could reduce the benefits associated with the Company's existing investments in low-income housing tax credit interests, including the replacement of the current graduated income taxation provisions in the Code with a "flat tax" based system and increases in the alternative minimum tax, which cannot be reduced by tax credits. Management of the Company is unable to predict whether any of the foregoing or other changes to the Code will be subject to future legislation and, if so, what the contents of such legislation will be and its effects, if any, on the Company.
INVESTMENTS IN MORTGAGE-RELATED SECURITIES. From time to time the Company invests in a variety of mortgage-related securities, such as senior, subordinate and residual interests in collateralized mortgage obligations ("CMOs"), including CMOs which have qualified as Real Estate Mortgage Investment Conduits. Some mortgage-related securities exhibit considerably more price volatility than mortgages or ordinary mortgage pass-through securities, due in part to the uncertain cash flows that result from changes in the prepayment rates of the underlying mortgages. Other mortgage-related securities, such as subordinate interests, also involve substantially more credit risk than the senior classes of the mortgage-related securities to which such interests relate and generally are not as liquid as such senior classes. The Company has generally acquired subordinate and residual interests primarily in connection with the securitization of its loans, particularly single-family residential loans to non-conforming borrowers and discounted loans, and under circumstances in which it continues to service the loans which back the related securities. The Company has sought to offset the risk of changing interest rates on certain of its mortgage-related securities by selling U.S. Treasury futures contracts and through other hedging techniques, and believes that the resulting interest-rate sensitivity profile compliments the Company's overall exposure to changes in interest rates. See "Economic Conditions" below. Although generally intended to reduce the effects of changing interest rates on the Company, investments in certain mortgage-related securities and hedging transactions could cause the Company to recognize losses depending on the terms of the instrument and the interest rate environment.
RISK OF FUTURE ADJUSTMENTS TO ALLOWANCES FOR LOSSES
The Company believes that it has established adequate allowances for losses for each of its loan portfolio and discounted loan portfolio in accordance with generally accepted accounting principles. Future additions to these allowances, in the form of provisions for losses on loans and discounted loans, may be necessary, however, due to changes in economic conditions, increases in loans and discounted loans and the performance of the Company's loan and discounted loan portfolios. In addition, the OTS, as part of its examination process, periodically reviews the Company's allowances for losses and the carrying value of its assets. As a result of OTS reviews, the Company in the past has increased its allowances for losses on loans and discounted loans and written down the carrying value of certain loans. There can be no assurance that the Company will not determine, at the request of the OTS or otherwise, to further increase its allowances for losses on loans and discounted loans or adjust the carrying value of its real estate owned or other assets. Increases in the Company's provisions for losses on loans would adversely affect the Company's results of operations.
3

RISKS RELATED TO REAL ESTATE OWNED
GENERAL. The Company's real estate owned consists almost entirely of single-family residential real estate and multi-family residential and commercial real estate acquired by foreclosure or deed-in-lieu thereof on loans in the Company's discounted loan portfolio. Generally, real estate owned properties are non-earning assets, although multi-family residential and commercial real estate owned may provide some operating income to the Company depending on the circumstances. Such operating income may be affected by problems experienced by lessees, which may weaken their financial condition and result in failure to make rental payments when due. At any time, a lessee of the Company's properties may seek the protection of bankruptcy laws, which could result in rejection and termination of the lessee's lease and thereby cause a reduction in cash flow available for distribution to the Company. Moreover, the value of real estate can be significantly affected by adverse changes in national or local economic conditions, competition from other properties offering the same or similar services, changes in interest rates and in the availability, cost and terms of mortgage funds, acts of nature, including earthquakes, hurricanes and other natural disasters, and other factors which are beyond the control of the Company. These factors may require the establishment of provisions for losses to ensure that real estate owned properties are carried at the lower of cost or fair value, less estimated costs to dispose of the properties, which may adversely affect operations. Real estate owned also requires increased allocation of resources and expense to the management and work out of the asset, property taxes and compliance with respect to environmental laws and the Americans with Disabilities Act of 1990, which can also adversely affect operations. There can be no assurance that the amount of the Company's real estate owned will not increase in the future as a result of the Company's discounted loan acquisition and resolution activities and the Company's single-family residential, multi-family residential, commercial real estate and construction lending activities.
ENVIRONMENTAL RISKS. Operating costs and the value of real property may be affected by the obligation to pay for the cost of complying with existing environmental laws, ordinances and regulations, as well as the cost of future legislation. Under various federal, state and local environmental laws, ordinances and regulations, a current or previous owner or operator of real property may be liable for the costs of removal or remediation of hazardous or toxic substances on, under or in such property. Such laws often impose liability whether or not the owner or operator knew of, or was responsible for, the presence of such hazardous or toxic substances. Therefore, an environmental liability could have a material adverse effect on the underlying value of a real property, and the revenue therefrom. Although the Company believes that its pre-acquisition due diligence identified all material environmental concerns which relate to its current investments in real estate and accurately assessed the costs and liabilities to be concurred by it in this regard, there can be no assurance that such investments will not raise material unanticipated environmental concerns or costs in the future.
RISKS ASSOCIATED WITH ACQUISITIONS AND DIVESTITURES
Acquiring businesses and assets has been and may continue to be an important focus of the Company's strategic efforts. Any acquisitions could vary in size and may include those that are large relative to the Company. There can be no assurance that suitable acquisition candidates can be identified, that financing for such acquisitions would be available on satisfactory terms, that the Company would be able to accomplish its strategic objectives as a result of any such acquisitions, that any business or assets acquired by the Company would be integrated successfully or that integration of acquired businesses would not divert management resources or otherwise have a material adverse effect on the Company's business, financial condition or results of operations. The Company is continually evaluating possible acquisitions and engages in discussions with acquisition candidates from time to time.
In addition, in the event that the Company chooses to divest any business or sell any asset in the future, there can be no assurance that a suitable purchaser could be identified, that the Company would be able to accomplish its strategic objectives as a result of any such sale, that any proposed asset or business sold by the Company would be completed or that the separation of any such asset or business from the Company would not diminish management resources or otherwise have a material adverse effect on the Company's business, financial condition or results of operations.
4

INTERNATIONAL OPERATIONS
The Company conducts business in the United States, the United Kingdom and Italy and may explore opportunities outside of these markets. The Company's foreign operations are subject to most of the same risks associated with its U.S. operations, as well as additional risks, such as unexpected changes in U.K. and European regulatory requirements, difficulties in managing international operations, potentially adverse tax consequences, enhanced accounting and control expenses and the burden of complying with foreign laws. Changes in foreign currency exchange rates may also affect the value of the Company's foreign assets and the gains realized from the sale of such assets. Although the Company implements hedging strategies to limit the effects of currency exchange rate fluctuations on the Company's results of operations, currency hedging strategies, like those for interest rates, may not perform their intended purpose. See "Economic Conditions". There can be no assurance that such factors will not have a material adverse effect on the Company's business, results of operations or financial condition. In addition, the Company's management has only limited international experience outside of the U.S. the UK and Italy, which could limit the Company's ability to capitalize on investment opportunities that may arise elsewhere.
REGULATION AND REGULATORY CAPITAL REQUIREMENTS
Both the Company, as a savings and loan holding company, and the Bank, as a federally-chartered savings institution, are subject to significant governmental supervision and regulation, which is intended primarily for the protection of depositors. Statutes and regulations affecting the Company and the Bank may be changed at any time, and the interpretation of these statutes and regulations by examining authorities also is subject to change. There can be no assurance that future changes in applicable statutes and regulations or in their interpretation will not adversely affect the business of the Company. The applicable regulatory authorities may, as a result of such regulation and examination, impose regulatory sanctions upon the Company or the Bank, as applicable, as well as various requirements or restrictions which could adversely affect their business activities. A substantial portion of the Bank's operations involves businesses that are not traditionally conducted by savings institutions and, as a result, there can be no assurance that future actions by applicable regulatory authorities, or future changes in applicable statutes or regulations, will not limit or otherwise adversely affect the Bank's ability to engage in such activities.
Following an examination of the Bank in late 1996 and early 1997 by the Office of Thrift Supervision (the "OTS"), the Bank committed to the OTS to maintain, commencing on June 30, 1997, regulatory capital ratios which significantly exceed the requirements which are generally applicable to federally-chartered savings institutions such as the Bank. Specifically, the Bank has committed to the OTS to maintain a core capital (leverage) ratio and a total risk-based capital ratio of at least 9% and 13%, respectively (the requirements of general applicability are 3% and 8%, respectively). At December 31, 1999, the Bank's core capital, Tier 1 risk-based capital and total risk-based capital ratios amounted to 10.67%, 14.02% and 19.12%, respectively. Based on discussions with the OTS, the Bank believes that this commitment does not affect its status as a "well-capitalized" institution, assuming the Bank's continued compliance with the regulatory capital requirements that it committed to maintain. Under applicable laws and regulations, an institution is considered to be "well-capitalized" if it maintains a total risk-based capital ratio of 10.0% or more, a Tier 1 risk-based capital ratio of 6.0% or more and a core capital (leverage) ratio of 5.0% or more and is not subject to a written agreement, order or directive issued by an appropriate agency to meet and maintain a specific capital level for any capital measure.
There can be no assurance that in the future the OTS either will agree to a decrease in the 9% core capital (leverage) ratio and the 13% total risk-based capital ratio committed to be maintained by the Bank or will not seek an increase in such requirements. Unless and until these regulatory capital requirements are decreased, the Bank's ability to leverage its capital through future growth in assets (including its ability to continue growing at historical rates) will be adversely affected, as will the Company's ability to receive dividends from the Bank, which are a primary source of payments on outstanding indebtedness and other expenses of the Company. Although the Company and its non-banking subsidiaries will not be restricted in their growth by these capital requirements, because they do not have access to the Bank's funding sources, their profitability may be different from the Bank's for particular types of businesses. In addition, there can be no assurance that the Bank will continue to meet the regulatory capital requirements that it has committed to maintain or that the OTS will not formally impose such requirements pursuant to a written agreement, order or directive, which would cause the Bank to cease to be a "well-capitalized" institution under applicable laws and regulations. In the event that the Bank ceased to be a "well-capitalized" institution, the Bank would be prohibited from accepting, renewing or rolling over its brokered and other wholesale deposits, which are its principal sources of funding, without the prior approval of the FDIC, and the Bank could become subject to other regulatory restrictions on its operations.
5

ECONOMIC CONDITIONS
GENERAL. The success of the Company is dependent to a certain extent upon the general economic conditions in the geographic areas in which it conducts substantial business activities. Adverse changes in national economic conditions or in the economic conditions of regions in which the Company conducts substantial business likely would impair the ability of the Company to collect on outstanding loans or dispose of real estate owned and would otherwise have an adverse effect on its business, including the demand for new loans, the ability of customers to repay loans and the value of both the collateral pledged to the Company to secure its loans and its real estate owned. Moreover, earthquakes and other natural disasters could have similar effects. Although such disasters have not significantly adversely affected the Company to date, the availability of insurance for such disasters in California, in which the Company conducts substantial business activities, is severely limited. Moreover, changes in building codes and ordinances, environmental considerations and other factors also might make it infeasible to use insurance proceeds to replace a property if it is damaged or destroyed. Under such circumstances, the insurance proceeds received by a borrower or the Company might not be adequate to restore the Company's economic position with respect to the affected collateral or real estate. At December 31, 1999, the Company had loans aggregating $177.4 million (including match funded loans and loans available for sale) secured by properties located in California and $10.6 million of the Company's real estate owned was located in California, which collectively represented 6% of the Company's total assets at such date.
EFFECTS OF CHANGES IN INTEREST RATES. The Company's operating results depend to a large extent on its net interest income, which is the difference between the interest income earned on interest-earning assets and the interest expense incurred in connection with its interest-bearing liabilities. Changes in the general level of interest rates can affect the Company's net interest income by affecting the spread between the Company's return on interest-earning assets and the Company's cost of interest-bearing liabilities, as well as, among other things, the ability of the Company to originate loans; the value of the Company's interest-earning assets and its ability to realize gains from the sale of such assets; the average life of the Company's interest-earning assets; the value of the Company's mortgage servicing rights; and the Company's ability to obtain deposits in competition with other available investment alternatives. Interest rates are highly sensitive to many factors, including governmental monetary policies, domestic and international economic and political conditions and other factors beyond the control of the Company. Although management believes that the maturities of the Company's assets are well balanced in relation to its liabilities (which involves various estimates and assumptions, including as to how changes in the general level of interest rates will impact its assets and liabilities), there can be no assurance that the profitability of the Company would not be adversely affected during any period of changing interest rates.
POTENTIAL ADVERSE EFFECTS OF HEDGING STRATEGIES. The Company may utilize a variety of financial instruments, including interest rate swaps, caps, floors and other interest rate exchange contracts, in order to limit the effects of interest rates on its operations. Among the risks inherent with respect to the purchase and/or sale of such derivative instruments are (i) interest rate risk, which consists of the risks relating to fluctuating interest rates; (ii) basis risk, which consists of the risk of loss associated with variations in the spread between the asset yield and the funding and/or hedge costs; (iii) credit or default risk, which consists of the risk of insolvency or other inability of the counterparty to a particular transaction to perform its obligations thereunder; (iv) prepayment risk, which consists of reinvestment risk to the extent the Company is not able to reinvest repayments, if any, at a yield which is comparable to the yield being generated on the particular security; (v) liquidity risk, which consists of the risk that the Company may not be able to sell a particular security at a particular price; (vi) legal enforceability risk, which consists of the risks related to Company's ability to enforce the terms of a particular instrument or to obtain or collect upon a legal judgment in the United States in the event that the counterparty to the transaction is a foreign entity or the underlying collateral is located in a foreign jurisdiction; and (vii) volatility risk, which consists of the risk that actual volatility (i.e., the degree of uncertainty relating to the price of the underlying asset) differs from the historical volatility or "implied" volatility of the instrument.
RISKS RELATED TO RELIANCE ON BROKERED AND OTHER WHO LESALE DEPOSITS
The Company currently utilizes as its principal source of funds certificates of deposit obtained through national investment banking firms which obtain funds from their customers for deposit with the Company ("brokered deposits") and, to a lesser extent, certificates of deposit obtained from customers of regional and local investment banking firms and direct solicitation efforts by the Company of institutional investors and high net worth individuals. The Company believes that the effective cost of brokered and other wholesale deposits, as well as other non-branch dependent sources of funds, such as securities sold under agreements to repurchase ("reverse repurchase agreements") and advances from the Federal Home Loan Bank ("FHLB") of New
6

York, generally is more attractive to the Company than deposits obtained through branch offices after the general and administrative costs associated with operating a branch office network are taken into account. However, such funding sources, when compared to retail deposits attracted through a branch network, are generally more sensitive to changes in interest rates and volatility in the capital markets and their availability and terms are more likely to be subject to competitive pressures. In addition, such funding sources may be more sensitive to significant changes in the financial condition of the Company. There are also regulatory limitations on an insured institution's ability to solicit and obtain brokered deposits in certain circumstances, which currently are not applicable to the Bank because of its status as a "well capitalized" institution under applicable laws and regulations. See "Regulation and Regulatory Capital Requirements" above. As a result of the Company's reliance on brokered and other wholesale deposits, significant changes in prevailing interest rates, in the availability of alternative investments for individual and institutional investors or in the Company's financial condition, among other factors, could have a much more significant affect on the Company's liquidity and results of operations than might be the case with an institution that attracted a greater portion of its funds from retail or core deposits obtained through a branch network.
RISKS ASSOCIATED WITH CURRENT SOURCES OF LIQUIDITY AND ADDITIONAL FINANCING FOR GROWTH
CURRENT SOURCES OF LIQUIDITY. The Company's primary sources of funds for liquidity consist of deposits, FHLB advances, reverse repurchase agreements, lines of credit and maturities and principal payments on loans and securities and proceeds from sales thereof. An additional significant source of asset liquidity stems from the Company's ability to securitize assets such as discount loans and subprime loans. The Company believes that its existing sources of liquidity will be adequate to fund planned activities for the foreseeable future, although there can be no assurances in this regard. Moreover, the Company continues to evaluate other sources of liquidity, such as lines of credit from unaffiliated parties, which will enhance the Company's ability to increase its liquidity position. The inability of the Company to maintain adequate sources of liquidity, including as a result of the failure to extend or replace existing lines of credit or as a result of the factors described under "Risks Related to Reliance on Brokered and Other Wholesale Deposits" above or "Risks of Securitization" below, could have a material adverse effect on the Company's business, financial condition or results of operations.
ADDITIONAL FINANCING FOR GROWTH. The Company's ability to enter into and exit from certain business lines as opportunities emerge depends to a significant degree on its ability to obtain additional indebtedness, obtain additional equity capital or have access to other sources of capital (e.g., through partnering, joint venturing or other economic or contractual relationships). The Company has no commitments for borrowings in addition to those under its current debt securities and lines of credit, no commitments for future sales of equity capital and no commitments to provide access to other sources of capital. There can be no assurance that the Company will be successful in consummating future financing transactions, if any, on terms satisfactory to the Company, if at all. Factors which could affect the Company's access to the capital markets or other economic or contractual relationships, or the conditions under which the Company could obtain additional financing, involve the perception in the capital markets and the financial services industry of the Company's business, results of operations, leverage, financial condition and business prospects. Each of these factors is to a large extent subject to economic, financial and competitive factors beyond the Company's control. In addition, covenants under the Company's current debt securities and lines of credit do, and future ones may, significantly restrict the Company's ability to incur additional indebtedness, to issue Preferred Stock and to enter into certain other contractual relationships.
RISKS ASSOCIATED WITH HOLDING COMPANY STRUCTURE
As a holding company, the ability of the Company to pay dividends, to pay indebtedness and to conduct its financial operating activities directly or in non-banking subsidiaries will depend significantly on the receipt of dividends or other distributions from the Bank, as well as any cash reserves and other liquid assets held by the Company, any proceeds from securities offerings or other borrowings and any dividends from non-banking subsidiaries of the Company. The ability of the Bank to pay dividends or make other distributions to the Company generally is dependent on the Bank's compliance with applicable regulatory capital requirements and regulatory restrictions. The Bank and OAC are also subject to contractual restrictions on their ability to pay dividends under their respective debt indentures.
The Bank's ability to make capital distributions as a Tier 1 association pursuant to the OTS capital distribution regulation are limited by the regulatory capital levels which it has committed to the OTS it would maintain, commencing on June 30, 1997. As a result of a verbal agreement between the Bank and the OTS to dividend subordinate and residual mortgage-related securities
7

resulting from securitization activities conducted by the Bank, the Bank has been limited in its ability to pay cash dividends to the Company.
In addition, the right of the Company to participate in any distribution of assets of any subsidiary, including the Bank, upon such subsidiary's liquidation or reorganization or otherwise, will be subject to the prior claims of creditors of that subsidiary, except to the extent that any claims of the Company as a creditor of such subsidiary may be recognized as such.
RISKS OF SECURITIZATION
The Company has historically generated a significant amount of revenues, earnings and cash flows from its pooling and selling through securitizations of mortgages and other loans originated or purchased by the Company. Adverse changes in the secondary market for such loans could impair the Company's ability to originate or sell mortgages and other loans on a favorable or timely basis. Accordingly, such impairments could have an adverse effect upon the Company's business and results of operations. Market and other considerations, including rating agency requirements, could also affect the timing of such transactions. Any delay in the sale of loans beyond the reporting period in which such sale is anticipated to take place may adversely affect the Company's reported earnings for such reporting period. In addition, the Company retains some degree of credit risk on substantially all loans sold. During the period of time that loans are held pending sale, the Company is at risk for loan delinquencies and defaults and the risk that the rapid increase in interest rates would result in a decline in the value of loans to potential purchasers. Following the sale of loans through a securitization, the Company's direct risk with respect to loan delinquency or default on such loan is limited to those circumstances in which it is required to repurchase such loan due to a breach of a representation or warranty in connection with the securitization.
COMPETITION
The businesses in which the Company is engaged generally are highly competitive. The acquisition of discounted loans is particularly competitive, as acquisitions of such loans are often based on competitive bidding. Although many of the Company's competitors have access to greater capital and have other advantages, the Company believes that it has a competitive advantage relative to many of its competitors as a result of its experience in managing and resolving discount loans, its investment in the computer systems, technology and other resources which are necessary to conduct this business, its reputation and the strategic relationships and contacts which it has developed in connection with these activities. The Company also encounters significant competition in connection with its other lending activities, its investment activities, its deposit-gathering activities, its servicing activities and its information technology activities. Many of the Company's competitors are significantly larger than the Company and have access to greater capital and other resources. In addition, many of the Company's competitors are not subject to the same extensive federal regulation that govern federally-insured institutions such as the Bank and their holding companies. As a result, many of the Company's competitors have advantages over the Company
IMPORTANCE OF THE CHIEF EXECUTIVE OFFICER
William C. Erbey, Chairman and Chief Executive Officer of the Company, has had, and will continue to have, a significant role in the development and management of the Company's business. The loss of his services could have an adverse effect on the Company. The Company and Mr. Erbey are not parties to an employment agreement, and the Company currently does not maintain key man life insurance relating to Mr. Erbey or any of its other officers.
CONTROL OF CURRENT SHAREHOLDERS
As of March 15, 2000, the Company's directors and executive officers and their affiliates in the aggregate beneficially owned or controlled 45.0% of the outstanding Common Stock of the Company, including 27.5% owned or controlled by William C. Erbey, Chairman and Chief Executive Officer of the Company, and 13.8% owned or controlled by Barry N. Wish, currently a director and formerly the Chairman of the Company. As a result, these shareholders, acting together, would be able effectively to decisively influence if not control virtually all matters requiring approval by the shareholders of the Company, including amendment of the Company's Articles of Incorporation, the approval of mergers or similar transactions and the election of all directors.
8

SOFTWARE PRODUCT DEVELOPMENT; TECHNOLOGICAL CHANGE
The Company's wholly-owned subsidiary, Ocwen Technology Xchange, Inc. ("OTX"), licenses the Company's mortgage loan servicing resolution and work flow technology to third parties in the mortgage and real estate industries. The products offered by OTX have resulted from the enhancement of software products acquired through the Company's purchases of Amos, Inc., a developer of residential mortgage loan servicing software, DTS Communications, Inc., a real estate technology company, and Synergy Software, LLC, a developer of commercial and multi-family mortgage servicing software, with the Company's own proprietary technology. While the Company believes it has developed products attractive to the mortgage and real estate industries, the computer software industry is subject to rapid technological change, changing customer requirements, frequent new product introductions and evolving industry standards that may render existing products and services obsolete. There can be no assurance that OTX will not experience future difficulties that could delay or prevent the successful development, introduction and marketing of its products, or that its products and product enhancements will meet the requirements of the marketplace and achieve market acceptance. If OTX is unable to develop and introduce products of acceptable quality in a timely manner in response to changing market conditions or customer requirements, the Company's business, operating results and financial condition could be adversely affected.
DEPENDENCE ON PROPRIETARY INFORMATION
The Company's success is in part dependent upon its proprietary information and technology. The Company relies on a combination of copyright, trade secret and contract protection to establish and protect its proprietary rights in its products and technology. The Company generally enters into confidentiality agreements with its management and technical staff and limits access to and distribution of its proprietary information. There can be no assurance that the steps taken by the Company in this regard will be adequate to deter misappropriation of its proprietary rights or information or independent third party development of substantially similar products and technology. Although the Company believes that its products and technology do not infringe any proprietary rights of others, the growing use of copyrights and patents to protect proprietary rights has increased the risk that third parties will increasingly assert claims of infringement in the future.
9
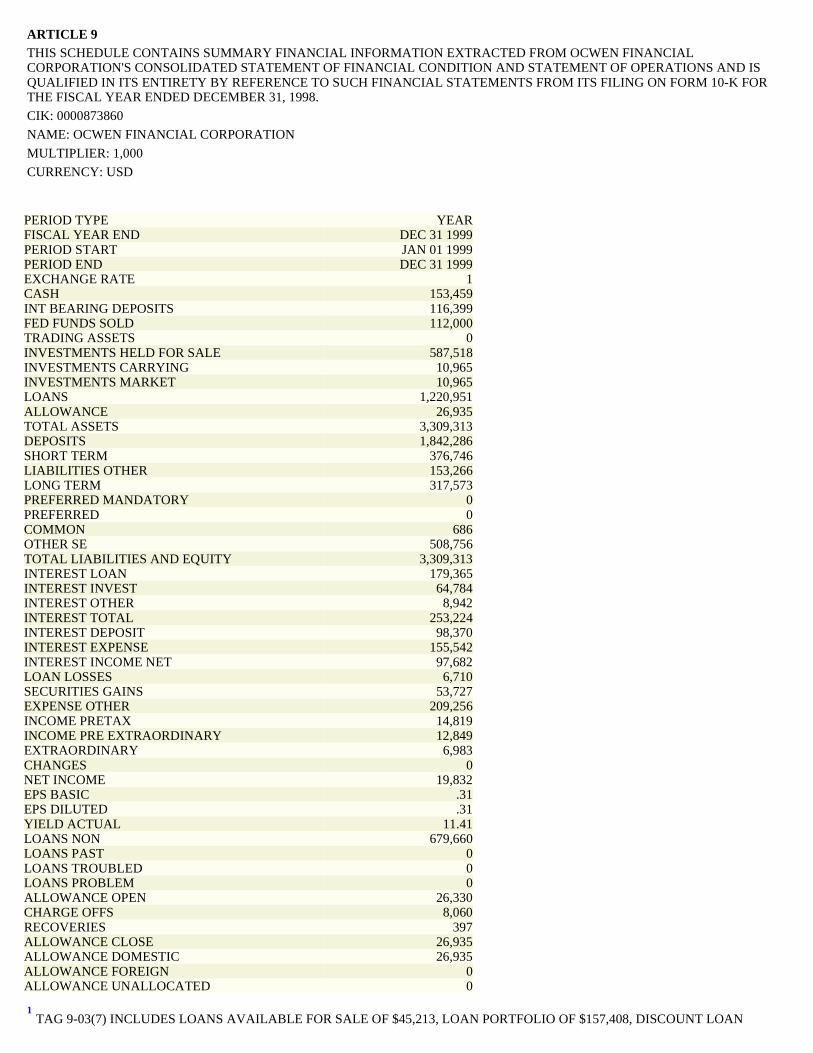
ARTICLE 9 THIS SCHEDULE CONTAINS SUMMARY FINANCIAL INFORMATION EXTRACTED FROM OCWEN FINANCIAL CORPORATION'S CONSOLIDATED STATEMENT OF FINANCIAL CONDITION AND STATEMENT OF OPERATIONS AND IS QUALIFIED IN ITS ENTIRETY BY REFERENCE TO SUCH FINANCIAL STATEMENTS FROM ITS FILING ON FORM 10-K FOR THE FISCAL YEAR ENDED DECEMBER 31, 1998.
CIK: 0000873860
NAME: OCWEN FINANCIAL CORPORATION
MULTIPLIER: 1,000
CURRENCY: USD
PERIOD TYPE YEAR FISCAL YEAR END DEC 31 1999 PERIOD START JAN 01 1999 PERIOD END DEC 31 1999 EXCHANGE RATE 1 CASH 153,459 INT BEARING DEPOSITS 116,399 FED FUNDS SOLD 112,000 TRADING ASSETS 0 INVESTMENTS HELD FOR SALE 587,518 INVESTMENTS CARRYING 10,965 INVESTMENTS MARKET 10,965 LOANS 1,220,951 ALLOWANCE 26,935 TOTAL ASSETS 3,309,313 DEPOSITS 1,842,286 SHORT TERM 376,746 LIABILITIES OTHER 153,266 LONG TERM 317,573 PREFERRED MANDATORY 0 PREFERRED 0 COMMON 686 OTHER SE 508,756 TOTAL LIABILITIES AND EQUITY 3,309,313 INTEREST LOAN 179,365 INTEREST INVEST 64,784 INTEREST OTHER 8,942 INTEREST TOTAL 253,224 INTEREST DEPOSIT 98,370 INTEREST EXPENSE 155,542 INTEREST INCOME NET 97,682 LOAN LOSSES 6,710 SECURITIES GAINS 53,727 EXPENSE OTHER 209,256 INCOME PRETAX 14,819 INCOME PRE EXTRAORDINARY 12,849 EXTRAORDINARY 6,983 CHANGES 0 NET INCOME 19,832 EPS BASIC .31 EPS DILUTED .31 YIELD ACTUAL 11.41 LOANS NON 679,660 LOANS PAST 0 LOANS TROUBLED 0 LOANS PROBLEM 0 ALLOWANCE OPEN 26,330 CHARGE OFFS 8,060 RECOVERIES 397 ALLOWANCE CLOSE 26,935 ALLOWANCE DOMESTIC 26,935 ALLOWANCE FOREIGN 0 ALLOWANCE UNALLOCATED 0
1 TAG 9-03(7) INCLUDES LOANS AVAILABLE FOR SALE OF $45,213, LOAN PORTFOLIO OF $157,408, DISCOUNT LOAN

End of Filing
© 2005 | EDGAR Online, Inc.
PORTFOLIO OF $913,229 AND MATCH FUNDED LOANS OF $105,101
2 TAG 9-03(7)(2) INCLUDES ALLOWANCE FOR LOAN LOSSES ON LOAN PORTFOLIO OF $7,259, ON THE DISCOUNT LOAN PORTFOLIO OF $19,181 AND ON MATCH FUNDED LOANS OF $495.
3 TAG 9-03(13) INCLUDES SECURITIES SOLD UNDER AGREEMENTS TO REPURCHASE OF $47,365, ON OBLIGATIONS OUTSTANDING UNDER LINES OF CREDIT OF $187,866 AND ON BONDS-MATCH FUNDED AGREEMENTS OF $141,515.
4 TAG 9-04(1) INCLUDES INTEREST INCOME ON LOANS AVAILABLE FOR SALE OF $25,724, LOAN PORTFOLIO OF $28,683, AND DISCOUNT LOANS OF $121,854 AND ON MATCH FUNDED LOANS OF $3,104.
5 TAG 9-04(14) INCLUDES NON-INTEREST EXPENSE OF $196,145, DISTRIBUTIONS ON COMPANY OBLIGATED, MANDATORILY REDEEMABLE SECURITIES OF SUBSIDIARY TRUST HOLDING SOLELY JUNIOR SUBORDINATED DEBENTURES OF THE COMPANY OF $13,111.