odeon & uci cinemas group - amazon s3 · issue of £300m 9% senior secured notes and €200m...
TRANSCRIPT

Q1 2011 Investor Presentation
21 June 2011
Odeon & UCI Finco plc
ODEON & UCI Cinemas Group
Disclaimer
DISCLAIMER
THIS DOCUMENT HAS BEEN PREPARED BY ODEON & UCI FINCO PLC (“ODEON”). BY REVIEWING THIS
DOCUMENT OR PARTICIPATING IN THE CONFERENCE CALL THAT PRESENTS IT, YOU AGREE TO BE
BOUND BY THE FOLLOWING CONDITIONS.
THIS DOCUMENT IS FOR INFORMATION PURPOSES ONLY AND DOES NOT CONSTITUTE AN OFFER TO
SELL OR THE SOLICITATION OF AN OFFER TO BUY SECURITIES IN ODEON. FURTHERMORE, IT DOES
NOT CONSTITUTE A RECOMMENDATION BY ODEON OR ANY OTHER PARTY TO SELL OR BUY
SECURITIES IN ODEON OR ANY OTHER SECURITIES. ALL WRITTEN OR ORAL FORWARD-LOOKING
STATEMENTS ATTRIBUTABLE TO ODEON OR PERSONS ACTING ON THEIR BEHALF ARE QUALIFIED
IN THEIR ENTIRETY BY THESE CAUTIONARY STATEMENTS.
Unaudited Information
This document contains financial information regarding ODEON and its fellow subsidiaries (the “Group”). Such
financial information may not have been audited, reviewed or verified by any independent accounting firm. The
inclusion of such financial information in this document or any related presentation should not be regarded as a
representation or warranty by ODEON, any of its respective affiliates, advisors or representatives or any other
person as to the accuracy or completeness of such information‟s portrayal of the financial condition or results of
operations by the Group.
Non-GAAP information
We have presented certain non-GAAP information in this document. As used in this document, this information
includes „„EBITDA‟‟, which represents earnings before interest, tax, depreciation, amortisation, exceptional
items and strategic costs. Our management believes that EBITDA is meaningful for investors because it
provides an analysis of our operating results, profitability and ability to service debt and because EBITDA is
used by our chief operating decision makers to track our business evolution, establish operational and strategic
targets and make important business decisions. In addition, we believe that EBITDA is a measure commonly
used by investors and other interested parties in our industry.
2
Forward-Looking Statements
Forward-Looking Statements
This document includes forward-looking statements. When used in this document, the words
"anticipate," "believe," "estimate," "forecast," "expect," "intend," "plan" and "project" and similar
expressions, as they relate to ODEON, its management or third parties, identify forward-looking
statements. Forward-looking statements include statements regarding ODEON‟s business strategy,
financial condition, results of operations, and market data, as well as any other statements that are not
historical facts. These statements reflect beliefs of ODEON‟s management, as well as assumptions
made by its management and information currently available to ODEON. Although ODEON believes that
these beliefs and assumptions are reasonable, the statements are subject to numerous factors, risks
and uncertainties that could cause actual outcomes and results to be materially different from those
projected. These factors, risks and uncertainties expressly qualify all subsequent oral and written
forward-looking statements attributable to ODEON or persons acting on its behalf.
3

Q1 2011 Highlights
Results are as reported in the Offering Memorandum (the “OM”) dated 13 May 2011.
EBITDA of £23.7m in Q1 was ahead of management expectations but 25% behind 2010, which was
unusually phased. However Q1 2011 was ahead of 2009 by 29% and 2008 by 77%
Strong local product in Q1 led to good attendance especially:
– The King‟s Speech (mainly in the UK)
– Che Bella Giornata (Italy)
Nevertheless attendance was lower than the unusual Q1 2010 (-9%) but higher than 2009 (5%) and
2008 (7%).
Lower 3D content than in 2010 which was driven by Avatar and Alice in Wonderland. Therefore ATP
was down 2% on 2010 but up on 2009 by 10% and 2008 by 19%
Q1 featured a high proportion of local and older-skewing product that is typically less retail-friendly and
therefore RPH was down 2% on 2010 but up on 2009 by 4% and 2008 by 6%
For these reasons, revenue of £169.0m was 10% lower than 2010 but higher on 2009 by 11% and
2008 by 18%
Gross profit margin improved because of lower film hire costs on less blockbuster product
Operating costs were controlled to an increase of less than 1% on constant estate on prior year
despite inflationary pressures, but EBITDA margin deteriorated because of the impact of fixed costs in
a lower volume quarter
4
2011 Activity Highlights to date
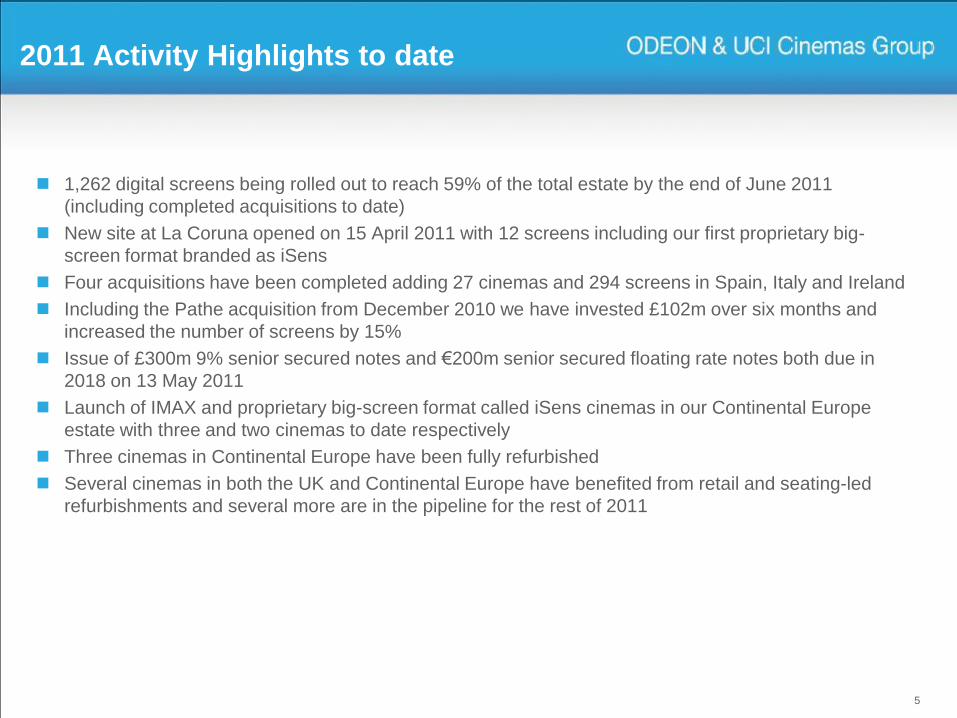
1,262 digital screens being rolled out to reach 59% of the total estate by the end of June 2011
(including completed acquisitions to date)
New site at La Coruna opened on 15 April 2011 with 12 screens including our first proprietary big-
screen format branded as iSens
Four acquisitions have been completed adding 27 cinemas and 294 screens in Spain, Italy and Ireland
Including the Pathe acquisition from December 2010 we have invested £102m over six months and
increased the number of screens by 15%
Issue of £300m 9% senior secured notes and €200m senior secured floating rate notes both due in
2018 on 13 May 2011
Launch of IMAX and proprietary big-screen format called iSens cinemas in our Continental Europe
estate with three and two cinemas to date respectively
Three cinemas in Continental Europe have been fully refurbished
Several cinemas in both the UK and Continental Europe have benefited from retail and seating-led
refurbishments and several more are in the pipeline for the rest of 2011
5
Q1 2011 KPIs (1/3)
6
0
5000
10000
15000
20000
25000
Q1 2010 Q1 2011
Other territories
Germany
Italy
Spain
UK
0
20000
40000
60000
80000
100000
120000
140000
160000
180000
200000
Q1 2010 Q1 2011
Other territories
Germany
Italy
Spain
UK
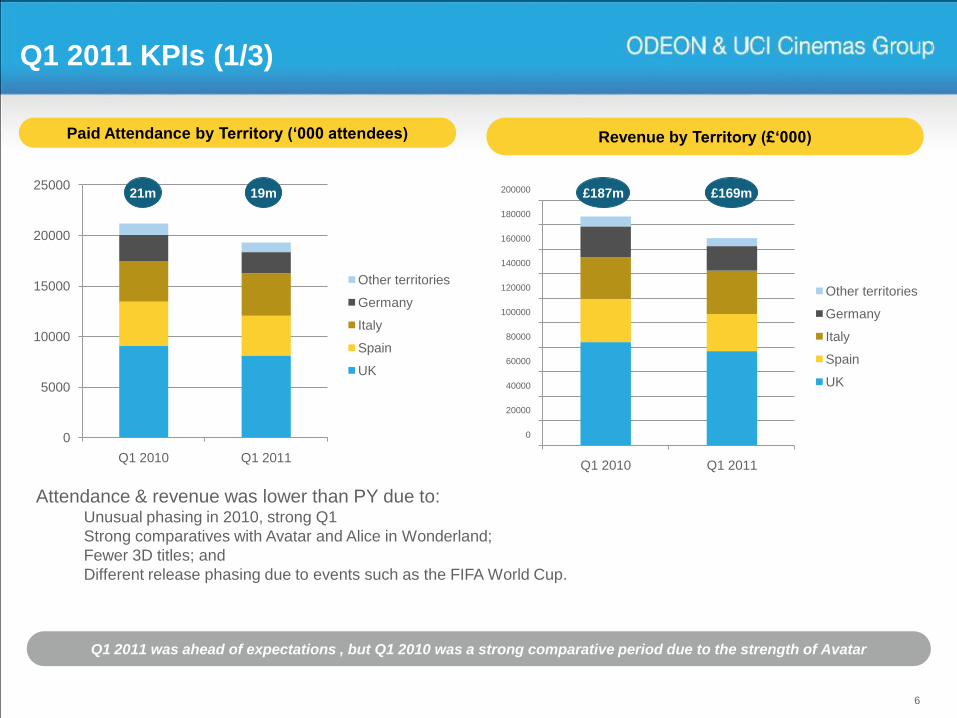
Paid Attendance by Territory („000 attendees) Revenue by Territory (£„000)
Q1 2011 was ahead of expectations , but Q1 2010 was a strong comparative period due to the strength of Avatar
Attendance & revenue was lower than PY due to:Unusual phasing in 2010, strong Q1
Strong comparatives with Avatar and Alice in Wonderland;
Fewer 3D titles; and
Different release phasing due to events such as the FIFA World Cup.
21m 19m £169m£187m

UK Top films Q1
7
Top 5 in the UK was 23% lower than 2010 but 41% higher than 2009
2011 2010 2009
Title (GBOR
„000s)
Title (GBOR
„000s)
Title (GBOR
„000s)
The King‟s Speech 44,525 Avatar 63,915 Slumdog Millionaire 30,960
Tangled 20,156 Alice in Wonderland 36,647 Bolt 17,695
Black Swan 16,047 Sherlock Holmes 17,384 Marley and Me 11,165
Gnomeo & Juliet 15,324 Alvin & The
Chipmunks
13,383 He‟s Just Not That
Into You
9,449
Paul 14,081 The Princess and
the Frog
11,028 The Curious Case
of Benjamin Button
9,048
Total 110,133 Total 142,357 Total 78,317
Variance to 2010 (23%)
Variance to 2009 41%
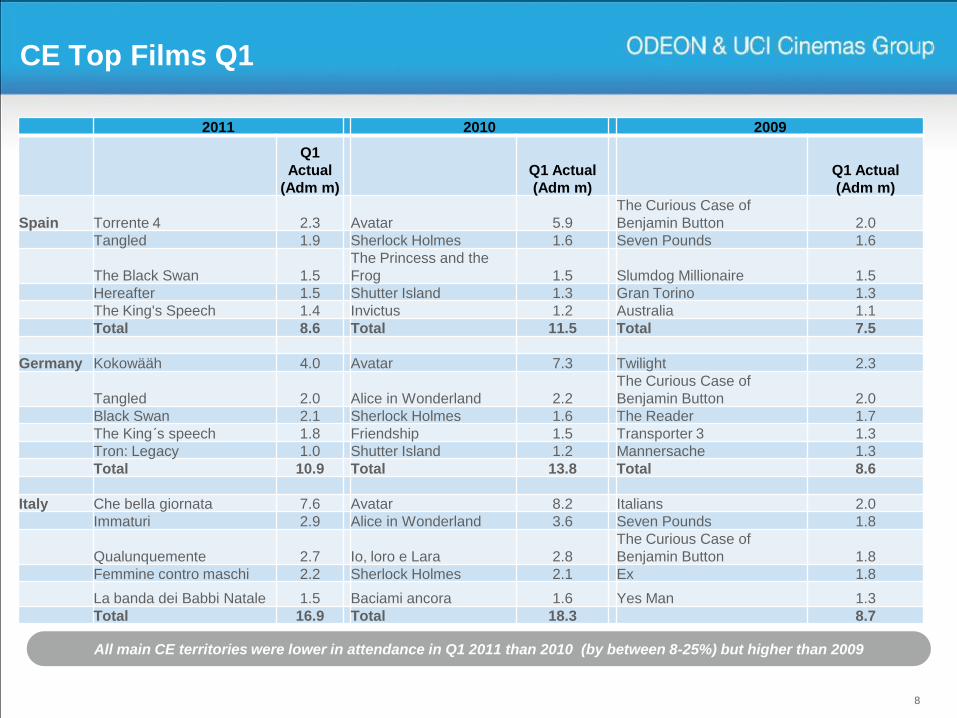
CE Top Films Q1
8
2011 2010 2009
Q1
Actual
(Adm m)
Q1 Actual
(Adm m)
Q1 Actual
(Adm m)
Spain Torrente 4 2.3 Avatar 5.9
The Curious Case of
Benjamin Button 2.0
Tangled 1.9 Sherlock Holmes 1.6 Seven Pounds 1.6
The Black Swan 1.5
The Princess and the
Frog 1.5 Slumdog Millionaire 1.5
Hereafter 1.5 Shutter Island 1.3 Gran Torino 1.3
The King's Speech 1.4 Invictus 1.2 Australia 1.1
Total 8.6 Total 11.5 Total 7.5
Germany Kokowääh 4.0 Avatar 7.3 Twilight 2.3
Tangled 2.0 Alice in Wonderland 2.2
The Curious Case of
Benjamin Button 2.0
Black Swan 2.1 Sherlock Holmes 1.6 The Reader 1.7
The King´s speech 1.8 Friendship 1.5 Transporter 3 1.3
Tron: Legacy 1.0 Shutter Island 1.2 Mannersache 1.3
Total 10.9 Total 13.8 Total 8.6
Italy Che bella giornata 7.6 Avatar 8.2 Italians 2.0
Immaturi 2.9 Alice in Wonderland 3.6 Seven Pounds 1.8
Qualunquemente 2.7 Io, loro e Lara 2.8
The Curious Case of
Benjamin Button 1.8
Femmine contro maschi 2.2 Sherlock Holmes 2.1 Ex 1.8
La banda dei Babbi Natale 1.5 Baciami ancora 1.6 Yes Man 1.3
Total 16.9 Total 18.3 8.7
All main CE territories were lower in attendance in Q1 2011 than 2010 (by between 8-25%) but higher than 2009
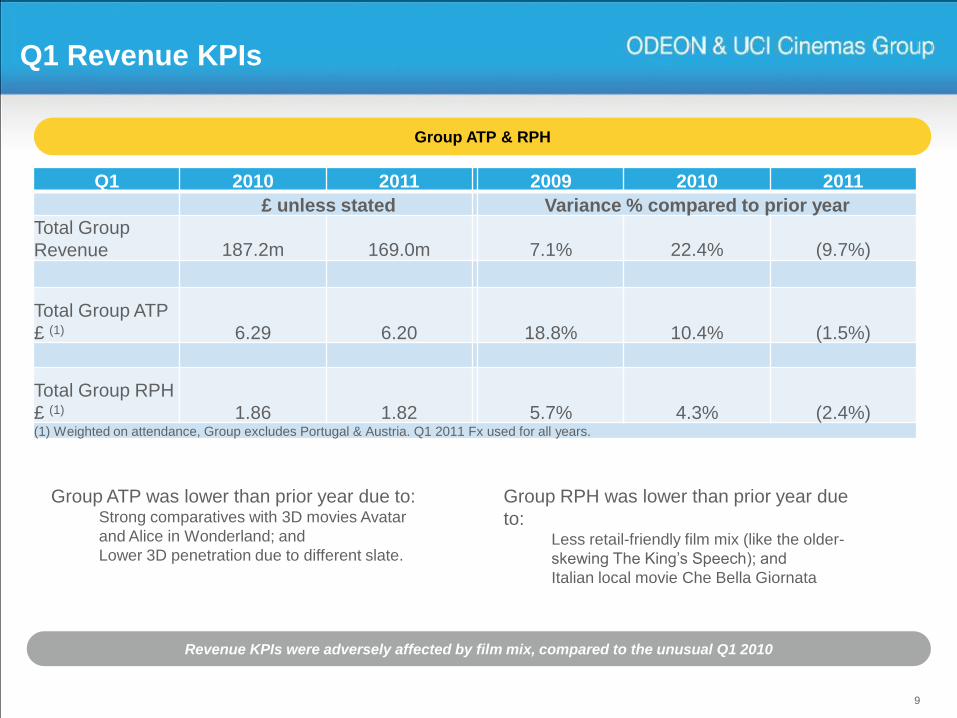
Q1 Revenue KPIs
9
Group ATP & RPH
Revenue KPIs were adversely affected by film mix, compared to the unusual Q1 2010
Group ATP was lower than prior year due to:Strong comparatives with 3D movies Avatar
and Alice in Wonderland; and
Lower 3D penetration due to different slate.
Group RPH was lower than prior year due
to:Less retail-friendly film mix (like the older-
skewing The King‟s Speech); and
Italian local movie Che Bella Giornata
Q1 2010 2011 2009 2010 2011
£ unless stated Variance % compared to prior year
Total Group
Revenue 187.2m 169.0m 7.1% 22.4% (9.7%)
Total Group ATP
£ (1) 6.29 6.20 18.8% 10.4% (1.5%)
Total Group RPH
£ (1) 1.86 1.82 5.7% 4.3% (2.4%)(1) Weighted on attendance, Group excludes Portugal & Austria. Q1 2011 Fx used for all years.

Q1 2011 Margins and Costs
10
Gross Profit Margin and EBITDA Margin analysis
Strong cost performance in the quarter, benefiting from lower film costs and good control on operating costs
Gross Profit Margin was higher than in the
prior year due to lower film hire costs due to
fewer blockbusters
EBITDA margin was lower than prior year
due to the impact of fixed costs on lower
group revenue
£m unless otherwise stated Q1 2010 Q1 2011 Variance from Q1
2010
Group revenue 187.2 169.0 (9.7%)
Cost of sales (70.2) (58.6) 16.5%
Gross Profit 117.0 110.4 5.6%
Gross Profit Margin 62.5% 65.3% 280 bps
Operating costs 85.4 86.7 1.5%
EBITDA 31.5 23.7 (25.0%)
EBITDA Margin 16.8% 14.0% (280 bps)
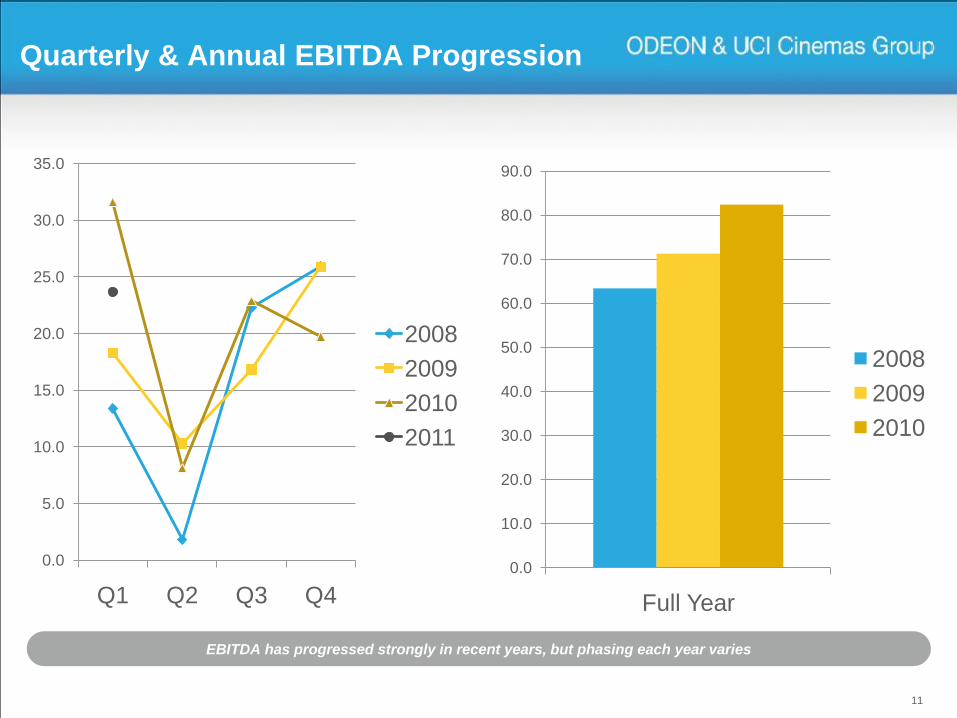
Quarterly & Annual EBITDA Progression
0.0
5.0
10.0
15.0
20.0
25.0
30.0
35.0
Q1 Q2 Q3 Q4
2008
2009
2010
2011
11
0.0
10.0
20.0
30.0
40.0
50.0
60.0
70.0
80.0
90.0
Full Year
2008
2009
2010
EBITDA has progressed strongly in recent years, but phasing each year varies
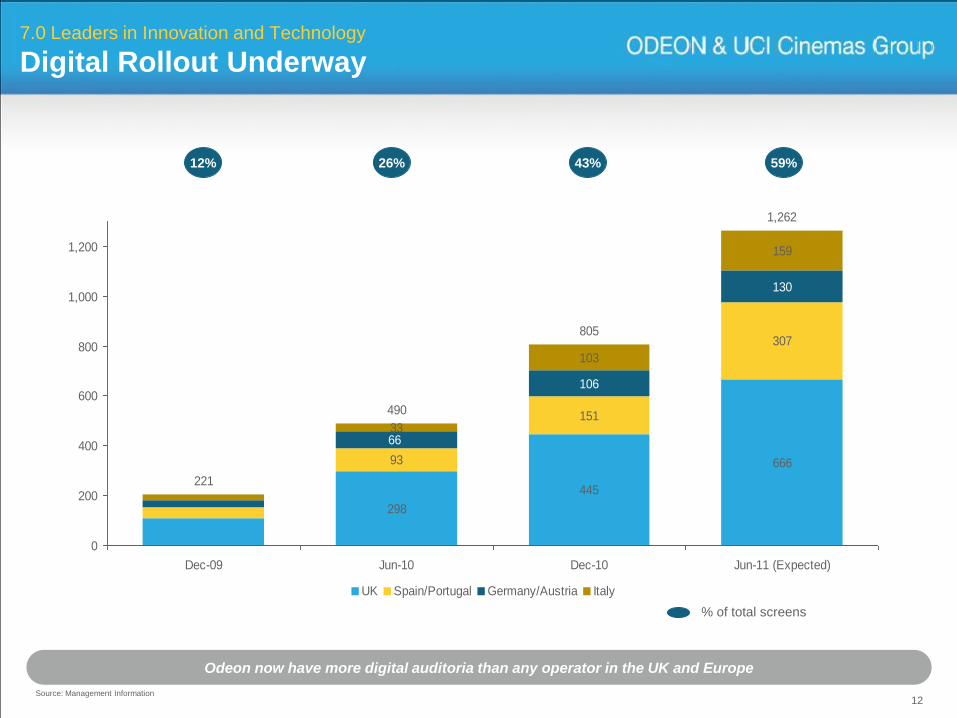
12
7.0 Leaders in Innovation and Technology
Digital Rollout Underway
Odeon now have more digital auditoria than any operator in the UK and Europe
% of total screens
Source: Management Information
298
445
66693
151
307
106
130
33
103
159
221
490
805
1,262
6629
0
200
400
600
800
1,000
1,200
Dec-09 Jun-10 Dec-10 Jun-11 (Expected)
UK Spain/Portugal Germany/Austria Italy
12% 26% 59%43%
13
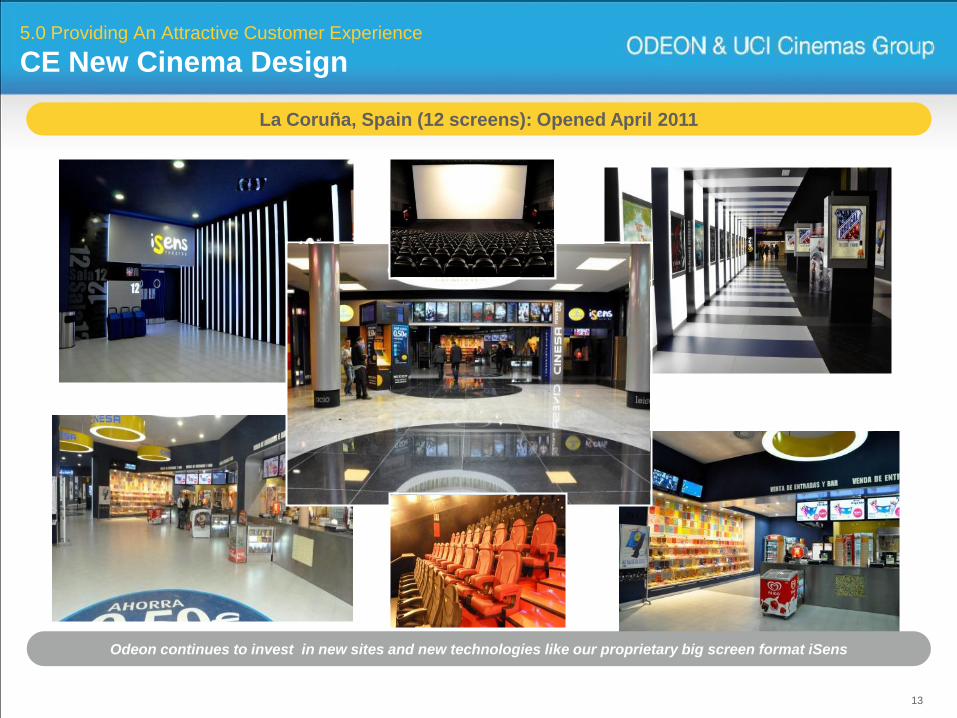
5.0 Providing An Attractive Customer Experience
CE New Cinema Design
La Coruña, Spain (12 screens): Opened April 2011
Odeon continues to invest in new sites and new technologies like our proprietary big screen format iSens
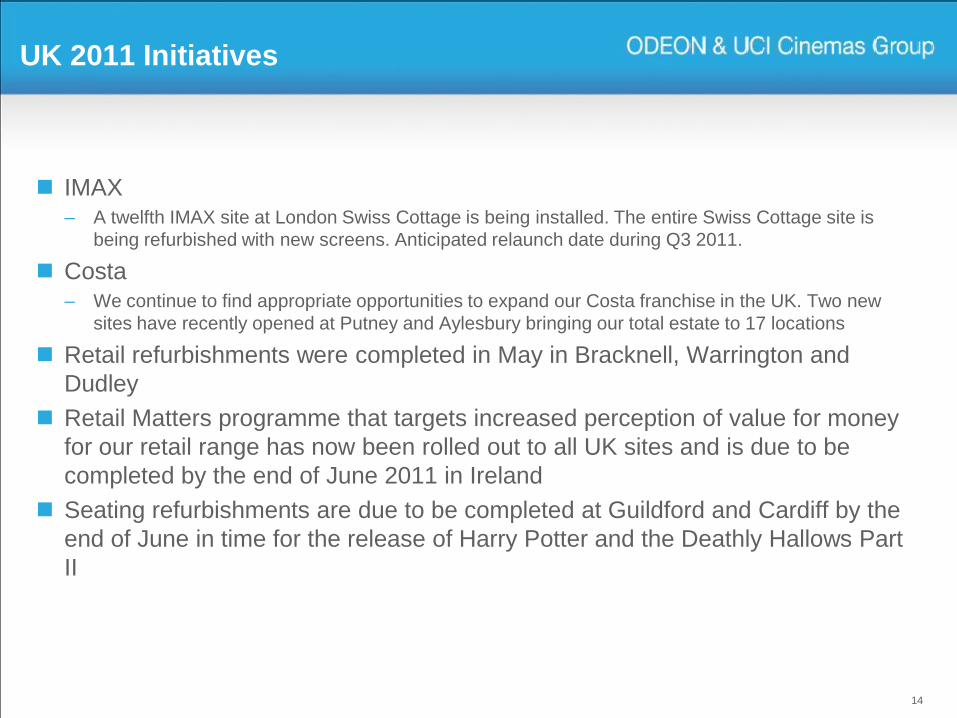
UK 2011 Initiatives
IMAX– A twelfth IMAX site at London Swiss Cottage is being installed. The entire Swiss Cottage site is
being refurbished with new screens. Anticipated relaunch date during Q3 2011.
Costa– We continue to find appropriate opportunities to expand our Costa franchise in the UK. Two new
sites have recently opened at Putney and Aylesbury bringing our total estate to 17 locations
Retail refurbishments were completed in May in Bracknell, Warrington and
Dudley
Retail Matters programme that targets increased perception of value for money
for our retail range has now been rolled out to all UK sites and is due to be
completed by the end of June 2011 in Ireland
Seating refurbishments are due to be completed at Guildford and Cardiff by the
end of June in time for the release of Harry Potter and the Deathly Hallows Part
II
14
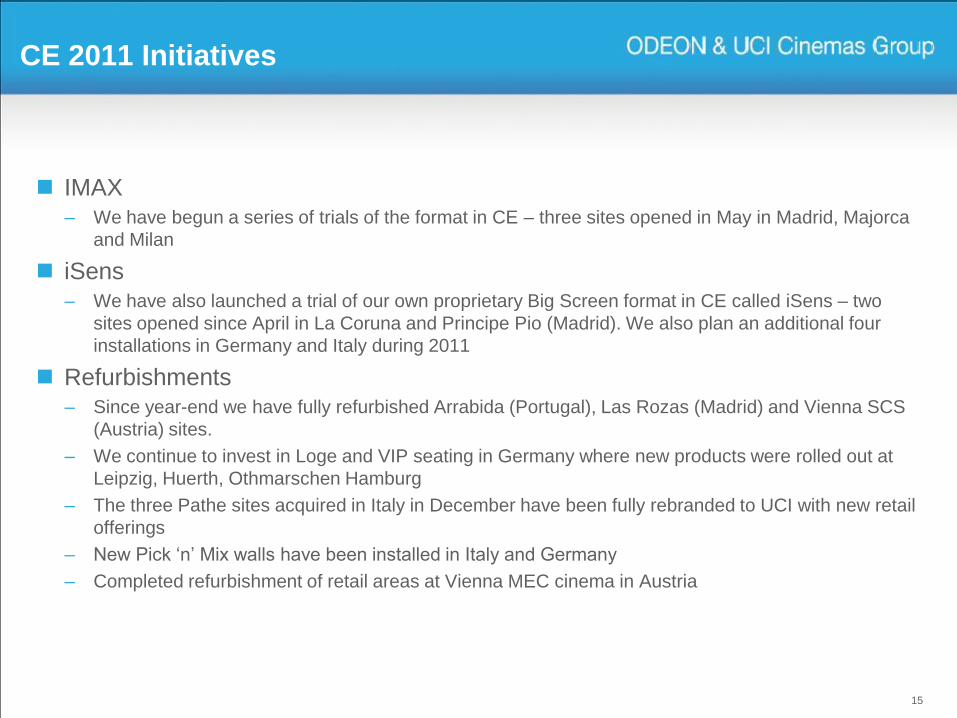
CE 2011 Initiatives
IMAX– We have begun a series of trials of the format in CE – three sites opened in May in Madrid, Majorca
and Milan
iSens– We have also launched a trial of our own proprietary Big Screen format in CE called iSens – two
sites opened since April in La Coruna and Principe Pio (Madrid). We also plan an additional four
installations in Germany and Italy during 2011
Refurbishments– Since year-end we have fully refurbished Arrabida (Portugal), Las Rozas (Madrid) and Vienna SCS
(Austria) sites.
– We continue to invest in Loge and VIP seating in Germany where new products were rolled out at
Leipzig, Huerth, Othmarschen Hamburg
– The three Pathe sites acquired in Italy in December have been fully rebranded to UCI with new retail
offerings
– New Pick „n‟ Mix walls have been installed in Italy and Germany
– Completed refurbishment of retail areas at Vienna MEC cinema in Austria
15
16
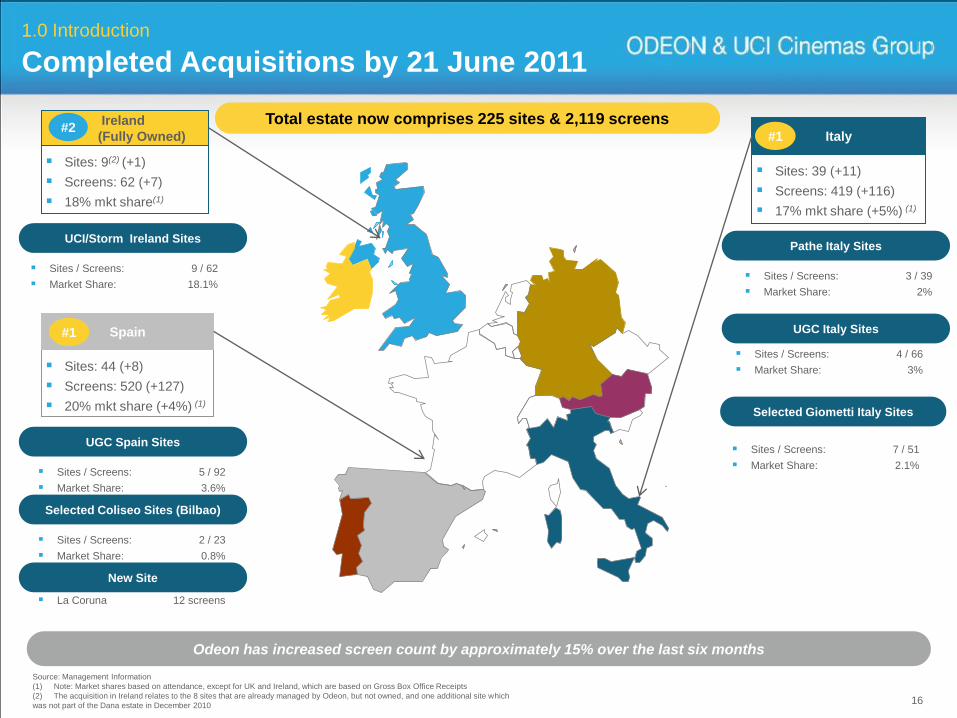
Total estate now comprises 225 sites & 2,119 screens
Source: Management Information
(1) Note: Market shares based on attendance, except for UK and Ireland, which are based on Gross Box Office Receipts
(2) The acquisition in Ireland relates to the 8 sites that are already managed by Odeon, but not owned, and one additional site which
was not part of the Dana estate in December 2010
Ireland
(Fully Owned)
Sites: 9(2) (+1)
Screens: 62 (+7)
18% mkt share(1)
#2
Sites: 44 (+8)
Screens: 520 (+127)
20% mkt share (+4%) (1)
Spain#1
Sites: 39 (+11)
Screens: 419 (+116)
17% mkt share (+5%) (1)
Italy#1
Odeon has increased screen count by approximately 15% over the last six months
1.0 Introduction
Completed Acquisitions by 21 June 2011
Sites / Screens: 9 / 62
Market Share: 18.1%
UCI/Storm Ireland Sites
Sites / Screens: 5 / 92
Market Share: 3.6%
UGC Spain Sites
Sites / Screens: 3 / 39
Market Share: 2%
Pathe Italy Sites
Sites / Screens: 4 / 66
Market Share: 3%
UGC Italy Sites
Sites / Screens: 2 / 23
Market Share: 0.8%
Selected Coliseo Sites (Bilbao)
La Coruna 12 screens
New Site
Selected Giometti Italy Sites
Sites / Screens: 7 / 51
Market Share: 2.1%
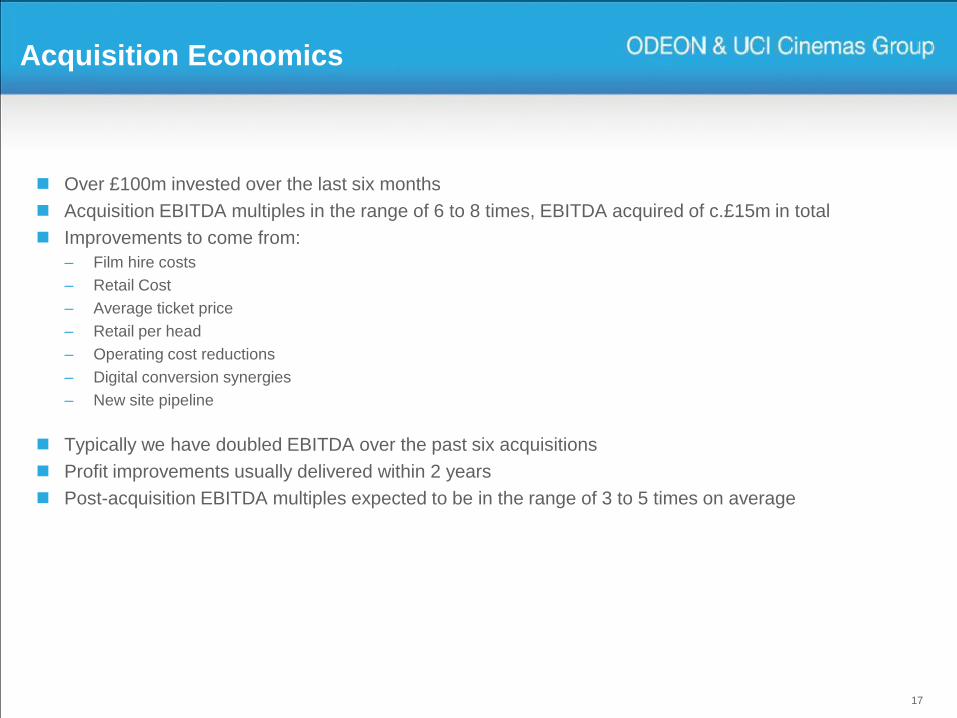
Acquisition Economics
Over £100m invested over the last six months
Acquisition EBITDA multiples in the range of 6 to 8 times, EBITDA acquired of c.£15m in total
Improvements to come from:
– Film hire costs
– Retail Cost
– Average ticket price
– Retail per head
– Operating cost reductions
– Digital conversion synergies
– New site pipeline
Typically we have doubled EBITDA over the past six acquisitions
Profit improvements usually delivered within 2 years
Post-acquisition EBITDA multiples expected to be in the range of 3 to 5 times on average
17
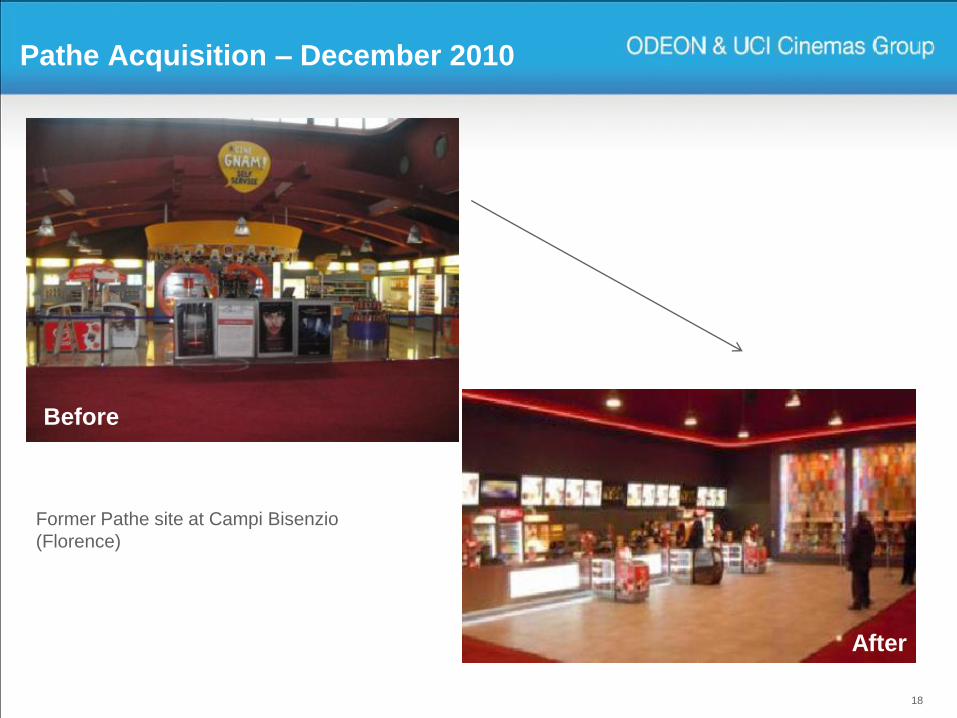
Pathe Acquisition – December 2010
18
Before
AfterAfter
Former Pathe site at Campi Bisenzio
(Florence)
19
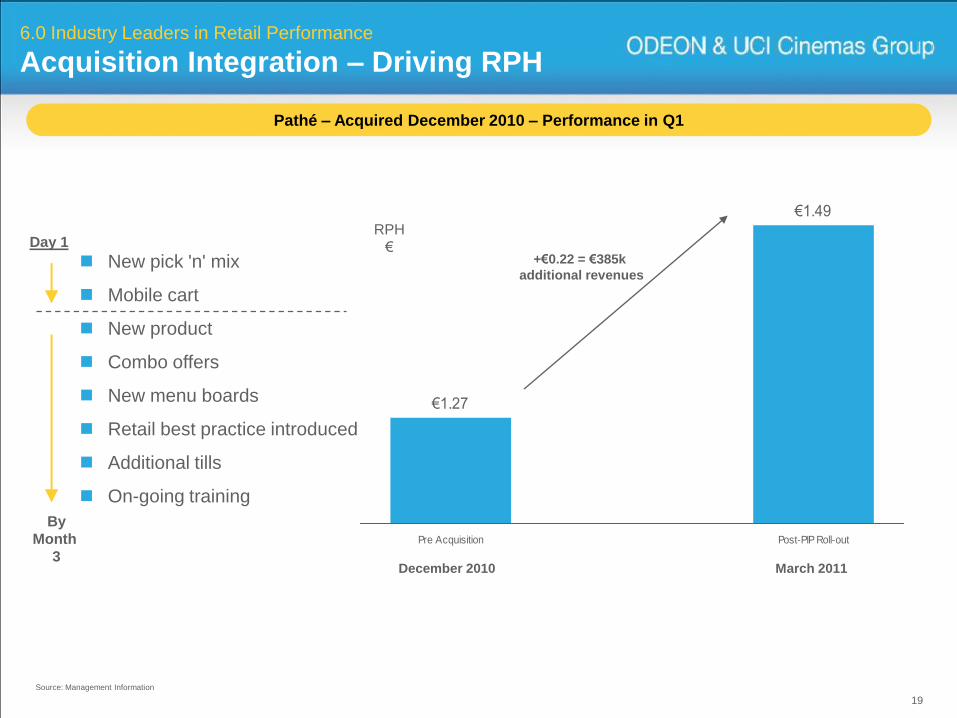
€1.27
€1.49
Pre Acquisition Post-PIP Roll-out
6.0 Industry Leaders in Retail Performance
Acquisition Integration – Driving RPH
+€0.22 = €385k
additional revenues
Pathé – Acquired December 2010 – Performance in Q1
New pick 'n' mix
Mobile cart
New product
Combo offers
New menu boards
Retail best practice introduced
Additional tills
On-going training
Day 1
December 2010 March 2011
By
Month
3
RPH
€
Source: Management Information
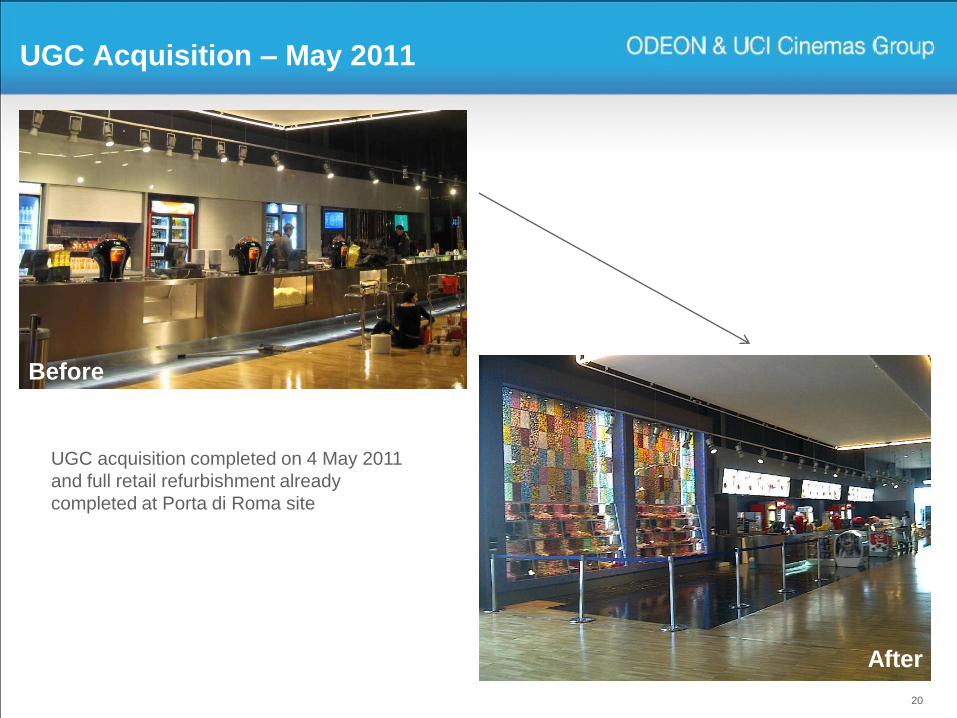
UGC Acquisition – May 2011
20
Before
AfterAfter
Before
After
UGC acquisition completed on 4 May 2011
and full retail refurbishment already
completed at Porta di Roma site
21
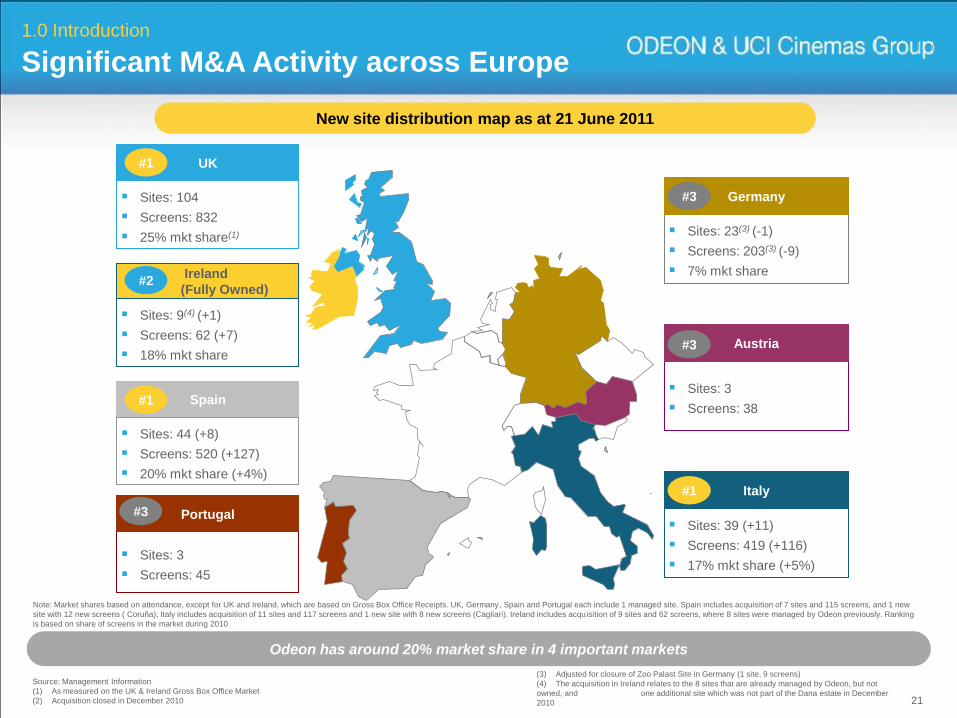
New site distribution map as at 21 June 2011
Source: Management Information
(1) As measured on the UK & Ireland Gross Box Office Market
(2) Acquisition closed in December 2010
Note: Market shares based on attendance, except for UK and Ireland, which are based on Gross Box Office Receipts. UK, Germany, Spain and Portugal each include 1 managed site. Spain includes acquisition of 7 sites and 115 screens, and 1 new
site with 12 new screens ( Coruña); Italy includes acquisition of 11 sites and 117 screens and 1 new site with 8 new screens (Cagliari). Ireland includes acquisition of 9 sites and 62 screens, where 8 sites were managed by Odeon previously. Ranking
is based on share of screens in the market during 2010
UK
Sites: 104
Screens: 832
25% mkt share(1)
#1
Ireland
(Fully Owned)
Sites: 9(4) (+1)
Screens: 62 (+7)
18% mkt share
#2
Sites: 44 (+8)
Screens: 520 (+127)
20% mkt share (+4%)
Spain#1
Sites: 3
Screens: 45
Portugal#3 Sites: 39 (+11)
Screens: 419 (+116)
17% mkt share (+5%)
Italy#1
Sites: 3
Screens: 38
Austria#3
Sites: 23(3) (-1)
Screens: 203(3) (-9)
7% mkt share
Germany#3
Odeon has around 20% market share in 4 important markets
1.0 Introduction
Significant M&A Activity across Europe
(3) Adjusted for closure of Zoo Palast Site in Germany (1 site, 9 screens)
(4) The acquisition in Ireland relates to the 8 sites that are already managed by Odeon, but not
owned, and one additional site which was not part of the Dana estate in December
2010
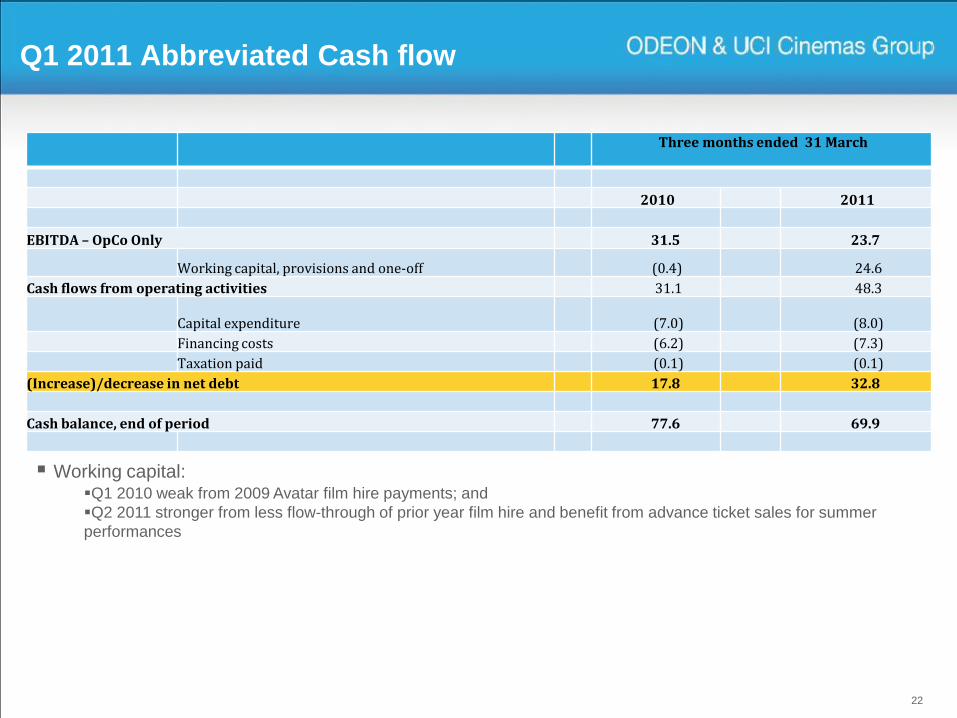
Q1 2011 Abbreviated Cash flow
Three months ended 31 March
2010 2011
EBITDA – OpCo Only 31.5 23.7
Working capital, provisions and one-off (0.4) 24.6
Cash flows from operating activities 31.1 48.3
Capital expenditure (7.0) (8.0)
Financing costs (6.2) (7.3)
Taxation paid (0.1) (0.1)
(Increase)/decrease in net debt 17.8 32.8
Cash balance, end of period 77.6 69.9
22
Working capital:Q1 2010 weak from 2009 Avatar film hire payments; and
Q2 2011 stronger from less flow-through of prior year film hire and benefit from advance ticket sales for summer
performances
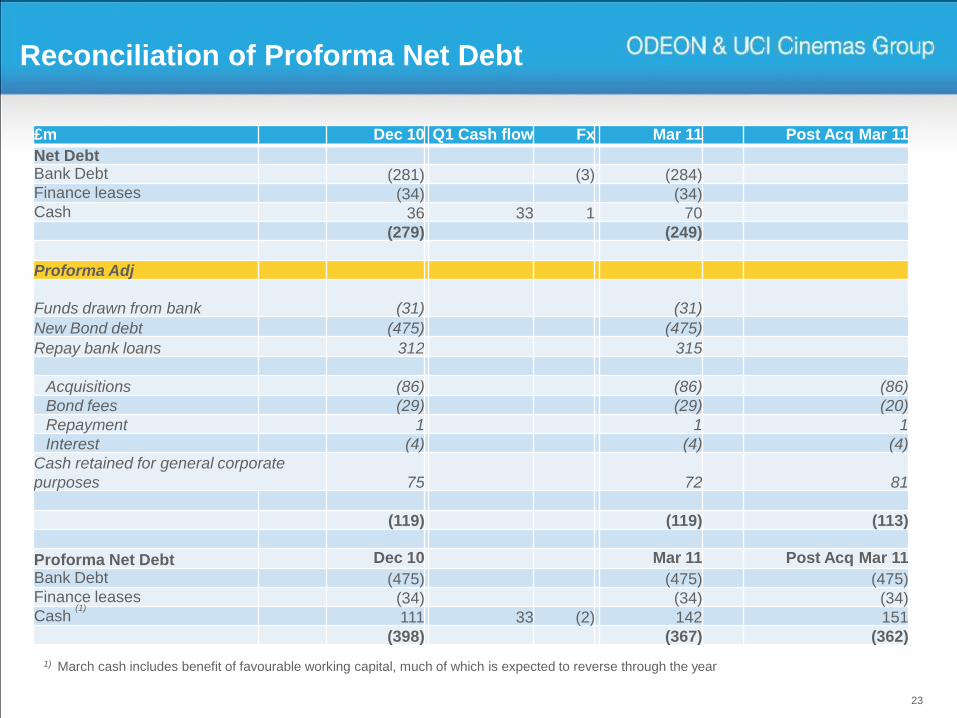
Reconciliation of Proforma Net Debt
23
£m Dec 10 Q1 Cash flow Fx Mar 11 Post Acq Mar 11
Net DebtBank Debt (281) (3) (284)Finance leases (34) (34)Cash 36 33 1 70
(279) (249)
Proforma Adj
Funds drawn from bank (31) (31)
New Bond debt (475) (475)
Repay bank loans 312 315
Acquisitions (86) (86) (86)
Bond fees (29) (29) (20)
Repayment 1 1 1
Interest (4) (4) (4)
Cash retained for general corporate
purposes 75 72 81
(119) (119) (113)
Proforma Net Debt Dec 10 Mar 11 Post Acq Mar 11
Bank Debt (475) (475) (475)Finance leases (34) (34) (34)Cash
(1)
111 33 (2) 142 151
(398) (367) (362)
1) March cash includes benefit of favourable working capital, much of which is expected to reverse through the year
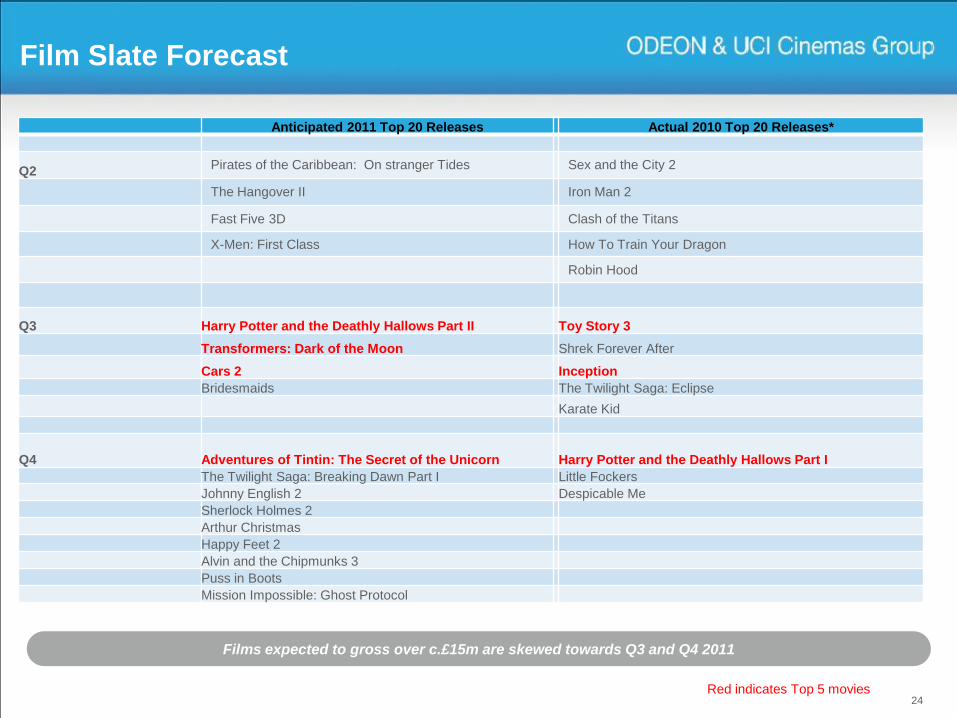
Film Slate Forecast
24
Anticipated 2011 Top 20 Releases Actual 2010 Top 20 Releases*
Q2Pirates of the Caribbean: On stranger Tides Sex and the City 2
The Hangover II Iron Man 2
Fast Five 3D Clash of the Titans
X-Men: First Class How To Train Your Dragon
Robin Hood
Q3 Harry Potter and the Deathly Hallows Part II Toy Story 3
Transformers: Dark of the Moon Shrek Forever After
Cars 2 Inception
Bridesmaids The Twilight Saga: Eclipse
Karate Kid
Q4 Adventures of Tintin: The Secret of the Unicorn Harry Potter and the Deathly Hallows Part I
The Twilight Saga: Breaking Dawn Part I Little Fockers
Johnny English 2 Despicable Me
Sherlock Holmes 2
Arthur Christmas
Happy Feet 2
Alvin and the Chipmunks 3
Puss in Boots
Mission Impossible: Ghost Protocol
Films expected to gross over c.£15m are skewed towards Q3 and Q4 2011
Red indicates Top 5 movies

Current trading & Outlook
Expect to be in line with management expectation YTD, Q2 ahead of last year, but YTD still below 2010
Slower start to the quarter due to the warm, dry weather in April and May in our territories
Stronger than Q2 2010 because of FIFA World Cup in South Africa
KPIs improved on Q1 because of better film mix (3D/blockbuster films) and ahead of prior year
Several potential Top 5 titles in Q3 namely Transformers: Dark of the Moon and Harry Potter and the
Deathly Hallows Part II, both in 3D
Q2 results and next trading/outlook update on 31 August 2011
25
Q&A & AOB
Any questions?
Further questions can be addressed below:– Email: [email protected]
– PR: [email protected]
– Financial PR: Andrew Dowler, Finsbury +44 (0) 20 7251 3801
– Telephone: Jonny Mason +44 (0) 20 7321 6221
26
27