odysa ® experiences with an individual “green wave” marcel willekens / arjan bezemer /...
TRANSCRIPT
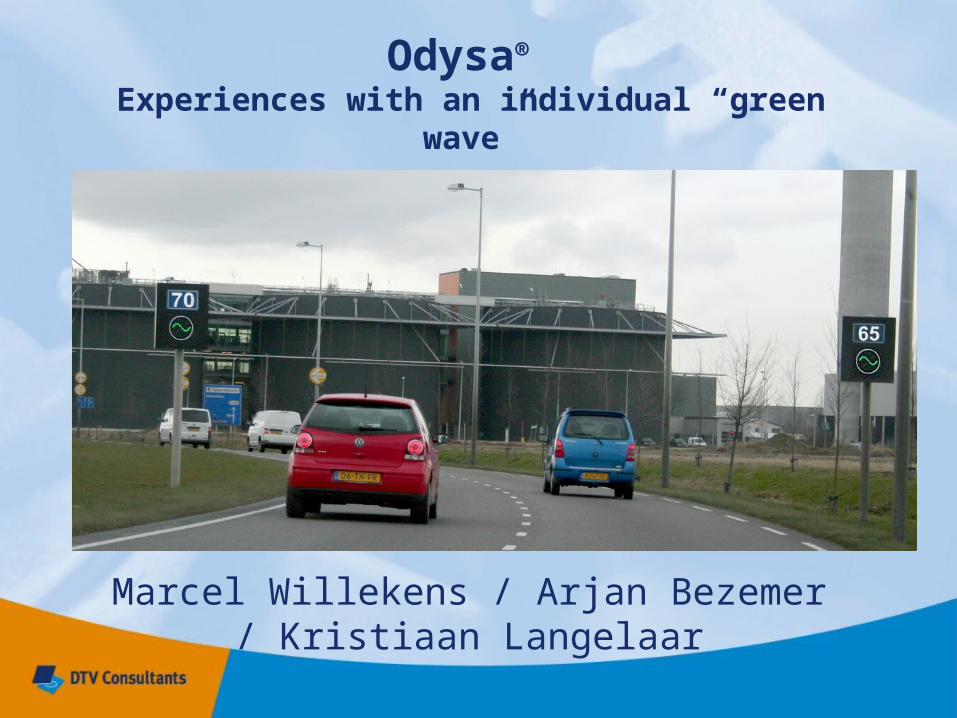
Odysa® Experiences with an individual “green wave”
Marcel Willekens / Arjan Bezemer / Kristiaan Langelaar

Summary
How does Odysa work?
What are the effects?
Points of attention
References
Further developments
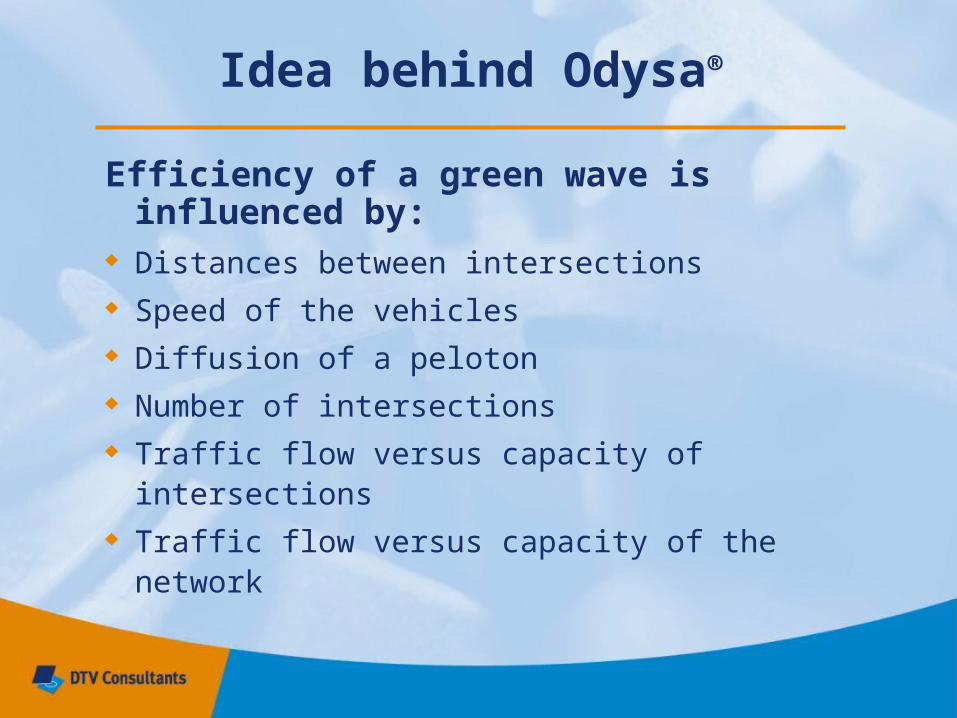
Idea behind Odysa®
Efficiency of a green wave is influenced by:
Distances between intersections Speed of the vehicles Diffusion of a peloton Number of intersections Traffic flow versus capacity of intersections Traffic flow versus capacity of the network

Idea behind Odysa®
Reward ‘good’ behavior
Optimalisation Flow by
DYnamic and individual
Speed Advice
Destroyed speed camera by angry drivers

How does Odysa® work?
Bundle traffic flows (no more diffusion) Green times opposite main directions can fit
better in green wave Because of dynamic speeds, also other
(secondary) directions can benefit
With Odysa you get more control over traffic flow

How does Odysa® work?
How does Odysa® work?
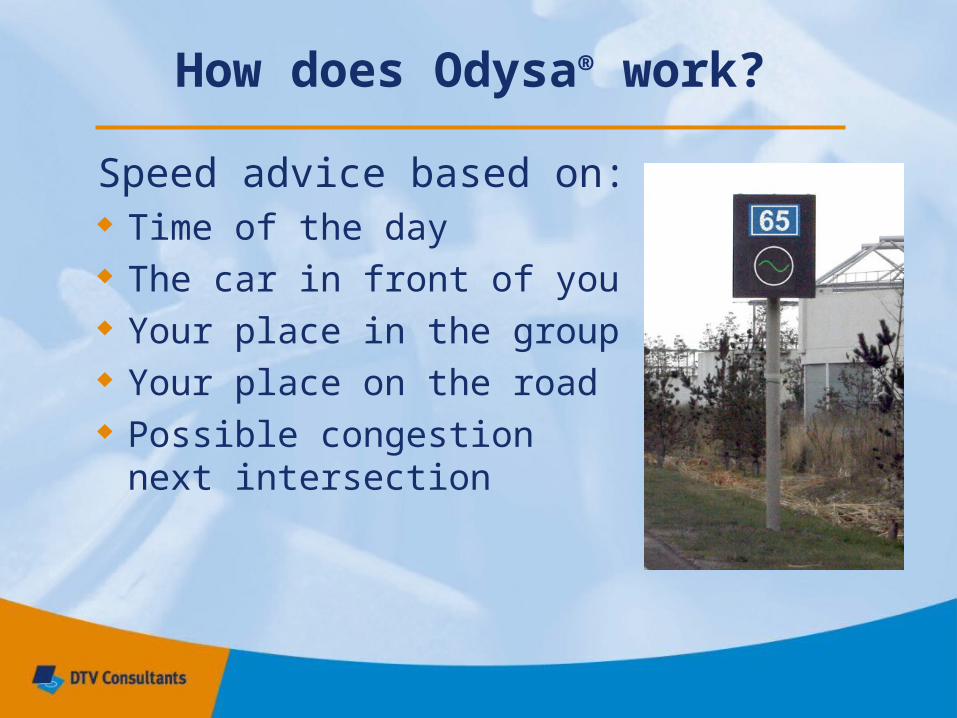
Speed advice based on: Time of the day The car in front of you Your place in the group Your place on the road Possible congestion next
intersection

How does Odysa® work?
Sometimes no green wave:
If you have to drive too slow (below 50 km/h*)
If you have to drive too fast (above 80 km/h*)
* Minimum and maximum speed is based on the legal maximum speed and road profile

How does Odysa® work?
Sometimes no advice: Program switch Congestion next
intersection Incidents, like accidents
etc. Odysa system down or
switched off

What are the effects?
Flow Safety Pollution Awareness
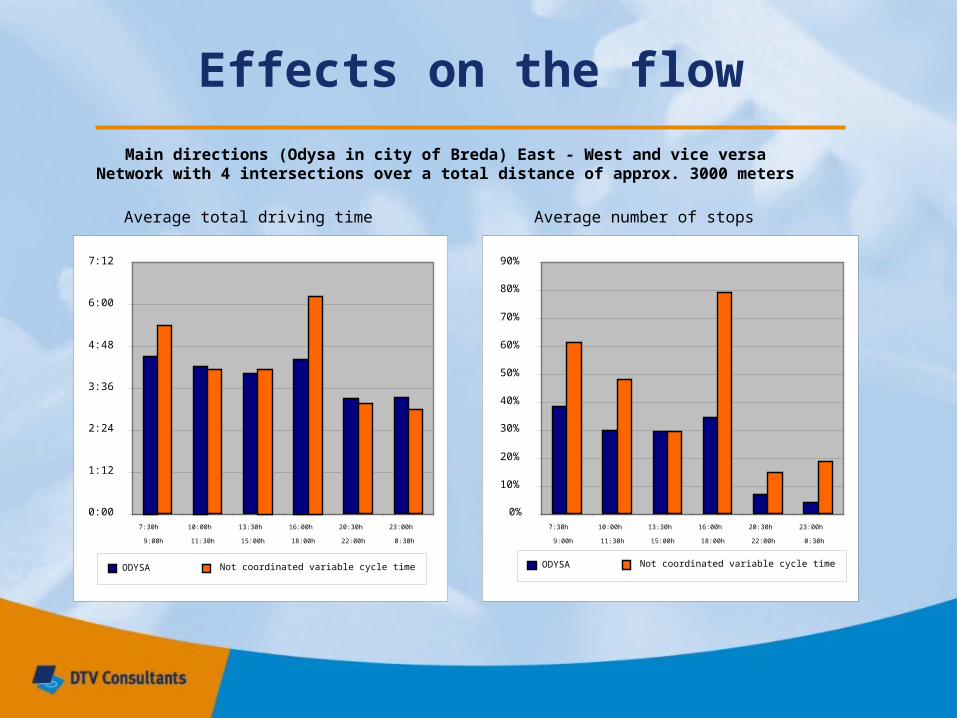
Effects on the flow
Average total driving time Average number of stops
Main directions (Odysa in city of Breda) East - West and vice versaNetwork with 4 intersections over a total distance of approx. 3000 meters
0:00
1:12
2:24
3:36
4:48
6:00
7:12
7:30h
9:00h
10:00h
11:30h
13:30h
15:00h
16:00h
18:00h
20:30h
22:00h
23:00h
0:30h
0%
10%
20%
30%
40%
50%
60%
70%
80%
90%
7:30h
9:00h
10:00h
11:30h
13:30h
15:00h
16:00h
18:00h
20:30h
22:00h
23:00h
0:30h
ODYSA Not coordinated variable cycle time ODYSA Not coordinated variable cycle time

Effects on the flow
Profile of an average trip (City of Amsterdam network over approx. 2500 m. and 4 intersections
Not coordinated variable cycle time
ODYSA

Effect on flow (Amsterdam)
Average number
of vehicles.
Driving time not
coord.var. cycle time
Driving time
ODYSA Difference
West -> East (into city) 1.160 308 s 217 s - 91 s
East-> West (out of city) 200 216 s 250 s + 34 s
Crossing network (south -north at intersection 891)
240 56 s 70 s + 14 s
Crossing network (north - south at intersection 891)
120 95 s 116 s + 21 s
Results simulation study morning traffic hour (source: city of Amsterdam)

Effect on flow
Public transport– Compared to the situation of absolute priority
for public transport in mode “Not coordinated variable cycle time”, absolute priority for public transport in mode Odysa is limited
– Extra delay for busses when there is a bus stop within the green wave
– Public transport can also profit of green wave

Effects on safety
No study has been conducted yet, but the first impressions are:– Less head tail collisions– Lower average speed within green wave
Odysa is also applicable in the night with low traffic flows; – excessive speeding is avoided– driver is rewarded with guaranteed green when
following the advised speed

Effects on air pollution
Real time emission measurements were carried out with a petrol fueled car under different circumstances and routes
Measurements were repeated multiple times in a laboratory environment

Effects on air pollution
Emissions Nitrogen (NOx)
Emissions Carbon dioxide (CO2)
Emission nitrogen (NOx) year basis between 06:00 am en 20:00 pm main directions
0
100
200
300
400
500
600
700
Nitrogen
Kg
/ y
ear
Not coordinated variable cycle time ODYSA
Emissions carbon dioxide year basis between 06:00 am en 20:00 pm main directions
0
200
400
600
800
1000
1200
1400
1600
1800
Carbon dioxide
x 1
000
kg
/ y
ear
Not coordinated variable cycle time ODYSA
Effects on air pollution
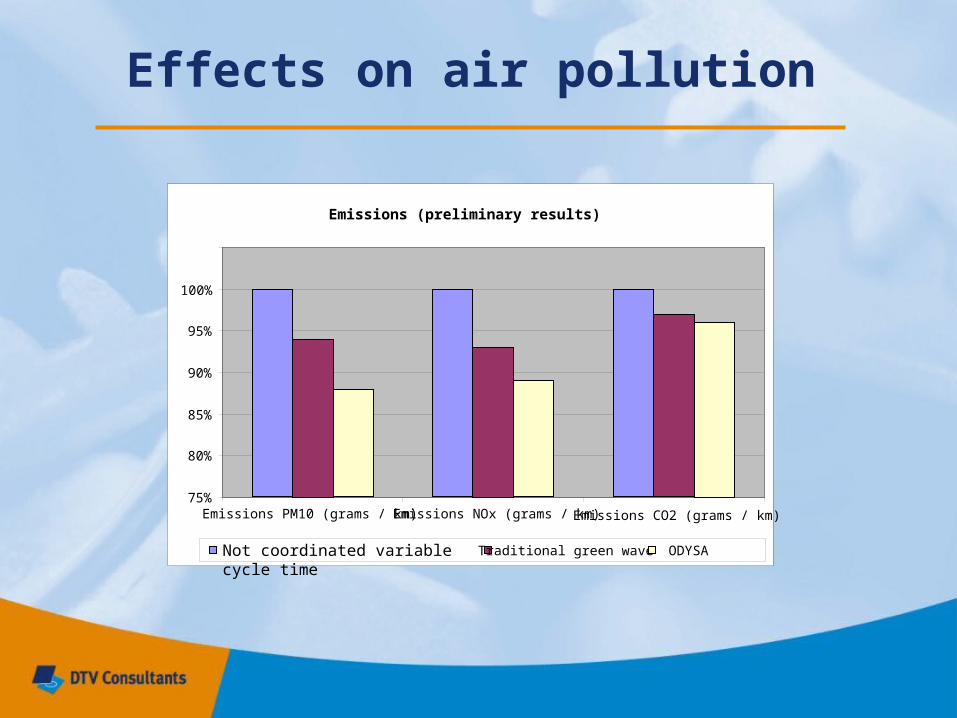
Emissions (preliminary results)
75%
80%
85%
90%
95%
100%
Emissions PM10 (grams / km) Emissions NOx (grams / km) Emissions CO2 (grams / km)
Not coordinated variable cycle time
Traditional green wave ODYSA

Effects on air pollution
Lower emissions for traffic on non main directions, although higher travel times
Air pollution benefits can be much higher for trucks
Emission differences for the whole network are smaller
Conclusions:

Awareness
Drivers adapt quickly to speed advice Perception research in Odysa Breda:
– Traffic on main route is more positive then local traffic;
– Truck drivers are more positive then car drivers;– 71% of main traffic and 87% of truck drivers obey the
advised speed. – Local traffic doesn’t always benefit from Odysa and is
less positive.

Points of attention
Maximum speed between 70 and 80 km/h; Low percentage local traffic; Over saturated situations on main directions
should be avoided at all times; Reliable communication between traffic
controllers and (variable) speed indicators; Functional maintenance: green waves need
monitoring because of changing traffic flows.

Reference projects
Odysa Breda – Tilburg (N282)- 4 intersections (approx. 3000 meters)
Odysa Amsterdam - 4 intersections (approx. 2500 meters)
New Odysa networks in 2009:– expending network Amsterdam from 4 to 6 intersections
(approx. 3900 meters);– Veghel (N279) - 6 intersections (approx. 2700 meters);– Spijkenisse (N218) - 3 intersections (approx. 2900 meters);– Eindhoven - 5 intersections (approx. 4300 meters. This
Odysa network includes a new study project “Odysa In-car” where the speed indication is displayed inside the car via a wireless network.).

Developments
New software development In-car technology:
– Communication from traffic light controller to the car;
– Communication from the car to the traffic light controller;
– Possible controlling motor management??

In short
With Odysa:more control on traffic flowscleaner airless stress for drivers