oecd 2010 intl migrants
TRANSCRIPT
Please cite this paper as:
Dumont, Jean-Christophe, Spielvogel, Gilles, Widmaier, Sarah (2010), “International Migrants in Developed, Emerging and Developing Countries: An Extended Profile”, OECD Social, Employment and Migration Working Papers No.114, www.oecd.org/els/workingpapers
Directorate for Employment, Labour and Social Affairs
OECD Social, Employment and Migration Working Papers
International Migrants in Developed, Emerging and Developing Countries: An Extended Profile Jean-Christophe Dumont, Gilles Spielvogel and Sarah Widmaier
114
Unclassified DELSA/ELSA/WD/SEM(2010)14 Organisation de Coopération et de Développement Économiques Organisation for Economic Co-operation and Development 15-Dec-2010 ___________________________________________________________________________________________
English - Or. English DIRECTORATE FOR EMPLOYMENT, LABOUR AND SOCIAL AFFAIRS EMPLOYMENT, LABOUR AND SOCIAL AFFAIRS COMMITTEE
OECD SOCIAL, EMPLOYMENT AND MIGRATION PAPERS, NO. 114 INTERNATIONAL MIGRANTS IN DEVELOPED, EMERGING AND DEVELOPING COUNTRIES: AN EXTENDED PROFILE
Jean-Christophe Dumont, Gilles Spielvogel and Sarah Widmaier
J61, J24, O15, F22, I23
JT03294477 Document complet disponible sur OLIS dans son format d'origine Complete document available on OLIS in its original format
DE
LSA
/ELSA
/WD
/SEM(2010)14
Unclassified
English - O
r. English
Cancels & replaces the same document of 23 November 2010

DELSA/ELSA/WD/SEM(2010)14
2
DIRECTORATE FOR EMPLOYMENT, LABOUR AND SOCIAL AFFAIRS
www.oecd.org/els
OECD SOCIAL, EMPLOYMENT AND MIGRATION WORKING PAPERS
www.oecd.org/els/workingpapers
This series is designed to make available to a wider readership selected labour market, social policy and migration studies prepared for use within the OECD. Authorship is usually collective, but principal writers are named. The papers are generally available only in their original language – English or French – with a summary in the other. Comment on the series is welcome, and should be sent to the Directorate for Employment, Labour and Social Affairs, 2, rue André-Pascal, 75775 PARIS CEDEX 16, France.
The opinions expressed and arguments employed here are the responsibility of the author(s) and do not necessarily reflect those of the OECD.
Applications for permission to reproduce or translate all or part of this material should be made to:
Head of Publications Service
OECD 2, rue André-Pascal
75775 Paris, CEDEX 16 France
Copyright OECD 2010

DELSA/ELSA/WD/SEM(2010)14
3
ACKNOWLEDGEMENT
This paper was written by Jean-Christophe Dumont (OECD, [email protected]), Gilles Spielvogel (University Paris 1 Panthéon-Sorbonne, [email protected]) and Sarah Widmaier (OECD, [email protected]). The authors would like to thank Maria Carolina Alban (OECD) for statistical assistance and especially Çağlar Özden (World Bank) for his support and valuable comments. The underlying database DIOC-E was compiled as the result of a joint effort by the OECD, the Development Research Group of the World Bank and the Research Department of the Agence Française de Développement and benefited from a special contribution from Afristat. This project has been supported by the Research Department of the Agence Française de Développement.

DELSA/ELSA/WD/SEM(2010)14
4
TABLE OF CONTENTS
ABSTRACT .................................................................................................................................................... 5
RÉSUMÉ ......................................................................................................................................................... 6
INTERNATIONAL MIGRANTS IN DEVELOPED, EMERGING AND DEVELOPING COUNTRIES: AN EXTENDED PROFILE ............................................................................................................................ 7
Introduction .................................................................................................................................................. 7 Main findings ............................................................................................................................................... 8 1. An extended bilateral database of international migrants: DIOC-E ........................................................ 9 2. An overview of worldwide migration circa 2000 based on DIOC-E ..................................................... 15
2.1 Immigrant populations by countries of residence: size and characteristics ...................................... 15 2.2 The perspective of origin countries: emigrants and their characteristics ......................................... 21
3. New emigration rates and “brain drain” estimates ................................................................................. 25 4. Determinants of highly skilled migration: unilateral and bilateral estimates ........................................ 30
4.1 Unilateral estimates .......................................................................................................................... 30 4.2 Bilateral estimates ............................................................................................................................ 33
Conclusion ................................................................................................................................................. 39
REFERENCES ............................................................................................................................................. 40

DELSA/ELSA/WD/SEM(2010)14
5
ABSTRACT
Increasing international mobility makes international comparable data even more important, to depict global migration patterns and its characteristics, not only in receiving countries but also in origin countries. This paper provides a detailed picture of immigrant and emigrant populations around the year 2000 based on the new global bilateral migration database DIOC-E.
DIOC-E gives the opportunity to investigate various aspects of South-South migration and to make reliable comparisons with South-North migration. In particular, emigration rates for different skill levels can be computed, including many key destination countries outside the OECD area, based on more accurate education data in origin countries. This refines and challenges previous conclusions regarding the relative importance of migration in different regions of the world, main characteristics of emigrants, and sheds light on such key issues as the gender dimension of international migration and the selectivity of migration flows.
DIOC-E (release 2.0) covers 89 destination countries, of which 61 are outside the OECD area. It includes information on 110 million migrants aged 15 and over by skill level, age, gender and labour market outcomes, which represents around 72% of the estimated number of international migrants worldwide. In total there are 46.8 million low-skilled migrants (43.6%), 37.5 million migrants with intermediate skill level (35%) and 23 million highly skilled migrants (21.5%). Although low-skilled migration still dominates in absolute terms both to the OECD and to non-OECD countries, emigration rates for highly skilled persons exceed total emigration rates in all regions, which reflect the selective nature of migration. The econometric analyses of bilateral determinants of migration of the high-skilled distinguish South-North and South-South migration. Regarding migration to OECD countries, the relationship between the emigration rate of the highly skilled and the income level of origin countries follows an inverted U-shape relationship. But this is not the case for migration to non-OECD countries. Both total and high-skilled emigration rates to non-OECD countries steadily increase as the level of income of the origin countries decreases.
Keywords: international migration, database, DIOC-E, DIOC, migrant stocks, emigration rates, skills, education, immigrants, emigrants, development
DELSA/ELSA/WD/SEM(2010)14
6
RÉSUMÉ
La croissance de la mobilité internationale souligne l’importance de données internationales comparables pour décrire la migration mondiale et ses caractéristiques, non seulement dans les pays de destination mais aussi dans les pays d’origine. Ce document donne une image détaillée des populations émigrée et immigrée dans les années 2000 à partir de la nouvelle base de données bilatérale mondiale DIOC-E.
DIOC-E offre la possibilité d’étudier différents aspects de la migration sud-sud et de réaliser des comparaisons fiables avec la migration sud-nord. En particulier, des données fiables dans les pays d’origine permettent de calculer des taux d’expatriation par niveaux d’éducation en incluant les grands pays de destination hors de la zone OCDE. Cela remet en question des conclusions établies précédemment sur l’importance relative de la migration dans différentes régions du monde, affine les caractéristiques principales des émigrés et donne un éclairage sur des questions clés comme la dimension « genre » de la migration internationale et la sélectivité des mouvements migratoires.
DIOC-E (release 2.0) contient des données pour 89 pays de destination, dont 61 sont en dehors de la zone OCDE. La base de données contient des informations par niveaux d’éducation, âge, genre et des résultats sur le marché du travail pour 110 millions de migrants âgés de 15 ans et plus, soit environ 72% de l’estimation mondiale des migrants internationaux. Au total, 46.8 millions de migrants (43.6%) sont faiblement qualifiés, 37.5 millions (35%) ont un niveau d’éducation intermédiaire et 23 millions (21.5%) sont hautement qualifiés. Bien que la migration faiblement qualifiée prédomine en termes absolus, tant vers les pays de l’OCDE que vers les pays non-OCDE, les taux d’expatriation des migrants hautement qualifiés dépassent les taux d’expatriation globaux dans toutes les régions, reflétant ainsi la sélectivité de la migration. Les analyses économétriques des déterminants bilatéraux de la migration des personnes hautement qualifiées distinguent la migration sud-nord des migrations sud-sud. En ce qui concerne la migration vers les pays de l’OCDE, la relation entre le taux d’expatriation des personnes hautement qualifiées et le niveau de revenus des pays d’origine suit une courbe en U inversée. Cela n’est pas le cas pour la migration vers les pays non-OCDE. Les taux d’expatriation globaux ainsi que ceux des personnes hautement qualifiées vers les pays non-OCDE augmentent lorsque le niveau de revenu des pays d’origine diminue.
Mots clés: migration internationale, base de données, DIOC-E, DIOC, stock de migrants, taux d’expatriation, qualification, éducation, immigrés, émigrés, développement
DELSA/ELSA/WD/SEM(2010)14
7
INTERNATIONAL MIGRANTS IN DEVELOPED, EMERGING AND DEVELOPING COUNTRIES: AN EXTENDED PROFILE
Introduction
1. Since the late 1990s, in part due to increasing international movements, policy-makers have devoted growing attention to migration-related issues, and expectations that migration may support the economic development of origin countries has mounted. However, the quality and comparability of international data on migration have barely kept pace. In recent years, significant efforts were made to fill this gap, notably by compiling new data on migrant stocks from a wide array of origin countries. For example, the Database on Immigrants in OECD Countries (DIOC)1, released in 2008 by the OECD, incorporates detailed information on level of education, age, gender and labour market outcomes for the population aged 15+ around the year 2000 for 28 OECD destination countries2
2. With these data, it has been possible to describe immigrant populations in the OECD area and to capture the cumulative effect of the many movements of the past decades (OECD, 2008). Taking advantage of the information available on the educational attainment of migrants, the migration flows of the highly skilled could be depicted, confronting the conventional wisdom on the brain drain with actual data.
and more than 200 countries or regions of birth.
3. The data recently compiled on migrant stocks rely mainly on population censuses of OECD countries as their main sources. Yet, a significant share of international migration occurs outside the OECD area3
4. In order to assess these differences and to provide a global and more accurate picture of migrant populations around 2000, the OECD, with support from the Agence Française de Développement (AFD) and in collaboration with the World Bank, has expanded the Database on Immigrants in OECD Countries (DIOC) to cover non-OECD receiving countries as well
and migrants in non-OECD countries may differ significantly from those settled in OECD countries. Focusing solely on OECD countries may therefore distort the profile of immigrants world-wide and bias the estimated impact of emigration.
4. This extended version of DIOC is called DIOC-E, and is freely accessible on the OECD5
1
and World Bank websites.
http://www.oecd.org/els/migration/DIOC. See also the World Bank Website for comparable datasets : http://go.worldbank.org/RFRQAN6BO1
2 Korea and Iceland are not included. 3 Although the majority of international migrants still live in developed countries, the number of countries
hosting international migrants has increased in recent years. Between 1960 and 2005, the number of countries hosting at least 500 thousand migrants more than doubled to reach 64. In 2005, it is estimated that about 75 million immigrants lived in developing countries, including 53 million in Asia, 17 million in Africa, and 7 million in Latin America and the Caribbean (United Nations, 2009).
4 See also Parsons et al. (2005) and United Nations (2008) for databases attempting to include all bilateral migrants' stocks, although without the education dimension.
5 http://www.oecd.org/els/migration/DIOC/Extended. The extended database also includes the OECD countries.

DELSA/ELSA/WD/SEM(2010)14
8
5. The extended database offers the opportunity to investigate various aspects of South-South migration and to make comparisons with South-North migration. In particular, it allows computation of emigration rates by skill level including many key destination countries outside the OECD area and is based on more accurate data on education in origin countries.
6. This paper provides a first look at DIOC-E, with the view to highlighting its potential for further research at both regional and global level. The first section presents in more detail the database and data collection process. The following section describes migrant populations by receiving and origin country. Special attention is paid to various aspects such as gender, age, educational attainment and labour force status. In section 4, new emigration rates by educational attainment levels are computed and section 5 presents an econometric analysis of the bilateral determinants of migration of the high-skilled, distinguishing for the first time South-North and South-South migration. The last section concludes.
Main findings
• DIOC-E (release 2.0) covers 89 destination countries, of which 61 are outside the OECD area. It includes information on 110 million migrants aged 15 and over by skill level, age, gender and labour market outcomes, which represents around 72% of the estimated number of international migrants worldwide. 68% of all migrants in the database live in OECD countries, whereas the remaining 32% live in the non-OECD countries included in the extended version so far.
• The data enable calculation of emigration rates of tertiary educated persons for 161 countries, which represents the largest-ever collection of estimates based on actual data (as opposed to extrapolations). Focusing on OECD destination countries only, the improvement of the underlying education data reveals that, for many countries, previous estimates significantly overestimated or underestimated emigration rates for the highly skilled. The extension of the database to non-OECD destination countries also significantly affects emigration rate estimates, notably for former USSR countries, as well as for some African countries. DIOC-E therefore makes a major contribution to improving, quantitatively and qualitatively, available estimates for emigration rates by skill level.
• The global emigration rate is 2.4%, which masks significant regional differences: Europe, Latin America and Oceania have the highest emigration rates, more than twice that of Africa, Asia and North America. Emigration rates are particularly high for small islands and less populated countries.
• In total there are 46.8 million low-skilled migrants (43.6%), 37.5 million migrants with intermediate skill level (35%) and 23 million highly skilled migrants (21.5%). Low-skilled migration still dominates in absolute terms both to the OECD and to non-OECD countries. However, the emigration rate for highly skilled persons exceeds the total emigration rate in all regions, which reflects the selective nature of migration. A striking fact is the magnitude of the global emigration rate of highly skilled persons from Africa, estimated at 10.6% (9.7% for migration to OECD countries), compared to other regions of origin and the world average of 5.4% (4.3% to OECD countries).
• Most destination countries receive mainly migrants born in the same region (about 85% in Africa, 75% in Asia, 62% in Latin America and 60% in Europe), except for countries with historical bonds to other countries out of the region and OECD settlement countries which have received, through various historical migration waves, immigrants from diverse source countries.
DELSA/ELSA/WD/SEM(2010)14
9
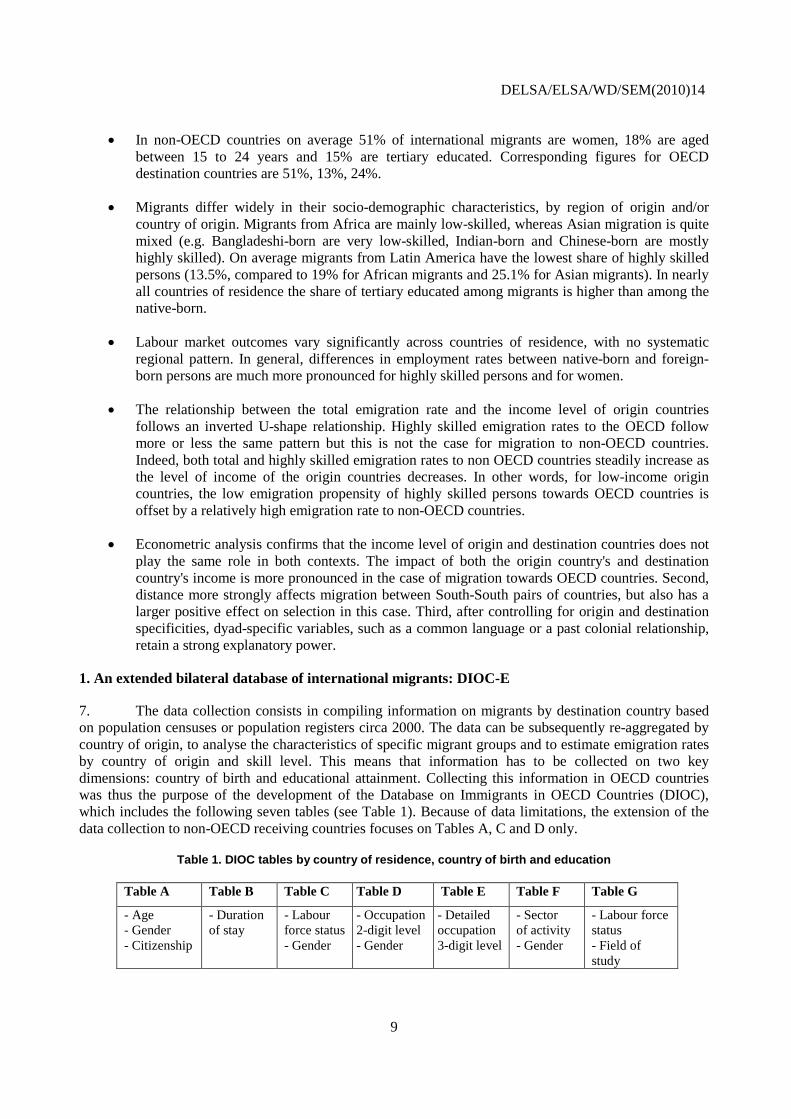
• In non-OECD countries on average 51% of international migrants are women, 18% are aged between 15 to 24 years and 15% are tertiary educated. Corresponding figures for OECD destination countries are 51%, 13%, 24%.
• Migrants differ widely in their socio-demographic characteristics, by region of origin and/or country of origin. Migrants from Africa are mainly low-skilled, whereas Asian migration is quite mixed (e.g. Bangladeshi-born are very low-skilled, Indian-born and Chinese-born are mostly highly skilled). On average migrants from Latin America have the lowest share of highly skilled persons (13.5%, compared to 19% for African migrants and 25.1% for Asian migrants). In nearly all countries of residence the share of tertiary educated among migrants is higher than among the native-born.
• Labour market outcomes vary significantly across countries of residence, with no systematic regional pattern. In general, differences in employment rates between native-born and foreign-born persons are much more pronounced for highly skilled persons and for women.
• The relationship between the total emigration rate and the income level of origin countries follows an inverted U-shape relationship. Highly skilled emigration rates to the OECD follow more or less the same pattern but this is not the case for migration to non-OECD countries. Indeed, both total and highly skilled emigration rates to non OECD countries steadily increase as the level of income of the origin countries decreases. In other words, for low-income origin countries, the low emigration propensity of highly skilled persons towards OECD countries is offset by a relatively high emigration rate to non-OECD countries.
• Econometric analysis confirms that the income level of origin and destination countries does not play the same role in both contexts. The impact of both the origin country's and destination country's income is more pronounced in the case of migration towards OECD countries. Second, distance more strongly affects migration between South-South pairs of countries, but also has a larger positive effect on selection in this case. Third, after controlling for origin and destination specificities, dyad-specific variables, such as a common language or a past colonial relationship, retain a strong explanatory power.
1. An extended bilateral database of international migrants: DIOC-E
7. The data collection consists in compiling information on migrants by destination country based on population censuses or population registers circa 2000. The data can be subsequently re-aggregated by country of origin, to analyse the characteristics of specific migrant groups and to estimate emigration rates by country of origin and skill level. This means that information has to be collected on two key dimensions: country of birth and educational attainment. Collecting this information in OECD countries was thus the purpose of the development of the Database on Immigrants in OECD Countries (DIOC), which includes the following seven tables (see Table 1). Because of data limitations, the extension of the data collection to non-OECD receiving countries focuses on Tables A, C and D only.
Table 1. DIOC tables by country of residence, country of birth and education
Table A Table B Table C Table D Table E Table F Table G
- Age - Gender - Citizenship
- Duration of stay
- Labour force status - Gender
- Occupation 2-digit level - Gender
- Detailed occupation 3-digit level
- Sector of activity - Gender
- Labour force status - Field of study
DELSA/ELSA/WD/SEM(2010)14
10
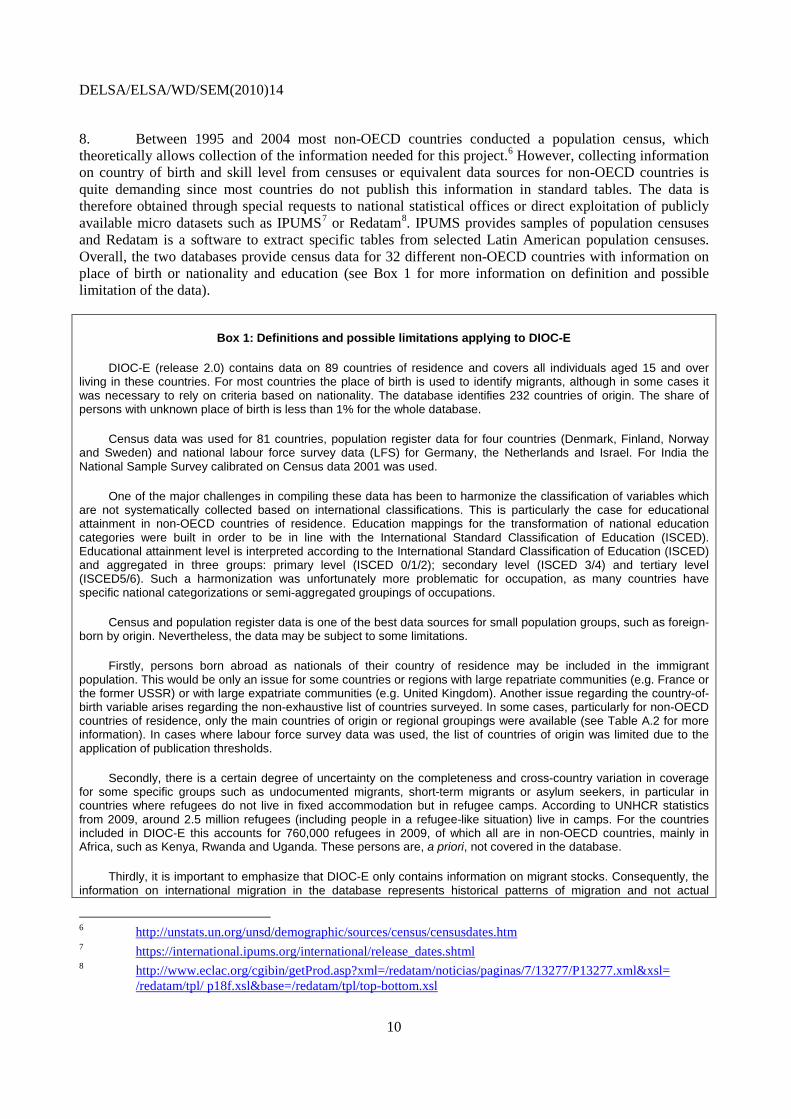
8. Between 1995 and 2004 most non-OECD countries conducted a population census, which theoretically allows collection of the information needed for this project.6 However, collecting information on country of birth and skill level from censuses or equivalent data sources for non-OECD countries is quite demanding since most countries do not publish this information in standard tables. The data is therefore obtained through special requests to national statistical offices or direct exploitation of publicly available micro datasets such as IPUMS7 or Redatam8
Box 1: Definitions and possible limitations applying to DIOC-E
. IPUMS provides samples of population censuses and Redatam is a software to extract specific tables from selected Latin American population censuses. Overall, the two databases provide census data for 32 different non-OECD countries with information on place of birth or nationality and education (see Box 1 for more information on definition and possible limitation of the data).
DIOC-E (release 2.0) contains data on 89 countries of residence and covers all individuals aged 15 and over living in these countries. For most countries the place of birth is used to identify migrants, although in some cases it was necessary to rely on criteria based on nationality. The database identifies 232 countries of origin. The share of persons with unknown place of birth is less than 1% for the whole database.
Census data was used for 81 countries, population register data for four countries (Denmark, Finland, Norway and Sweden) and national labour force survey data (LFS) for Germany, the Netherlands and Israel. For India the National Sample Survey calibrated on Census data 2001 was used.
One of the major challenges in compiling these data has been to harmonize the classification of variables which are not systematically collected based on international classifications. This is particularly the case for educational attainment in non-OECD countries of residence. Education mappings for the transformation of national education categories were built in order to be in line with the International Standard Classification of Education (ISCED). Educational attainment level is interpreted according to the International Standard Classification of Education (ISCED) and aggregated in three groups: primary level (ISCED 0/1/2); secondary level (ISCED 3/4) and tertiary level (ISCED5/6). Such a harmonization was unfortunately more problematic for occupation, as many countries have specific national categorizations or semi-aggregated groupings of occupations.
Census and population register data is one of the best data sources for small population groups, such as foreign-born by origin. Nevertheless, the data may be subject to some limitations.
Firstly, persons born abroad as nationals of their country of residence may be included in the immigrant population. This would be only an issue for some countries or regions with large repatriate communities (e.g. France or the former USSR) or with large expatriate communities (e.g. United Kingdom). Another issue regarding the country-of-birth variable arises regarding the non-exhaustive list of countries surveyed. In some cases, particularly for non-OECD countries of residence, only the main countries of origin or regional groupings were available (see Table A.2 for more information). In cases where labour force survey data was used, the list of countries of origin was limited due to the application of publication thresholds.
Secondly, there is a certain degree of uncertainty on the completeness and cross-country variation in coverage for some specific groups such as undocumented migrants, short-term migrants or asylum seekers, in particular in countries where refugees do not live in fixed accommodation but in refugee camps. According to UNHCR statistics from 2009, around 2.5 million refugees (including people in a refugee-like situation) live in camps. For the countries included in DIOC-E this accounts for 760,000 refugees in 2009, of which all are in non-OECD countries, mainly in Africa, such as Kenya, Rwanda and Uganda. These persons are, a priori, not covered in the database.
Thirdly, it is important to emphasize that DIOC-E only contains information on migrant stocks. Consequently, the information on international migration in the database represents historical patterns of migration and not actual
6 http://unstats.un.org/unsd/demographic/sources/census/censusdates.htm 7 https://international.ipums.org/international/release_dates.shtml 8 http://www.eclac.org/cgibin/getProd.asp?xml=/redatam/noticias/paginas/7/13277/P13277.xml&xsl=
/redatam/tpl/ p18f.xsl&base=/redatam/tpl/top-bottom.xsl

DELSA/ELSA/WD/SEM(2010)14
11
migration flows. Information on duration of stay, included in DIOC, was only available for a limited number of non-OECD destination countries, and therefore could not be included in DIOC-E.
Finally, education data do not allow us to control for the geographic location where the education or training was received. For that reason, one should be cautious when using the place of birth to infer the impact of international migration on countries of origin. Other authors have tried to use age at entry to infer where the diploma was obtained, although this information is only available for a limited number of non-OECD countries and the results are quite sensitive to the cut-off age retained to identify where the last diploma was obtained.
9. The first release of DIOC-E (release 1.0), which was made available in January 20109
10. DIOC-E (release 2.0) allows a comparison of the size and characteristics of migrant populations in 28 OECD countries
, covered 55 destination countries. The second release, on which this paper is based, includes 89 countries. A third and final release is scheduled by the end of 2010 which could add 10 to 20 new destination countries.
10 and 61 non-OECD countries around 200011 (see Table 2 and Table A2 for more information on metadata). Compared to the OECD-only database, DIOC-E adds major destination countries such as Russia, India, Israel, Argentina and Malaysia12
11. One third of all Asian countries
. All continents are covered, although to varying extent. Europe, North America and South and Central America are covered almost completely and Caribbean countries are also well represented. For Oceania, only Australia and New Zealand are included, but the number of immigrants in the other countries is virtually negligible.
13 are present in the database, with many of the key destination countries of the region. China, however, is not included because foreigners are not covered by the Chinese census and other potential sources of data on the foreign-born could not be obtained from Chinese statistical sources. The main Middle Eastern destination countries are not yet included but the OECD is currently working with UN ESCWA14
12. Regarding Africa, only one quarter of all African countries are included in the database so far, mainly because of the absence of reliable census data on immigrants for the period considered. The data collection process, however, is not yet finished. At least six additional African countries (Nigeria, Ivory Coast, Ghana, Mauritania, Sierra Leone, and Malawi) could be included in the third release. Thanks to cooperation with Afristat, data for some additional African countries are also expected to be compiled. It
to launch a new data collection for Western Asian countries. The results of this additional data collection exercise will be included in DIOC-E (release 3.0).
9 www.oecd.org/els/migration/DIOC/Extended 10 In the context of this paper, the terms "OECD member countries" and "OECD area" refer to all member
countries of the OECD except Chile, Israel and Slovenia, i.e. Australia, Austria, Belgium, Canada, Czech Republic, Denmark, Finland, France, Germany, Greece, Hungary, Ireland, Italy, Japan, Luxembourg, Mexico, the Netherlands, New Zealand, Norway, Poland, Portugal, Slovak Republic, Spain, Sweden, Switzerland, Turkey, the United Kingdom and the United States. Two other OECD member countries, Iceland and Korea, are not included in the database since data was not available. They are included in OECD member countries as origin countries, but not as destination countries.
11 It is expected that additional countries will be added in a subsequent release of DIOC-E, including several major receiving countries: Ukraine (5 million migrants), Kazakhstan (3 million migrants), Ivory Coast (2.5 million migrants), Hong Kong (2.5 million), Nigeria (about 1.1 million migrants) and the Arab States (about 30 million migrants).
12 All new OECD member countries (Chile, Israel and Slovenia) and accession countries (Estonia and Russia) are included. All countries with which the OECD has developed enhanced engagement, except China (i.e. Brazil, India, Indonesia and South Africa) are also included.
13 Middle East countries are included in the regional category Asia, but very few of them are covered so far. 14 United Nations Economic and Social Commission for Western Asia (UN ESCWA)

DELSA/ELSA/WD/SEM(2010)14
12
should, however, be noted that DIOC-E is, at present, the only source of data on the characteristics of more than 3 million international migrants living in Africa.
13. While the extension was the main goal of the new data collection, DIOC-E not only provides estimates of the size of the foreign-born populations but includes several demographic and social dimensions, such as gender, age, educational attainment, and, for a more limited set of countries, labour force status and occupation. The need to compile figures with fully comparable categories across countries led to a lower level of detail for certain variables, compared to the OECD-only database. However, the new database provides unparalleled information on the foreign-born (and native-born) populations of a wide range of countries. In particular, great effort was made to obtain comparable classifications of educational attainment across destination countries15
14. The total number of immigrants in the database is 110 million (population aged 15 and over), with about 75 million living in OECD countries and 35 million in non-OECD countries. Extending the coverage to these latter countries has therefore increased the total stock of migrants in the database by almost 50%. Overall, the 89 countries included in the database represent about 55% of the world population 15 and over (China is not included), but host about 72% of the world's migrants
, in order to obtain meaningful measures of high-skilled migration.
16
15 IPUMS contains the core variables for this project in their original format, and in some cases in a
harmonized format. These harmonized variables are one of the strongest advantages of IPUMS, since they reduce the technical constraints of using national data for the purpose of international comparisons.
.
For the harmonized education variable, IPUMS use a predefined criterion of years of education, required to equal the corresponding completed level or degree. For example, a person is considered to have completed primary education if he/she has at least six years of primary schooling. Three years are necessary for lower secondary education; another three years for upper-secondary education; and at least four years for tertiary education. The main advantage of this approach is that each category of the classification has the same meaning for all countries. However, it ignores the specificities of national educational systems, notably at the tertiary level. For example, the IPUMS definition classified all persons with non-university degrees as having only secondary education.
In order to improve international comparability, a special effort has been made to link the international classification ISCED and the unharmonised education variable in IPUMS and Redatam. UNESCO mappings were available only for a limited number of countries and in most cases it was necessary to use information from other sources (Sistemas Educativos Nacionales project – OEI, World Data on Education database, IBE/UNESCO or national ministries of education).
16 The UN estimates that there were 175 million migrants in the world in 2000 (United Nations, 2009). According to these data, countries covered by DIOC-E hosted about 125 million migrants, leading to a coverage of 72% (against 47% for the OECD-only database). DIOC-E accounts for only 110 million migrants living in those countries because it covers the 15+ population (vs. total population in the UN estimates).

DELSA/ELSA/WD/SEM(2010)14
13
Table 2. Foreign-born population aged 15 and over by country of residence and region of origin, in thousands, circa 2000
Total population Africa Asia Europe North America Oceania
South, Central America and the Carribean Unspecified Total
of which: OECD countries
AfricaGambia GMB 775.6 83.6 .. .. .. .. .. 2.8 86.4 .. .. 11.1Seychelles SYC 60.7 1.4 2.7 0.4 - - - 0.9 5.5 0.4 - 9.0Burkina Faso BFA 7,518.1 364.0 ns ns ns ns ns 83.7 447.8 .. .. 6.0Benin BEN 3,599.1 194.2 1.3 1.6 0.2 - - 0.1 197.4 1.6 23.3 5.5Guinea GIN 3,993.1 206.7 0.8 1.9 0.2 .. .. 0.2 210.1 1.3 1.5 5.3Rwanda RWA 4,739.7 228.2 0.5 1.3 .. 0.2 .. 0.1 230.3 0.6 185.1 5.1South Africa ZAF 30,437.0 676.2 38.0 223.1 7.9 4.1 12.2 - 961.5 226.2 .. 3.2Uganda UGA 12,912.1 302.9 4.9 2.5 0.9 .. .. 2.1 313.2 1.8 0.3 2.4Kenya KEN 15,910.1 311.1 ns ns ns ns ns ns 311.1 .. .. 2.0Mali MLI 5,292.2 93.0 0.1 1.4 0.2 .. .. 4.4 99.1 1.5 .. 1.9Mozambique MUS 881.6 0.9 12.0 1.7 0.1 - - 0.1 14.7 1.7 .. 1.7Tanzania TZA 18,542.3 185.3 8.0 3.2 0.7 .. .. 46.5 243.7 2.4 0.1 1.3Senegal SEN 5,637.1 45.3 2.9 4.3 0.4 - 0.2 2.0 55.1 4.5 9.8 1.0AsiaIsrael ISR 4,452.2 305.9 327.3 1,040.7 44.6 2.5 50.1 .. 1,771.0 264.4 1.6 39.8Singapore SGP 2,277.4 .. 505.9 3.5 1.2 .. .. 2.2 512.7 .. .. 22.5Kyrgyz Republic USSR-KGZ 3,050.0 .. 174.7 177.4 .. .. .. 2.6 354.7 1.9 - 11.6Armenia USSR-ARM 2,433.0 0.4 167.8 99.5 0.2 .. .. 0.5 268.4 7.2 .. 11.0Jordan JOR 3,194.1 95.1 54.9 6.2 .. .. .. 135.3 291.4 .. 1.0 9.1Malaysia MYS 14,365.5 0.8 982.2 7.2 2.1 2.6 0.3 312.1 1,307.1 14.7 .. 9.1Nepal NPL 14,072.3 .. 517.9 1.1 0.2 .. .. 0.4 519.5 0.6 .. 3.7Philippines PHL 48,025.3 15.6 198.4 97.7 60.5 22.3 20.2 409.7 824.5 173.7 1,658.1 1.8Japan JPN 108,224.8 5.1 868.6 27.1 40.0 8.1 193.5 .. 1,142.4 66.7 15.0 1.1India IND 662,376.9 64.6 5,778.0 16.0 3.7 5.8 .. 8.8 5,876.9 12.1 .. 0.9Iraq IRQ 10,882.5 17.5 55.8 1.9 0.2 .. .. 2.3 77.6 1.7 64.8 0.7Thailand THA 45,982.4 .. 200.5 16.9 5.3 3.0 .. 2.5 228.2 30.4 108.8 0.5Mongolia MNG 1,577.6 .. 2.1 2.7 0.3 .. .. 1.3 6.4 0.3 .. 0.4Laos LAO 2,495.0 - 7.0 0.1 0.2 - .. - 7.3 0.2 2.9 0.3Sri Lanka LKA 11,713.2 0.3 15.0 1.7 0.3 0.2 .. 1.2 18.6 2.9 20.5 0.2Indonesia IDN 139,970.8 .. 5.3 0.9 .. 0.5 .. 11.5 18.2 3.3 38.4 0.0EuropeLuxembourg LUX 356.3 5.3 3.6 117.3 1.1 0.1 1.4 0.9 129.8 110.3 1.6 36.6Switzerland CHE 6,043.4 61.6 93.5 1,131.2 24.5 4.2 50.1 89.0 1,454.2 910.7 250.8 25.1Estonia USSR-EST 1,121.6 - 8.4 234.3 0.2 - 0.1 .. 243.0 3.2 8.8 21.8Latvia USSR-LVA 1,761.4 0.1 15.3 353.1 0.2 0.1 0.2 .. 369.0 4.8 0.1 20.9Croatia FYUG-HRV 3,682.8 0.4 0.7 554.7 1.1 0.7 0.5 .. 558.1 16.8 20.4 15.2Sweden SWE 6,463.9 56.5 224.7 579.7 13.7 3.1 56.1 .. 933.8 446.0 0.5 14.4Austria AUT 6,679.4 22.4 59.0 823.1 7.6 1.8 9.7 .. 923.7 461.6 0.8 13.8Serbia FYUG-YUG 6,321.2 0.4 1.0 858.9 0.1 0.3 0.2 .. 861.0 18.4 9.3 13.6Germany DEU 68,113.6 177.6 965.9 5,370.2 39.1 .. 52.8 1,226.5 7,832.0 3,276.0 5,272.3 12.5Belgium BEL 8,491.5 232.4 62.3 689.2 14.1 1.3 20.0 - 1,019.3 674.2 0.5 12.0France FRA 48,068.4 2,745.3 432.8 2,282.8 48.5 5.6 85.1 .. 5,600.2 2,222.4 .. 11.7Belarus USSR-BLR 9,152.4 0.4 111.6 952.0 0.2 - 0.5 .. 1,064.6 30.8 4.4 11.6Netherlands NLD 12,733.4 213.9 323.4 529.5 14.1 8.7 291.4 39.0 1,419.9 410.6 40.3 11.2Ireland IRL 3,034.6 21.5 25.0 258.9 18.0 6.4 2.9 0.3 333.0 267.3 .. 11.0Greece GRC 9,273.2 51.0 83.8 807.9 31.0 20.0 6.2 .. 999.9 282.4 1.1 10.8Slovenia FYUG-SVN 1,663.9 0.3 0.5 162.7 0.5 0.2 0.3 .. 164.4 14.3 .. 9.9United Kingdom GBR 47,684.5 762.6 1,475.4 1,552.0 193.3 156.8 324.1 39.3 4,503.5 1,738.1 .. 9.4
Source: DIOC-E 2000 (release 2.0)
Region of originPopulation with
unknown place of birth
Proportion of foreign-born in the population
(%)
Note: "-" no observations; ".." below 1,000 observations; "ns" only countries of birth in Africa were surveyed;
Country of residence

DELSA/ELSA/WD/SEM(2010)14
14
Table 2. Foreign-born population aged 15 and over by country of residence and region of origin, in thousands, circa 2000 (cont.)
Country of residence
Total population Africa Asia Europe North America Oceania
South, Central America and the Carribean Unspecified Total
of which: OECD countries
EuropeRussia USSR-RUS 119,893.1 13.2 5,167.6 5,504.2 2.1 4.2 7.8 9.5 10,708.5 220.5 .. 8.9Norway NOR 3,666.9 28.9 93.2 153.1 15.1 1.4 13.8 0.4 305.9 139.0 .. 8.3Denmark DNK 4,358.6 26.0 96.5 177.7 9.7 1.9 7.5 .. 319.3 160.0 23.1 7.4Lithuania USSR-LTU 2,804.0 - 11.8 185.2 0.9 0.0 0.2 .. 198.2 6.7 21.9 7.1Portugal PRT 8,699.5 332.4 15.7 159.7 10.4 0.9 66.9 .. 585.9 151.0 .. 6.7Spain ESP 34,848.1 372.1 79.3 715.0 19.9 3.7 724.9 .. 1,914.9 616.7 3.2 5.5Czech Republic CSFR-CZE 8,571.7 1.8 20.7 405.8 2.0 0.3 1.4 4.9 437.0 337.6 171.6 5.2Italy ITA 48,892.6 407.5 188.8 1,119.2 68.0 18.0 219.5 .. 2,020.9 790.6 .. 4.1Hungary HUN 8,503.4 1.8 10.3 259.7 2.5 0.2 1.0 .. 275.5 65.1 - 3.2Slovak Republic CSFR-SVK 4,316.4 0.3 1.4 110.4 0.9 - 0.2 .. 113.2 96.2 405.5 2.9Finland FIN 4,244.6 8.1 15.1 83.5 3.6 0.6 1.6 .. 112.4 45.7 4.5 2.7Poland POL 31,288.4 2.0 9.6 703.4 5.8 0.3 1.1 15.5 737.7 148.4 516.5 2.4Turkey TUR 47,583.8 4.3 71.9 1,033.4 10.8 1.9 .. 8.3 1,130.6 390.7 12.3 2.4Georgia USSR-GEO 3,455.6 - 20.5 46.1 - - 0.1 - 66.8 1.2 2.5 1.9Romania ROU 17,581.4 .. 13.3 94.6 1.0 .. .. 8.5 117.4 18.6 0.8 0.7Bulgaria BGR 6,712.1 0.4 5.2 23.7 0.3 - 0.2 .. 29.7 6.8 0.1 0.4North AmericaCanada CAN 23,900.8 277.5 1,886.9 2,306.7 246.4 50.0 587.5 0.3 5,355.2 2,371.9 .. 22.4United States USA 217,165.2 838.2 7,831.8 5,429.6 868.8 255.6 16,165.3 0.6 31,389.9 14,732.0 .. 14.5OceaniaAustralia AUS 14,856.8 166.1 1,043.1 2,098.1 70.4 407.0 74.3 1.2 3,860.2 2,242.6 745.2 27.4New Zealand NZL 2,889.6 30.0 153.2 270.2 17.9 148.6 4.1 .. 624.1 341.4 119.9 22.5South and Central America and the CarribeanBelize BLZ 137.3 0.1 1.8 0.4 1.5 - 25.4 0.1 29.3 4.0 0.1 21.3Puerto Rico PRI 2,905.0 0.1 3.2 8.7 184.0 0.1 99.9 .. 296.0 195.5 .. 10.2Costa Rica CRI 2,593.4 0.1 4.3 7.6 7.8 - 225.5 .. 245.3 17.1 .. 9.5Venezuela VEN 15,426.7 2.2 33.8 194.2 7.8 .. 907.0 .. 1,145.1 201.7 12.8 7.4Argentina ARG 26,012.4 1.8 27.9 426.2 8.9 0.6 969.2 23.0 1,457.5 420.1 .. 5.6Paraguay PRY 3,247.9 0.2 7.2 5.4 2.1 - 129.8 .. 144.7 13.2 36.7 4.5Trinidad Tobago TTO 830.5 .. 0.6 1.7 1.0 .. 28.0 5.3 36.6 2.6 1.3 4.4Panama PAN 1,930.1 0.3 15.6 5.6 3.9 0.1 48.4 .. 73.7 11.1 1.7 3.8Uruguay URY 2,364.9 0.2 1.8 40.4 1.1 0.2 35.1 0.1 78.9 39.9 .. 3.3Dominican Republic DOM 5,657.7 0.2 2.3 8.1 2.3 - 69.5 .. 82.3 11.0 356.0 1.6Chile CHL 11,226.3 1.2 7.3 30.5 7.8 1.2 112.2 2.4 162.6 40.3 217.0 1.5Bolivia BOL 5,076.7 .. 2.6 6.0 3.7 0.2 50.3 2.9 65.7 19.6 .. 1.3Ecuador ECU 8,116.6 0.3 3.5 10.5 7.1 0.2 64.6 0.9 86.9 18.1 12.5 1.1Jamaica JAM 1,754.1 .. 1.6 3.2 2.4 .. .. 7.8 15.0 5.6 3.3 0.9El Salvador SLV 3,797.1 - 0.5 1.3 2.3 - 25.9 0.0 30.1 5.0 .. 0.8Nicaragua NIC 3,213.9 - 0.4 1.5 1.9 - 17.5 1.2 22.5 3.9 .. 0.7Honduras HND 3,524.4 - 1.0 1.2 2.3 - 17.6 0.3 22.5 4.3 .. 0.6Guatemala GTM 6,487.2 0.1 1.8 2.2 2.7 - 28.8 .. 35.5 9.9 - 0.5Brazil BRA 119,548.9 14.8 115.3 380.0 10.0 0.4 129.7 1.0 651.2 444.2 .. 0.5Mexico MEX 62,842.6 0.8 9.9 44.7 112.2 0.6 73.1 0.2 241.5 157.4 174.3 0.4Peru PER 19,054.6 0.3 6.8 16.3 6.8 0.6 29.4 .. 60.3 25.3 .. 0.3Columbia COL 28,720.2 0.5 3.7 12.5 6.3 0.6 50.0 2.0 75.6 20.1 553.7 0.3Cuba CUB 8,885.0 .. 0.4 7.1 0.6 0.4 1.6 4.5 14.6 5.8 .. 0.2Total OECD 851,796.1 6,853.1 16,145.6 29,239.2 1,909.2 1,107.1 19,035.5 1,426.3 75,715.9 33,652.6 8,918.2 8.9Total non-OECD 1,531,827.3 3,230.8 14,663.0 11,784.2 410.0 51.5 3,158.7 1,102.7 34,400.8 2,615.7 4,786.1 2.3Total 2,383,623.4 10,083.9 30,808.5 41,023.4 2,319.1 1,158.6 22,194.1 2,529.0 110,116.7 36,268.3 13,704.3 4.6
Source: DIOC-E 2000 (release 2.0)Note: "-" no observations; ".." below 1,000 observations; "ns" only countries of birth in Africa were surveyed;
Region of originPopulation with
unknown place of birth
Proportion of foreign-born in the population
(%)

DELSA/ELSA/WD/SEM(2010)14
15
2. An overview of worldwide migration circa 2000 based on DIOC-E
15. This section offers a descriptive picture of worldwide migration circa 2000 as drawn from DIOC-E (release 2.0). It first looks at the main characteristics of migrant stocks in destination countries and subsequently analyses migrant groups by country and region of origin.
2.1 Immigrant populations by countries of residence: size and characteristics
16. The extension of the database provides important insights on the geographical distribution of migrants worldwide, both in absolute and relative terms. As shown in Table 2, while a couple of OECD countries host a significant share of world migrants (USA: 31.4 million; Germany: 7.8 million; France: 5.6 million; Canada: 5.3 million), several non-OECD countries now included in the database also have very large foreign-born populations (Russia: 11 million; India: 6 million; Israel: 1.8 million). In relative terms, high shares of immigrants are recorded in several OECD countries (Luxembourg: 37%; Australia: 27%; Switzerland: 25%; New Zealand: 23%), but also among non-OECD countries: Singapore (23%), Estonia (22%), Belize (21%) and Latvia (21%). Israel, which joint the OECD in 2010, reports the highest share of immigrants among the receiving countries included in the database (40%). Some countries, however, have a very low share of foreign-born in their population (below 1%), such as Indonesia, Sri Lanka, Cuba, Colombia, Laos, Peru, Mongolia, Bulgaria and Thailand. Among OECD countries, the lowest shares of immigrants are observed in Mexico (0.4%) and Japan (1.1%).
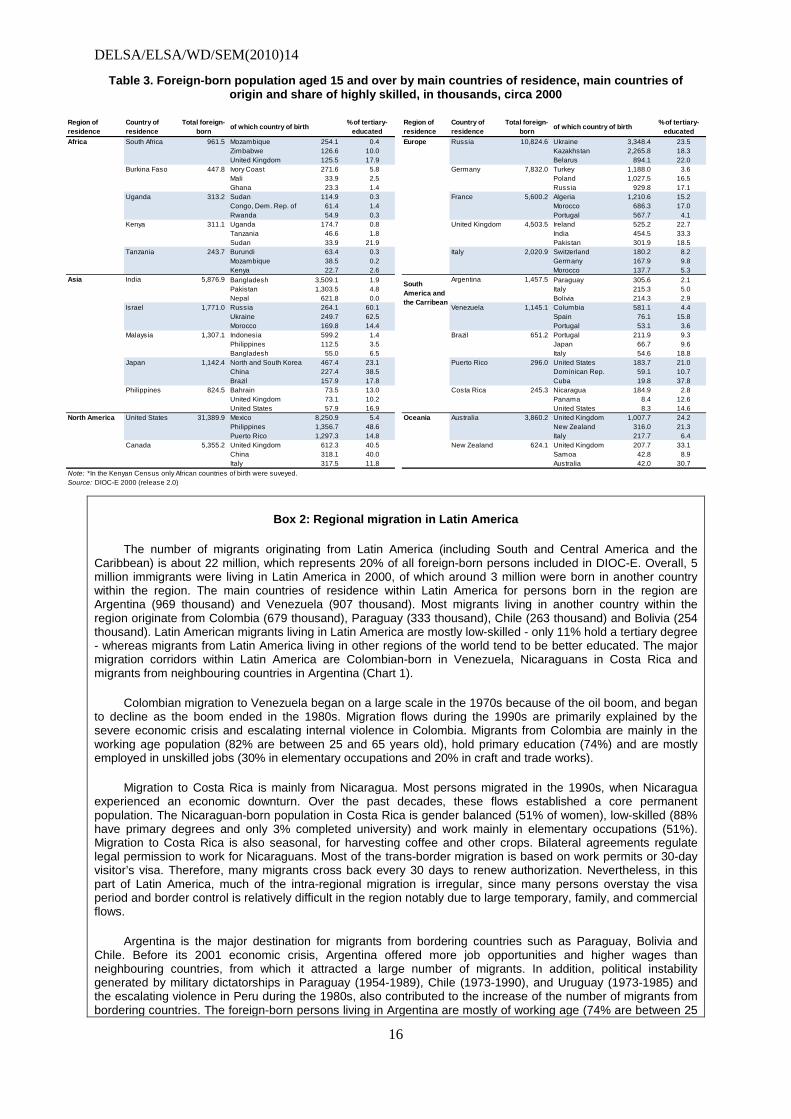
17. A closer look at countries of origin and destination shows that a large share of migrants comes from relatively nearby countries. In the African countries currently included in the database almost 85% of migrants come from other African countries, while this percentage reaches 75% in Asia and 62% in Latin America. Europe also receives a significant share of migrants from within the region (59%). Table 3 shows the main origin countries of migrants in a selection of key destination countries and further illustrates this pattern. It also documents important exceptions that stem in particular from historical ties. DIOC-E clearly opens new possibilities to analyse regional migration systems outside the OECD-area. Box 2 provides some insights on migration within Latin America, while Box 3 discusses the case of migration in countries of the former USSR.
DELSA/ELSA/WD/SEM(2010)14
16
Table 3. Foreign-born population aged 15 and over by main countries of residence, main countries of origin and share of highly skilled, in thousands, circa 2000
Africa South Africa 961.5 Mozambique 254.1 0.4 Europe Russia 10,824.6 Ukraine 3,348.4 23.5Zimbabwe 126.6 10.0 Kazakhstan 2,265.8 18.3United Kingdom 125.5 17.9 Belarus 894.1 22.0
Burkina Faso 447.8 Ivory Coast 271.6 5.8 Germany 7,832.0 Turkey 1,188.0 3.6Mali 33.9 2.5 Poland 1,027.5 16.5Ghana 23.3 1.4 Russia 929.8 17.1
Uganda 313.2 Sudan 114.9 0.3 France 5,600.2 Algeria 1,210.6 15.2Congo, Dem. Rep. of 61.4 1.4 Morocco 686.3 17.0Rwanda 54.9 0.3 Portugal 567.7 4.1
Kenya 311.1 Uganda 174.7 0.8 United Kingdom 4,503.5 Ireland 525.2 22.7Tanzania 46.6 1.8 India 454.5 33.3Sudan 33.9 21.9 Pakistan 301.9 18.5
Tanzania 243.7 Burundi 63.4 0.3 Italy 2,020.9 Switzerland 180.2 8.2Mozambique 38.5 0.2 Germany 167.9 9.8Kenya 22.7 2.6 Morocco 137.7 5.3
Asia India 5,876.9 Bangladesh 3,509.1 1.9 Argentina 1,457.5 Paraguay 305.6 2.1Pakistan 1,303.5 4.8 Italy 215.3 5.0Nepal 621.8 0.0 Bolivia 214.3 2.9
Israel 1,771.0 Russia 264.1 60.1 Venezuela 1,145.1 Columbia 581.1 4.4Ukraine 249.7 62.5 Spain 76.1 15.8Morocco 169.8 14.4 Portugal 53.1 3.6
Malaysia 1,307.1 Indonesia 599.2 1.4 Brazil 651.2 Portugal 211.9 9.3Philippines 112.5 3.5 Japan 66.7 9.6Bangladesh 55.0 6.5 Italy 54.6 18.8
Japan 1,142.4 North and South Korea 467.4 23.1 Puerto Rico 296.0 United States 183.7 21.0China 227.4 38.5 Dominican Rep. 59.1 10.7Brazil 157.9 17.8 Cuba 19.8 37.8
Philippines 824.5 Bahrain 73.5 13.0 Costa Rica 245.3 Nicaragua 184.9 2.8United Kingdom 73.1 10.2 Panama 8.4 12.6United States 57.9 16.9 United States 8.3 14.6
North America United States 31,389.9 Mexico 8,250.9 5.4 Oceania Australia 3,860.2 United Kingdom 1,007.7 24.2Philippines 1,356.7 48.6 New Zealand 316.0 21.3Puerto Rico 1,297.3 14.8 Italy 217.7 6.4
Canada 5,355.2 United Kingdom 612.3 40.5 New Zealand 624.1 United Kingdom 207.7 33.1China 318.1 40.0 Samoa 42.8 8.9Italy 317.5 11.8 Australia 42.0 30.7
Source: DIOC-E 2000 (release 2.0)Note: *In the Kenyan Census only African countries of birth were suveyed.
Region of residence
Total foreign-born of which country of birth % of tertiary-
educatedRegion of residence
Total foreign-born of which country of birth % of tertiary-
educatedCountry of residence
Country of residence
South America and the Carribean
Box 2: Regional migration in Latin America
The number of migrants originating from Latin America (including South and Central America and the Caribbean) is about 22 million, which represents 20% of all foreign-born persons included in DIOC-E. Overall, 5 million immigrants were living in Latin America in 2000, of which around 3 million were born in another country within the region. The main countries of residence within Latin America for persons born in the region are Argentina (969 thousand) and Venezuela (907 thousand). Most migrants living in another country within the region originate from Colombia (679 thousand), Paraguay (333 thousand), Chile (263 thousand) and Bolivia (254 thousand). Latin American migrants living in Latin America are mostly low-skilled - only 11% hold a tertiary degree - whereas migrants from Latin America living in other regions of the world tend to be better educated. The major migration corridors within Latin America are Colombian-born in Venezuela, Nicaraguans in Costa Rica and migrants from neighbouring countries in Argentina (Chart 1).
Colombian migration to Venezuela began on a large scale in the 1970s because of the oil boom, and began to decline as the boom ended in the 1980s. Migration flows during the 1990s are primarily explained by the severe economic crisis and escalating internal violence in Colombia. Migrants from Colombia are mainly in the working age population (82% are between 25 and 65 years old), hold primary education (74%) and are mostly employed in unskilled jobs (30% in elementary occupations and 20% in craft and trade works).
Migration to Costa Rica is mainly from Nicaragua. Most persons migrated in the 1990s, when Nicaragua experienced an economic downturn. Over the past decades, these flows established a core permanent population. The Nicaraguan-born population in Costa Rica is gender balanced (51% of women), low-skilled (88% have primary degrees and only 3% completed university) and work mainly in elementary occupations (51%). Migration to Costa Rica is also seasonal, for harvesting coffee and other crops. Bilateral agreements regulate legal permission to work for Nicaraguans. Most of the trans-border migration is based on work permits or 30-day visitor’s visa. Therefore, many migrants cross back every 30 days to renew authorization. Nevertheless, in this part of Latin America, much of the intra-regional migration is irregular, since many persons overstay the visa period and border control is relatively difficult in the region notably due to large temporary, family, and commercial flows.
Argentina is the major destination for migrants from bordering countries such as Paraguay, Bolivia and Chile. Before its 2001 economic crisis, Argentina offered more job opportunities and higher wages than neighbouring countries, from which it attracted a large number of migrants. In addition, political instability generated by military dictatorships in Paraguay (1954-1989), Chile (1973-1990), and Uruguay (1973-1985) and the escalating violence in Peru during the 1980s, also contributed to the increase of the number of migrants from bordering countries. The foreign-born persons living in Argentina are mostly of working age (74% are between 25

DELSA/ELSA/WD/SEM(2010)14
17
and 65 years old), women (53%) and low educated (81% have only primary education). Migrants from the region are essentially employed in domestic services, tourism and construction, with the exception of the Bolivian-born, who are for the most part agricultural workers in the sugar harvests.
Chart 1: Share of Latin American migrants of all intraregional migrants in Argentina, Venezuela and Costa Rica, by country of origin,
population aged 15 and over, circa 2000
Source: DIOC-E 2000 (release 2.0)
Paraguay
Bolivia
Chile
Uruguay
Peru
Brazil
Colombia
PeruEcuador
Nicaragua
PanamaEl Salvador
Cuba
Other SCAC
Other SCAC
0%
10%
20%
30%
40%
50%
60%
70%
80%
90%
100%
Argentina Venezuela Costa Rica

DELSA/ELSA/WD/SEM(2010)14
18
Box 3: Regional migration in the former USSR
Intraregional mobility dominates international migration for countries of the former USSR. Around 94% of all migrants in the region originate from other countries of the former USSR. The main receiving countries are Russia with around 10 million migrants and Belarus with 1 million migrants (Table 4). In the Russian Federation, most of the foreign-born persons originate from Ukraine and Kazakhstan. In all other receiving countries, Russian-born persons account for the major share of foreign-born persons. Overall, the largest emigrant populations in the region of the former USSR are represented by persons born in Ukraine (3.7 million), Kazakhstan (2.4 million), Russia (1.3 million) and Belarus (1 million).
Due to historical reasons, determining migration patterns within this region is not easy and interpretations have to be made with caution, since the country of birth does not necessarily reflect the country of nationality and origin of migrants in the former USSR. Before 1991, persons moved within the USSR to a large extent for family reasons or for employment. After 1991, intraregional migration was mainly dominated by so-called “repatriates”, i.e. many persons moved back to their “country of origin”. After 1995, migration of persons of Russian origin to Russia decreased significantly, whereas flows of “repatriates” to other countries persisted, although at a relatively low level. In the Russian Federation in 2002 for instance, 63% of foreign-born persons migrated before 1992, 28% from 1992 to 2002 and only 9% of all foreign-born persons were recent immigrants, i.e. foreign-born persons who arrived between 1997 and 2002.
In general, the distribution by country of origin of the immigrant population has not changed significantly over time, but the relative importance of the different countries has changed. In the Russian Federation, for instance, around 50% of all recent immigrants, i.e. foreign-born persons who arrived between 1997 and 2002, originated mainly from Kazakhstan (27%) and Ukraine (23%), whereas the share of persons born in Ukraine who arrived before 1992 was around 39% and the share of persons from Kazakhstan only 18%. Further, migration from countries outside the former USSR is still minimal. Only 4% of all foreign-born persons living in Russia originate from countries outside the region. These persons mainly come from Germany (131 700 immigrants), China (58 900 immigrants) and Poland (30 200 immigrants).
Migration within the region is quite specific as most migrants are women of working age. On average, around 20% of migrants hold a tertiary degree, but this percentage reaches 30% for migrants coming from Estonia, Latvia and Turkmenistan. Inversely, 28% of migrants from Belarus and Lithuania are low-skilled.
International migration out of the region is important for some migrant groups. This is the case notably for Russian-born migrants and Lithuanian-born migrants, of which 58% and 55% respectively live outside the region. Out of the nearly 1.8 million Russian-born in this situation, around 50% live in Germany, 15% in the United States and 15% in Israel. Ukrainian-born persons living outside the region (1 million, but only 22% of all Ukrainian emigrants) tend to go to different countries, and notably to Poland for about a third of them. Israel and the United States are also important destinations with 23% of Ukrainian migrants each.
Table 4: Foreign-born population aged 15 and over by country of origin and country of residence in the former USSR region, circa 2000
Countries of origin Armenia Belarus Estonia Georgia Kyrgyz Republic Lithuania Latvia Russian Federation Total Total in DIOC-EFormer USSR 22.8 - - - - - - - 22.8 114.0 Armenia - 4.7 0.6 11.8 0.6 0.6 0.8 370.9 389.9 474.5 Azerbaijan 139.8 12.6 1.4 5.5 1.9 1.3 2.4 728.1 893.0 951.7 Belarus 0.5 - 14.8 1.0 2.5 55.7 68.8 894.1 1,037.2 1,242.2 Estonia - 3.7 - 0.1 - 1.0 3.1 60.1 68.1 105.4 Georgia 64.4 7.6 1.5 - 3.6 0.9 1.5 547.5 627.0 758.2 Kazakhstan 1.1 63.3 3.8 1.5 75.7 6.4 6.9 2,265.8 2,424.5 2,857.2 Kyrgyz Republic 0.1 4.8 0.6 0.2 - 0.6 1.0 404.2 411.5 449.6 Lithuania 0.1 15.8 2.1 0.2 - - 24.6 79.7 122.4 271.3 Latvia 0.1 13.2 4.2 0.2 - 7.9 - 90.5 116.1 179.7 Macedonia 0.3 6.9 0.9 0.4 0.7 0.8 1.8 248.4 260.2 374.7 Russian Federation - 656.0 183.0 33.6 155.7 93.5 204.7 - 1,326.4 3,158.3 Tajikistan 0.3 4.9 0.4 0.1 21.8 0.5 0.6 324.7 353.3 370.9 Turkmenistan 1.2 4.9 0.4 0.2 2.0 0.4 0.7 152.6 162.2 169.7 Ukraine 3.5 217.2 24.9 9.1 13.5 19.6 44.1 3,348.4 3,680.1 4,730.8 Uzbekistan 1.6 13.3 1.1 0.7 60.3 1.6 2.2 774.5 855.2 955.9 Total 235.9 1,028.9 239.3 64.6 338.1 190.6 363.1 10,289.4 12,749.8 17,050.0 Other countries of birth 32.5 35.7 3.7 2.2 16.6 7.6 5.9 419.2 523.4 92,952.7 Total foreign-born population 268.4 1,064.6 243.0 66.8 354.7 198.2 369.0 10,708.5 13,273.2 110,116.7
Countries of residence
Note: "-" no observationsSource: DIOC-E 2000 (release 2.0)
18. In most receiving countries, the age structure of immigrants differs significantly from the age structure of the native-born. In general, the foreign-born are overrepresented in the working age group (25-64) and underrepresented in the age groups 15-24 and 65+ (Chart 2). This can be explained by the

DELSA/ELSA/WD/SEM(2010)14
19
relative importance of labour migration, by the average age of immigrants entering through family reunification programmes, as well as by the age selection associated with return migration occurring in relation to retirement. In general, migrants tend to be younger in non-OECD countries. There are, however, significant differences in the age structure of the foreign-born across receiving countries: in Eastern and Central European countries, for example, the share of older immigrants (aged 65 and over) is in general much higher than the share of young immigrants (aged 15-24), whereas in most African countries young foreign-born persons make up the largest group.
19. Chart 2 also presents the gender distribution of migration by country of residence. On average 51% of migrants are women, slightly less in non-OECD countries (49%) and significantly more in selected countries, notably in the former USSR and Nepal. In contrast, women represent a particularly low share of migration to South Africa, Indonesia, Jordan and the Dominican Republic. There are indeed large variations in the share of migrant women across non-OECD countries, with no clear relationship with the age distribution of migrants, which would be interesting to further investigate.
Chart 2: Share of 15-24 year old persons and women of foreign-born population aged 15 and over by country of residence, circa 2000
Note: On average, for the 89 countries included in DIOC-E, 25% of the native-born is aged 15 to 24Source: DIOC-E 2000 (release 2.0)
ARG
BEN
BFA
BGRBLZ
BRA
CRI
CUB
DOM
GIN
GMB GTM
IDN
IND
IRQ
JAM
JOR KEN
LAOLKA
MLI
MNG
MUSMYS
NIC
NPL
PER
RWA
SEN
SLV
SYC
THA
TTO
TZA
URYUSSR-ARM
USSR-BLRUSSR-EST
USSR-GEO
USSR-KGZUSSR-LTU
USSR-LVA
ZAF
-10%
0%
10%
20%
30%
40%
50%
60%
35% 40% 45% 50% 55% 60% 65% 70% 75% 80%
Shar
e of
15-
24 y
ears
old
Share of women
non-OECD countries OECD countries
20. With regard to the educational attainment of migrants, Chart 3 reveals that in virtually all destination countries the share of migrants having tertiary education is higher than that of the native-born. This was already well documented for OECD countries (see OECD, 2008), but the extended database shows that it is also true for non-OECD countries. There are however some exceptions, such as Germany and Finland, as well as Malaysia, Laos, Argentina and India. The higher skill levels of migrants in most receiving countries reflect the selective nature of migration, either due to self-selection or to selective immigration policies. This feature tends to be more pronounced in OECD countries, where 24% of migrants are tertiary educated, compared to about 15% in non-OECD countries.
21. In almost all destination countries, however, the absolute number of migrants that have at most a primary education level is higher than that of those who hold a university diploma. Notable exceptions include Canada, Israel, Ireland, Japan, Norway, New Zealand and countries of the former USSR. In total there are 46.8 million low-skilled migrants (43.6%), 37.5 million migrants with intermediate skill level (35%) and 23 million highly skilled migrants (21.5%).
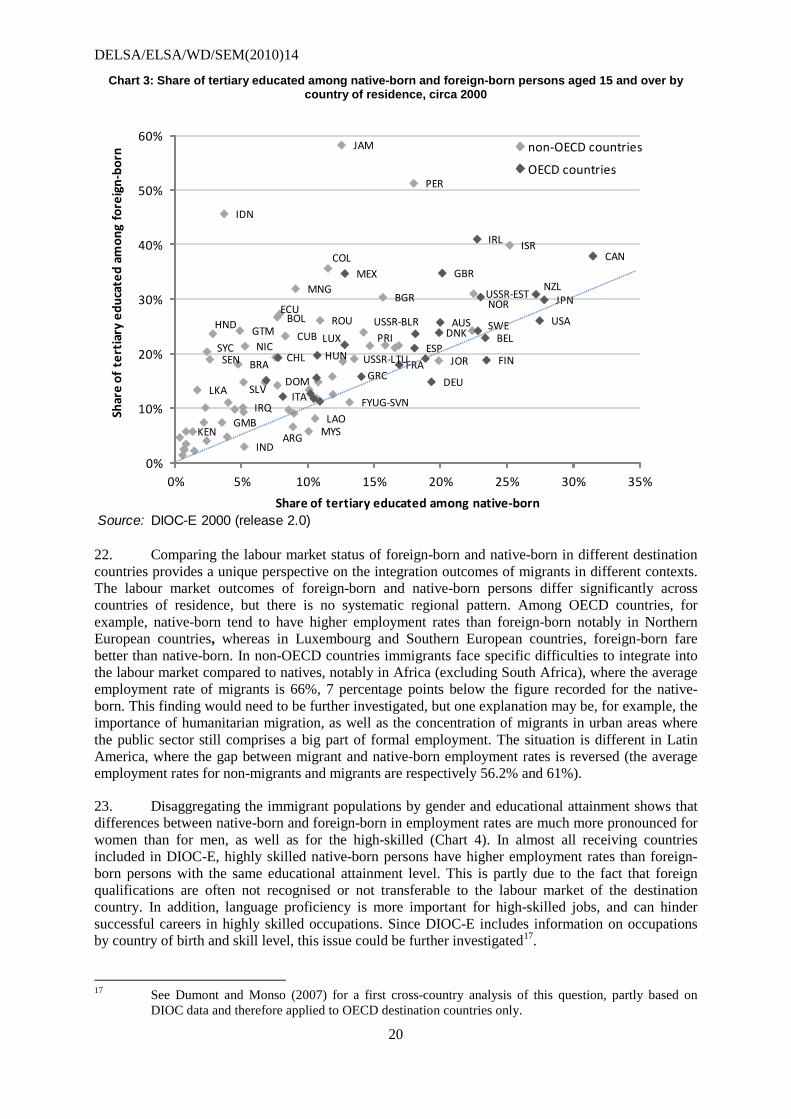
DELSA/ELSA/WD/SEM(2010)14
20
Chart 3: Share of tertiary educated among native-born and foreign-born persons aged 15 and over by country of residence, circa 2000
Source: DIOC-E 2000 (release 2.0)
ARG
BGR
BOL
BRACHL
COL
CUB
DOM
ECU
FYUG-SVN
GMB
GTMHND
IDN
IND
IRQ
ISR
JAM
JOR
KENLAO
LKA
MNG
MYS
NIC
PER
PRI
ROU
SEN
SLV
SYC
USSR-BLR
USSR-EST
USSR-LTU
AUSBEL
CAN
DEU
DNKESP
FINFRA
GBR
GRC
HUN
IRL
ITA
JPN
LUX
MEX
NOR
NZL
SWE USA
0%
10%
20%
30%
40%
50%
60%
0% 5% 10% 15% 20% 25% 30% 35%
Shar
e of
ter
tiar
y ed
ucat
ed a
mon
g fo
reig
n-bo
rn
Share of tertiary educated among native-born
non-OECD countries
OECD countries
22. Comparing the labour market status of foreign-born and native-born in different destination countries provides a unique perspective on the integration outcomes of migrants in different contexts. The labour market outcomes of foreign-born and native-born persons differ significantly across countries of residence, but there is no systematic regional pattern. Among OECD countries, for example, native-born tend to have higher employment rates than foreign-born notably in Northern European countries, whereas in Luxembourg and Southern European countries, foreign-born fare better than native-born. In non-OECD countries immigrants face specific difficulties to integrate into the labour market compared to natives, notably in Africa (excluding South Africa), where the average employment rate of migrants is 66%, 7 percentage points below the figure recorded for the native-born. This finding would need to be further investigated, but one explanation may be, for example, the importance of humanitarian migration, as well as the concentration of migrants in urban areas where the public sector still comprises a big part of formal employment. The situation is different in Latin America, where the gap between migrant and native-born employment rates is reversed (the average employment rates for non-migrants and migrants are respectively 56.2% and 61%).
23. Disaggregating the immigrant populations by gender and educational attainment shows that differences between native-born and foreign-born in employment rates are much more pronounced for women than for men, as well as for the high-skilled (Chart 4). In almost all receiving countries included in DIOC-E, highly skilled native-born persons have higher employment rates than foreign-born persons with the same educational attainment level. This is partly due to the fact that foreign qualifications are often not recognised or not transferable to the labour market of the destination country. In addition, language proficiency is more important for high-skilled jobs, and can hinder successful careers in highly skilled occupations. Since DIOC-E includes information on occupations by country of birth and skill level, this issue could be further investigated17
17 See Dumont and Monso (2007) for a first cross-country analysis of this question, partly based on
DIOC data and therefore applied to OECD destination countries only.
.

DELSA/ELSA/WD/SEM(2010)14
21
24. On the other hand, with regard to low-skilled persons, the overall differences between native-born and foreign-born seem to be smaller both between migrants and non-migrants but also between genders. For around half of the countries of residence, low-skilled foreign-born persons have higher employment rates than their native-born counterparts.
Chart 4: Differences in employment rates between native-born and foreign-born persons aged 15 and over, by gender, educational attainment and country of residence, circa 2000
Source: DIOC-E 2000 (release 2.0)
BEN
TZABFA
MUS
BELFYUG-HRV SLVFIN
IRQROUPRY LKA
POLBLZ
BEN
TZA
BFA
MNGSEN
NPL
THA
VENGINMUS
UGACSFR-CZE
SWE USSR-LVACUBBGRDNK FIN
POL
JOR
USSR-LVALUX FYUG-SVN
PANMYS
IDN
NPL
RWANOR
ZAF
JORUSSR-LVA
FYUG-SVN
LUXBRA
NLDDNK
PER
RWA
NOR
-60%
-40%
-20%
0%
20%
40%
60%
Perc
enta
ge p
oint
diff
eren
ces
in e
mpl
oym
ent
rate
s
High-skilled women High-skilled men
Low-skilled women Low-skilled men
2.2 The perspective of origin countries: emigrants and their characteristics
25. A key feature of DIOC-E is the possibility to aggregate emigrants by country of origin and to examine their characteristics. First of all, as shown in Table 5, most migrants in the database come from Europe (37%), Asia (28%) or Latin America (20%). African migrants account for only 9% of the overall migrant stock, while North America and Oceania together account for a mere 3%. Compared to the OECD-only version, the number of Asian migrants has almost doubled. This is especially due to better coverage of the Bangladesh-born and Pakistan-born populations with the inclusion of India. A large part of these movements occurred in the context of the partition of British India in 1947 but persisting migration from Bangladesh to India has also contributed to increase the migrants stock since.
26. Despite the fact that virtually all Latin American countries are now included as destination countries, the coverage of Latin American migrants has only increased modestly (by 3 million, or 17%), which reflects their concentration in the United States. This is particularly striking for Mexican migrants, whose number is virtually unchanged after the extension of DIOC to non-OECD countries. As shown in Table 6, the largest emigrant population in absolute numbers remains Mexico with over 8 million migrants living mainly in the United States. Ukraine comes second, with 4.7 million migrants, followed by Bangladesh (3.8 million), the United Kingdom (3.4 million), Germany (3.4 million) and Russia (3.1 million).
27. The 20 countries with the highest emigration rates are shown in Chart 5, distinguishing OECD and non-OECD destinations. The pattern of destinations differs largely across countries of origin. In some countries, such as Jamaica, Puerto Rico or Ireland, migrants go almost exclusively to OECD countries, while in others, such as Turkmenistan or Azerbaijan, migrants move only to non-OECD countries. Looking at the distribution of emigration rates for countries with more than one

DELSA/ELSA/WD/SEM(2010)14
22
million inhabitants, there is a non-negligible number of countries for which the numbers of emigrants to OECD and non-OECD countries are relatively similar. For most origin countries, however, the pattern of destinations is much more unbalanced: in 86 countries, emigrants to OECD countries are more than twice as numerous as emigrants to non-OECD countries, while the reverse is true in 35 countries. While the attractiveness of OECD countries stands as a key feature of the global migration system, it appears that, for many migrants, non-OECD countries constitute very common destinations. Is migration to low and middle income destination countries a second best choice or an independent strategy based on geographical, cultural proximity and historical ties? Are there any differences in terms of the development impact according to the destination of migration? The availability of this new extended bilateral migration database clearly opens up new opportunities to further investigate the determinants of destination choices of migrants.
Chart 5: Origin countries with the highest emigration rates by OECD and non-OECD destinations, population aged 15 and over, circa 2000
Source: DIOC-E 2000 (release 2.0)
0%
5%
10%
15%
20%
25%
30%
35%
Tota
l em
igra
tion
rate
OECD countries Non-OECD countries

DELSA/ELSA/WD/SEM(2010)14
23
Table 5: Characteristics of foreign-born persons aged 15 and over by regions and main countries of origin, circa 2000
Region of origin Men Women Total Men Women Total Men Women Total Men Women TotalAfrica1 5,378 4,706 10,084 46.7 16.2 18.2 17.1 52.8 58.3 55.3 21.1 16.6 19.0
North Africa 2,123 1,781 3,904 45.6 7.8 8.1 7.9 52.3 57.7 54.8 20.0 16.0 18.2Sub-Saharan Africa 2,958 2,738 5,696 48.1 22.7 25.2 23.9 54.5 59.6 57.0 21.6 17.0 19.4
Asia 15,178 15,756 30,935 50.9 15.1 14.5 14.8 37.0 44.0 40.5 26.5 23.7 25.1Bangladesh 2,064 1,790 3,855 46.4 10.0 8.5 9.3 65.7 84.7 74.6 5.6 2.0 3.9China 1,205 1,308 2,513 52.1 12.1 11.5 11.8 35.2 39.4 37.4 38.9 33.9 36.3India 1,263 1,359 2,621 51.8 12.3 14.0 13.2 29.9 47.2 38.9 49.4 34.3 41.5
South America and the Carribean 11,159 11,036 22,195 49.7 19.5 16.1 17.8 57.3 53.5 55.4 12.6 14.5 13.5Mexico 4,652 3,716 8,368 44.4 23.7 19.7 21.9 70.6 68.2 69.5 5.3 6.5 5.8
North America 1,077 1,242 2,319 53.5 16.1 14.1 15.0 19.7 20.2 20.0 43.4 40.3 41.7Oceania 563 595 1,159 51.4 15.9 16.1 16.0 27.6 30.7 29.2 28.9 29.8 29.3Europe2 19,395 21,628 41,022 52.7 10.0 9.1 9.5 35.2 40.5 38.0 23.9 21.1 22.5
EU 27 10,833 12,217 23,050 53.0 8.5 8.0 8.2 36.3 41.5 39.1 25.7 22.2 23.8Other Europe 8,384 9,225 17,609 52.4 11.8 10.4 11.1 33.8 39.1 36.6 21.5 19.7 20.6
Unspecified 1,276 1,244 2,520 49.4Total 54,026 56,207 110,233 51.0 14.6 13.3 13.9 42.0 45.2 43.6 22.3 20.6 21.4Note:
"Unspecified" corresponds to individuals not classified in any of the top-level regions of origin.Source: DIOC-E 2000 (release 2.0)
1. North Africa and Sub-Saharan Africa do not add up to total Africa due to the existence of individuals of unspecified African origin. 2. Similarly, for Europe, EU27 and Other Europe do not exactly add up to total Europe due to people of unspecified European origin.
Population (thousands) Women (%) Young (15-24) (%) Primary-educated (%) Tertiary-educated (%)

DELSA/ELSA/WD/SEM(2010)14
24
Table 6: Characteristics of the foreign-born population aged 15 and over from the 30 main countries of origin, circa 2000
Number of emigrants
(thousands)Women (%) Young (15-24) (%) Tertiary-educated
(%)
Tertiary-educated of native-born
population in origin country (%)
Mexico 8,368.4 44.4% 21.9% 5.8% 12.8%Ukraine 4,730.1 53.2% 9.4% 26.2% ..Bangladesh 3,854.5 46.4% 9.3% 3.9% ..United Kingdom 3,488.6 51.8% 6.2% 33.8% 20.1%Germany 3,401.1 56.6% 14.1% 28.8% 19.3%Russia 3,158.3 57.2% 12.4% 27.4% 15.8%Kazakhstan 2,856.9 53.1% 18.2% 18.2% ..Italy 2,723.9 47.3% 1.9% 11.9% 8.1%India 2,621.4 51.8% 13.2% 41.5% 5.2%China 2,512.9 52.1% 11.8% 36.3% ..Poland 2,264.4 55.5% 10.8% 21.9% 10.4%Turkey 2,134.8 47.5% 10.0% 7.1% 6.8%Phillipines 2,054.0 61.0% 11.7% 44.3% 10.6%Pakistan 1,992.6 46.3% 5.9% 13.7% ..Morocco 1,679.6 44.8% 12.3% 14.2% ..Portugal 1,556.7 49.0% 5.5% 6.7% 7.7%Vietnam 1,549.4 50.3% 12.4% 23.0% ..Bosnia-Herzegovina 1,431.7 51.4% 11.9% 11.2% ..Columbia 1,367.2 54.6% 13.0% 16.1% 11.5%Algeria 1,330.2 47.7% 4.3% 16.5% ..Puerto Rico 1,304.1 52.9% 12.2% 14.9% 14.6%Belarus 1,242.0 56.1% 6.1% 23.2% 14.2%United States 1,221.4 52.1% 19.9% 43.2% 27.4%France 1,204.7 55.9% 11.4% 34.4% 16.9%Serbia Montenegro 1,157.4 49.3% 12.2% 12.1% ..Romania 1,144.1 53.2% 10.9% 24.1% 10.9%Canada 1,089.6 55.4% 9.5% 40.1% 31.5%Spain 1,074.4 53.6% 4.5% 17.2% 18.0%Indonesia 996.6 47.8% 22.0% 14.1% 3.7%South Korea 985.8 57.9% 16.3% 43.8% ..Note: ".." no data availableSource: DIOC-E 2000 (release 2.0)
28. As already noted, the overall stock of migrants is gender balanced: the share of women among migrants is 51% overall, which is close to the world population average of 50%. There are however significant differences across continents, and even wider ones when looking at specific regions or countries. Women are particularly overrepresented among North American and European migrants, while they are much underrepresented among African migrants, especially North-Africans (Table 5).
29. There are also large differences in the age structure of the migrant populations across regions of origin. Overall, younger migrants (aged 15-24) make up about 14% of the total 15+ migrant population. The share of youth is by far highest among Sub-Saharan African and Mexican migrants (more than 20%), while it is lowest among North African or European migrants (less than 10%). These large differences reflect both differences in the demographic structure of flows and changes in the relative weight of the different origin countries in global migration. For example, the large share of youth among Sub-Saharan African migrants illustrates the recent dynamic of intra-regional migration. In contrast migration from Southern European countries peaked several decades ago, which implies a much smaller share of young migrants. Massive migration in the context of specific historical events may also have contributed to shape the age structure of migrants, as is the case for example for people born in Algeria (most of whom are living in France) or people born in Pakistan and Bangladesh (most of whom are living in India).
30. The age structure of migration can also be affected by the nature of the migration movements. For instance temporary or circular migration will generate a very different age structure of the migrant population compared to settlement migration. In this regard it would be interesting to further investigate

DELSA/ELSA/WD/SEM(2010)14
25
and compare migration from Indonesia (mainly to Malaysia), from Mexico (mainly to the United States) and from Kazakhstan (mainly to the Russian Federation), which all indicate large shares of young migrants in very different contexts.
31. Regarding the educational attainment of migrants, there are significant differences across origins. Overall, about 44% of migrants only have only a primary education level and 21% are tertiary educated, but the regional figures range from 20% primary and 42% tertiary for North American migrants to 55% primary and 14% tertiary for Latin American migrants. There is also a large heterogeneity within regions, even for neighbouring origin countries. Indian and Bangladeshi migrants, for example, are strikingly different in terms of education. While more than 40% of Indian migrants have a tertiary education, this is only the case for about 4% of the Bangladesh-born. In this example, several factors are at play, which are also valid more generally. First, there is obviously an age effect: more recent (or younger) migrants tend to be better educated because they belong to generations which generally have had better schooling opportunities. Second, the main countries of destination of migrants also matter, as some countries have very selective migration policies while others do not. In the above case, the share of Bangladeshi migrants that are tertiary educated is overall very low, but varies widely: less than 2% in India, more than 45% in the United States. In general, the emigrant populations with the highest share of tertiary educated live mostly in the United States, Canada and the United Kingdom.
32. These examples illustrate the benefits of extending the coverage of this database to non-OECD countries. Broader coverage reveals the often overlooked historical and country-specific nature of the formation of migrant populations in developing and emerging countries. It also highlights the selectivity of migration from the poorest areas to the richest countries. This issue is further elaborated in the following sections.
3. New emigration rates and “brain drain” estimates
33. DIOC and DIOC-E provide information on persons by country of birth for more than 200 countries of origin, which allows calculation of emigration rates by gender, age and educational attainment for a large number of countries. This section presents new estimates of global emigration rates and “brain drain” (the emigration rate of persons holding tertiary degrees) to OECD and non-OECD countries. The emigration rate of a given origin country i in a given year is defined as the share of the native population of country i residing abroad at this time:
mi = Mi/(Mi+Ni)
where Mi is the emigrant population from country i living abroad, and Ni is the native non-migrant population of country i. Similarly, the emigration rate of the tertiary educated is the share of high-skilled natives living abroad:
mi3 = Mi3/(Mi3+Ni3)
where Mi3 and Ni3 are respectively the number of tertiary educated emigrants and native non-migrants.
34. In order to compute emigration rates for highly skilled people, two types of information are therefore necessary: (i) the number of emigrants by skill level and country of origin, (ii) the native population by education level in the countries of origin. Most of the time, however, due to the lack of appropriate data, emigration rates are calculated without separating the native-born and foreign-born populations in origin countries, approximating the native non-migrant population by the total resident population of origin countries Pi, i.e. including immigrants (Pi3 for tertiary educated).
35. The extension of the database on immigrants provides a unique opportunity to improve emigration rate estimates. The new emigration rates for the highly skilled presented in this paper differ from previous calculations due to three improvements. First, DIOC-E includes non-OECD receiving countries, which triples the number of destination countries from 28 to 89, leading to a much more diverse set of countries and a much larger number of immigrants than the OECD-only dataset. Since virtually no country holds reliable (and comparable) information on its population living abroad, estimates of Mi are derived from data on immigrants living in a more or less narrow set of countries, usually OECD countries, which host about 50% of world migrants. Previous estimates based on DIOC or

DELSA/ELSA/WD/SEM(2010)14
26
the Docquier-Marfouk database were based on this restriction (e.g. Dumont and Lemaitre, 2005; Docquier et al., 2006, OECD, 2008). With DIOC-E, we considerably extend the coverage of destination countries, and are therefore able to greatly improve the estimation of Mi.
36. Second, previous calculations of “brain drain” used the education dataset of Barro and Lee (2001) to determine the number of tertiary educated persons in the countries of origin. In this paper, the underlying education data of origin countries is mainly derived from DIOC-E itself, since it provides direct estimates of the educational structure of the population for 89 countries. The education data in DIOC-E seems to be more reliable than previous efforts to gather information on the skill level in many different countries, since extensive adjustments to international classifications were made in order to obtain internationally comparable education data. Nevertheless, for the other countries, we rely on two additional sources of data. The first is the revision of the Barro and Lee database (2010), which is considerably improved in both coverage (146 instead of 107 countries) and reliability compared to the previous version. This dataset is used for 62 countries. The second one is the Lutz et al. (2007) database covering 120 countries, which is applied to 10 additional countries covered neither by DIOC-E nor the new Barro-Lee data. In total, we are able to calculate emigration rates for tertiary educated persons for 161 countries, which represents the largest collection of “brain drain” estimates based on actual data (and not extrapolations) until now.
37. The third improvement of DIOC-E is the possibility to distinguish foreign-born and native-born persons for many origin countries (those included as destination countries in DIOC-E). Our final set of estimates comprises two versions of the total emigration rates and two versions of the emigration rates for the highly skilled: one that includes immigrants in the native-born population of the countries of origin, i.e. uses the approximation with the total resident population (m'i = Mi/(Mi+Pi), labelled version 1), and one that makes the distinction between native residents and immigrants (mi = Mi/(Mi+Ni), labelled version 2), which is more accurate but only available for a subset of countries.
Table 7: Emigration rates by income groups and regions of the countries of origin, population aged 15 and over, circa 2000
Total (%) Tertiary- educated (%) Total (%) Tertiary-
educated (%) Total (%) Tertiary-educated (%)
World 2.38 5.44 1.65 4.29 0.76 1.26
High income 3.05 3.80 2.73 3.50 0.33 0.32Upper-middle income 4.41 6.91 3.98 6.20 0.46 0.82Lower-middle income 2.02 6.67 1.38 5.05 0.66 1.80Low income 1.73 6.28 0.61 3.79 1.13 2.11
Africa 2.00 10.56 1.37 9.67 0.64 1.09Asia 1.16 4.32 0.60 3.45 0.57 0.94Europe 5.80 7.81 4.18 5.55 1.76 2.54Latin America 5.70 8.79 4.95 7.88 0.83 1.07North America 0.92 1.38 0.76 1.20 0.16 0.19Oceania 4.52 7.21 4.37 7.00 0.17 0.24
Global emigration rates Emigration rates to OECD countries
Emigration rates to non OECD countries
Note: Income groups according to the World Bank classification of 2000.Source: DIOC-E 2000 (release 2.0) 38. Table 7 gives an overview of emigration rates by regions and income groups in 2000. The global emigration rate of 2.4% (all skill levels) masks significant regional differences: Europe, Latin America and Oceania have the highest emigration rates, while Africa, Asia and North America have migration rates less than half that of the former regions. As shown in Table A1, however, total emigration rates vary largely across countries even within the same region.

DELSA/ELSA/WD/SEM(2010)14
27
39. In all regions, the emigration rate for the tertiary educated is significantly higher than the total emigration rate. As shown in Chart 6, this is also true for a large majority of individual countries. The difference between the highly skilled emigration rate and the total emigration rate is especially high for African and Asian countries. A noteworthy fact is the high emigration rate of highly skilled persons born in Africa (10.6%) compared to other regions of origin of the world (5.4% on world average). Relatively high emigration of highly skilled persons born in Latin America is also observed at 8.8%. Corresponding figures for migration to the OECD are respectively 9.7% and 7.8% for persons born in Africa and Latin America compared to 4.3% for total migration.
40. In general, the highest rates of highly skilled migration are observed for the smallest and/or poorest countries. A couple of countries have emigration rates for the highly skilled above 50% – Barbados, Guyana, Haiti, Trinidad and Tobago, Belize, Mauritius and Tonga – meaning that more tertiary educated people born in those countries live abroad than in the country itself. On the other hand, several countries have very low highly skilled emigration rates, most of them being very populated and/or high income countries, like the United States, Japan, Saudi Arabia and China.
41. Emigration rates can also be calculated by gender. Global migrant stocks are more or less gender-balanced, including among the high-skilled. However, since women still face an unequal access to tertiary education in many less developed countries, it appears that tertiary educated women have higher emigration rates (see Table A.1). This result confirms findings of previous studies (see Dumont et al., 2007) showing that the difference in emigration rate between high-skilled women and men is particularly high for the poorest countries of origin.
Chart 6: Total emigration rates and emigration rates for highly skilled persons aged 15 and over by country of origin, circa 2000
Source: DIOC-E 2000 (release 2.0)
ALBBDIBEN
BHR
BLZ
BRB
COG
CUB
CYP
FJI
FYUG-HRV
GHA
GUYHTI
IRL
JAM
KEN
KHM
MEX
MLT
MOZ
MUS
NICPAN
PRI
PRT
SLV
SYC
TON
TTO
USSR-ARMUSSR-BLR
USSR-KAZ
0%
10%
20%
30%
40%
50%
60%
70%
80%
90%
100%
0% 5% 10% 15% 20% 25% 30% 35% 40% 45% 50%
Hig
hly
skill
ed e
mig
rati
on r
ate
Total emigration rate
42. When looking at the differences in emigration rates by income groups, two facts stand out. First, the relationship between the total emigration rate and the income level of origin countries follows an inverted U-shape relationship: total emigration rates are very low for low income countries, higher for lower-middle and upper-middle income countries, and decrease again for high income countries (although they remain higher than for low and lower-middle income countries). Second, this pattern is different for the migration rates of the tertiary educated, where no large differences in emigration rates for the three groups of developing and emerging countries is observed, while high income countries have noticeably lower emigration rates. This pattern of the relationship between the level of development of the country of origin and the total emigration rate, as well as the emigration rate of highly skilled is illustrated for all

DELSA/ELSA/WD/SEM(2010)14
28
destination countries in Chart 7. This chart presents kernel regression estimates for emigration rates with GDP per capita of the origin countries “normalized” to the US GDP.
Chart 7: Total emigration rate and emigration rates of highly skilled by "normalized" GDP per capita of the origin country(a), circa 2000
0.0
5.1
.15
.2E
mig
ratio
n ra
te
0 .2 .4 .6 .8 1'Normalized' GDP per capita in the origin country
Total Highly-skilled
Note: Gaussian kernel with a bandwidth of 0.07. (a) GDP per capita (1985-2000) divided by the US GDP per capita. Source: DIOC-E 2000 (release 2.0), authors’ calculations
43. These results can be further refined by disaggregating destinations into OECD vs. non-OECD countries. The kernel regression estimates in Chart 8 clearly portray the differences between the destination countries regarding the relationship between emigration rates and the income level of the origin countries. The estimates for OECD destinations show similar results as for all destinations, whereas in particular it appears that both total and highly skilled emigration rates to non-OECD countries steadily decrease with the level of income of the origin countries, with a much steeper gradient for the highly skilled emigration rate. In other words, for low income countries, the low emigration propensity of high-skilled persons towards OECD countries is offset by a relatively high emigration rate to non-OECD countries for the highly skilled. Chart 8b also enables to identify the emigration of highly skilled persons from rich countries of origin to less developed ones, with the increase of the right end side of the dotted line.
Chart 8: Total emigration rate and emigration rates of highly skilled by "normalized" GDP per capita of the origin country(a) by OECD and non-OECD destination countries, circa 2000
Chart 8a. OECD destination countries Chart 8b. Non-OECD destination countries
0.0
5.1
.15
.2E
mig
ratio
n ra
te
0 .2 .4 .6 .8 1'Normalized' GDP per capita in the origin country
Total Highly-skilled
0.0
1.0
2.0
3.0
4.0
5E
mig
ratio
n ra
te
0 .2 .4 .6 .8 1'Normalized' GDP per capita in the origin country
Total Highly-skilled
Note: Gaussian kernel with a bandwidth of 0.07. (a) GDP per capita (1985-2000) divided by the US GDP per capita. Source: DIOC-E 2000 (release 2.0), authors’ calculations
44. Focusing on OECD destination countries only, the improvement of the underlying education data reveals that previous estimates vastly overestimated the highly skilled emigration rate of some

DELSA/ELSA/WD/SEM(2010)14
29
countries (e.g. Gambia, Jamaica, Mozambique, Liberia), while it was underestimated for others (e.g. Barbados, Zimbabwe, Panama, Congo, South Africa). The extension to non-OECD destination countries has a significant impact on the highly skilled emigration rates of former USSR countries, as well as some African countries (especially those with large migrant populations living in South Africa). Finally, subtracting immigrants from the resident population for the calculation of emigration rates only makes a significant difference in a couple of countries, which happen to have both large enough immigrant populations and a sufficient number of emigrants. This is for example the case of Rwanda, Israel, Australia or Switzerland. Chart 7 compares the new “brain drain” estimates to the previously published figures based on the OECD-only DIOC (see OECD, 2008). Overall, the improvement of education data represents the main source of change. Overall, emigration rates for the highly skilled are increased by more than 20% in 52 countries and decreased by more than 20% in 9 countries (see Annex Table A.3 for more details by individual countries).
Chart 9: Comparison of emigration rates for highly skilled persons aged 15 and over based on different data sources and ways of calculation by country of origin circa 2000
SGP
SEN
MYS
CYP
FJI
MLI
AFG
NER
RWACHE
TGO
MEX
CHNMMR
COL
DEU
DZA
BGD
IND
BELGBR
ISR
CAFGRC
NPL
JPN
ESPGHA
JOR
FIN
IRL
ISL
DNK
POL
BWA
SWE
FRAHKG
IRNTTO
GTM
USA NOR
IDN
LSO
TUNHUN
PRY
PER
GUY
SWZ
BRA
TUR
SDN
URY
EGYNLDAUS
ZMB
COD
VEN
CAN
BOL
THA
ARG
HTI
UGA
ITACMR
SLE
AUT
CHL
IRQCRI
PRT
KWTTZA
NZL
PNG
MWI
ECU
KEN
NIC
MUS
DOM
SYR
PHL
-5
-3
-1
1
3
5
7
9
Diff
eren
ce in
em
igra
tion
rate
(%)
New education data New education data + New destinations
New education data + New destinations + Excluding immigrants
LKABEN
SLV
HND
ZAFCOG
PAN
ZWE
BRB
10
15
20
25
30
35
40
45
GMB
JAM
MOZ
LBRPAK
-40
-35
-30
-25
-20
-15
-10
-5
Note: Positive difference illustrates higher emigration rate estimates with revised data sources Source: DIOC-E (release 2.0) and authors’ calculations
DELSA/ELSA/WD/SEM(2010)14
30
4. Determinants of highly skilled migration: unilateral and bilateral estimates
45. This section examines more systematically the determinants of highly skilled emigration rates in order to shed more light on the differences between North-South and South-South migration patterns. We first look at the determinants of unilateral emigration rates, and then turn to the estimation of the covariates of bilateral rates.
4.1 Unilateral estimates
46. For the analysis of unilateral migration propensity, we slightly deviate from the definitions given above and work with a logistic transformation of the highly skilled emigration rate defined previously, log[m'i3/(1-m'i3)]. This transformation allows expansion of the range of the variable from (0, 1) to (- inf, + inf) and simplifies into the log of a simple ratio of the number of skilled emigrants to the skilled resident population.18
log[m'i3/(1-m'i3)] = log(Mi3/Pi3) = log(MiT/PiT) + log[(Mi3/MiT)/(Pi3/PiT)]
Following Docquier et al. (2007), highly skilled emigration rates can be decomposed into two components: the total emigration rate and the ratio of the proportion of skilled emigrants by the proportion of skilled non-migrant residents:
For a given country i, the first component gives an indication of the global emigration propensity for this country, while the second component indicates the education gap between emigrants and residents, which represents the level of selection of migration from that particular country.
47. As we have seen above, emigration rates for the highly skilled vary a lot across countries, in particular due to income differences and to the destinations considered. Both the total emigration rate and the selection ratio can explain a high level of the emigration of skilled persons. These two variables exhibit a strong negative correlation when only OECD destinations are considered. The correlation is however much weaker for non-OECD destination countries, and emigration rates for the highly skilled are in this case more correlated with the total emigration rates. It is therefore particularly helpful to use this decomposition and to investigate separately the empirical covariates of each component.
48. Drawing on the existing empirical literature, we consider five groups of variables as potential determinants of emigration rates for the highly skilled (see Annex Table A.4 for more information on sources and basic descriptive statistics for these variables). The first determinant is the level of development of the origin country, which is expected to affect negatively the highly skilled emigration rate, at least for the case of South-North migration. The variable used here is the log of the GDP per capita (PPP) averaged over the period 1985-2000. Another option would be the share of tertiary educated natives, but the two variables are highly correlated (75%).
49. The second set of variables includes the total population and land area of the origin country (both in logs). The size of the country is expected to affect emigration rates negatively. Population is averaged over 1985-2000. Reverse causality from emigration to population could be a concern, which would dictate using total native population (i.e. including emigrants) as an explanatory variable instead of the resident population. In practice, however, both variables are highly correlated and choosing one or the other would hardly change a digit to the estimated coefficients.
50. Geographic characteristics are captured by two variables: whether the country is landlocked and whether it is an island. The first one is expected to have a negative sign, because landlocked countries tend to have poor access to international transportation networks, while the second one should be positive since islands might suffer more rapidly from limited resources and rising population pressure.
18 In what follows, in order to maximise the number of observations, we focus on the more broadly available
measure of the emigration rate, which does not subtract immigrants from the resident population of the origin countries.

DELSA/ELSA/WD/SEM(2010)14
31
51. Language variables (English, French and Spanish as the official language) are included as a proxy for the potential ease of finding employment opportunities in the labour markets of destination countries, as these three languages are spoken by a large share of the world population. This is expected to have a stronger effect for tertiary educated migrants, since they potentially work in occupations where language proficiency is crucial.
52. Political stability is measured by the number of years of war the country has suffered between 1950 and 2000 and a variable of religious fractionalisation. Those two variables should measure two dimensions of an essential push factor. Finally, the variable "restrictions to the mobility of women" measures both social inequality and migration costs in the country of origin. It should affect differently the total and highly skilled emigration rates, since incentives and resources to escape those restrictions are probably higher for skilled people.
53. Two different sets of results are presented in Table 8. The first set considers migration from non-OECD countries to the OECD area, while the second focuses on South-South migration, i.e. migration from non-OECD countries to other OECD countries. For each set of results, three estimations are presented. The first column directly estimates the covariates of the emigration rate for the highly skilled, while in the next two columns the independent variables are respectively the total emigration rate and the selection ratio.
Table 8: Unilateral OLS regression of the determinant on emigration rates for the highly skilled, total emigration rates and the selection ratio, population aged 15 and over, circa 2000
Highly skilled emigration
rate
Total emigration
rateSelection
Highly skilled emigration
rate
Total emigration
rateSelection
(1) (2) (3) (4) (5) (6)
GDP per cap. 1985-2000 (log) -0.306*** 0.315** -0.622*** -0.045 0.051 -0.097(0.107) (0.121) (0.094) (0.152) (0.171) (0.119)
Population 1985-2000 (log) -0.176* -0.239** 0.063 -0.330** -0.218 -0.105(0.090) (0.108) (0.070) (0.138) (0.142) (0.088)
Area (log) -0.111* -0.084 -0.027 0.072 -0.025 0.095(0.060) (0.082) (0.052) (0.138) (0.144) (0.059)
Island 0.613** 0.626* -0.014 -0.467 -0.742 0.275(0.245) (0.320) (0.270) (0.531) (0.537) (0.260)
Landlocked -0.884*** -1.066*** 0.182 0.716* 1.014*** -0.315(0.225) (0.291) (0.221) (0.380) (0.349) (0.303)
Official lang. English 0.741*** 0.085 0.657*** -0.860** -1.141*** 0.290(0.215) (0.262) (0.207) (0.355) (0.377) (0.229)
Official lang. French 0.615*** -0.211 0.827*** -0.143 -1.025*** 0.881***(0.228) (0.300) (0.204) (0.333) (0.391) (0.275)
Official lang. Spanish 0.790*** 0.893*** -0.103 0.382 0.214 0.179(0.167) (0.248) (0.199) (0.247) (0.302) (0.188)
Years of war 1950-2000 (log) 0.188** 0.210* -0.022 -0.156 -0.244 0.085(0.084) (0.109) (0.085) (0.162) (0.161) (0.126)
Religious fractionalisation 1.310*** 0.112 1.198*** 1.918*** 1.216* 0.683(0.390) (0.490) (0.366) (0.598) (0.693) (0.433)
Restrictions to women mobility -0.219 -0.981*** 0.763*** -0.872* -0.882* 0.027(0.254) (0.358) (0.235) (0.519) (0.464) (0.252)
Constant 3.302** -1.952 5.254*** 0.111 -1.437 1.476(1.501) (1.926) (1.552) (2.060) (2.526) (1.824)
Observations 133 133 133 133 133 133Adjusted R-squared 0.54 0.49 0.53 0.19 0.22 0.13
Tukey and Mexico are included in the non-OECD category
Non OECD → OECD countries Non OECD → Non OECD countries
Note: Robust standard errors in parentheses; *** p<0.01, ** p<0.05, * p<0.1
Source: DIOC-E 2000 (release 2.0)
DELSA/ELSA/WD/SEM(2010)14
32
54. In general, for the South-North regressions (Model 1 to 3), the coefficients have the expected signs and the overall fit is relatively good, while significant coefficients are rare for the South-South model and the fit is much poorer (Model 4 to 6). Several results from the South-North model are worth commenting. First, the level of development of the origin country negatively affects the propensity of tertiary educated individuals to emigrate, but this is due to the strong selection effect. Indeed, the total emigration rate is higher for richer countries, but the richer the origin country, the lower the share of highly skilled people among the emigrants. This can be interpreted in two (non mutually exclusive) ways: (i) OECD destination countries apply much more selective policies to migrants from the poorest countries; (ii) the costs of emigrating from a poor country are so prohibitive that only the better educated manage to leave. The coefficients for the size of the origin country (population and area) have the expected signs, with no significant selection effect operating through these variables. The same is true for the "island" and "landlocked" variables, for which the effect on highly skilled emigration rate is similar to that on the total emigration rate.
55. On the contrary, most of the impact of the French and English language variables on highly skilled emigration rates operates through the selection ratio. This indicates that emigrants from English- and French-speaking countries are strongly selected. This is however not the case for the Spanish language variable: Spanish-speaking countries have more highly skilled emigration, because of the importance of total emigration, but not because their emigrants are particularly selected. This difference between the different language effects could be explained by the fact that French and English are official languages in many countries (especially in Africa) with relatively few native speakers apart from the educated elite, while Spanish is broadly spoken in countries where it is the official language. Another possible explanation could be related to the fact that French and English speaking destination countries receive proportionally more foreign students who are likely to stay after completion of their study. Finally, when looking at migration from Spanish speaking countries it is necessary to recall the importance of the Latin American migration to the United States, notably from Mexico, which is mainly low-skilled. A more systematic analysis of the differences in the selectivity of migration according to the main official language of the countries of origin would be necessary to disentangle and evaluate these different types of arguments.
56. The conflict variable has a moderate effect, and is not associated with emigrant selection. Religious fractionalisation is more significant, but all of its impact on highly skilled emigration is mediated by the selection effect. Finally, the restrictions to women’s mobility seem to have no effect on the highly skilled migration, because of two countervailing effects: one significantly negative on the total emigration rate and one significantly positive on the selection ratio. Briefly speaking, in countries where the mobility of women is restricted, emigrants are much less numerous but they are strongly selected, which conforms to the intuition.
57. Focusing now on the differences between the South-North and South-South results for the emigration rate for the highly skilled, we find that only the country size and religious fractionalisation variables have similar impacts. Differences of development levels across countries do not lead to different emigration rates or selection ratios. While insular countries do not retain their specificity, the landlocked variable changes the direction of influence: migrants from these countries tend to migrate more than others to non-OECD countries, although this effect is less strong for skilled migrants.
58. Important differences occur for the language variables. The emigration rate for the highly skilled is now lower for migrants from English-speaking countries, because of a negative effect on the total emigration rate. There is no significant effect on the emigration rate of the highly skilled for French-speaking countries, due to significant effects of opposite signs on the total emigration rate and the selection ratio. Finally, there is no effect of the Spanish language19
19 Even when language has no impact on the emigration rate, it has surely a significant influence on the
choice of the destination country.
.
DELSA/ELSA/WD/SEM(2010)14
33
59. Overall, while the different variables together explain almost 60% of the inter-country variance in highly skilled emigration rates from non-OECD countries to the OECD area, they explain only 25% of the variance of emigration rates towards non-OECD countries.
4.2 Bilateral estimates
60. In order to refine the previous results, we explore the potential role of the specific characteristics of destination countries and go beyond the OECD vs. non-OECD distinction. An analysis of bilateral emigration rates and selection ratios is introduced in the following, exploiting the full information in DIOC-E.
61. The methods and variables considered are mostly similar to those of the unilateral analysis, but several adjustments are needed. The dependent variable is defined for each origin-destination couple as the log of the ratio of the emigrant population from country i living in j to the resident population of country i, so that the sum of the bilateral ratios for each origin country is the unilateral measure used above. The selection ratio is defined as above, and the three dependent variables satisfy the following equation:
log(Mij3/Pi3) = log(MijT/PiT) + log[(Mij3/MijT)/(Pi3/PiT)]
Both the global emigration rate and the selection ratio are now specific to each origin-destination couple.
62. An important issue in the bilateral approach is that most of the observations in the database are zeros, i.e. there exists no migration between the two countries considered. When all origins and all destinations are taken into account, 52% of the observations are zero (24% for all origins and OECD destinations only). This is of course normal and reflects the fact that most countries in the world only host immigrants from a limited number of origins. The use of a log specification drops the zero observations from the sample, which is likely to result in biased estimates of the variables of interest. In order to avoid this, we use the slightly transformed figures M'ij=Mij+1 in the OLS estimations.
63. Another possibility to deal with this issue is to explicitly model the potential selection using a Heckman regression, but this requires finding a valid instrument, i.e. a bilateral variable that influences the probability of observing emigrants from i to j but not the number of emigrants itself. In a somewhat similar set-up, Beine et al. (2009) have suggested using the presence of a diplomatic representation of country j in country i as an instrument. This variable would be appropriate to explain the real "zeros", i.e. cases where there are actually no migrants from country i in country j. For some countries, however, the data comes from (large) samples where small cells have a lower probability of inclusion or from data sets where not all origin countries are detailed and where origin countries are aggregated in origin regions. In order to account for these cases, we use the share of migrants from unidentified origin countries (i.e. the "other" category and the broad regional groups) in the foreign-born population as an additional instrument. In addition to the variables used in the unilateral model, the bilateral formulation allows to use destination-specific variables, such as the level of development and size of the destination country, as well as bilateral variables, such as the distance between each pair of countries, or whether they have had a colonial relationship. We also estimate a model including only the bilateral variables, along with a full set of origin and destination country dummies. In this latter case, when estimating the Heckman model, we only use the diplomatic representation instrument due to the colinearity between the destination dummies and the share of migrants of unidentified origins.
64. Similarly to what has been done in the unilateral estimations, we estimate two different models: one with only non-OECD origin countries and OECD destinations, and one restricted to non-OECD origin and destinations countries.
65. Results are presented in Table 9 (models without origin and destination dummies) and Table 10 (models with origin and destination dummies). Starting with the model with both unilateral and bilateral variables (i.e. without country dummies), the OLS and Heckman regressions provide a relatively similar picture, although there are significant differences for several variables. Since the OLS estimates are biased in the presence of selection, we discuss mainly the results from the Heckman model. For both South-North and South-South migration, the level of development of the origin countries has a significant
DELSA/ELSA/WD/SEM(2010)14
34
impact on the emigration of the high-skilled: the poorer the origin country, the higher the emigration rate for the highly skilled. This effect is however stronger in the case of migration to OECD countries than for South-South migration, mainly because total migration is more sensitive to income level20
66. Other things being equal, richer and larger destination countries host more migrants in general but also more highly skilled migrants. Distance between the origin and destination countries has a negative impact on the bilateral tertiary emigration rates, despite a significant positive effect on selection. As expected, distance has more impact in the case of South-South migration. On the other hand, a common language or the existence of a colonial relationship in the past has a positive impact on global and skilled emigration, with little effect on the selection ratio.
.
67. Compared to the unilateral model, language variables lose their impact on the emigration rate for the highly skilled in the South-North model, although the positive selection effect remains for French and English. In the South-South case, the highly skilled emigration rate is negatively affected by the English variable, because its negative impact on the total emigration is not fully offset by the positive effect on selection, as is the case for the French and Spanish variables.
68. Religious fractionalisation has a similar impact in both models as was already the case in the unilateral regressions: it increases skilled emigration through a positive effect on selection, but also through more emigration in the case of South-South pairs of countries. Finally, restrictions to women’s mobility have zero net effect on the highly skilled emigration rate for both South-North and South-South migration, although they positively affect the skill content of migration.
69. Controlling for a full set of origin and destination country dummies (Table 10), a key difference appears between South-North and South-South migration. While the income differential has a negative impact on emigration (skilled and total) in the former case, there is no such relationship for South-South migration. This means that once migration policies of destination countries and other national idiosyncrasies are controlled for, the income differential between origin and destination countries does not affect emigration propensity in the South-South case. On the other hand, for migration to OECD countries, country pairs with higher income differences have on average smaller bilateral stocks of migrants. Finally, the colonial variable has a positive impact on both total and skilled emigration, comparable to the one observed in the previous models.
70. To sum up, several robust differences between the determinants of South-North and South-South skilled emigration can be noted. First, the income level of origin and destination countries does not play the same role in both contexts. The impact of both the origin country's and destination country's income is indeed much more pronounced in the case of migration towards OECD countries. Second, distance affects more strongly migration between South-South pairs of countries, but has also a larger positive effect on selection in this case. Third, after controlling for origin and destination specificities, dyad-specific variables, such as a common language or a past colonial relationship, retain a strong explanatory power.
20 The impact of the origin country's income on selection is similar for South-North and South-South flows.
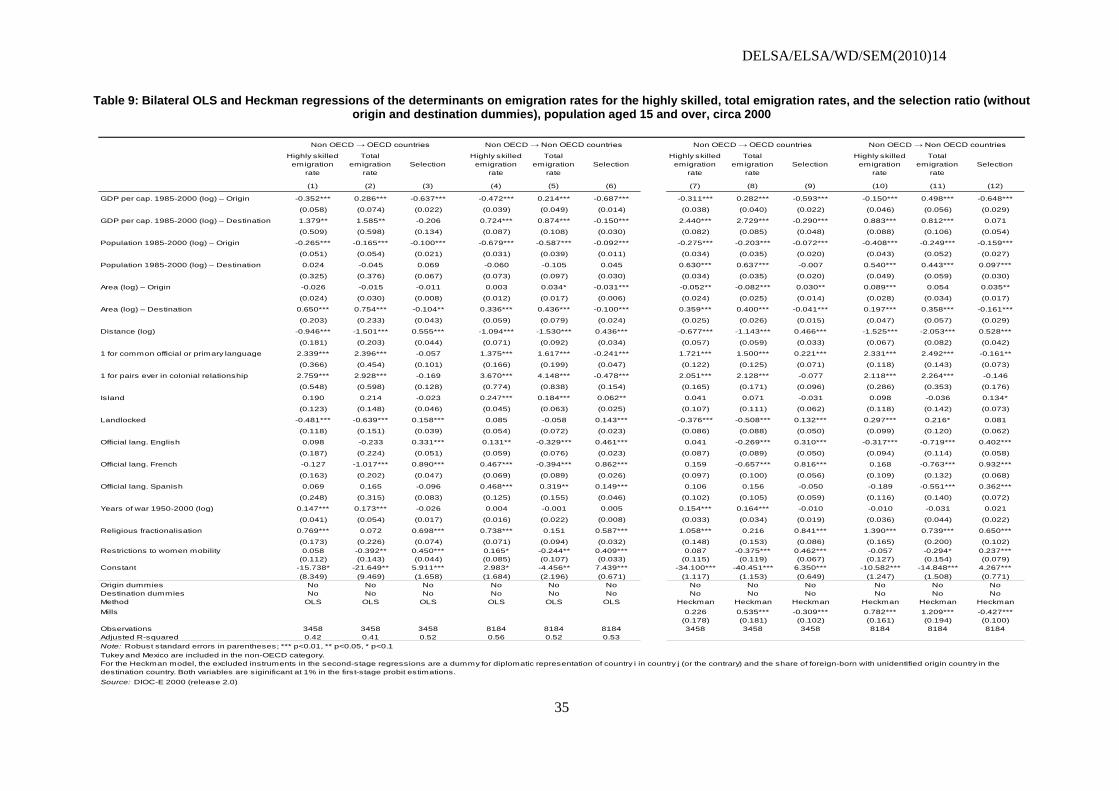
DELSA/ELSA/WD/SEM(2010)14
35
Table 9: Bilateral OLS and Heckman regressions of the determinants on emigration rates for the highly skilled, total emigration rates, and the selection ratio (without origin and destination dummies), population aged 15 and over, circa 2000
Highly skilled emigration
rate
Total emigration
rateSelection
Highly skilled emigration
rate
Total emigration
rateSelection
Highly skilled emigration
rate
Total emigration
rateSelection
Highly skilled emigration
rate
Total emigration
rateSelection
(1) (2) (3) (4) (5) (6) (7) (8) (9) (10) (11) (12)
GDP per cap. 1985-2000 (log) – Origin -0.352*** 0.286*** -0.637*** -0.472*** 0.214*** -0.687*** -0.311*** 0.282*** -0.593*** -0.150*** 0.498*** -0.648***
(0.058) (0.074) (0.022) (0.039) (0.049) (0.014) (0.038) (0.040) (0.022) (0.046) (0.056) (0.029)
GDP per cap. 1985-2000 (log) – Destination 1.379** 1.585** -0.206 0.724*** 0.874*** -0.150*** 2.440*** 2.729*** -0.290*** 0.883*** 0.812*** 0.071
(0.509) (0.598) (0.134) (0.087) (0.108) (0.030) (0.082) (0.085) (0.048) (0.088) (0.106) (0.054)
Population 1985-2000 (log) – Origin -0.265*** -0.165*** -0.100*** -0.679*** -0.587*** -0.092*** -0.275*** -0.203*** -0.072*** -0.408*** -0.249*** -0.159***
(0.051) (0.054) (0.021) (0.031) (0.039) (0.011) (0.034) (0.035) (0.020) (0.043) (0.052) (0.027)
Population 1985-2000 (log) – Destination 0.024 -0.045 0.069 -0.060 -0.105 0.045 0.630*** 0.637*** -0.007 0.540*** 0.443*** 0.097***
(0.325) (0.376) (0.067) (0.073) (0.097) (0.030) (0.034) (0.035) (0.020) (0.049) (0.059) (0.030)
Area (log) – Origin -0.026 -0.015 -0.011 0.003 0.034* -0.031*** -0.052** -0.082*** 0.030** 0.089*** 0.054 0.035**
(0.024) (0.030) (0.008) (0.012) (0.017) (0.006) (0.024) (0.025) (0.014) (0.028) (0.034) (0.017)
Area (log) – Destination 0.650*** 0.754*** -0.104** 0.336*** 0.436*** -0.100*** 0.359*** 0.400*** -0.041*** 0.197*** 0.358*** -0.161***
(0.203) (0.233) (0.043) (0.059) (0.079) (0.024) (0.025) (0.026) (0.015) (0.047) (0.057) (0.029)
Distance (log) -0.946*** -1.501*** 0.555*** -1.094*** -1.530*** 0.436*** -0.677*** -1.143*** 0.466*** -1.525*** -2.053*** 0.528***
(0.181) (0.203) (0.044) (0.071) (0.092) (0.034) (0.057) (0.059) (0.033) (0.067) (0.082) (0.042)
1 for common official or primary language 2.339*** 2.396*** -0.057 1.375*** 1.617*** -0.241*** 1.721*** 1.500*** 0.221*** 2.331*** 2.492*** -0.161**
(0.366) (0.454) (0.101) (0.166) (0.199) (0.047) (0.122) (0.125) (0.071) (0.118) (0.143) (0.073)
1 for pairs ever in colonial relationship 2.759*** 2.928*** -0.169 3.670*** 4.148*** -0.478*** 2.051*** 2.128*** -0.077 2.118*** 2.264*** -0.146
(0.548) (0.598) (0.128) (0.774) (0.838) (0.154) (0.165) (0.171) (0.096) (0.286) (0.353) (0.176)
Island 0.190 0.214 -0.023 0.247*** 0.184*** 0.062** 0.041 0.071 -0.031 0.098 -0.036 0.134*
(0.123) (0.148) (0.046) (0.045) (0.063) (0.025) (0.107) (0.111) (0.062) (0.118) (0.142) (0.073)
Landlocked -0.481*** -0.639*** 0.158*** 0.085 -0.058 0.143*** -0.376*** -0.508*** 0.132*** 0.297*** 0.216* 0.081
(0.118) (0.151) (0.039) (0.054) (0.072) (0.023) (0.086) (0.088) (0.050) (0.099) (0.120) (0.062)
Official lang. English 0.098 -0.233 0.331*** 0.131** -0.329*** 0.461*** 0.041 -0.269*** 0.310*** -0.317*** -0.719*** 0.402***
(0.187) (0.224) (0.051) (0.059) (0.076) (0.023) (0.087) (0.089) (0.050) (0.094) (0.114) (0.058)
Official lang. French -0.127 -1.017*** 0.890*** 0.467*** -0.394*** 0.862*** 0.159 -0.657*** 0.816*** 0.168 -0.763*** 0.932***
(0.163) (0.202) (0.047) (0.069) (0.089) (0.026) (0.097) (0.100) (0.056) (0.109) (0.132) (0.068)
Official lang. Spanish 0.069 0.165 -0.096 0.468*** 0.319** 0.149*** 0.106 0.156 -0.050 -0.189 -0.551*** 0.362***
(0.248) (0.315) (0.083) (0.125) (0.155) (0.046) (0.102) (0.105) (0.059) (0.116) (0.140) (0.072)
Years of war 1950-2000 (log) 0.147*** 0.173*** -0.026 0.004 -0.001 0.005 0.154*** 0.164*** -0.010 -0.010 -0.031 0.021
(0.041) (0.054) (0.017) (0.016) (0.022) (0.008) (0.033) (0.034) (0.019) (0.036) (0.044) (0.022)
Religious fractionalisation 0.769*** 0.072 0.698*** 0.738*** 0.151 0.587*** 1.058*** 0.216 0.841*** 1.390*** 0.739*** 0.650***
(0.173) (0.226) (0.074) (0.071) (0.094) (0.032) (0.148) (0.153) (0.086) (0.165) (0.200) (0.102)Restrictions to women mobility 0.058 -0.392** 0.450*** 0.165* -0.244** 0.409*** 0.087 -0.375*** 0.462*** -0.057 -0.294* 0.237***
(0.112) (0.143) (0.044) (0.085) (0.107) (0.033) (0.115) (0.119) (0.067) (0.127) (0.154) (0.079)Constant -15.738* -21.649** 5.911*** 2.983* -4.456** 7.439*** -34.100*** -40.451*** 6.350*** -10.582*** -14.848*** 4.267***
(8.349) (9.469) (1.658) (1.684) (2.196) (0.671) (1.117) (1.153) (0.649) (1.247) (1.508) (0.771)Origin dummies No No No No No No No No No No No NoDestination dummies No No No No No No No No No No No NoMethod OLS OLS OLS OLS OLS OLS Heckman Heckman Heckman Heckman Heckman HeckmanMills 0.226 0.535*** -0.309*** 0.782*** 1.209*** -0.427***
(0.178) (0.181) (0.102) (0.161) (0.194) (0.100)Observations 3458 3458 3458 8184 8184 8184 3458 3458 3458 8184 8184 8184Adjusted R-squared 0.42 0.41 0.52 0.56 0.52 0.53Note: Robust standard errors in parentheses; *** p<0.01, ** p<0.05, * p<0.1Tukey and Mexico are included in the non-OECD category.
Source: DIOC-E 2000 (release 2.0)
For the Heckman model, the excluded instruments in the second-stage regressions are a dummy for diplomatic representation of country i in country j (or the contrary) and the share of foreign-born with unidentified origin country in the destination country. Both variables are siginificant at 1% in the first-stage probit estimations.
Non OECD → OECD countries Non OECD → Non OECD countries Non OECD → OECD countries Non OECD → Non OECD countries

DELSA/ELSA/WD/SEM(2010)14
36
Table 10: Bilateral OLS and Heckman regressions of the determinants on emigration rates for the highly skilled, total emigration rates, and the selection ratio (with origin and destination dummies), population aged 15 and over, circa 2000
Highly skilled emigration
rate
Total emigration
rateSelection
Highly skilled emigration
rate
Total emigration
rateSelection
Highly skilled emigration
rate
Total emigration
rateSelection
Highly skilled emigration
rate
Total emigration
rateSelection
(1) (2) (3) (4) (5) (6) (7) (8) (9) (10) (11) (12)Difference Destination-Origin GDP per cap. 1985-2000 0.141 0.008 0.133** -0.364*** -0.496*** 0.132*** -0.382*** -0.342** -0.040 0.194 0.051 0.143
(0.134) (0.170) (0.053) (0.070) (0.096) (0.031) (0.140) (0.157) (0.063) (0.295) (0.349) (0.160)Distance (log) -1.233*** -1.531*** 0.298*** -1.250*** -1.706*** 0.456*** -1.195*** -1.379*** 0.184*** -1.495*** -1.852*** 0.357***
(0.088) (0.106) (0.028) (0.034) (0.046) (0.018) (0.057) (0.063) (0.025) (0.046) (0.054) (0.024)1 for common official of primary language 1.273*** 1.355*** -0.082** 1.144*** 1.299*** -0.155*** 1.202*** 1.056*** 0.146*** 1.704*** 1.344*** 0.360***
(0.114) (0.135) (0.037) (0.067) (0.087) (0.030) (0.092) (0.102) (0.041) (0.101) (0.119) (0.054)1 for pairs ever in colonial relationship 2.526*** 2.767*** -0.240*** 3.328*** 3.593*** -0.266* 2.282*** 2.376*** -0.094 2.189*** 2.378*** -0.189
(0.208) (0.239) (0.055) (0.402) (0.457) (0.147) (0.139) (0.153) (0.061) (0.231) (0.269) (0.121)Constant 1.224 2.410** -1.186*** 1.482*** 4.272*** -2.790*** 4.275*** 5.329*** -1.055*** 2.962*** 5.295*** -2.333***
(0.869) (1.055) (0.287) (0.347) (0.471) (0.178) (0.632) (0.706) (0.281) (0.680) (0.801) (0.366)Origin dummies Yes Yes Yes Yes Yes Yes Yes Yes Yes Yes Yes YesDestination dummies Yes Yes Yes Yes Yes Yes Yes Yes Yes Yes Yes YesMethod OLS OLS OLS OLS OLS OLS Heckman Heckman Heckman Heckman Heckman HeckmanMills 0.690*** 0.526*** 0.163*** 0.656*** 0.551*** 0.105***
(0.115) (0.130) (0.0521) (0.0907) (0.107) (0.0491)Observations 3458 3458 3458 8184 8184 8184 3458 3458 3458 8184 8184 8184Adjusted R-squared 0.71 0.67 0.83 0.69 0.61 0.81
Tukey and Mexico are included in the non-OECD categoryFor the Heckman model, the excluded instruments in the second-stage regressions are a dummy for diplomatic representation of country i in country j (or the contrary) and the share of foreign-born with unidentified origin country in the destination country. Both variables are siginificant at 1% in the first-stage probit estimations.Source: DIOC-E 2000 (release 2.0)
Non OECD → OECD countries Non OECD → Non OECD countries Non OECD → OECD countries Non OECD → Non OECD countries
Note: Robust standard errors in parentheses; *** p<0.01, ** p<0.05, * p<0.1

DELSA/ELSA/WD/SEM(2010)14
37
71. One of the striking results presented in the descriptive analysis of the DIOC-E in previous sections relates to the fact that African countries, and to a lesser extent Latin American countries, face a relatively high emigration rate of the highly skilled. To what extent could this result be explained by structural factors specific to these regions? To address this question, regional dummies for countries of origin were introduced in the OLS and Heckman regressions from non-OECD origin to OECD destination countries. In order to control for possible destination effects, regional dummies for destination countries were also added. Furthermore, to capture the non-linear relationship between emigration rates and the GDP of the origin country, GDP variables in quintiles were included.
72. An inverted U relationship between total emigration rates and the GDP per capita of the origin country appears (see Model 4 to 6 in Table 11), which is consistent with previous findings (see Chart 8a). Total emigration rate is significantly lower only for the poorest countries of origin. The relationship with the selection ratio on the other hand is clearly linear and negative, and the selection of migrants decreases gradually from low to high income origin countries.
73. Regional dummies for countries of destination show that European countries attract significantly fewer immigrants from non-OECD countries than other OECD destination countries. Furthermore, the emigration rate of the highly skilled to European OECD countries is also lower and the immigrants are less selected compared to other destinations, notably OECD settlement countries (Australia, Canada, and New Zealand). These results are due to differences in migration policies as well as historical migration patterns in destination countries.
74. Everything being equal, a specific effect associated with African and Latin American origins seems to persist. This is not the case however for Asian migration. Overall, emigration rates for the highly skilled are higher in African countries and migration is more selected compared to all other regions of origin. This result is puzzling as the estimated models already include a wide range of explanatory variables. Therefore, at this stage, interpretation should be made with caution.
75. The persistence of regional effects could be due to historical migration patterns which are imperfectly depicted by other factors controlled for in the model (i.e. colonial status, official language, distance to the destination country, etc.). If the education data for African and Latin American countries of origin were systematically underestimating the number of tertiary educated that could also lead to the results mentioned above. This is, however, unlikely, notably for Latin American countries where only census data are used.
76. In any case, the remaining regional effects, after having controlled for the main determinants of emigration rates of highly skilled and of the selection ratios between non-OECD origin and OECD destination countries, are puzzling and need further investigation, either to resolve remaining limitations and rule out the possibility of a statistical artefact, or to reach a thorough explanation for this result.

DELSA/ELSA/WD/SEM(2010)14
38
Table 11: Bilateral OLS and Heckman regressions of the determinants on emigration rates for the highly skilled, total emigration rates, and the selection ratio (without origin and destination dummies), population
aged 15 and over, circa 2000
Highly skilled emigration
rate
Total emigration
rateSelection
Highly skilled emigration
rate
Total emigration
rateSelection
(1) (2) (3) (4) (5) (6)
GDP per cap. 1985-2000 (log) – Destination 1.107** 1.318* -0.211 2.339*** 2.694*** -0.354***(0.531) (0.660) (0.160) (0.086) (0.089) (0.049)
Population 1985-2000 (log) – Origin -0.205*** -0.159** -0.046** -0.203*** -0.202*** -0.001(0.057) (0.064) (0.020) (0.036) (0.037) (0.020)
Population 1985-2000 (log) – Destination -0.132 -0.211 0.078 0.738*** 0.753*** -0.015(0.315) (0.372) (0.071) (0.039) (0.041) (0.022)
Area (log) – Origin -0.106*** -0.057 -0.049*** -0.129*** -0.106*** -0.023(0.030) (0.039) (0.011) (0.026) (0.027) (0.015)
Area (log) – Destination 0.675*** 0.799*** -0.123*** 0.181*** 0.252*** -0.071***(0.240) (0.272) (0.043) (0.035) (0.036) (0.020)
Distance (log) -0.813*** -1.321*** 0.508*** -0.749*** -1.160*** 0.411***(0.148) (0.182) (0.076) (0.061) (0.063) (0.035)
1 for common official or primary language 2.289*** 2.400*** -0.111 1.522*** 1.352*** 0.169**(0.347) (0.418) (0.084) (0.125) (0.129) (0.071)
1 for pairs ever in colonial relationship 2.980*** 3.126*** -0.146 2.289*** 2.286*** 0.004(0.493) (0.576) (0.140) (0.166) (0.173) (0.095)
Island 0.231** 0.017 0.214*** 0.166 -0.001 0.166***(0.095) (0.115) (0.052) (0.113) (0.117) (0.064)
Landlocked -0.372*** -0.642*** 0.269*** -0.229*** -0.485*** 0.255***(0.105) (0.138) (0.042) (0.086) (0.089) (0.049)
Official lang. English -0.215 -0.133 -0.082* -0.211** -0.092 -0.120**(0.129) (0.146) (0.044) (0.101) (0.105) (0.057)
Official lang. French -0.563*** -0.740*** 0.176*** -0.299** -0.427*** 0.128*(0.123) (0.138) (0.032) (0.126) (0.131) (0.072)
Official lang. Spanish -0.704*** -0.078 -0.627*** -0.465*** 0.083 -0.548***(0.150) (0.217) (0.091) (0.178) (0.184) (0.101)
Years of war 1950-2000 (log) 0.224*** 0.202*** 0.022 0.224*** 0.187*** 0.037**(0.043) (0.061) (0.021) (0.033) (0.034) (0.019)
Religious fractionalisation 0.495** 0.190 0.305*** 0.795*** 0.345** 0.450***(0.184) (0.251) (0.095) (0.154) (0.160) (0.088)
Restrictions to women mobility 0.075 -0.100 0.176*** 0.083 -0.115 0.198***(0.122) (0.147) (0.053) (0.120) (0.124) (0.068)
Destination: Europe 0.608 0.793 -0.184 -1.049*** -0.824*** -0.225***(0.799) (0.919) (0.157) (0.150) (0.154) (0.085)
Destination: USA 2.919*** 3.064*** -0.145 -0.301 -0.484** 0.183*(0.859) (0.979) (0.197) (0.190) (0.197) (0.108)
Origin: Africa 0.687*** -0.291 0.977*** 0.774*** -0.184 0.959***(0.215) (0.307) (0.116) (0.145) (0.150) (0.082)
Origin: Asia -0.216 -0.256 0.040 -0.145 -0.193 0.048(0.181) (0.242) (0.134) (0.122) (0.126) (0.069)
Origin: Latin America and Caribbean 0.557** -0.117 0.674*** 0.606*** -0.012 0.618***(0.237) (0.293) (0.100) (0.173) (0.179) (0.098)
Second quintile GDP per cap at origin 0.184** 0.776*** -0.593*** 0.117 0.651*** -0.534***(0.081) (0.094) (0.026) (0.106) (0.109) (0.060)
Third quintile GDP per cap at origin -0.049 0.992*** -1.041*** -0.194* 0.762*** -0.956***(0.125) (0.141) (0.035) (0.113) (0.117) (0.064)
Fourth quintile GDP per cap at origin 0.044 1.245*** -1.201*** -0.081 1.005*** -1.086***(0.123) (0.145) (0.046) (0.117) (0.121) (0.066)
Fifth quintile GDP per cap at origin -0.715*** 0.852*** -1.568*** -0.622*** 0.781*** -1.404***(0.166) (0.205) (0.064) (0.127) (0.131) (0.072)
Constant -15.314* -17.111 1.797 -33.927*** -37.451*** 3.524***(8.902) (10.846) (2.378) (1.240) (1.285) (0.705)
Origin dummies No No No No No NoDestination dummies No No No No No NoMethod OLS OLS OLS Heckman Heckman HeckmanMills 0.306* 0.578*** -0.272***
(0.169) (0.173) (0.096)Observations 3458 3458 3458 3458 3458 3458Adjusted R-squared 0.456 0.436 0.555Note: Robust standard errors in parentheses; *** p<0.01, ** p<0.05, * p<0.1Turkey and Mexico are included in the non-OECD category.
Non OECD → OECD countries Non OECD → OECD countries
The reference category for the origin regional dummies comprises European and Oceanian countries; the reference category for the destination regional dummies comprises Japan, Canada, Australia and New Zealand and the reference category for the origin country income groups is the first quintile.
For the Heckman model, the excluded instruments in the second-stage regressions are a dummy for diplomatic representation of country i in country j (or the contrary) and the share of foreign-born with unidentified origin country in the destination country. Both variables are siginificant at 1% in the first-stage probit estimations.
Source: DIOC-E 2000 (release 2.0)

DELSA/ELSA/WD/SEM(2010)14
39
Conclusion
77. Collecting more accurate and internationally comparable data is a first, albeit crucial, step towards better understanding of the nature and the scope of migration movements and towards evidence-based policy making. DIOC-E (release 2.0) makes a major contribution by supplying new multidimensional information on bilateral migration for 89 countries of destination and more than 230 countries of origin. DIOC-E also improves, both quantitatively and qualitatively, available estimates on emigration rates for the highly skilled, allowing for a reappraisal of the so-called “brain drain” issue. The extension of the Database on Immigrants in OECD Countries to non-OECD countries opens up a wide range of new possibilities to investigate international migration patterns not only with regard to South-North migration, but also with regard to South-South migration.
78. This paper gave a short overview of the potential of DIOC-E to shed light on characteristics of immigrants in different receiving countries, characteristics of emigrants by sending countries, regional aspects of international migration, new emigration rates by skill level and the factors determining these figures on a unilateral and bilateral dimension. According to DIOC-E (release 2.0) almost 35 million migrants aged 15 and over live outside the OECD, out of a total of 110 million. On average the total emigration rate reaches 2.4%. The Database reveals important variations between regions and countries of birth. In general, the emigration rate for highly skilled persons is higher than the total emigration rate in all regions, which reflects the selective nature of migration. Econometric analysis reveals that the impact of both the origin country's and destination country's income is more pronounced in the case of migration towards OECD countries. It also appears that distance more strongly affects migration between "South-South" pairs of countries and that even after controlling for origin and destination specificities, dyad-specific variables, such as a common language or a past colonial relationship, retain a strong explanatory power.
79. An update of DIOC for 2005/06 and a further extension of DIOC-E, especially to extend the coverage to more African and Western Asian countries, are underway. The 2010 round of the population census however offers a unique opportunity to update this information and to implement a continuous monitoring of the impact of international migration, both highly skilled and low-skilled, on countries of origin.
DELSA/ELSA/WD/SEM(2010)14
40
REFERENCES
Alesina, A. et al. (2003), Fractionalization, Journal of Economic Growth, No. 8, 155-194.
Barro, R. and J.W. Lee (2001), International data on educational attainment: Updates and implications, Oxford Economic Papers, No. 53, 541-563.
Barro, R. and J.-W. Lee (2010), A new data set of educational attainment in the world, 1950–2010, NBER Working Paper, No. 15902.
Beine, M., F. Docquier and H. Rapoport (2006), Measuring international skilled migration: new estimates controlling for age of entry, World Bank Policy Research Discussion Paper.
Beine, M., F. Docquier and C. Ozden (2009), Diasporas, Journal of Development Economics, forthcoming.
Docquier, F., O. Lohest and A. Marfouk (2007), Brain drain in developing countries, World Bank Economic Review, No. 21, 193-218.
Docquier, F. and A. Marfouk (2006), International migration by educational attainment (1990-2000) – Release 1.1, in C. Ozden and M. Schiff (eds.), International Migration, Remittances and Development, Palgrave Macmillan.
Dumont, J.-C. & Lemaitre G. (2005), Beyond the headlines: new evidence on the brain drain, Revue Économique, Vol 56, No. 6, Novembre 2005, 1275-1300.
Dumont, J.-C. & Lemaitre G. (2005), Comptabilisation des immigrés et des expatriés dans les pays de l’OCDE : une nouvelle perspective, Revue Économique de l'OCDE, No. 40, 59-97.
Dumont, J.-C., J.P. Martin and G. Spielvogel (2007), Women on the move: The neglected gender dimension of the brain drain, IZA Discussion Paper, No. 2920.
Dumont, J.-C. and O. Monso (2007), Matching educational background and employment: a challenge for immigrants in host countries, International Migration Outlook (2007), OECD, Paris
Lutz, W., A. Goujon, S. K.C. and W. Sanderson (2007), Reconstruction of populations by age, sex and level of educational attainment for 120 countries for 1970-2000, Vienna Yearbook of Population Research 2007, 193-235.
McKenzie, D. (2007), Paper Walls Are Easier to Tear Down: Passport Costs and Legal Barriers to Emigration, World Development, No. 35, 2026-2039.
OECD (2008), A Profile of Immigrant Populations in the 21st Century: Data from OECD Countries, Paris: OECD.
Parsons, C. R., R. Skeldon, T. L. Walmsley and L. A. Winters (2005), Quantifying the international bilateral movements of migrants, Development Research Centre on Migration, Globalisation and Poverty (DRC) Working Paper, No. T13.
United Nations Population Division (2008), United Nations Global Migration Database (UNGMD).
United Nations Population Division (2009), International Migrant Stock: The 2008 Revision, UN.
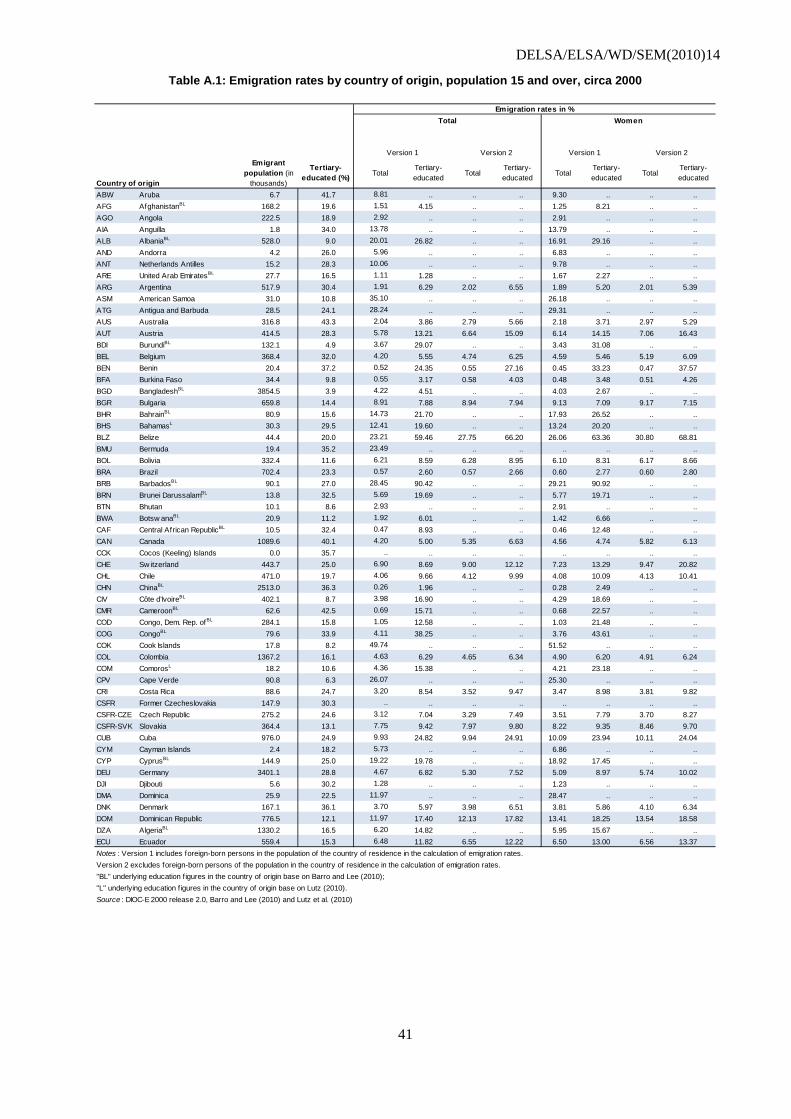
DELSA/ELSA/WD/SEM(2010)14
41
Table A.1: Emigration rates by country of origin, population 15 and over, circa 2000
Country of origin
Emigrant population (in
thousands)
Tertiary-educated (%) Total
Tertiary-educated Total
Tertiary-educated Total
Tertiary-educated Total
Tertiary-educated
ABW Aruba 6.7 41.7 8.81 .. .. .. 9.30 .. .. ..AFG AfghanistanBL 168.2 19.6 1.51 4.15 .. .. 1.25 8.21 .. ..AGO Angola 222.5 18.9 2.92 .. .. .. 2.91 .. .. ..AIA Anguilla 1.8 34.0 13.78 .. .. .. 13.79 .. .. ..ALB AlbaniaBL 528.0 9.0 20.01 26.82 .. .. 16.91 29.16 .. ..AND Andorra 4.2 26.0 5.96 .. .. .. 6.83 .. .. ..ANT Netherlands Antilles 15.2 28.3 10.06 .. .. .. 9.78 .. .. ..ARE United Arab EmiratesBL 27.7 16.5 1.11 1.28 .. .. 1.67 2.27 .. ..ARG Argentina 517.9 30.4 1.91 6.29 2.02 6.55 1.89 5.20 2.01 5.39ASM American Samoa 31.0 10.8 35.10 .. .. .. 26.18 .. .. ..ATG Antigua and Barbuda 28.5 24.1 28.24 .. .. .. 29.31 .. .. ..AUS Australia 316.8 43.3 2.04 3.86 2.79 5.66 2.18 3.71 2.97 5.29AUT Austria 414.5 28.3 5.78 13.21 6.64 15.09 6.14 14.15 7.06 16.43BDI BurundiBL 132.1 4.9 3.67 29.07 .. .. 3.43 31.08 .. ..BEL Belgium 368.4 32.0 4.20 5.55 4.74 6.25 4.59 5.46 5.19 6.09BEN Benin 20.4 37.2 0.52 24.35 0.55 27.16 0.45 33.23 0.47 37.57BFA Burkina Faso 34.4 9.8 0.55 3.17 0.58 4.03 0.48 3.48 0.51 4.26BGD BangladeshBL 3854.5 3.9 4.22 4.51 .. .. 4.03 2.67 .. ..BGR Bulgaria 659.8 14.4 8.91 7.88 8.94 7.94 9.13 7.09 9.17 7.15BHR BahrainBL 80.9 15.6 14.73 21.70 .. .. 17.93 26.52 .. ..BHS BahamasL 30.3 29.5 12.41 19.60 .. .. 13.24 20.20 .. ..BLZ Belize 44.4 20.0 23.21 59.46 27.75 66.20 26.06 63.36 30.80 68.81BMU Bermuda 19.4 35.2 23.49 .. .. .. .. .. .. ..BOL Bolivia 332.4 11.6 6.21 8.59 6.28 8.95 6.10 8.31 6.17 8.66BRA Brazil 702.4 23.3 0.57 2.60 0.57 2.66 0.60 2.77 0.60 2.80BRB BarbadosBL 90.1 27.0 28.45 90.42 .. .. 29.21 90.92 .. ..BRN Brunei DarussalamBL 13.8 32.5 5.69 19.69 .. .. 5.77 19.71 .. ..BTN Bhutan 10.1 8.6 2.93 .. .. .. 2.91 .. .. ..BWA Botsw anaBL 20.9 11.2 1.92 6.01 .. .. 1.42 6.66 .. ..CAF Central African RepublicBL 10.5 32.4 0.47 8.93 .. .. 0.46 12.48 .. ..CAN Canada 1089.6 40.1 4.20 5.00 5.35 6.63 4.56 4.74 5.82 6.13CCK Cocos (Keeling) Islands 0.0 35.7 .. .. .. .. .. .. .. ..CHE Sw itzerland 443.7 25.0 6.90 8.69 9.00 12.12 7.23 13.29 9.47 20.82CHL Chile 471.0 19.7 4.06 9.66 4.12 9.99 4.08 10.09 4.13 10.41CHN ChinaBL 2513.0 36.3 0.26 1.96 .. .. 0.28 2.49 .. ..CIV Côte d'IvoireBL 402.1 8.7 3.98 16.90 .. .. 4.29 18.69 .. ..CMR CameroonBL 62.6 42.5 0.69 15.71 .. .. 0.68 22.57 .. ..COD Congo, Dem. Rep. ofBL 284.1 15.8 1.05 12.58 .. .. 1.03 21.48 .. ..COG CongoBL 79.6 33.9 4.11 38.25 .. .. 3.76 43.61 .. ..COK Cook Islands 17.8 8.2 49.74 .. .. .. 51.52 .. .. ..COL Colombia 1367.2 16.1 4.63 6.29 4.65 6.34 4.90 6.20 4.91 6.24COM ComorosL 18.2 10.6 4.36 15.38 .. .. 4.21 23.18 .. ..CPV Cape Verde 90.8 6.3 26.07 .. .. .. 25.30 .. .. ..CRI Costa Rica 88.6 24.7 3.20 8.54 3.52 9.47 3.47 8.98 3.81 9.82CSFR Former Czecheslovakia 147.9 30.3 .. .. .. .. .. .. .. ..CSFR-CZE Czech Republic 275.2 24.6 3.12 7.04 3.29 7.49 3.51 7.79 3.70 8.27CSFR-SVK Slovakia 364.4 13.1 7.75 9.42 7.97 9.80 8.22 9.35 8.46 9.70CUB Cuba 976.0 24.9 9.93 24.82 9.94 24.91 10.09 23.94 10.11 24.04CYM Cayman Islands 2.4 18.2 5.73 .. .. .. 6.86 .. .. ..CYP CyprusBL 144.9 25.0 19.22 19.78 .. .. 18.92 17.45 .. ..DEU Germany 3401.1 28.8 4.67 6.82 5.30 7.52 5.09 8.97 5.74 10.02DJI Djibouti 5.6 30.2 1.28 .. .. .. 1.23 .. .. ..DMA Dominica 25.9 22.5 11.97 .. .. .. 28.47 .. .. ..DNK Denmark 167.1 36.1 3.70 5.97 3.98 6.51 3.81 5.86 4.10 6.34DOM Dominican Republic 776.5 12.1 11.97 17.40 12.13 17.82 13.41 18.25 13.54 18.58DZA AlgeriaBL 1330.2 16.5 6.20 14.82 .. .. 5.95 15.67 .. ..ECU Ecuador 559.4 15.3 6.48 11.82 6.55 12.22 6.50 13.00 6.56 13.37
Source : DIOC-E 2000 release 2.0, Barro and Lee (2010) and Lutz et al. (2010)
Emigration rates in %Total Women
Version 1 Version 2 Version 1 Version 2
Notes : Version 1 includes foreign-born persons in the population of the country of residence in the calculation of emigration rates. Version 2 excludes foreign-born persons of the population in the country of residence in the calculation of emigration rates. "BL" underlying education f igures in the country of origin base on Barro and Lee (2010);"L" underlying education f igures in the country of origin base on Lutz (2010).
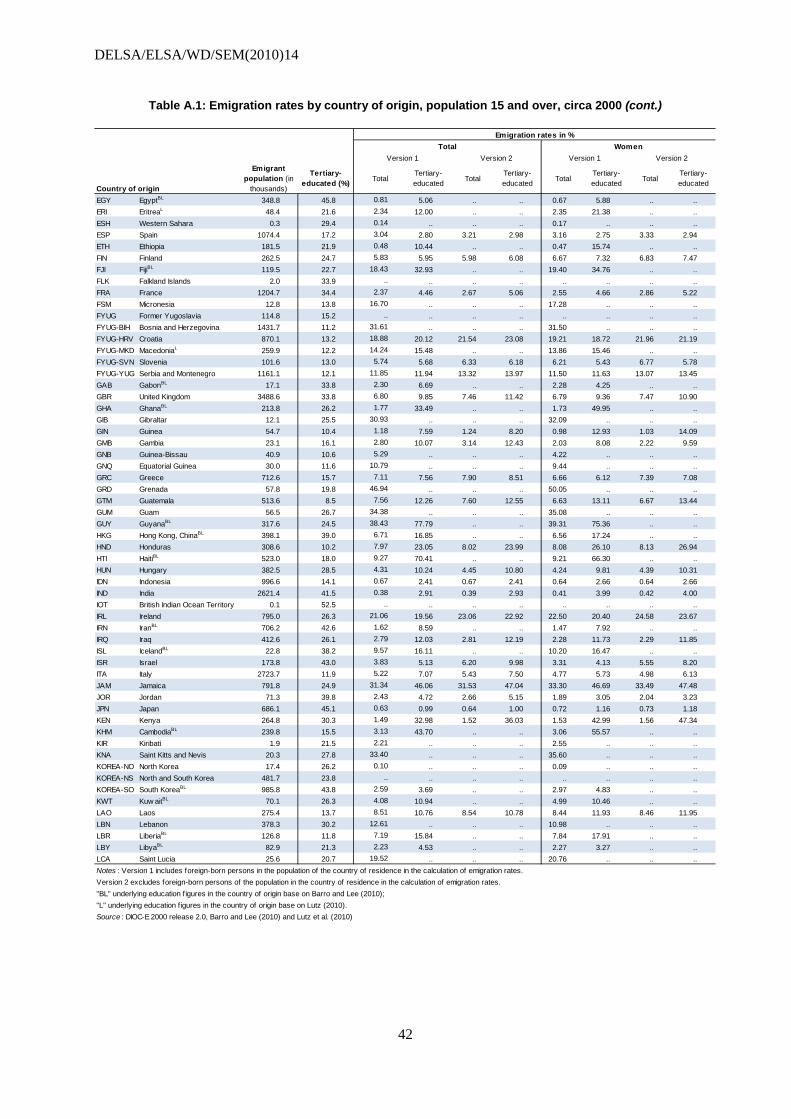
DELSA/ELSA/WD/SEM(2010)14
42
Table A.1: Emigration rates by country of origin, population 15 and over, circa 2000 (cont.)
Country of origin
Emigrant population (in
thousands)
Tertiary-educated (%) Total
Tertiary-educated Total
Tertiary-educated Total
Tertiary-educated Total
Tertiary-educated
EGY EgyptBL 348.8 45.8 0.81 5.06 .. .. 0.67 5.88 .. ..ERI EritreaL 48.4 21.6 2.34 12.00 .. .. 2.35 21.38 .. ..ESH Western Sahara 0.3 29.4 0.14 .. .. .. 0.17 .. .. ..ESP Spain 1074.4 17.2 3.04 2.80 3.21 2.98 3.16 2.75 3.33 2.94ETH Ethiopia 181.5 21.9 0.48 10.44 .. .. 0.47 15.74 .. ..FIN Finland 262.5 24.7 5.83 5.95 5.98 6.08 6.67 7.32 6.83 7.47FJI FijiBL 119.5 22.7 18.43 32.93 .. .. 19.40 34.76 .. ..FLK Falkland Islands 2.0 33.9 .. .. .. .. .. .. .. ..FRA France 1204.7 34.4 2.37 4.46 2.67 5.06 2.55 4.66 2.86 5.22FSM Micronesia 12.8 13.8 16.70 .. .. .. 17.28 .. .. ..FYUG Former Yugoslavia 114.8 15.2 .. .. .. .. .. .. .. ..FYUG-BIH Bosnia and Herzegovina 1431.7 11.2 31.61 .. .. .. 31.50 .. .. ..FYUG-HRV Croatia 870.1 13.2 18.88 20.12 21.54 23.08 19.21 18.72 21.96 21.19FYUG-MKD MacedoniaL 259.9 12.2 14.24 15.48 .. .. 13.86 15.46 .. ..FYUG-SVN Slovenia 101.6 13.0 5.74 5.68 6.33 6.18 6.21 5.43 6.77 5.78FYUG-YUG Serbia and Montenegro 1161.1 12.1 11.85 11.94 13.32 13.97 11.50 11.63 13.07 13.45GAB GabonBL 17.1 33.8 2.30 6.69 .. .. 2.28 4.25 .. ..GBR United Kingdom 3488.6 33.8 6.80 9.85 7.46 11.42 6.79 9.36 7.47 10.90GHA GhanaBL 213.8 26.2 1.77 33.49 .. .. 1.73 49.95 .. ..GIB Gibraltar 12.1 25.5 30.93 .. .. .. 32.09 .. .. ..GIN Guinea 54.7 10.4 1.18 7.59 1.24 8.20 0.98 12.93 1.03 14.09GMB Gambia 23.1 16.1 2.80 10.07 3.14 12.43 2.03 8.08 2.22 9.59GNB Guinea-Bissau 40.9 10.6 5.29 .. .. .. 4.22 .. .. ..GNQ Equatorial Guinea 30.0 11.6 10.79 .. .. .. 9.44 .. .. ..GRC Greece 712.6 15.7 7.11 7.56 7.90 8.51 6.66 6.12 7.39 7.08GRD Grenada 57.8 19.8 46.94 .. .. .. 50.05 .. .. ..GTM Guatemala 513.6 8.5 7.56 12.26 7.60 12.55 6.63 13.11 6.67 13.44GUM Guam 56.5 26.7 34.38 .. .. .. 35.08 .. .. ..GUY GuyanaBL 317.6 24.5 38.43 77.79 .. .. 39.31 75.36 .. ..HKG Hong Kong, ChinaBL 398.1 39.0 6.71 16.85 .. .. 6.56 17.24 .. ..HND Honduras 308.6 10.2 7.97 23.05 8.02 23.99 8.08 26.10 8.13 26.94HTI HaitiBL 523.0 18.0 9.27 70.41 .. .. 9.21 66.30 .. ..HUN Hungary 382.5 28.5 4.31 10.24 4.45 10.80 4.24 9.81 4.39 10.31IDN Indonesia 996.6 14.1 0.67 2.41 0.67 2.41 0.64 2.66 0.64 2.66IND India 2621.4 41.5 0.38 2.91 0.39 2.93 0.41 3.99 0.42 4.00IOT British Indian Ocean Territory 0.1 52.5 .. .. .. .. .. .. .. ..IRL Ireland 795.0 26.3 21.06 19.56 23.06 22.92 22.50 20.40 24.58 23.67IRN IranBL 706.2 42.6 1.62 8.59 .. .. 1.47 7.92 .. ..IRQ Iraq 412.6 26.1 2.79 12.03 2.81 12.19 2.28 11.73 2.29 11.85ISL IcelandBL 22.8 38.2 9.57 16.11 .. .. 10.20 16.47 .. ..ISR Israel 173.8 43.0 3.83 5.13 6.20 9.98 3.31 4.13 5.55 8.20ITA Italy 2723.7 11.9 5.22 7.07 5.43 7.50 4.77 5.73 4.98 6.13JAM Jamaica 791.8 24.9 31.34 46.06 31.53 47.04 33.30 46.69 33.49 47.48JOR Jordan 71.3 39.8 2.43 4.72 2.66 5.15 1.89 3.05 2.04 3.23JPN Japan 686.1 45.1 0.63 0.99 0.64 1.00 0.72 1.16 0.73 1.18KEN Kenya 264.8 30.3 1.49 32.98 1.52 36.03 1.53 42.99 1.56 47.34KHM CambodiaBL 239.8 15.5 3.13 43.70 .. .. 3.06 55.57 .. ..KIR Kiribati 1.9 21.5 2.21 .. .. .. 2.55 .. .. ..KNA Saint Kitts and Nevis 20.3 27.8 33.40 .. .. .. 35.60 .. .. ..KOREA-NO North Korea 17.4 26.2 0.10 .. .. .. 0.09 .. .. ..KOREA-NS North and South Korea 481.7 23.8 .. .. .. .. .. .. .. ..KOREA-SO South KoreaBL 985.8 43.8 2.59 3.69 .. .. 2.97 4.83 .. ..KWT Kuw aitBL 70.1 26.3 4.08 10.94 .. .. 4.99 10.46 .. ..LAO Laos 275.4 13.7 8.51 10.76 8.54 10.78 8.44 11.93 8.46 11.95LBN Lebanon 378.3 30.2 12.61 .. .. .. 10.98 .. .. ..LBR LiberiaBL 126.8 11.8 7.19 15.84 .. .. 7.84 17.91 .. ..LBY LibyaBL 82.9 21.3 2.23 4.53 .. .. 2.27 3.27 .. ..LCA Saint Lucia 25.6 20.7 19.52 .. .. .. 20.76 .. .. ..
Source : DIOC-E 2000 release 2.0, Barro and Lee (2010) and Lutz et al. (2010)
Version 1 Version 2 Version 1 Version 2
Notes : Version 1 includes foreign-born persons in the population of the country of residence in the calculation of emigration rates. Version 2 excludes foreign-born persons of the population in the country of residence in the calculation of emigration rates. "BL" underlying education f igures in the country of origin base on Barro and Lee (2010);"L" underlying education f igures in the country of origin base on Lutz (2010).
Emigration rates in %Total Women
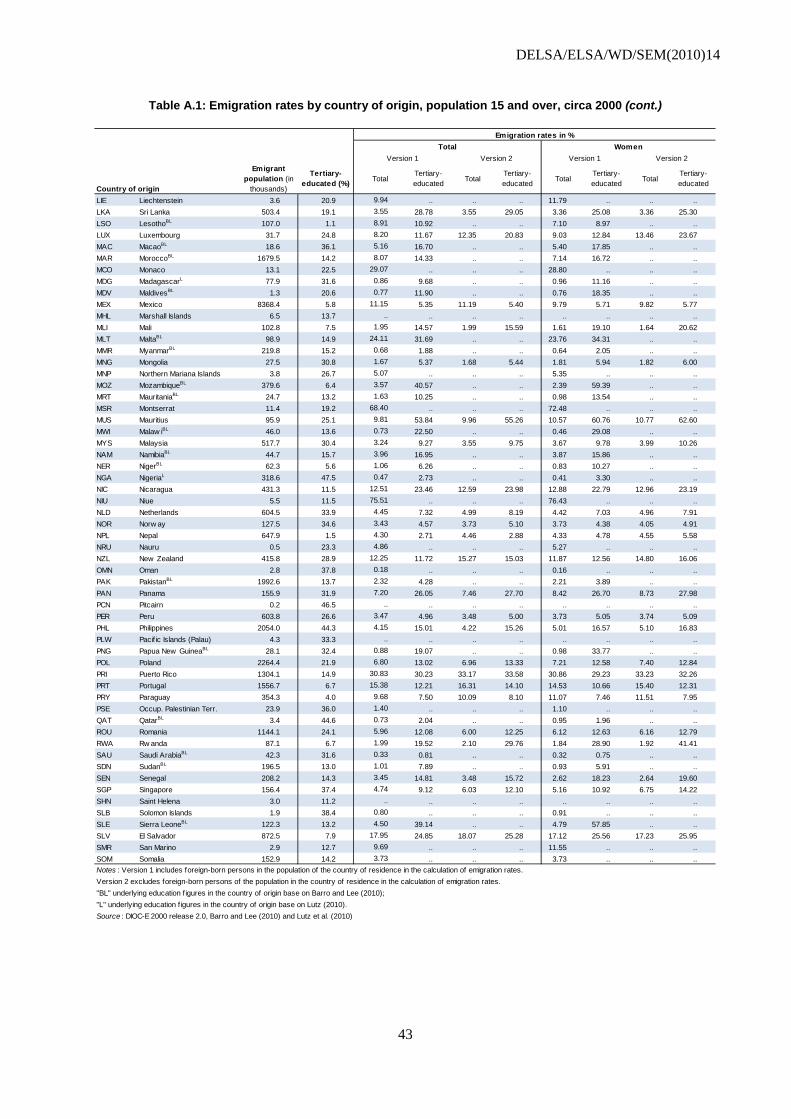
DELSA/ELSA/WD/SEM(2010)14
43
Table A.1: Emigration rates by country of origin, population 15 and over, circa 2000 (cont.)
Country of origin
Emigrant population (in
thousands)
Tertiary-educated (%) Total
Tertiary-educated Total
Tertiary-educated Total
Tertiary-educated Total
Tertiary-educated
LIE Liechtenstein 3.6 20.9 9.94 .. .. .. 11.79 .. .. ..LKA Sri Lanka 503.4 19.1 3.55 28.78 3.55 29.05 3.36 25.08 3.36 25.30LSO LesothoBL 107.0 1.1 8.91 10.92 .. .. 7.10 8.97 .. ..LUX Luxembourg 31.7 24.8 8.20 11.67 12.35 20.83 9.03 12.84 13.46 23.67MAC MacaoBL 18.6 36.1 5.16 16.70 .. .. 5.40 17.85 .. ..MAR MoroccoBL 1679.5 14.2 8.07 14.33 .. .. 7.14 16.72 .. ..MCO Monaco 13.1 22.5 29.07 .. .. .. 28.80 .. .. ..MDG MadagascarL 77.9 31.6 0.86 9.68 .. .. 0.96 11.16 .. ..MDV MaldivesBL 1.3 20.6 0.77 11.90 .. .. 0.76 18.35 .. ..MEX Mexico 8368.4 5.8 11.15 5.35 11.19 5.40 9.79 5.71 9.82 5.77MHL Marshall Islands 6.5 13.7 .. .. .. .. .. .. .. ..MLI Mali 102.8 7.5 1.95 14.57 1.99 15.59 1.61 19.10 1.64 20.62MLT MaltaBL 98.9 14.9 24.11 31.69 .. .. 23.76 34.31 .. ..MMR MyanmarBL 219.8 15.2 0.68 1.88 .. .. 0.64 2.05 .. ..MNG Mongolia 27.5 30.8 1.67 5.37 1.68 5.44 1.81 5.94 1.82 6.00MNP Northern Mariana Islands 3.8 26.7 5.07 .. .. .. 5.35 .. .. ..MOZ MozambiqueBL 379.6 6.4 3.57 40.57 .. .. 2.39 59.39 .. ..MRT MauritaniaBL 24.7 13.2 1.63 10.25 .. .. 0.98 13.54 .. ..MSR Montserrat 11.4 19.2 68.40 .. .. .. 72.48 .. .. ..MUS Mauritius 95.9 25.1 9.81 53.84 9.96 55.26 10.57 60.76 10.77 62.60MWI Malaw iBL 46.0 13.6 0.73 22.50 .. .. 0.46 29.08 .. ..MYS Malaysia 517.7 30.4 3.24 9.27 3.55 9.75 3.67 9.78 3.99 10.26NAM NamibiaBL 44.7 15.7 3.96 16.95 .. .. 3.87 15.86 .. ..NER NigerBL 62.3 5.6 1.06 6.26 .. .. 0.83 10.27 .. ..NGA NigeriaL 318.6 47.5 0.47 2.73 .. .. 0.41 3.30 .. ..NIC Nicaragua 431.3 11.5 12.51 23.46 12.59 23.98 12.88 22.79 12.96 23.19NIU Niue 5.5 11.5 75.51 .. .. .. 76.43 .. .. ..NLD Netherlands 604.5 33.9 4.45 7.32 4.99 8.19 4.42 7.03 4.96 7.91NOR Norw ay 127.5 34.6 3.43 4.57 3.73 5.10 3.73 4.38 4.05 4.91NPL Nepal 647.9 1.5 4.30 2.71 4.46 2.88 4.33 4.78 4.55 5.58NRU Nauru 0.5 23.3 4.86 .. .. .. 5.27 .. .. ..NZL New Zealand 415.8 28.9 12.25 11.72 15.27 15.03 11.87 12.56 14.80 16.06OMN Oman 2.8 37.8 0.18 .. .. .. 0.16 .. .. ..PAK PakistanBL 1992.6 13.7 2.32 4.28 .. .. 2.21 3.89 .. ..PAN Panama 155.9 31.9 7.20 26.05 7.46 27.70 8.42 26.70 8.73 27.98PCN Pitcairn 0.2 46.5 .. .. .. .. .. .. .. ..PER Peru 603.8 26.6 3.47 4.96 3.48 5.00 3.73 5.05 3.74 5.09PHL Philippines 2054.0 44.3 4.15 15.01 4.22 15.26 5.01 16.57 5.10 16.83PLW Pacif ic Islands (Palau) 4.3 33.3 .. .. .. .. .. .. .. ..PNG Papua New GuineaBL 28.1 32.4 0.88 19.07 .. .. 0.98 33.77 .. ..POL Poland 2264.4 21.9 6.80 13.02 6.96 13.33 7.21 12.58 7.40 12.84PRI Puerto Rico 1304.1 14.9 30.83 30.23 33.17 33.58 30.86 29.23 33.23 32.26PRT Portugal 1556.7 6.7 15.38 12.21 16.31 14.10 14.53 10.66 15.40 12.31PRY Paraguay 354.3 4.0 9.68 7.50 10.09 8.10 11.07 7.46 11.51 7.95PSE Occup. Palestinian Terr. 23.9 36.0 1.40 .. .. .. 1.10 .. .. ..QAT QatarBL 3.4 44.6 0.73 2.04 .. .. 0.95 1.96 .. ..ROU Romania 1144.1 24.1 5.96 12.08 6.00 12.25 6.12 12.63 6.16 12.79RWA Rw anda 87.1 6.7 1.99 19.52 2.10 29.76 1.84 28.90 1.92 41.41SAU Saudi ArabiaBL 42.3 31.6 0.33 0.81 .. .. 0.32 0.75 .. ..SDN SudanBL 196.5 13.0 1.01 7.89 .. .. 0.93 5.91 .. ..SEN Senegal 208.2 14.3 3.45 14.81 3.48 15.72 2.62 18.23 2.64 19.60SGP Singapore 156.4 37.4 4.74 9.12 6.03 12.10 5.16 10.92 6.75 14.22SHN Saint Helena 3.0 11.2 .. .. .. .. .. .. .. ..SLB Solomon Islands 1.9 38.4 0.80 .. .. .. 0.91 .. .. ..SLE Sierra LeoneBL 122.3 13.2 4.50 39.14 .. .. 4.79 57.85 .. ..SLV El Salvador 872.5 7.9 17.95 24.85 18.07 25.28 17.12 25.56 17.23 25.95SMR San Marino 2.9 12.7 9.69 .. .. .. 11.55 .. .. ..SOM Somalia 152.9 14.2 3.73 .. .. .. 3.73 .. .. ..
Source : DIOC-E 2000 release 2.0, Barro and Lee (2010) and Lutz et al. (2010)
Version 2 excludes foreign-born persons of the population in the country of residence in the calculation of emigration rates. "BL" underlying education f igures in the country of origin base on Barro and Lee (2010);"L" underlying education f igures in the country of origin base on Lutz (2010).
Notes : Version 1 includes foreign-born persons in the population of the country of residence in the calculation of emigration rates.
Emigration rates in %Total Women
Version 1 Version 2 Version 1 Version 2
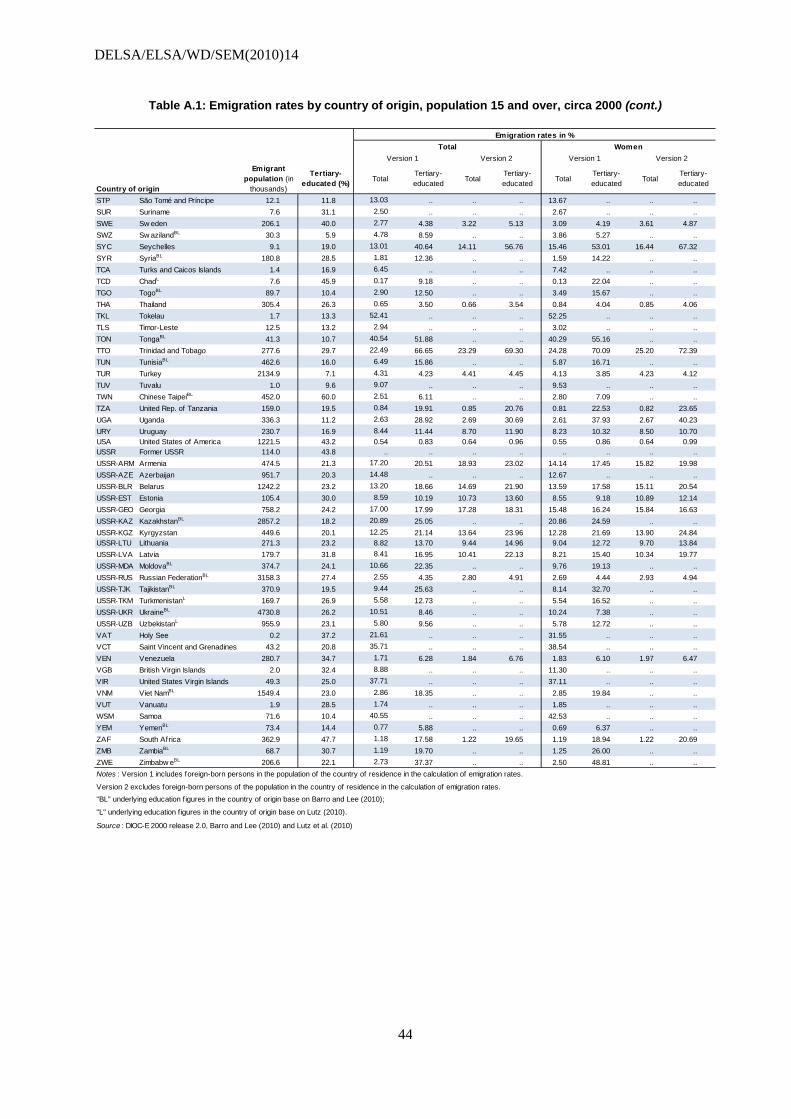
DELSA/ELSA/WD/SEM(2010)14
44
Table A.1: Emigration rates by country of origin, population 15 and over, circa 2000 (cont.)
Country of origin
Emigrant population (in
thousands)
Tertiary-educated (%) Total
Tertiary-educated Total
Tertiary-educated Total
Tertiary-educated Total
Tertiary-educated
STP São Tomé and Príncipe 12.1 11.8 13.03 .. .. .. 13.67 .. .. ..SUR Suriname 7.6 31.1 2.50 .. .. .. 2.67 .. .. ..SWE Sw eden 206.1 40.0 2.77 4.38 3.22 5.13 3.09 4.19 3.61 4.87SWZ Sw azilandBL 30.3 5.9 4.78 8.59 .. .. 3.86 5.27 .. ..SYC Seychelles 9.1 19.0 13.01 40.64 14.11 56.76 15.46 53.01 16.44 67.32SYR SyriaBL 180.8 28.5 1.81 12.36 .. .. 1.59 14.22 .. ..TCA Turks and Caicos Islands 1.4 16.9 6.45 .. .. .. 7.42 .. .. ..TCD ChadL 7.6 45.9 0.17 9.18 .. .. 0.13 22.04 .. ..TGO TogoBL 89.7 10.4 2.90 12.50 .. .. 3.49 15.67 .. ..THA Thailand 305.4 26.3 0.65 3.50 0.66 3.54 0.84 4.04 0.85 4.06TKL Tokelau 1.7 13.3 52.41 .. .. .. 52.25 .. .. ..TLS Timor-Leste 12.5 13.2 2.94 .. .. .. 3.02 .. .. ..TON TongaBL 41.3 10.7 40.54 51.88 .. .. 40.29 55.16 .. ..TTO Trinidad and Tobago 277.6 29.7 22.49 66.65 23.29 69.30 24.28 70.09 25.20 72.39TUN TunisiaBL 462.6 16.0 6.49 15.86 .. .. 5.87 16.71 .. ..TUR Turkey 2134.9 7.1 4.31 4.23 4.41 4.45 4.13 3.85 4.23 4.12TUV Tuvalu 1.0 9.6 9.07 .. .. .. 9.53 .. .. ..TWN Chinese TaipeiBL 452.0 60.0 2.51 6.11 .. .. 2.80 7.09 .. ..TZA United Rep. of Tanzania 159.0 19.5 0.84 19.91 0.85 20.76 0.81 22.53 0.82 23.65UGA Uganda 336.3 11.2 2.63 28.92 2.69 30.69 2.61 37.93 2.67 40.23URY Uruguay 230.7 16.9 8.44 11.44 8.70 11.90 8.23 10.32 8.50 10.70USA United States of America 1221.5 43.2 0.54 0.83 0.64 0.96 0.55 0.86 0.64 0.99USSR Former USSR 114.0 43.8 .. .. .. .. .. .. .. ..USSR-ARM Armenia 474.5 21.3 17.20 20.51 18.93 23.02 14.14 17.45 15.82 19.98USSR-AZE Azerbaijan 951.7 20.3 14.48 .. .. .. 12.67 .. .. ..USSR-BLR Belarus 1242.2 23.2 13.20 18.66 14.69 21.90 13.59 17.58 15.11 20.54USSR-EST Estonia 105.4 30.0 8.59 10.19 10.73 13.60 8.55 9.18 10.89 12.14USSR-GEO Georgia 758.2 24.2 17.00 17.99 17.28 18.31 15.48 16.24 15.84 16.63USSR-KAZ KazakhstanBL 2857.2 18.2 20.89 25.05 .. .. 20.86 24.59 .. ..USSR-KGZ Kyrgyzstan 449.6 20.1 12.25 21.14 13.64 23.96 12.28 21.69 13.90 24.84USSR-LTU Lithuania 271.3 23.2 8.82 13.70 9.44 14.96 9.04 12.72 9.70 13.84USSR-LVA Latvia 179.7 31.8 8.41 16.95 10.41 22.13 8.21 15.40 10.34 19.77USSR-MDA MoldovaBL 374.7 24.1 10.66 22.35 .. .. 9.76 19.13 .. ..USSR-RUS Russian FederationBL 3158.3 27.4 2.55 4.35 2.80 4.91 2.69 4.44 2.93 4.94USSR-TJK TajikistanBL 370.9 19.5 9.44 25.63 .. .. 8.14 32.70 .. ..USSR-TKM TurkmenistanL 169.7 26.9 5.58 12.73 .. .. 5.54 16.52 .. ..USSR-UKR UkraineBL 4730.8 26.2 10.51 8.46 .. .. 10.24 7.38 .. ..USSR-UZB UzbekistanL 955.9 23.1 5.80 9.56 .. .. 5.78 12.72 .. ..VAT Holy See 0.2 37.2 21.61 .. .. .. 31.55 .. .. ..VCT Saint Vincent and Grenadines 43.2 20.8 35.71 .. .. .. 38.54 .. .. ..VEN Venezuela 280.7 34.7 1.71 6.28 1.84 6.76 1.83 6.10 1.97 6.47VGB British Virgin Islands 2.0 32.4 8.88 .. .. .. 11.30 .. .. ..VIR United States Virgin Islands 49.3 25.0 37.71 .. .. .. 37.11 .. .. ..VNM Viet NamBL 1549.4 23.0 2.86 18.35 .. .. 2.85 19.84 .. ..VUT Vanuatu 1.9 28.5 1.74 .. .. .. 1.85 .. .. ..WSM Samoa 71.6 10.4 40.55 .. .. .. 42.53 .. .. ..YEM YemenBL 73.4 14.4 0.77 5.88 .. .. 0.69 6.37 .. ..ZAF South Africa 362.9 47.7 1.18 17.58 1.22 19.65 1.19 18.94 1.22 20.69ZMB ZambiaBL 68.7 30.7 1.19 19.70 .. .. 1.25 26.00 .. ..ZWE Zimbabw eBL 206.6 22.1 2.73 37.37 .. .. 2.50 48.81 .. ..
Source : DIOC-E 2000 release 2.0, Barro and Lee (2010) and Lutz et al. (2010)
Emigration rates in %
"BL" underlying education f igures in the country of origin base on Barro and Lee (2010);
"L" underlying education f igures in the country of origin base on Lutz (2010).
Notes : Version 1 includes foreign-born persons in the population of the country of residence in the calculation of emigration rates.
Version 2 excludes foreign-born persons of the population in the country of residence in the calculation of emigration rates.
Total WomenVersion 1 Version 2 Version 1 Version 2

DELSA/ELSA/WD/SEM(2010)14
45
Table A.2: Variables included in the DIOC-E and detailed sources by country
File reference 1 2 3Main theme Education, Age a and Gender Labour force status Occupation
- County of residence - Country of residence - Country of residence- Country of birth - Country of birth - Country of birth- Education - Education - Education- Gender - Gender - Gender- Age - Labour force status - Occupation
Reference population All 15+ All 15+ 15+ employed Foreign Born status EducationArgentina Census, 2001 Census, 2001 Census, 2001 Country of birth Mapping REDATAM The occupations recoded for the National Statistical Institute (INDEC) show a more industrial and skills-based organization and do not map
correctly to ISCO-88. The data in File 3 is therefore provided under the national classif ication (10 categories).Armenia Census, 2001 Census, 2001 Census, 2001 Country of birth ISCED levels CountryAustralia Census, 2001 Census, 2001 Census, 2001 Country of birth ISCED levels CountryAustria Census, 2001 Census, 2001 Census, 2001 Country of birth ISCED levels CountryBelarus Census, 2002 - - Country of birth Mapping Country There is no information to identify w hether the levels w ere completed or not. Belgium ESEG, 2001 ESEG, 2001 LFS, 1998-2002 Country of birth ISCED levels CountryBelize Census, 2000 Census, 2000 - Country of birth Mapping REDATAMBenin Census, 2002 Census, 2002 - Country of birth ISCED levels CountryBolivia Census, 2001 Census, 2001 Census, 2001 Country of birth Mapping IPUMSBrazil Census, 2000 Census, 2000 Census, 2000 Country of birth Mapping IPUMSBulgaria Census, 2001 Census, 2001 - Nationality ISCED levels CountryBurkina Faso Census, 2006 Census, 2006 - Country of birth ISCED levels CountryCanada Census, 2001 Census, 2001 Census, 2001 Country of birth ISCED levels CountryChile Census, 2002 Census, 2002 Census, 2002 Country of birth Mapping REDATAMColombia Census, 2005 Census, 2005 - Country of birth Mapping REDATAMCosta Rica Census, 2000 Census, 2000 Census, 2000 Country of birth Mapping REDATAMCroatia Census, 2001 Census, 2001 Census, 2001 Country of birth ISCED levels CountryCuba Census, 2002 Census, 2002 Census, 2002 Country of birth Mapping IPUMS There is no information to identify w hether the levels w ere completed or not. Czech Republic Census, 2001 Census, 2001 Census, 2001 Country of birth ISCED levels CountryDenmark Register, 2002 Register, 2002 Register, 2002 Country of birth ISCED levels CountryDominican Republic Census, 2002 Census, 2002 Census, 2002 Country of birth Mapping REDATAMEcuador Census, 2001 Census, 2001 Census, 2001 Country of birth Mapping Public data-INECEl Salvador Census, 2007 Census, 2007 Census, 2007 Country of birth Mapping REDATAMEstonia Census, 2000 Census, 2000 Census, 2000 Country of birth ISCED levels CountryFinland Register, 12/2000 Register, 12/2000 Register, 12/2000 Country of birth ISCED levels CountryFrance Census, 1999 Census, 1999 Census, 1999 Country of birth ISCED levels Country Data for France only refer to metropolitan France.Gambia Census, 2003 - - Nationality ISCED levels CountryGeorgia Census, 2002 - - Country of birth ISCED levels CountryGermany LFS, 1998-2002, 2005 LFS, 1998-2002, 2005 LFS, 1998-2002, 2005 Nationality ISCED levels CountryGreece Census, 2001 Census, 2001 Census, 2001 Country of birth ISCED levels CountryGuatemala Census, 2002 Census, 2002 Census, 2002 Country of birth Mapping CountryGuinea Census, 1996 Census, 1996 Census, 1996 Country of birth Mapping IPUMSHonduras Census, 2001 Census, 2001 Census, 2001 Country of birth Mapping REDATAMHungary Census, 2001 Census, 2001 Census, 2001 Country of birth ISCED levels CountryIndia NSS/Census, 2000 - - Country of birth ISCED levels WorldBank The age groups are 15-25 and 25+.Indonesia Census, 2000 Census, 2000 - Nationality Mapping Country Nationality is only identif ied for 12 countries. The share of foreigners for w hom the country of nationality is unknow n is around 63%.
There is no information to identify w hether the levels w ere completed or not. Iraq Census, 1997 Census, 1997 Census, 1997 Country of birth Mapping IPUMS There is no information to identify w hether the levels w ere completed or not. Ireland Census, 2002 Census, 2002 Census, 2002 Country of birth ISCED levels CountryIsrael LFS, 2001 LFS, 2001 LFS, 2001 Country of birth Mapping CountryItaly Census, 2001 Census, 2001 Census, 2001 Country of birth ISCED levels CountryNote: ESEG: Enquête socio-économique générale; ESPA: Enquête suisse sur la population active; LFS: Labour force survey; IPUMS: Integrated Public Use Microdata Series; REDATAM: Retrieval of DaTa for small Areas by Microcomputer
Definition of variablesObservations
Variables includedMain source of data

DELSA/ELSA/WD/SEM(2010)14
46
Table A.2: Variables included in the DIOC-E and detailed sources by country (cont.)
File reference 1 2 3Main theme Education, Age a and Gender Labour force status Occupation
- County of residence - Country of residence - Country of residence- Country of birth - Country of birth - Country of birth- Education - Education - Education- Gender - Gender - Gender- Age - Labour force status - Occupation
Reference population All 15+ All 15+ 15+ employed Foreign Born status EducationJamaica Census, 2001 - - Country of birh ISCED levels CountryJapan Census, 2000 Census, 2000 Census, 2000 Nationality ISCED levels Country The available Japan Standard Classif ication of Occupations (JSOC) is too different from ISCO-88 and not detailed enough to allow the
construction of a satisfying correspondence table betw een the tw o. In particular, the ISCO-88 major groups 2 (Professionals) and 3 (Technicians and associate professionals) cannot be identif ied in the Japanese classif ication, w here they belong to a single category “Professional and technical w orkers”. The Japanese classif ication w as therefore kept as is in the database (File 3).
Jordan Census, 2004 Census, 2004 Census, 2004 Nationality Mapping IPUMS The variable nationality is only coded at a regional level (i.e. Jordan, Arab Asian countries, non-Arab Asian countries, w estern European countries, eastern European countries, American countries). Therefore, the maximum level of detail is continents of birth. The percentage of foreign-born for w hom the country of birth remains unknow n is high (46%).
Kenya Census,1999 Census,1999 - Country of birth Mapping IPUMS The variable country of birth w as only surveyed for selected African countries: Ethiopia, Somalia, Sudan, Tanzania, Uganda and “Other Kyrgyz Republic Census,1999 Census,1999 Census,1999 Country of birth Mapping IPUMS The age groups are 16-24, 25-64 and 65+. Persons aged 15 are therefore missing for these three countries. Since individuals betw een 15
and 16 are not included in the original database, in File 2 their labour status is coded as “unknow n” (99). Laos Census, 1995 Census, 1995 Census, 1995 Country of birth ISCED levels CountryLatvia Census, 2001 Census, 2001 Census, 2001 Country of birth ISCED levels CountryLithuania Census, 2001 Census, 2001 Census, 2001 Nationality ISCED levels CountryLuxembourg Census, 2001 Census, 2001 Census, 2001 Country of birth ISCED levels CountryMalaysia Census, 2000 Census, 2000 Census, 2000 Country of birth Mapping IPUMS The share of foreign-born for w hom the country of birth is unknow n is around 24%. There is no information to identify w hether the levels
w ere completed or not. Mali Census, 1998 Census, 1998 - Country of birth ISCED levels CountryMauritius Census, 2000 Census, 2000 Census, 2000 Country of birth ISCED levels CountryMexico Census, 2000 Census, 2000 Census, 2000 Country of birth ISCED levels CountryMongolia Census, 2000 Census, 2000 Census, 2000 Country of birth Mapping IPUMS Only f ive countries of birth are identif ied in the census. The share of foreign-born for w hom the country of birth is unknow n is around
21%. For secondary and tertiary education it is not possible to identify w hether people completed the levels or not.
Nepal Census, 2001 Census, 2001 Census, 2001 Country of birth Mapping IPUMSNetherlands LFS, 1998-2002 LFS, 1998-2002 LFS, 1998-2002 Country of birth ISCED levels CountryNew Zealand Census, 2001 Census, 2001 Census, 2001 Country of birth ISCED levels CountryNicaragua Census, 2005 Census, 2005 Census, 2005 Country of birth Mapping REDATAMNorway Registers, 12/2003 Registers, 12/2003 LFS, 1998-2002 Country of birth ISCED levels Country Illiterate people or people w ith no education are not recorded in the ISCED 0 category, but classif ied as education “unknow n”.Panama Census, 2000 Census, 2000 Census, 2000 Country of birth Mapping REDATAMParaguay Census, 2002 Census, 2002 Census, 2002 Country of birth Mapping REDATAMPeru Census, 2007 Census, 2007 Census, 2007 Country of birth Mapping Public data-INE There is no information to identify w hether the levels w ere completed or not. The share of persons w ith tertiary education is particularly
high (18%) to comparable countries. This may be due to the inclusion of post-secondary non-tertiary programs in this category, but as no information on the number of years is available this issue could not be solved.
Philippines Census, 2000 - - Country of birth Mapping IPUMS The share of foreign-born for w hom the country of birth is unknow n is around 50%.Poland Census, 2001 Census, 2001 Census, 2001 Country of birth ISCED levels CountryPortugal Census, 2001 Census, 2001 Census, 2001 Country of birth ISCED levels CountryPuerto Rico Census, 2000 Census,2000 Census,2000 Country of birth Mapping IPUMSRomania Census, 2002 Census,2002 Census,2002 Country of birth Mapping IPUMS There is no information to identify w hether the levels w ere completed or not. Russia Census, 2002 Census, 2002 Census, 2002 Country of birth ISCED levels CountryRwanda Census, 2002 Census, 2002 Census, 2002 Country of birth Mapping IPUMSSenegal Census, 2002 Census, 2002 Census, 2002 Nationality ISCED levels CountrySerbia Census, 2001 Census, 2001 Census, 2001 Nationality ISCED levels Country
Definition of variablesObservations
Variables includedMain source of data
Note: ESEG: Enquête socio-économique générale; ESPA: Enquête suisse sur la population active; LFS: Labour force survey; IPUMS: Integrated Public Use Microdata Series; REDATAM: Retrieval of DaTa for small Areas by Microcomputer

DELSA/ELSA/WD/SEM(2010)14
47
Table A.2: Variables included in the DIOC-E and detailed sources by country (cont.)
File reference 1 2 3Main theme Education, Age a and Gender Labour force status Occupation
- County of residence - Country of residence - Country of residence- Country of birth - Country of birth - Country of birth- Education - Education - Education- Gender - Gender - Gender- Age - Labour force status - Occupation
Reference population All 15+ All 15+ 15+ employed Foreign Born status EducationSeychelles Census, 2000 Census, 2000 Census, 2000 Nationality ISCED levels CountrySingapore Census, 2000 - - Nationality Mapping Country The variable age is not available. The original data of country of birth included the follow ing categories: “Malaysia”, “Indonesia”, “China,
Hong Kong and Chinese Taipei”, “South Asia” (including India, Pakistan, Bangladesh and Sri Lanka), “Other Asian Countries”, “European Countries”, “USA and Canada” and “Others”. “India” could be identified from the category “South Asia”, based on information from the United Nations Global Migration Database version 0.3.6 by applying the number of Indian-born by sex and age, whereas the educational attainment structure remained unchanged. The other countries of the “South Asia” category, Pakistan, Bangladesh and Sri Lanka, were classified with “Other Asian countries” into one category “Asia”. The category “China, Hong Kong and Chinese Taipei” is coded as China.
Slovak Republic Census, 2001 Census, 2001 Census, 2001 Country of birth ISCED levels CountrySlovenia Census, 2002 Census, 2002 Census, 2002 Country of birth ISCED levels Country There is no information to identify w hether the levels w ere completed or not. South Africa Census, 2001 Census, 2001 Census, 2001 Country of birth Mapping IPUMS The age groups are 15-24, 25-64 and 65. Persons aged 66 and over are therefore missing for this country. Since individuals betw een 15
and 16 are not included in the original database, in File 2 their labour status is coded as “unknow n” (99). Spain Census, 2000 Census, 2000 Census, 2000 Country of birth ISCED levels Country The age groups are 16-24, 25-64 and 65+. Persons aged 15 are therefore missing for these three countries.Sri Lanka Census, 2001 Census, 2001 - Country of birth ISCED levels CountrySweden Registers, 12/2003 Registers, 12/2003 Registers, 12/2003 Country of birth ISCED levels Country Due to the unavailability of information on educational attainment for persons older than 74, the coverage is limited to people aged 16 to 74
years old in File 1, w hile it includes all people aged 15 and older in File 2 and people aged 16 and older in File 3.Switzerland Census, 2000 Census, 2000 Census, 2000 Country of birth ISCED levels CountryTanzania Census, 2002 Census, 2002 Census, 2002 Country of birth Mapping IPUMSThailand Census, 2000 Census, 2000 Census, 2000 Country of birth Mapping IPUMSTrinidad and Tobago Census, 2000 Census, 2000 - Country of birth Mapping REDATAMTurkey Census, 2000 Census, 2000 Census, 2000 Country of birth ISCED levels Country The occupations w ere provided according to ISCO-68, w hich is not compatible w ith ISCO-88 at the tw o-digit level. The data in File 3 is
therefore provided under ISCO-68 .Uganda Census, 2001 Census, 2001 Census, 2001 Country of birth Mapping IPUMSUnited Kingdom Census, 2001 Census, 2001 Census, 2001 Country of birth ISCED levels CountryUnited States Census, 2000 Census, 2000 Census, 2000 Country of birth ISCED levels Country The age groups are 16-24, 25-64 and 65+. Persons aged 15 are therefore missing for these three countries. The occupations w ere
provided according to the Census Bureau Occupation codes, w hich do not map correctly to ISCO-88, even at the one-digit level. The data in File 3 is therefore provided under the Census Bureau classif ication (23 categories).
Uruguay Census, 1996 Census, 1996 Census, 1996 Country of birth ISCED levels CountryVenezuela Census, 2001 Census, 2001 Census, 2001 Country of birth Mapping IPUMSNote: ESEG: Enquête socio-économique générale; ESPA: Enquête suisse sur la population active; LFS: Labour force survey; IPUMS: Integrated Public Use Microdata Series; REDATAM: Retrieval of DaTa for small Areas by Microcomputer
Definition of variablesObservations
Variables includedMain source of data

DELSA/ELSA/WD/SEM(2010)14
48
Map A.1: Country coverage in DIOC-E (release 2.0) and forthcoming extension
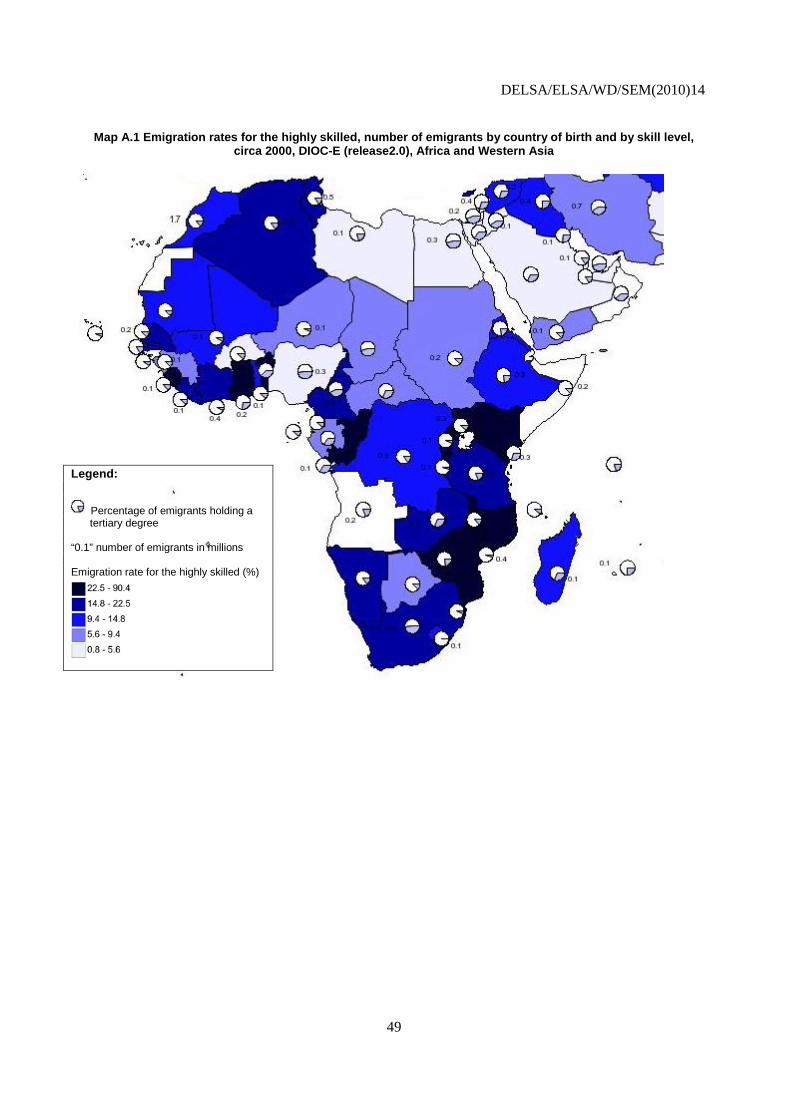
DELSA/ELSA/WD/SEM(2010)14
49
Map A.1 Emigration rates for the highly skilled, number of emigrants by country of birth and by skill level, circa 2000, DIOC-E (release2.0), Africa and Western Asia
Legend:
Percentage of emigrants holding a tertiary degree
“0.1” number of emigrants in millions Emigration rate for the highly skilled (%)

DELSA/ELSA/WD/SEM(2010)14
50
Map A.1 (cont.) Emigration rates for the highly skilled, number of emigrants by country of birth and by skill level, circa 2000, DIOC-E (release2.0), Asia and Oceania
Legend:
Percentage of emigrants holding a tertiary degree
“0.1” number of emigrants in millions Emigration rate for the highly skilled (%)

DELSA/ELSA/WD/SEM(2010)14
51
Map A.1 (cont.) Emigration rates for the highly skilled, number of emigrants by country of birth and by skill level, circa 2000, DIOC-E (release2.0), Europe
Legend:
Percentage of emigrants holding a tertiary degree
“0.1” number of emigrants in millions Emigration rate for the highly skilled (%)
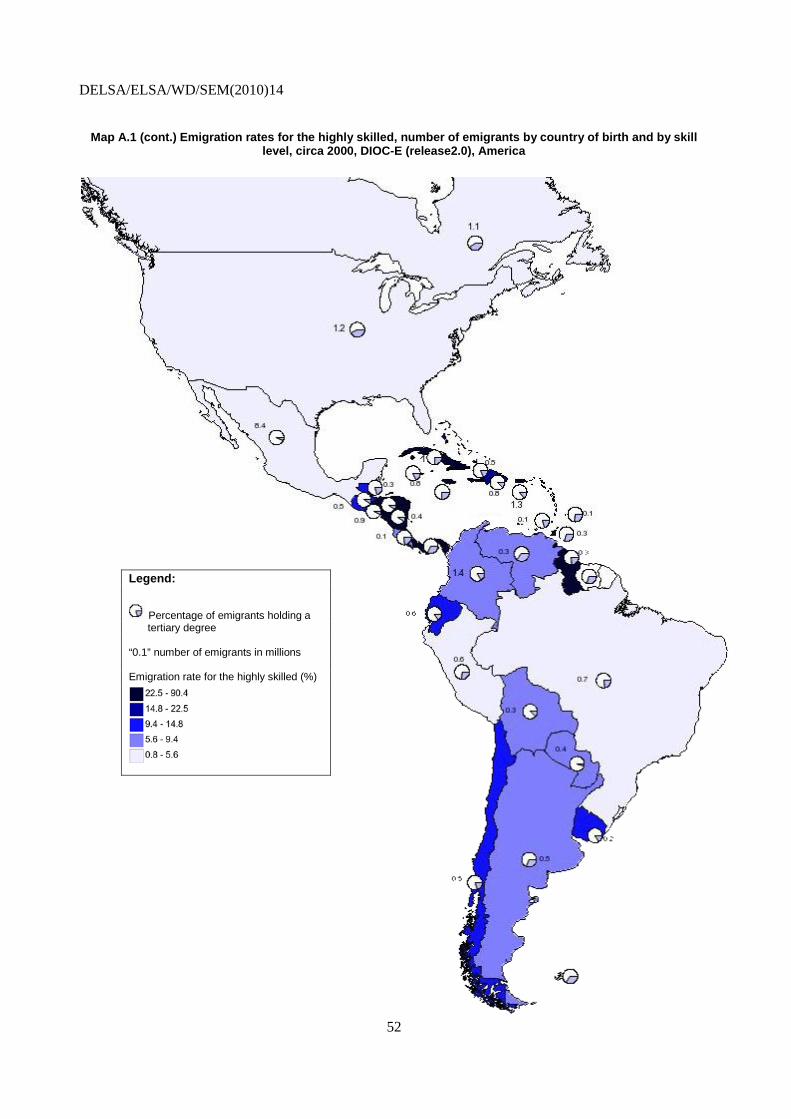
DELSA/ELSA/WD/SEM(2010)14
52
Map A.1 (cont.) Emigration rates for the highly skilled, number of emigrants by country of birth and by skill level, circa 2000, DIOC-E (release2.0), America
Legend:
Percentage of emigrants holding a tertiary degree
“0.1” number of emigrants in millions Emigration rate for the highly skilled (%)

DELSA/ELSA/WD/SEM(2010)14
53
Table A.3 Ratios between emigration rates for the highly skilled based on DIOC and on DIOC-E including new education data
0.2
0.4
0.6
0.8
1
1.2
1.4
GMB PAK JAM LBR CHN AFG SGP MOZ MMR MEX MYS SEN CYP IND JPN CHE FJI NPL RWA ISR DZA BEL DEU GRC GBR ISL CAF IRL FIN TTO GUY GHA MLI DNK JOR HKG SWE HTI IRN POL COL GTM FRA TUN NOR MUS SLE NER TGO ESP UGA
1
1.2
1.4
1.6
1.8
2
2.2
2.4
2.6
2.8
3
3.2
3.4
3.6
3.8
4
4.2
4.4
KEN HUN NLD CMR ZMB TZA PNG TUR COD AUT EGY IDN BGD BWA MWI IRQ LKA COG NZL NIC AUS PER CAN VEN KWT SDN BRA SLV DOM BRB HND ITA PRT ECU PHL BEN CRI URY PAN USA THA CHL BOL SWZ ZAF LSO ARG SYR PRY ZWE BHR
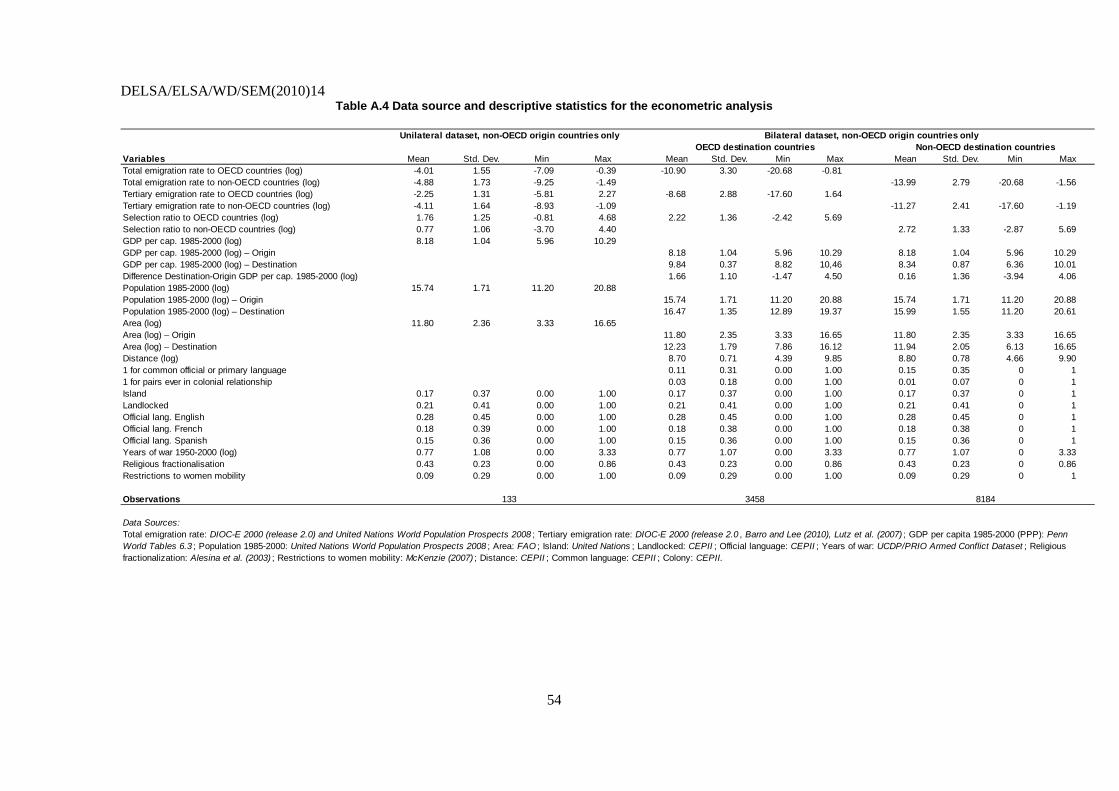
DELSA/ELSA/WD/SEM(2010)14
54
Table A.4 Data source and descriptive statistics for the econometric analysis
Variables Mean Std. Dev. Min Max Mean Std. Dev. Min Max Mean Std. Dev. Min MaxTotal emigration rate to OECD countries (log) -4.01 1.55 -7.09 -0.39 -10.90 3.30 -20.68 -0.81Total emigration rate to non-OECD countries (log) -4.88 1.73 -9.25 -1.49 -13.99 2.79 -20.68 -1.56Tertiary emigration rate to OECD countries (log) -2.25 1.31 -5.81 2.27 -8.68 2.88 -17.60 1.64Tertiary emigration rate to non-OECD countries (log) -4.11 1.64 -8.93 -1.09 -11.27 2.41 -17.60 -1.19Selection ratio to OECD countries (log) 1.76 1.25 -0.81 4.68 2.22 1.36 -2.42 5.69Selection ratio to non-OECD countries (log) 0.77 1.06 -3.70 4.40 2.72 1.33 -2.87 5.69GDP per cap. 1985-2000 (log) 8.18 1.04 5.96 10.29GDP per cap. 1985-2000 (log) – Origin 8.18 1.04 5.96 10.29 8.18 1.04 5.96 10.29GDP per cap. 1985-2000 (log) – Destination 9.84 0.37 8.82 10,46 8.34 0.87 6.36 10.01Difference Destination-Origin GDP per cap. 1985-2000 (log) 1.66 1.10 -1.47 4.50 0.16 1.36 -3.94 4.06Population 1985-2000 (log) 15.74 1.71 11.20 20.88Population 1985-2000 (log) – Origin 15.74 1.71 11.20 20.88 15.74 1.71 11.20 20.88Population 1985-2000 (log) – Destination 16.47 1.35 12.89 19.37 15.99 1.55 11.20 20.61Area (log) 11.80 2.36 3.33 16.65Area (log) – Origin 11.80 2.35 3.33 16.65 11.80 2.35 3.33 16.65Area (log) – Destination 12.23 1.79 7.86 16.12 11.94 2.05 6.13 16.65Distance (log) 8.70 0.71 4.39 9.85 8.80 0.78 4.66 9.901 for common official or primary language 0.11 0.31 0.00 1.00 0.15 0.35 0 11 for pairs ever in colonial relationship 0.03 0.18 0.00 1.00 0.01 0.07 0 1Island 0.17 0.37 0.00 1.00 0.17 0.37 0.00 1.00 0.17 0.37 0 1Landlocked 0.21 0.41 0.00 1.00 0.21 0.41 0.00 1.00 0.21 0.41 0 1Official lang. English 0.28 0.45 0.00 1.00 0.28 0.45 0.00 1.00 0.28 0.45 0 1Official lang. French 0.18 0.39 0.00 1.00 0.18 0.38 0.00 1.00 0.18 0.38 0 1Official lang. Spanish 0.15 0.36 0.00 1.00 0.15 0.36 0.00 1.00 0.15 0.36 0 1Years of war 1950-2000 (log) 0.77 1.08 0.00 3.33 0.77 1.07 0.00 3.33 0.77 1.07 0 3.33Religious fractionalisation 0.43 0.23 0.00 0.86 0.43 0.23 0.00 0.86 0.43 0.23 0 0.86Restrictions to women mobility 0.09 0.29 0.00 1.00 0.09 0.29 0.00 1.00 0.09 0.29 0 1
Observations
Data Sources:
OECD destination countries Non-OECD destination countriesUnilateral dataset, non-OECD origin countries only
133 3458 8184
Bilateral dataset, non-OECD origin countries only
Total emigration rate: DIOC-E 2000 (release 2.0) and United Nations World Population Prospects 2008 ; Tertiary emigration rate: DIOC-E 2000 (release 2.0 , Barro and Lee (2010), Lutz et al. (2007) ; GDP per capita 1985-2000 (PPP): Penn World Tables 6.3 ; Population 1985-2000: United Nations World Population Prospects 2008 ; Area: FAO ; Island: United Nations ; Landlocked: CEPII ; Official language: CEPII ; Years of war: UCDP/PRIO Armed Conflict Dataset ; Religious fractionalization: Alesina et al. (2003) ; Restrictions to women mobility: McKenzie (2007) ; Distance: CEPII ; Common language: CEPII ; Colony: CEPII.

DELSA/ELSA/WD/SEM(2010)14
55
OECD SOCIAL, EMPLOYMENT AND MIGRATION WORKING PAPERS
Most recent releases are:
No. 111 ECONOMIC DETERMINANTS AND CONSEQUENCES OF CHILD MALTREATMENT Lawrence M. Berger, Jane Waldfogel (forthcoming)
No. 110 DISTRIBUTIONAL CONSEQUENCES OF LABOR DEMAND ADJUSTMENTS TO A DOWNTURN: A MODEL-BASED APPROACH WITH APPLICATION TO GERMANY 2008-09 Herwig Immervoll, Olivier Bargain, Andreas Peichl, Sebastian Siegloch (2010)
No. 109 DECOMPOSING NOTIONAL DEFINED-CONTRIBUTION PENSIONS: EXPERIENCE OF OECD COUNTRIES’ REFORMS Edward Whitehouse (2010)
No. 108 EARNINGS OF MEN AND WOMEN WORKING IN THE PRIVATE SECTOR: ENRICHED DATA FOR PENSIONS AND TAX-BENEFIT MODELING Anna Cristina D’Addio and Herwig Immervoll (2010)
No. 107 INSTITUTIONAL DETERMINANTS OF WORKER FLOWS: A CROSS-COUNTRY/CROSS-INDUSTRY APPROACH Andrea Bassanini, Andrea Garnero, Pascal Marianna, Sebastien Martin (2010)
No. 106 RISING YOUTH UNEMPLOYMENT DURING THE CRISIS: HOW TO PREVENT NEGATIVE LONG-TERM CONSEQUENCES ON A GENERATION? Stefano Scarpetta, Anne Sonnet and Thomas Manfredi (2010)
No. 105 TRENDS IN PENSION ELIGIBILITY AGES AND LIVE EXPECTANCY, 1950-2050 Rafal Chomik and Edward Whitehouse (2010)
No. 104 ISRAELI CHILD POLICY AND OUTCOMES John Gal, Mimi Ajzenstadt, Asher Ben-Arieh, Roni Holler and Nadine Zielinsky (2010)
No. 103 REFORMING POLICIES ON FOREIGN WORKERS IN ISRAEL Adriana Kemp (2010)
No. 102 LABOUR MARKET AND SOCIO-ECONOMIC OUTCOMES OF THE ARAB-ISRAELI POPULATION Jack Habib, Judith King, Asaf Ben Shoham, Abraham Wolde-Tsadick and Karen Lasky (2010)
No. 101 TRENDS IN SOUTH AFRICAN INCOME DISTRIBUTION AND POVERTY SINCE THE FALL OF APARTHEID Murray Leibbrandt, Ingrid Woolard, Arden Finn and Jonathan Argent (2010)
No. 100 MINIMUM-INCOME BENEFITS IN OECD COUNTRIES: POLICY DESIGN, EFFECTIVENESS AND CHALLENGES Herwig Immervoll (2009)
No. 99 HAPPINESS AND AGE CYCLES – RETURN TO START…? ON THE FUNCTIONAL RELATIONSHIP BETWEEN SUBJECTIVE WELL-BEING AND AGE Justina A.V. Fischer (2009)
No. 98 ACTIVATION POLICIES IN FINLAND Nicola Duell, David Grubb and Shruti Singh (2009)
No. 97 CHILDREN OF IMMIGRANTS IN THE LABOUR MARKETS OF EU AND OECD COUNTRIES: AN OVERVIEW Thomas Liebig and Sarah Widmaier (2009)
A full list of Social, Employment and Migration Working Papers is available at www.oecd.org/els/workingpapers.
Other series of working papers available from the OECD include: OECD Health Working Papers.

DELSA/ELSA/WD/SEM(2010)14
56
RECENT RELATED OECD PUBLICATIONS:
EQUAL OPPORTUNITIES? The Labour Market Integration of the Children of Immigrants (2010), via OECD Bookshop
OECD REVIEWS OF LABOUR MARKET AND SOCIAL POLICIES: ESTONIA (2010), www.oecd.org/els/estonia2010
JOBS FOR YOUTH: GREECE (2010), www.oecd.org/employment/youth
JOBS FOR YOUTH: DENMARK (2010), www.oecd.org/employment/youth
OECD REVIEWS OF LABOUR MARKET AND SOCIAL POLICIES: ISRAEL (2010), www.oecd.org/els/israel2010
JOBS FOR YOUTH: UNITED STATES (2009), www.oecd.org/employment/youth
JOBS FOR YOUTH: POLAND (2009), www.oecd.org/employment/youth
OECD EMPLOYMENT OUTLOOK: Tackling the Jobs Crisis (2009), www.oecd.org/els/employment/outlook
DOING BETTER FOR CHILDREN (2009), www.oecd.org/els/social/childwellbeing
SOCIETY AT A GLANCE – ASIA/PACIFIC EDITION (2009), www.oecd.org/els/social/indicators/asia
OECD REVIEWS OF LABOUR MARKET AND SOCIAL POLICIES: SLOVENIA (2009), www.oecd.org/els/slovenia2009
INTERNATIONAL MIGRATION OUTLOOK: SOPEMI (2010) www.oecd.org/els/migration/imo
PENSIONS AT A GLANCE 2009: Retirement-Income Systems in OECD Countries (2009), www.oecd.org/els/social/pensions/PAG
JOBS FOR YOUTH: FRANCE (2009), www.oecd.org/employment/youth
SOCIETY AT A GLANCE 2009 – OECD Social Indicators (2009), www.oecd.org/els/social/indicators/SAG
JOBS FOR YOUTH: AUSTRALIA (2009), www.oecd.org/employment/youth
OECD REVIEWS OF LABOUR MARKET AND SOCIAL POLICIES: CHILE (2009), www.oecd.org/els/chile2009
PENSIONS AT A GLANCE – SPECIAL EDITION: ASIA/PACIFIC (2009), www.oecd.org/els/social/pensions/PAG
SICKNESS, DISABILITY AND WORK: BREAKING THE BARRIERS (VOL. 3) – DENMARK, FINLAND, IRELAND AND THE NETHERLANDS (2008), www.oecd.org/els/disability
GROWING UNEQUAL? Income Distribution and Poverty in OECD Countries (2008), www.oecd.org/els/social/inequality
JOBS FOR YOUTH: JAPAN (2008), www.oecd.org/employment/youth
JOBS FOR YOUTH: NORWAY (2008), www.oecd.org/employment/youth
JOBS FOR YOUTH: UNITED KINGDOM (2008), www.oecd.org/employment/youth
JOBS FOR YOUTH: CANADA (2008), www.oecd.org/employment/youth
JOBS FOR YOUTH: NEW ZEALAND (2008), www.oecd.org/employment/youth
JOBS FOR YOUTH: NETHERLANDS (2008), www.oecd.org/employment/youth
For a full list, consult the OECD online Bookshop at www.oecd.org/bookshop.