oecd development centre - oecd.org - oecd · oecd development centre working paper no ... the size...
TRANSCRIPT
OECD DEVELOPMENT CENTRE
BEING “MIDDLE-CLASS” IN LATIN AMERICA
by
Francesca Castellani and Gwenn Parent
Research area:Latin American Economic Outlook
October 2011CENTRE DEDÉVELOPPEMENT CENTRE
DEVELOPMENT
Working Paper No. 305
Being “Middle-Class” in Latin America
DEV/DOC(2011)13
2 © OECD 2011
DEVELOPMENT CENTRE
WORKING PAPERS
This series of working papers is intended to disseminate the Development Centre’s
research findings rapidly among specialists in the field concerned. These papers are generally
available in the original English or French, with a summary in the other language.
Comments on this paper would be welcome and should be sent to the OECD
Development Centre, 2 rue André Pascal, 75775 PARIS CEDEX 16, France; or to
[email protected]. Documents may be downloaded from: http://www.oecd.org/dev/wp or
obtained via e-mail ([email protected]).
THE OPINIONS EXPRESSED AND ARGUMENTS EMPLOYED IN THIS DOCUMENT ARE THE SOLE RESPONSIBILITY OF THE AUTHORS AND
DO NOT NECESSARILY REFLECT THOSE OF THE OECD OR OF THE GOVERNMENTS OF ITS MEMBER COUNTRIES
©OECD (2011)
Applications for permission to reproduce or translate all or part of this document should be sent to
CENTRE DE DÉVELOPPEMENT
DOCUMENTS DE TRAVAIL
Cette série de documents de travail a pour but de diffuser rapidement auprès des
spécialistes dans les domaines concernés les résultats des travaux de recherche du Centre de
développement. Ces documents ne sont disponibles que dans leur langue originale, anglais ou
français ; un résumé du document est rédigé dans l’autre langue.
Tout commentaire relatif à ce document peut être adressé au Centre de développement
de l’OCDE, 2 rue André Pascal, 75775 PARIS CEDEX 16, France; ou à [email protected]. Les
documents peuvent être téléchargés à partir de: http://www.oecd.org/dev/wp ou obtenus via le
mél ([email protected]).
LES IDÉES EXPRIMÉES ET LES ARGUMENTS AVANCÉS DANS CE DOCUMENT SONT CEUX DES AUTEURS ET NE REFLÈTENT PAS
NÉCESSAIREMENT CEUX DE L’OCDE OU DES GOUVERNEMENTS DE SES PAYS MEMBRES
©OCDE (2011)
Les demandes d'autorisation de reproduction ou de traduction de tout ou partie de ce document devront
être envoyées à [email protected].
OECD Development Centre Working Paper No.305
DEV/DOC(2011)13
© OECD 2011 3
TABLE OF CONTENTS
ACKNOWLEDGEMENTS .......................................................................................................................... 4
PREFACE ....................................................................................................................................................... 5
RÉSUMÉ ........................................................................................................................................................ 6
ABSTRACT .................................................................................................................................................... 6
I. INTRODUCTION ..................................................................................................................................... 8
II. MIDDLE CLASS MEASURES .............................................................................................................. 10
III. THE SIZE OF LATIN AMERICA’S ‚MIDDLE CLASS‛ ................................................................. 14
IV. A PORTRAIT OF THE LATIN AMERICAN MIDDLE CLASS ..................................................... 19
V. INTERGROUP INCOME GAPS: A HINT AT SOCIAL MOBILITY POTENTIAL ...................... 25
VI. CONCLUSIONS ................................................................................................................................... 34
REFERENCES ............................................................................................................................................. 35
OTHER TITLES IN THE SERIES/ AUTRES TITRES DANS LA SÉRIE .............................................. 37
Being “Middle-Class” in Latin America
DEV/DOC(2011)13
4 © OECD 2011
ACKNOWLEDGEMENTS
This paper was prepared for the OECD Latin American Economic Outlook 2011: How middle-
class is Latin America?. We are grateful to Eduardo Lora, Jeff Dayton Johnson and Luis Felipe
Lopez-Calva, as well as participants of the Latin American Economic Outlook Expert Meeting
held in Paris on 23-24 April 2010 and LACEA participants in Medellin for their helpful comments
and suggestions.
OECD Development Centre Working Paper No.305
DEV/DOC(2011)13
© OECD 2011 5
PREFACE
Growing interest in the fortunes of the middle class may be linked to the conviction that
countries with a strong middle class enjoy low levels of inequality and social conflict. A robust
middle class is supposed to contribute to economic and social stability and to better development
prospects. But history also provides examples of middle class supporting populist options.
This hypothesis requires an in-depth analysis of the characteristics and vulnerability of
the middle class as understanding the middle class becomes crucial for assessing its role in
societies.
In developing economies, many in the middle sectors of income distribution are the
formerly poor and are vulnerable to falling back into poverty in reaction to an external shock to
the household (illness, unemployment, retirement) or the economy (recession). This characteristic
calls for policies to mitigate their vulnerability. Progress achieved in poverty reduction strategies
throughout the developing world invites complementary measures to consolidate the middle
class, in order to support its contribution to development and contain its attraction towards
populist options.
This paper addresses the issue of middle-class measurement and characterisation in Latin
America, providing an answer to the following questions: Who is middle-class in Latin America?
How different is the Latin American middle class from the rest of the world? How vulnerable
and mobile is it? And how different is it from the rest of the income distribution spectrum? By
doing so, the paper helps identify relevant measures to consolidate and secure middle-class
prospects over time.
Mario Pezzini
Director
OECD Development Centre
October 2011
Being “Middle-Class” in Latin America
DEV/DOC(2011)13
6 © OECD 2011
RÉSUMÉ
Ce papier rejoint le débat sur la taille de la classe moyenne en Amérique Latine, en
étudiant sa structure et ses caractéristiques, ainsi que le potentiel de mobilité et son évolution
dans le temps dans un groupe de pays de la région. L’analyse démontre que la classe moyenne
dans les pays d’Amérique Latine est plus petite que celle des pays de l’OCDE. Néanmoins le
potentiel de mobilité à la hausse de la classe moyenne ne montre pas de différences importantes.
Malgré cela, elle exhibe un risque plus élevé de retomber dans la pauvreté, dévoilant
l’importance d’une politique publique en faveur de la classe moyenne.
Classification JEL: O10, O12, I32.
Mots clés: classe moyenne ; mobilité sociale ; inégalité ; vulnérabilité ; résilience ;
Amérique latine.
ABSTRACT
This paper joins the debate on the size of the middle class in Latin America, analysing its
structure and characteristics. The paper investigates inter-class mobility potential and its
evolution over time in the case of selected countries. As a result of the estimations, we find that
Latin American countries have smaller middle classes than OECD countries. Moreover, this
comparison shows that, while middle-class upward mobility potential is not very different,
middle class resilience is higher in OECD countries. This suggests that particular attention
should be paid to mitigating the impact of economic reversal on middle-class families, as they
are more vulnerable to falling into poverty. This analysis provides a tool to identify the features
of the middle class that need to be promoted by policy makers to foster middle-class resilience
and enhance its stabilising role in society.
JEL Classification: O10, O12, I32.
Keywords: middle class; social mobility; inequality; vulnerability; resilience; Latin
America.
OECD Development Centre Working Paper No.305
DEV/DOC(2011)13
© OECD 2011 7
The most perfect political community must be amongst those who are in the middle
rank, and those states are best instituted wherein these are a larger and more
respectable part, if possible, than both the other; or, if that cannot be, at least than
either of them separate.
Aristotle (384 BC-322 BC)
Being “Middle-Class” in Latin America
DEV/DOC(2011)13
8 © OECD 2011
I. INTRODUCTION
While the notion of belonging to the middle class appears to be universally attractive, it is
not immediately clear what being "middle-class" actually means. In particular, should the middle
class be defined in global or national terms? Do the characteristics of the middle class transcend
national borders and levels of development? This paper tackles some of these issues, applying an
income-based definition of the middle class to quantify its size, characteristics and mobility
potential across Latin American and OECD countries. This analysis is a crucial first step for
discussing the role of public policy to promote and consolidate the middle class.
Besides the psychological importance attached to belonging to a certain class, focus on the
middle class in developing countries is justified by its potential contribution to economic and
social welfare. Several channels through which the middle class might promote economic growth
have been identified: fostering entrepreneurship, shifting the composition of consumer demand,
as well as encouraging policy reforms and institutional changes conducive to growth. Empirical
studies have shown its relevance for economic growth and prosperity in several respects. It
contributes to mediation between rich and poorer classes – in Marx’s words: ‚it limits class
conflicts‛ – an essential element of a sound democracy (Thurow, 1984). Furthermore, democratic
regimes are more likely to occur in countries with middle classes (Barro, 1999).
As to its relevance as an engine for economic development, middle classes foster savings
and human capital accumulation, as they specialise in occupations that require skills and
experience (Torche and López-Calva, 2011) and shape values such as patience, effort and a
strong work ethic (Doepke and Zilibotti, 2005). According to Acemoglu and Zilibotti (1997),
middle class entrepreneurs contribute to employment and productivity growth. Others contend
that the middle class does not show a higher propensity to entrepreneurship than other groups
(Banerjee and Duflo, 2007). Additionally, political stability and social cohesion are furthered by
large middle classes (Torche and López-Calva, 2011). An increase in the middle class share of
income predicts a rise in political rights (Barro, 1999) and, in turn, stimulates long-term
investments (Alesina and Perotti, 1996).1
There is evidence of a strong association between solid middle classes and higher income,
more education, better health outcomes and faster upward mobility (Easterly, 2001). Therefore, a
better understanding of the middle class is crucial for designing and implementing policies to
reduce income and social inequalities. An important element to consider, besides the size of the
middle class, is the prospect for social mobility. If the middle class contributes to social welfare,
1. See Kharas (2010) for further discussion.
OECD Development Centre Working Paper No.305
DEV/DOC(2011)13
© OECD 2011 9
social mobility becomes a laudable policy objective, as social mobility translates into income and
the expansion of the middle class over time.
These considerations are particularly relevant in Latin American countries, which have
made historic strides in reducing poverty: while 44% of Latin Americans were poor in 2002, that
proportion had fallen to 32% by 2010 (ECLAC, 2010). However, despite some progress also in
reducing income inequality, this decrease has been much more modest. As a consequence,
income inequality remains high in Latin America (Lopez-Calva and Lustig, 2010).
This paper uses comparable household survey data sets to estimate middle class size
across a sample of Latin American countries and tries to analyse their income vulnerability in
order to influence their fates. The contribution to the literature is threefold: i) provide
comparable cross country middle class size estimations ii) analyse their socioeconomic
characteristics and iii) evaluate their vulnerability.
Being “Middle-Class” in Latin America
DEV/DOC(2011)13
10 © OECD 2011
II. MIDDLE CLASS MEASURES
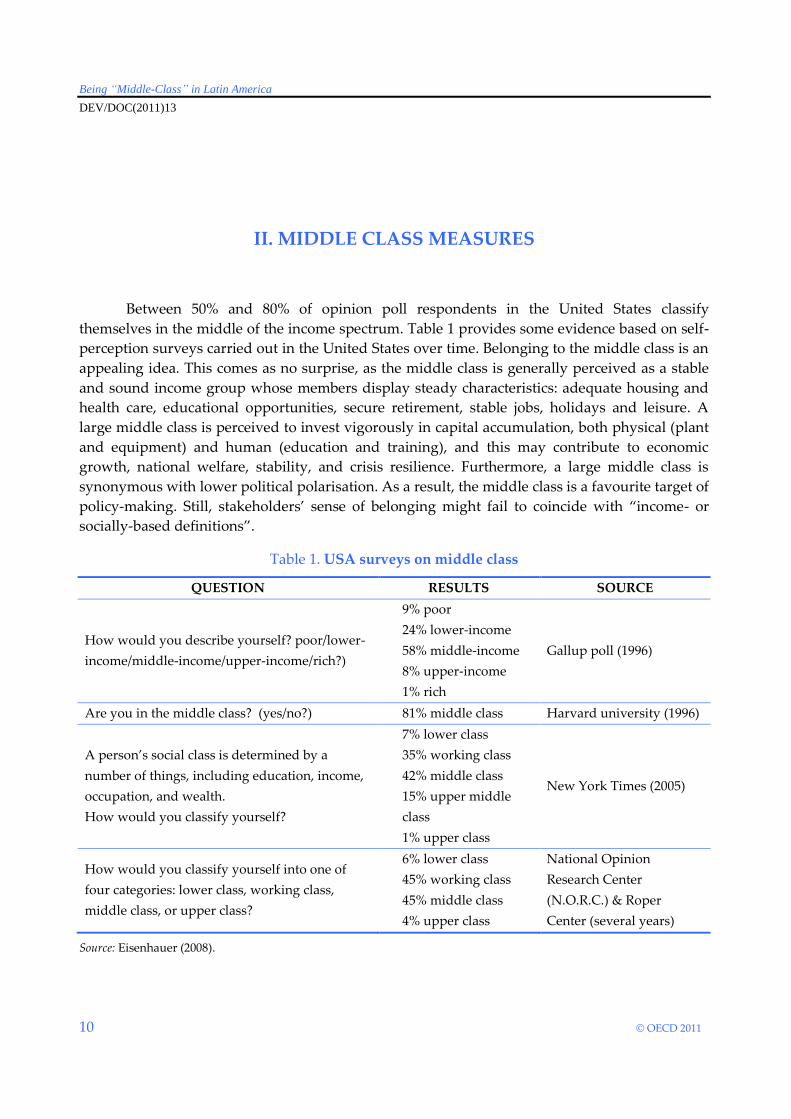
Between 50% and 80% of opinion poll respondents in the United States classify
themselves in the middle of the income spectrum. Table 1 provides some evidence based on self-
perception surveys carried out in the United States over time. Belonging to the middle class is an
appealing idea. This comes as no surprise, as the middle class is generally perceived as a stable
and sound income group whose members display steady characteristics: adequate housing and
health care, educational opportunities, secure retirement, stable jobs, holidays and leisure. A
large middle class is perceived to invest vigorously in capital accumulation, both physical (plant
and equipment) and human (education and training), and this may contribute to economic
growth, national welfare, stability, and crisis resilience. Furthermore, a large middle class is
synonymous with lower political polarisation. As a result, the middle class is a favourite target of
policy-making. Still, stakeholders’ sense of belonging might fail to coincide with ‚income- or
socially-based definitions‛.
Table 1. USA surveys on middle class
QUESTION RESULTS SOURCE
How would you describe yourself? poor/lower-
income/middle-income/upper-income/rich?)
9% poor
24% lower-income
58% middle-income
8% upper-income
1% rich
Gallup poll (1996)
Are you in the middle class? (yes/no?) 81% middle class Harvard university (1996)
A person’s social class is determined by a
number of things, including education, income,
occupation, and wealth.
How would you classify yourself?
7% lower class
35% working class
42% middle class
15% upper middle
class
1% upper class
New York Times (2005)
How would you classify yourself into one of
four categories: lower class, working class,
middle class, or upper class?
6% lower class
45% working class
45% middle class
4% upper class
National Opinion
Research Center
(N.O.R.C.) & Roper
Center (several years)
Source: Eisenhauer (2008).
OECD Development Centre Working Paper No.305
DEV/DOC(2011)13
© OECD 2011 11
Box 1. Middle class in the United States
In the case of the United States (US), ‚there is no consensus definition of ‚middle class‛, nor is
there an official government definition (Casehll, 2007). The Census Bureau publishes figures breaking
down the income distribution into quintiles, or fifths. The narrowest view of who might be considered
middle class would include those in the middle quintile, those households with income between
USD 36 000 and USD 57 660. A more generous definition might be based on the three middle quintiles,
those households with incomes between USD 19 178 and USD 91 705. Surveys suggest that 1% to 3.3% of
the population consider themselves to be upper class. Comparing those figures with the income
distribution would put the dividing line between middle and upper class close to if not above
USD 250 000. Similarly, survey responses suggest that the lower end of the middle class might be close to
USD 40 000.‛ In the United States, the debate around the reduction in the size of the American middle class
and its impoverishment intensified during the 1980s and 1990s and led to investigate its determinants.
According to Pressman (2007) several elements contributed to the thinning of the middle class in
the US over time. Among this, demography plays a crucial role. Increasing divorce rates lead to the
emergence of single parent- households and lower-class households headed by a woman. The
incorporation of young cohorts, with no professional experience, in the job market implies a lower level of
income earned. However, as people age, their income rises and income distribution flattens for each age
group. Higher income inequality between genders is also indicated as a possible cause. In addition, other
causes may be the decline of trade unions and a lower relevance of manufacturing jobs, as well as public
policies aimed at fostering middle class incomes. Macroeconomic conditions (i.e. recession) and
government policies (i.e fiscal transfers) also contribute to define the fraction of households classified as
middle class.
Based on the Luxembourg Income Study (LIS) database, Pressman (2007) adopts a uniform
definition of middle class (i.e. households receiving between 75% and 125% of median household income,
adjusted for family composition), to study the income evolution overtime in several countries.
In 1980, middle class included 35%- 40% of all households, with high variance across countries,
ranging from less than 30% (Canada, US and Israel2) to over 50% (Sweden). By the end of 1990, 35-37% of
households were middle class, maintaining similar variation across countries. Canada and Norway
recorded an increase. By 2000, middle class has shrunk by 1 to 2 percentage points on average, mainly
because of the smaller size in the USA middle class.
As to the potential determinant of the decline, this author finds that neither the age structure nor
the household gender composition played a role. As no lasting effect can be attributed to macroeconomic
causes, fiscal policy is found to be an important determinant of the size of the middle class, highlighting
the importance of policy-making in defining middle class fortunes.
Source: Eisenhauer (2008).
The strong sense of belonging to the middle class by the majority of the population is not
matched by a universally accepted definition of this group. Scholars have striven to put forward
such definitions and measurements, but discretionary elements have made them ill-suited to be
general and widely accepted. These elements become relevant when comparing different realities
like those of OECD-and Latin American countries, as discussed in more detail in Section III.
2. The statistical data for Israel are supplied by and under the responsibility of the relevant Israeli
authorities. The use of such data by the OECD is without prejudice to the status of the Golan Heights,
East Jerusalem and Israeli settlements in the West Bank under the terms of international law.
Being “Middle-Class” in Latin America
DEV/DOC(2011)13
12 © OECD 2011
Broadly speaking, measures to estimate the size of the middle class can be categorised by
their reliance on economic and/or social criteria. The first refers to income/consumption ranges
that segment population distribution.3 The second group includes reference to specific
characteristics, such as education, occupational status, and consumption patterns.
Most social definitions are based on the stability of middle class characteristics. For
example, Solimano (2008) argues that ‚<the prototype view of the middle class is that of a rather
conservative, risk-averse, group that seeks stable jobs and predictable economic fortunes. ….Thus, a
stronger and more stable middle class is often considered as a stabilizing factor in politics and
economics…‛ While generally useful for a socioeconomic characterisation and the study of the
evolution of the middle class in a single country, these standards might result ill-suited for a
cross-country comparison, especially between emerging economies and more advanced
countries. For example, generally referring to people with professional degrees as being middle
class can be misleading.
Income-based definitions are either ‚absolute or relative‛. The former assumes fixed
(i.e. absolute) income ranges (PPP adjusted, i.e. correcting for differences in purchasing power
across countries). The latter considers the relative position with regard to national income
distribution (i.e. quintiles). While income-based definitions enjoy higher analytical rigour than
perception-based concepts, they are also debatable. An absolute threshold characterisation
suffers from some arbitrariness4 which becomes relevant when applied to heterogeneous levels
of development. While providing a common reference, absolute benchmarks might fall short of
accounting for country-specific features. Conversely, relative definitions might provide less
homogeneous boundaries as they are country-tailored. In general, absolute definitions have been
applied to the evolution of the global middle class while relative boundaries for country-specific
investigation.
Among absolute measures, Milanovic and Yitzaki (2002) use the average incomes of
Brazil and Italy as the respective floor and ceiling references. This translates into roughly
USD 12-50 a day per person at 2000 (PPP). Banerjee and Duflo (2007) apply the concept to several
developing countries and use consumption ranges between USD 2-10 per day (roughly USD 800-
USD 3 600 per year). This increases to USD 6 000 – USD 30 000 in 2007 PPP terms by McKinsey
and Goldman Sachs (2008). Ravallion (2009) adopts an income range of USD 2-13 per day at 2005
PPP prices, as USD 2 a day is a commonly accepted definition of the poverty line in developing
countries; people above this line are ‚middle-class‛ in the sense that they have moved out of
poverty. Bhalla (2009) defines the middle class as those with annual incomes over USD 3 900 in
purchasing power parity terms. Absolute boundaries, being poverty-level contingent might
result less relevant for cross-country comparisons, as it is difficult to find common standards for
different development levels.5
Relative definitions – based on the middle range of national income distributions – make
the lower and upper boundaries country-specific (i.e. associating it to median income). Thurow
3. Easterly (2001), Thurow (1999), Byrdsall (2001), Eisenhauer (2008).
4. While poverty thresholds are clearly defined, middle-class ‚boundaries‛ rely on arbitrary limits.
5. See Kharas (2010) for further discussion.
OECD Development Centre Working Paper No.305
DEV/DOC(2011)13
© OECD 2011 13
(1987) defined the American middle class as the group with incomes lying between 75% and
125% of the median income. Birdsall et al. (2000) apply the same definition to developing
countries.6 Easterly (2001) considers the income share of three middle quintiles (leaving out the
poorest 20% and the richest 20%).
Solimano (2008) defines a broad middle class comprising individuals belonging to deciles
3 to 9 of the income distribution and breaks it into, (a) a lower middle class, corresponding to
deciles 3 to 6, and (b) an upper middle class, corresponding to deciles 7 to 9.7
Lower bound reliance on poverty -- be it in absolute or relative levels -- entails that non-
poor households are ‚middle class‛. One of the drawbacks of using an absolute poverty line as a
lower threshold for middle class range is that income volatility might affect size over time. This
contradicts the perception of stability associated with the concept of the middle class and the fact
that its size is also stable overtime. A relative poverty line, related to some fraction of typical
incomes, might result more appropriate. The OECD and the European Union countries use 50%
and 60% of national median equivalised household income as poverty line.8
6. In their view, this approach does ‚< not pretend that this measure captures any fixed notion of the
‘middle class’. What it does capture—literally—is the middle strata in income terms in each country‛.
7. He also proposes an aggregate definition that overlaps with others used in the literature.
8. Eurostat uses as the standard risk-of-poverty threshold (60% of the median income). In practice, it
calculates and publishes rates according to various risk-of-poverty thresholds using various
percentages (40%, 50%, 60%, 70%) of the median and the mean. ECLAC has used 50% of the median as
standard for its calculations, although for internal uses other percentages of the median and of the
average income have been used.
Being “Middle-Class” in Latin America
DEV/DOC(2011)13
14 © OECD 2011
III. THE SIZE OF LATIN AMERICA’S “MIDDLE CLASS”
In this section, we compare alternative measurements of the middle class – in particular
the resulting size of the middle class – applying them to selected OECD and Latin American
countries. In particular, we consider the following alternatives:
a) PPP-based definition 2-20 USD (2005 PPP) per capita per day;
b) Distribution-based definition: leaving out the poorest 20% and the richest 20%;
c) Median income-based definition: 50-150% of median income (i.e. poverty
generally defined as 50-60% of median income);9
d) Poverty-line-based definition: lower bound is the national poverty line (national,
urban), named thereafter NPL, and the upper bound is set as a multiple (3 times)
of the national poverty line.
We use household survey data for several Latin American countries. We focus on
information for 2006 as a base year for country comparisons, with a few exceptions. The
countries considered in our analysis are Argentina (2006), Bolivia (2005), Brazil (2006), Chile
(2006), Colombia (2008), Costa Rica (2006), Ecuador (2006), Honduras (2006), Italy (2006), Mexico
(2006), Peru (2006), Uruguay (2005) and Venezuela (2006). Estimations are based on household
total income adjusted for family composition (OECD scale).10
9. See also Davies et al. (1992).
10. The OECD weights for equivalised or household size adjusted income are as follows: 1 for the first
adult; 0.5 for every other adult or child above 14 years old; 0.3 for every child under 14 years old.
OECD Development Centre Working Paper No.305
DEV/DOC(2011)13
© OECD 2011 15
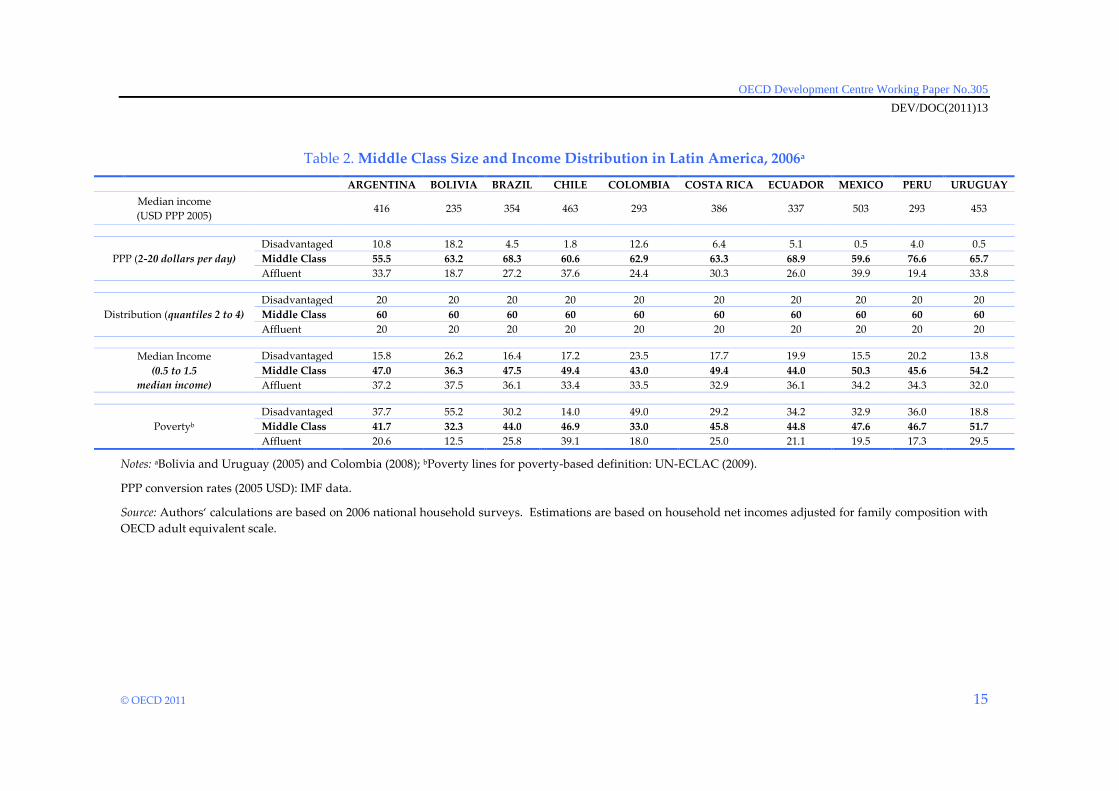
Table 2. Middle Class Size and Income Distribution in Latin America, 2006a
ARGENTINA BOLIVIA BRAZIL CHILE COLOMBIA COSTA RICA ECUADOR MEXICO PERU URUGUAY
Median income
(USD PPP 2005) 416 235 354 463 293 386 337 503 293 453
PPP (2-20 dollars per day)
Disadvantaged 10.8 18.2 4.5 1.8 12.6 6.4 5.1 0.5 4.0 0.5
Middle Class 55.5 63.2 68.3 60.6 62.9 63.3 68.9 59.6 76.6 65.7
Affluent 33.7 18.7 27.2 37.6 24.4 30.3 26.0 39.9 19.4 33.8
Distribution (quantiles 2 to 4)
Disadvantaged 20 20 20 20 20 20 20 20 20 20
Middle Class 60 60 60 60 60 60 60 60 60 60
Affluent 20 20 20 20 20 20 20 20 20 20
Median Income
(0.5 to 1.5
median income)
Disadvantaged 15.8 26.2 16.4 17.2 23.5 17.7 19.9 15.5 20.2 13.8
Middle Class 47.0 36.3 47.5 49.4 43.0 49.4 44.0 50.3 45.6 54.2
Affluent 37.2 37.5 36.1 33.4 33.5 32.9 36.1 34.2 34.3 32.0
Povertyb
Disadvantaged 37.7 55.2 30.2 14.0 49.0 29.2 34.2 32.9 36.0 18.8
Middle Class 41.7 32.3 44.0 46.9 33.0 45.8 44.8 47.6 46.7 51.7
Affluent 20.6 12.5 25.8 39.1 18.0 25.0 21.1 19.5 17.3 29.5
Notes: aBolivia and Uruguay (2005) and Colombia (2008); bPoverty lines for poverty-based definition: UN-ECLAC (2009).
PPP conversion rates (2005 USD): IMF data.
Source: Authors‘ calculations are based on 2006 national household surveys. Estimations are based on household net incomes adjusted for family composition with
OECD adult equivalent scale.
Being “Middle-Class” in Latin America
DEV/DOC(2011)13
16 © OECD 2011
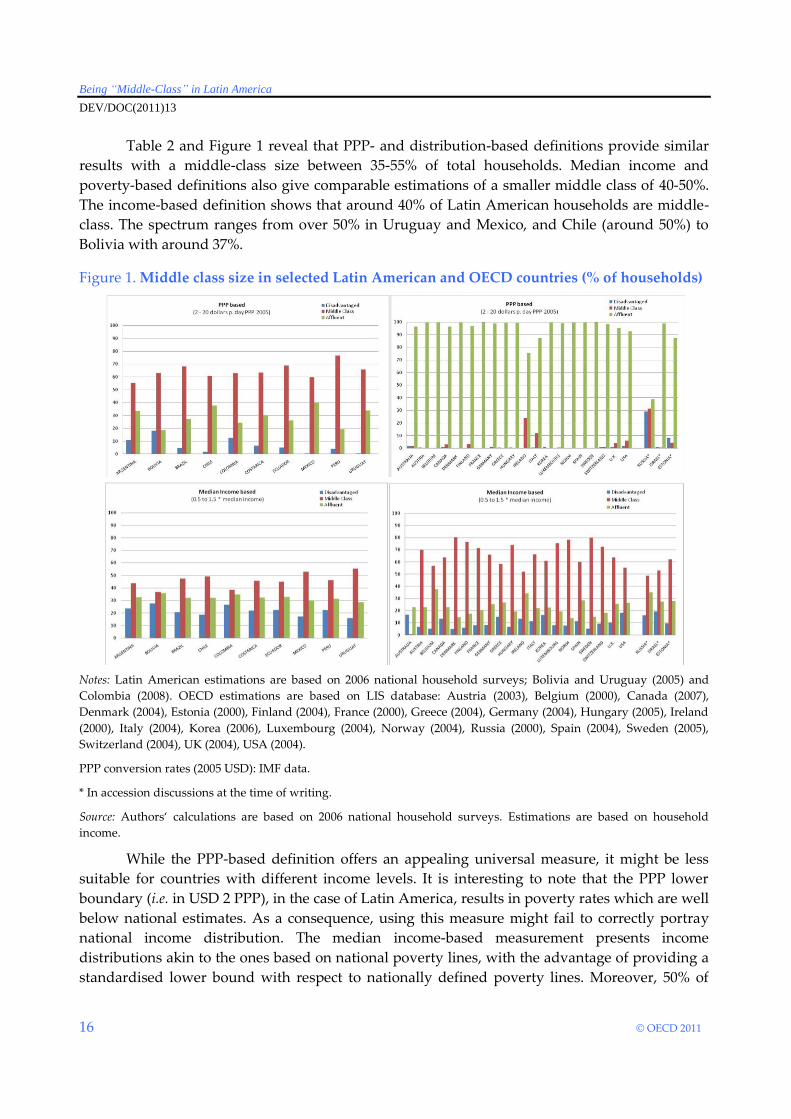
Table 2 and Figure 1 reveal that PPP- and distribution-based definitions provide similar
results with a middle-class size between 35-55% of total households. Median income and
poverty-based definitions also give comparable estimations of a smaller middle class of 40-50%.
The income-based definition shows that around 40% of Latin American households are middle-
class. The spectrum ranges from over 50% in Uruguay and Mexico, and Chile (around 50%) to
Bolivia with around 37%.
Figure 1. Middle class size in selected Latin American and OECD countries (% of households)
Notes: Latin American estimations are based on 2006 national household surveys; Bolivia and Uruguay (2005) and
Colombia (2008). OECD estimations are based on LIS database: Austria (2003), Belgium (2000), Canada (2007),
Denmark (2004), Estonia (2000), Finland (2004), France (2000), Greece (2004), Germany (2004), Hungary (2005), Ireland
(2000), Italy (2004), Korea (2006), Luxembourg (2004), Norway (2004), Russia (2000), Spain (2004), Sweden (2005),
Switzerland (2004), UK (2004), USA (2004).
PPP conversion rates (2005 USD): IMF data.
* In accession discussions at the time of writing.
Source: Authors‘ calculations are based on 2006 national household surveys. Estimations are based on household
income.
While the PPP-based definition offers an appealing universal measure, it might be less
suitable for countries with different income levels. It is interesting to note that the PPP lower
boundary (i.e. in USD 2 PPP), in the case of Latin America, results in poverty rates which are well
below national estimates. As a consequence, using this measure might fail to correctly portray
national income distribution. The median income-based measurement presents income
distributions akin to the ones based on national poverty lines, with the advantage of providing a
standardised lower bound with respect to nationally defined poverty lines. Moreover, 50% of
OECD Development Centre Working Paper No.305
DEV/DOC(2011)13
© OECD 2011 17
median household income is a widely used and generally accepted proxy for low-income
thresholds. In the rest of the paper, we use this measure to identify the characteristics of the
middle class across selected countries.
Figure 1 illustrates the implications of using different measures (PPP-based and median
income-based) when comparing Latin American and OECD countries.11 The PPP income
thresholds are less relevant for OECD countries, while the median-based measurement provides
an estimate of the size of the middle class size that ranges between 50% and 80% of the
households, with an average of 67% for OECD countries, well above the estimated Latin America
average of 46%.
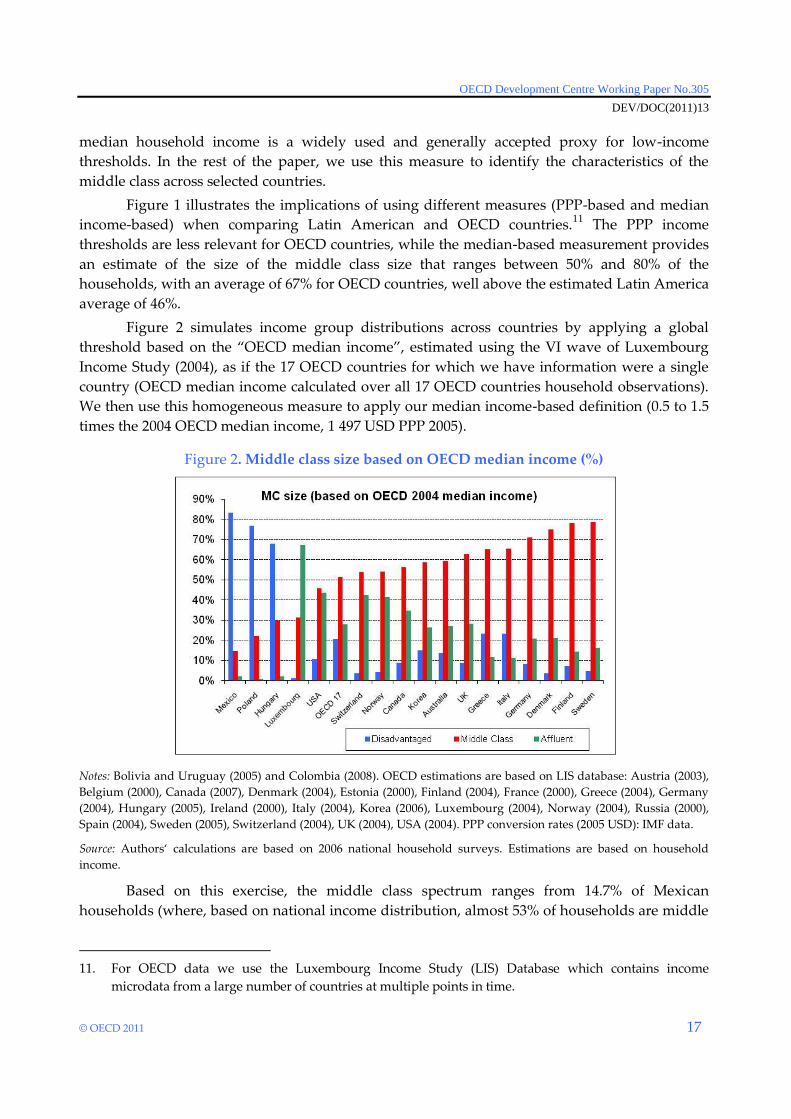
Figure 2 simulates income group distributions across countries by applying a global
threshold based on the ‚OECD median income‛, estimated using the VI wave of Luxembourg
Income Study (2004), as if the 17 OECD countries for which we have information were a single
country (OECD median income calculated over all 17 OECD countries household observations).
We then use this homogeneous measure to apply our median income-based definition (0.5 to 1.5
times the 2004 OECD median income, 1 497 USD PPP 2005).
Figure 2. Middle class size based on OECD median income (%)
Notes: Bolivia and Uruguay (2005) and Colombia (2008). OECD estimations are based on LIS database: Austria (2003),
Belgium (2000), Canada (2007), Denmark (2004), Estonia (2000), Finland (2004), France (2000), Greece (2004), Germany
(2004), Hungary (2005), Ireland (2000), Italy (2004), Korea (2006), Luxembourg (2004), Norway (2004), Russia (2000),
Spain (2004), Sweden (2005), Switzerland (2004), UK (2004), USA (2004). PPP conversion rates (2005 USD): IMF data.
Source: Authors‘ calculations are based on 2006 national household surveys. Estimations are based on household
income.
Based on this exercise, the middle class spectrum ranges from 14.7% of Mexican
households (where, based on national income distribution, almost 53% of households are middle
11. For OECD data we use the Luxembourg Income Study (LIS) Database which contains income
microdata from a large number of countries at multiple points in time.
Being “Middle-Class” in Latin America
DEV/DOC(2011)13
18 © OECD 2011
class) to 78.8% of households in Sweden. This ‚OECD-wide definition‛ of the middle class
allows identifying three groups of countries: i) emerging countries (Mexico, Poland and
Hungary), with a low proportion of middle-class households, which have not reached yet the
OECD standards of living; ii) rich countries (i.e. Luxembourg, USA, Switzerland, Norway or
Canada) with a relative large proportion of rich households (more than 30%) and therefore, a
relatively small middle class, and iii) ‚middle-class‛ countries (Korea, Sweden, Finland and
Denmark) with very sound and large middle class.
OECD Development Centre Working Paper No.305
DEV/DOC(2011)13
© OECD 2011 19
IV. A PORTRAIT OF THE LATIN AMERICAN MIDDLE CLASS
As noted in the discussion of sociological or status-based definitions of the middle class, it
is important to identify the ‚features‛ that might define the middle class beyond income. Latin
American household surveys permit a closer look at the family structure, age, marital status and
occupation of middle-class households.
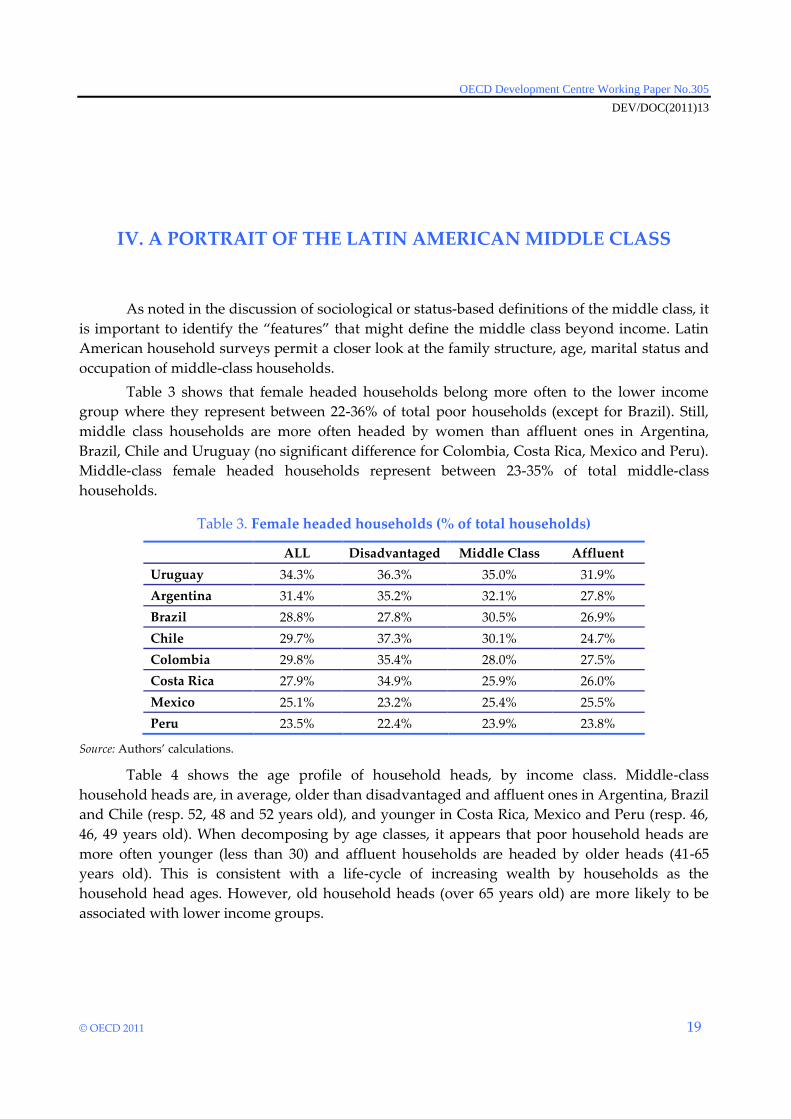
Table 3 shows that female headed households belong more often to the lower income
group where they represent between 22-36% of total poor households (except for Brazil). Still,
middle class households are more often headed by women than affluent ones in Argentina,
Brazil, Chile and Uruguay (no significant difference for Colombia, Costa Rica, Mexico and Peru).
Middle-class female headed households represent between 23-35% of total middle-class
households.
Table 3. Female headed households (% of total households)
ALL Disadvantaged Middle Class Affluent
Uruguay 34.3% 36.3% 35.0% 31.9%
Argentina 31.4% 35.2% 32.1% 27.8%
Brazil 28.8% 27.8% 30.5% 26.9%
Chile 29.7% 37.3% 30.1% 24.7%
Colombia 29.8% 35.4% 28.0% 27.5%
Costa Rica 27.9% 34.9% 25.9% 26.0%
Mexico 25.1% 23.2% 25.4% 25.5%
Peru 23.5% 22.4% 23.9% 23.8%
Source: Authors’ calculations.
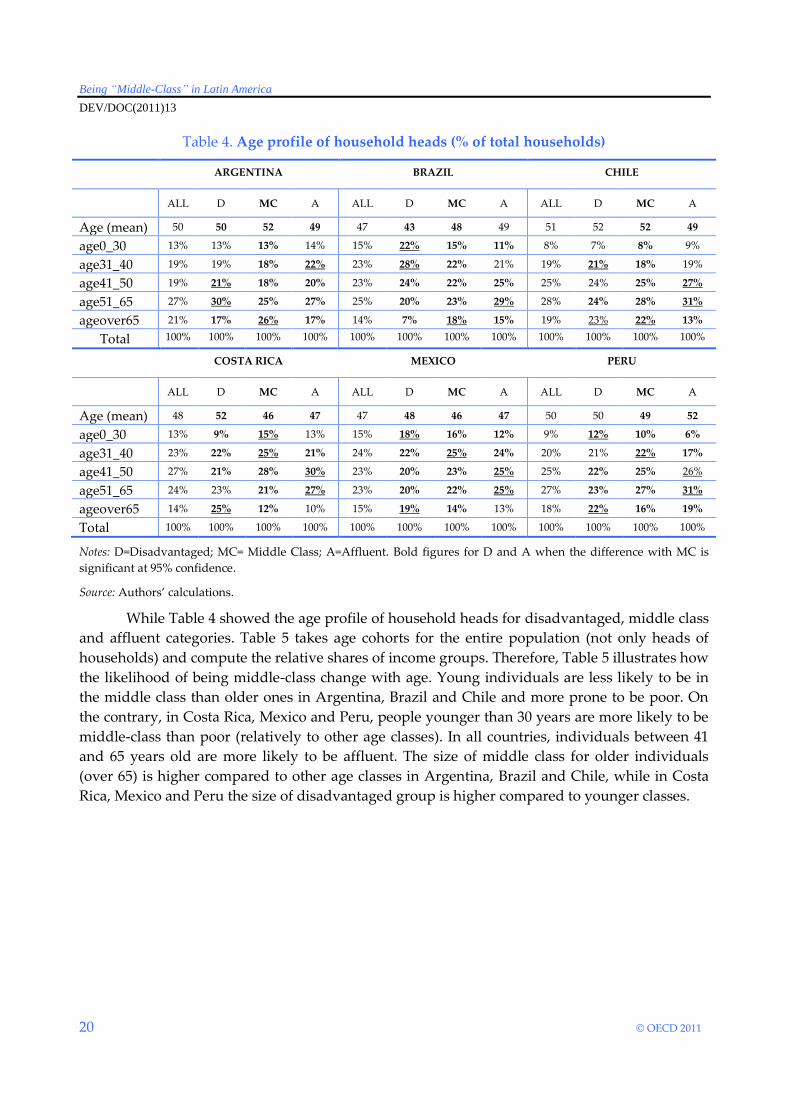
Table 4 shows the age profile of household heads, by income class. Middle-class
household heads are, in average, older than disadvantaged and affluent ones in Argentina, Brazil
and Chile (resp. 52, 48 and 52 years old), and younger in Costa Rica, Mexico and Peru (resp. 46,
46, 49 years old). When decomposing by age classes, it appears that poor household heads are
more often younger (less than 30) and affluent households are headed by older heads (41-65
years old). This is consistent with a life-cycle of increasing wealth by households as the
household head ages. However, old household heads (over 65 years old) are more likely to be
associated with lower income groups.
Being “Middle-Class” in Latin America
DEV/DOC(2011)13
20 © OECD 2011
Table 4. Age profile of household heads (% of total households)
ARGENTINA BRAZIL CHILE
ALL D MC A ALL D MC A ALL D MC A
Age (mean) 50 50 52 49 47 43 48 49 51 52 52 49
age0_30 13% 13% 13% 14% 15% 22% 15% 11% 8% 7% 8% 9%
age31_40 19% 19% 18% 22% 23% 28% 22% 21% 19% 21% 18% 19%
age41_50 19% 21% 18% 20% 23% 24% 22% 25% 25% 24% 25% 27%
age51_65 27% 30% 25% 27% 25% 20% 23% 29% 28% 24% 28% 31%
ageover65 21% 17% 26% 17% 14% 7% 18% 15% 19% 23% 22% 13%
Total 100% 100% 100% 100% 100% 100% 100% 100% 100% 100% 100% 100%
COSTA RICA MEXICO PERU
ALL D MC A ALL D MC A ALL D MC A
Age (mean) 48 52 46 47 47 48 46 47 50 50 49 52
age0_30 13% 9% 15% 13% 15% 18% 16% 12% 9% 12% 10% 6%
age31_40 23% 22% 25% 21% 24% 22% 25% 24% 20% 21% 22% 17%
age41_50 27% 21% 28% 30% 23% 20% 23% 25% 25% 22% 25% 26%
age51_65 24% 23% 21% 27% 23% 20% 22% 25% 27% 23% 27% 31%
ageover65 14% 25% 12% 10% 15% 19% 14% 13% 18% 22% 16% 19%
Total 100% 100% 100% 100% 100% 100% 100% 100% 100% 100% 100% 100%
Notes: D=Disadvantaged; MC= Middle Class; A=Affluent. Bold figures for D and A when the difference with MC is
significant at 95% confidence.
Source: Authors’ calculations.
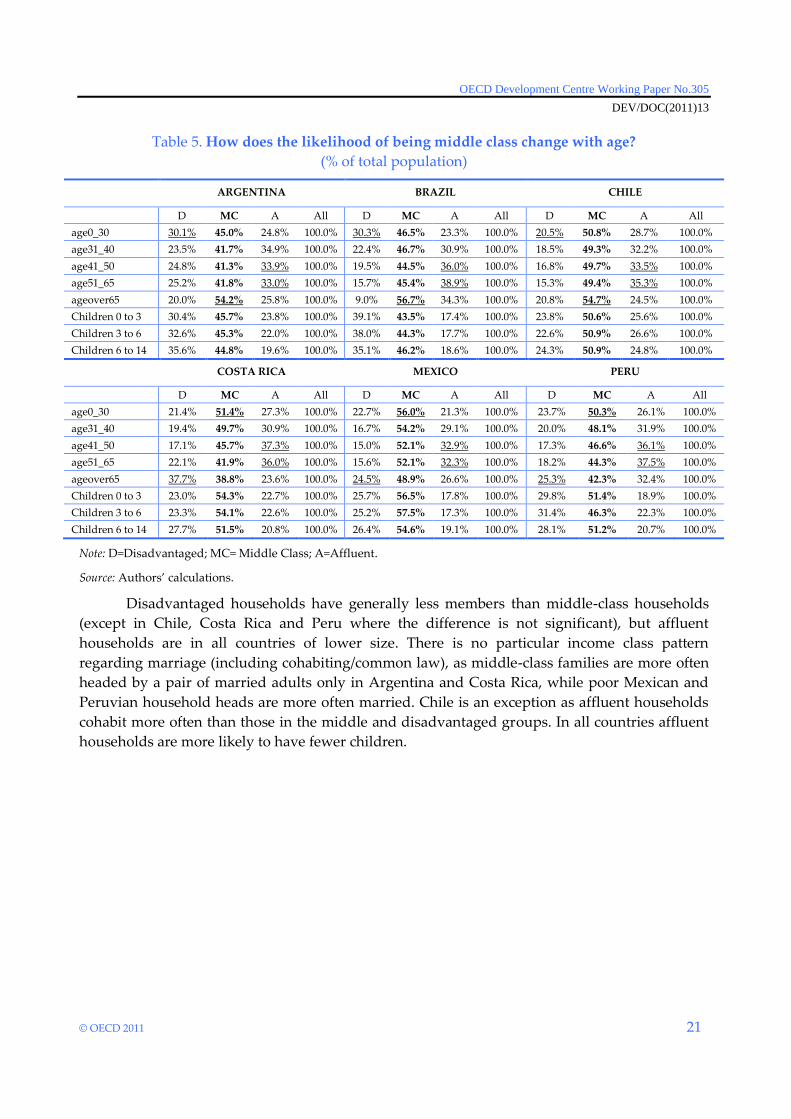
While Table 4 showed the age profile of household heads for disadvantaged, middle class
and affluent categories. Table 5 takes age cohorts for the entire population (not only heads of
households) and compute the relative shares of income groups. Therefore, Table 5 illustrates how
the likelihood of being middle-class change with age. Young individuals are less likely to be in
the middle class than older ones in Argentina, Brazil and Chile and more prone to be poor. On
the contrary, in Costa Rica, Mexico and Peru, people younger than 30 years are more likely to be
middle-class than poor (relatively to other age classes). In all countries, individuals between 41
and 65 years old are more likely to be affluent. The size of middle class for older individuals
(over 65) is higher compared to other age classes in Argentina, Brazil and Chile, while in Costa
Rica, Mexico and Peru the size of disadvantaged group is higher compared to younger classes.
OECD Development Centre Working Paper No.305
DEV/DOC(2011)13
© OECD 2011 21
Table 5. How does the likelihood of being middle class change with age?
(% of total population)
ARGENTINA BRAZIL CHILE
D MC A All D MC A All D MC A All
age0_30 30.1% 45.0% 24.8% 100.0% 30.3% 46.5% 23.3% 100.0% 20.5% 50.8% 28.7% 100.0%
age31_40 23.5% 41.7% 34.9% 100.0% 22.4% 46.7% 30.9% 100.0% 18.5% 49.3% 32.2% 100.0%
age41_50 24.8% 41.3% 33.9% 100.0% 19.5% 44.5% 36.0% 100.0% 16.8% 49.7% 33.5% 100.0%
age51_65 25.2% 41.8% 33.0% 100.0% 15.7% 45.4% 38.9% 100.0% 15.3% 49.4% 35.3% 100.0%
ageover65 20.0% 54.2% 25.8% 100.0% 9.0% 56.7% 34.3% 100.0% 20.8% 54.7% 24.5% 100.0%
Children 0 to 3 30.4% 45.7% 23.8% 100.0% 39.1% 43.5% 17.4% 100.0% 23.8% 50.6% 25.6% 100.0%
Children 3 to 6 32.6% 45.3% 22.0% 100.0% 38.0% 44.3% 17.7% 100.0% 22.6% 50.9% 26.6% 100.0%
Children 6 to 14 35.6% 44.8% 19.6% 100.0% 35.1% 46.2% 18.6% 100.0% 24.3% 50.9% 24.8% 100.0%
COSTA RICA MEXICO PERU
D MC A All D MC A All D MC A All
age0_30 21.4% 51.4% 27.3% 100.0% 22.7% 56.0% 21.3% 100.0% 23.7% 50.3% 26.1% 100.0%
age31_40 19.4% 49.7% 30.9% 100.0% 16.7% 54.2% 29.1% 100.0% 20.0% 48.1% 31.9% 100.0%
age41_50 17.1% 45.7% 37.3% 100.0% 15.0% 52.1% 32.9% 100.0% 17.3% 46.6% 36.1% 100.0%
age51_65 22.1% 41.9% 36.0% 100.0% 15.6% 52.1% 32.3% 100.0% 18.2% 44.3% 37.5% 100.0%
ageover65 37.7% 38.8% 23.6% 100.0% 24.5% 48.9% 26.6% 100.0% 25.3% 42.3% 32.4% 100.0%
Children 0 to 3 23.0% 54.3% 22.7% 100.0% 25.7% 56.5% 17.8% 100.0% 29.8% 51.4% 18.9% 100.0%
Children 3 to 6 23.3% 54.1% 22.6% 100.0% 25.2% 57.5% 17.3% 100.0% 31.4% 46.3% 22.3% 100.0%
Children 6 to 14 27.7% 51.5% 20.8% 100.0% 26.4% 54.6% 19.1% 100.0% 28.1% 51.2% 20.7% 100.0%
Note: D=Disadvantaged; MC= Middle Class; A=Affluent.
Source: Authors’ calculations.
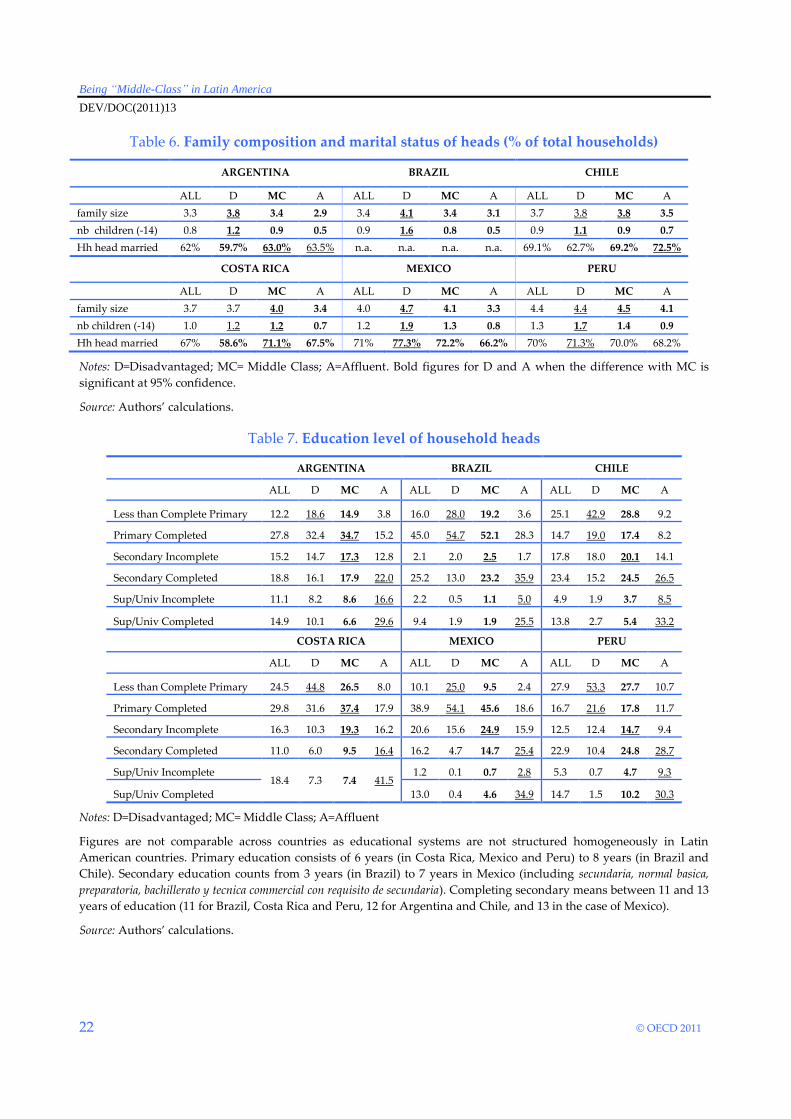
Disadvantaged households have generally less members than middle-class households
(except in Chile, Costa Rica and Peru where the difference is not significant), but affluent
households are in all countries of lower size. There is no particular income class pattern
regarding marriage (including cohabiting/common law), as middle-class families are more often
headed by a pair of married adults only in Argentina and Costa Rica, while poor Mexican and
Peruvian household heads are more often married. Chile is an exception as affluent households
cohabit more often than those in the middle and disadvantaged groups. In all countries affluent
households are more likely to have fewer children.
Being “Middle-Class” in Latin America
DEV/DOC(2011)13
22 © OECD 2011
Table 6. Family composition and marital status of heads (% of total households)
ARGENTINA BRAZIL CHILE
ALL D MC A ALL D MC A ALL D MC A
family size 3.3 3.8 3.4 2.9 3.4 4.1 3.4 3.1 3.7 3.8 3.8 3.5
nb children (-14) 0.8 1.2 0.9 0.5 0.9 1.6 0.8 0.5 0.9 1.1 0.9 0.7
Hh head married 62% 59.7% 63.0% 63.5% n.a. n.a. n.a. n.a. 69.1% 62.7% 69.2% 72.5%
COSTA RICA MEXICO PERU
ALL D MC A ALL D MC A ALL D MC A
family size 3.7 3.7 4.0 3.4 4.0 4.7 4.1 3.3 4.4 4.4 4.5 4.1
nb children (-14) 1.0 1.2 1.2 0.7 1.2 1.9 1.3 0.8 1.3 1.7 1.4 0.9
Hh head married 67% 58.6% 71.1% 67.5% 71% 77.3% 72.2% 66.2% 70% 71.3% 70.0% 68.2%
Notes: D=Disadvantaged; MC= Middle Class; A=Affluent. Bold figures for D and A when the difference with MC is
significant at 95% confidence.
Source: Authors’ calculations.
Table 7. Education level of household heads
ARGENTINA BRAZIL CHILE
ALL D MC A ALL D MC A ALL D MC A
Less than Complete Primary 12.2 18.6 14.9 3.8 16.0 28.0 19.2 3.6 25.1 42.9 28.8 9.2
Primary Completed 27.8 32.4 34.7 15.2 45.0 54.7 52.1 28.3 14.7 19.0 17.4 8.2
Secondary Incomplete 15.2 14.7 17.3 12.8 2.1 2.0 2.5 1.7 17.8 18.0 20.1 14.1
Secondary Completed 18.8 16.1 17.9 22.0 25.2 13.0 23.2 35.9 23.4 15.2 24.5 26.5
Sup/Univ Incomplete 11.1 8.2 8.6 16.6 2.2 0.5 1.1 5.0 4.9 1.9 3.7 8.5
Sup/Univ Completed 14.9 10.1 6.6 29.6 9.4 1.9 1.9 25.5 13.8 2.7 5.4 33.2
COSTA RICA MEXICO PERU
ALL D MC A ALL D MC A ALL D MC A
Less than Complete Primary 24.5 44.8 26.5 8.0 10.1 25.0 9.5 2.4 27.9 53.3 27.7 10.7
Primary Completed 29.8 31.6 37.4 17.9 38.9 54.1 45.6 18.6 16.7 21.6 17.8 11.7
Secondary Incomplete 16.3 10.3 19.3 16.2 20.6 15.6 24.9 15.9 12.5 12.4 14.7 9.4
Secondary Completed 11.0 6.0 9.5 16.4 16.2 4.7 14.7 25.4 22.9 10.4 24.8 28.7
Sup/Univ Incomplete 18.4 7.3 7.4 41.5
1.2 0.1 0.7 2.8 5.3 0.7 4.7 9.3
Sup/Univ Completed 13.0 0.4 4.6 34.9 14.7 1.5 10.2 30.3
Notes: D=Disadvantaged; MC= Middle Class; A=Affluent
Figures are not comparable across countries as educational systems are not structured homogeneously in Latin
American countries. Primary education consists of 6 years (in Costa Rica, Mexico and Peru) to 8 years (in Brazil and
Chile). Secondary education counts from 3 years (in Brazil) to 7 years in Mexico (including secundaria, normal basica,
preparatoria, bachillerato y tecnica commercial con requisito de secundaria). Completing secondary means between 11 and 13
years of education (11 for Brazil, Costa Rica and Peru, 12 for Argentina and Chile, and 13 in the case of Mexico).
Source: Authors’ calculations.
OECD Development Centre Working Paper No.305
DEV/DOC(2011)13
© OECD 2011 23
Table 7 focuses on education levels of household heads. As expected, in all countries
income classes are strongly correlated with education. In comparison with the other income
groups, middle-class household heads are more likely to have incomplete secondary education
(or even just primary completed in the case of Argentina and Costa Rica). In all countries,
household heads having completed only primary education or less are more often poor, while
completed secondary education is more likely to be a characteristic of affluent households than
of the middle classes. University seems to be restricted to the affluent as the gap remains
important with respect to middle-class figures (more than 20% in all countries).
Table 8. Main sectors of economic activity and labour status (household heads only)
Argentina (urb) Uruguay (urb) Brazil Chile
D MC A D MC A D MC A D MC A
Agriculture, Forestry, Fishing 8.1 4.0 10.9 2.7 1.1 1.0 42.0 19.5 7.1 29.6 16.5 6.9
Mining, Electricity, Water supply 11.7 11.5 29.3 4.2 4.8 5.0 n.a. n.a. n.a. 1.8 2.6 3.7
Manufacturing 26.7 26.6 26.3 16.6 16.8 11.7 9.9 16.3 18.0 12.7 15.0 13.9
Construction, Transport, Communication 3.4 5.8 5.1 19.4 17.0 11.8 14.0 18.0 12.8 21.1 22.8 19.5
Wholesale, Hotels, Restaurants 18.8 16.7 7.8 29.8 21.8 18.0 15.4 21.0 22.8 11.3 16.2 18.1
Public administration, Education, Health 14.4 18.5 11.4 4.1 20.5 28.4 4.9 9.2 21.1 7.3 11.2 18.9
Other services 16.9 16.9 9.3 23.2 17.9 24.1 13.8 16.1 18.2 16.2 15.7 19.1
% active occupied/total 63.6 64.9 81.6 60.7 56.8 67.6 71.2 73.5 77.8 50.9 69.7 84.9
Geographic coverage of surveys Urban Urban National National
Costa Rica Mexico Peru
D
M
MC A D
M
MC A D
M
MC A
Agriculture, Forestry, Fishing 33.7 18.4 6.5 44.6 12.7 5.1 82.0 32.6 8.8
Mining, Electricity, Water supply 1.1 1.7 2.0 0.3 1.0 2.3 0.6 1.5 2.7
Manufacturing 10.5 14.2 12.3 11.6 17.4 15.3 4.2 9.9 13.8
Construction, Transport, Communication 10.8 18.1 16.5 16.6 20.9 12.7 3.0 16.4 16.9
Wholesale, Hotels, Restaurants 21.0 22.5 22.5 14.6 22.6 23.0 6.4 23.8 26.0
Public administration, Education, Health 5.6 9.3 22.2 1.9 9.3 23.2 1.5 8.7 18.8
Other services 17.4 15.8 18.1 10.5 16.1 18.5 2.4 7.1 13.0
% active occupied/total 57.0 80.4 84.2 80.8 80.9 81.2 89.1 83.0 75.1
Geographic coverage of surveys National National National
Notes: D=Disadvantaged; MC= Middle Class; A=Affluent
Figures shown are for the middle sector household heads; for disadvantaged and affluent. Columns may not sum to
100% as some sectors of economic activity are not reported here.
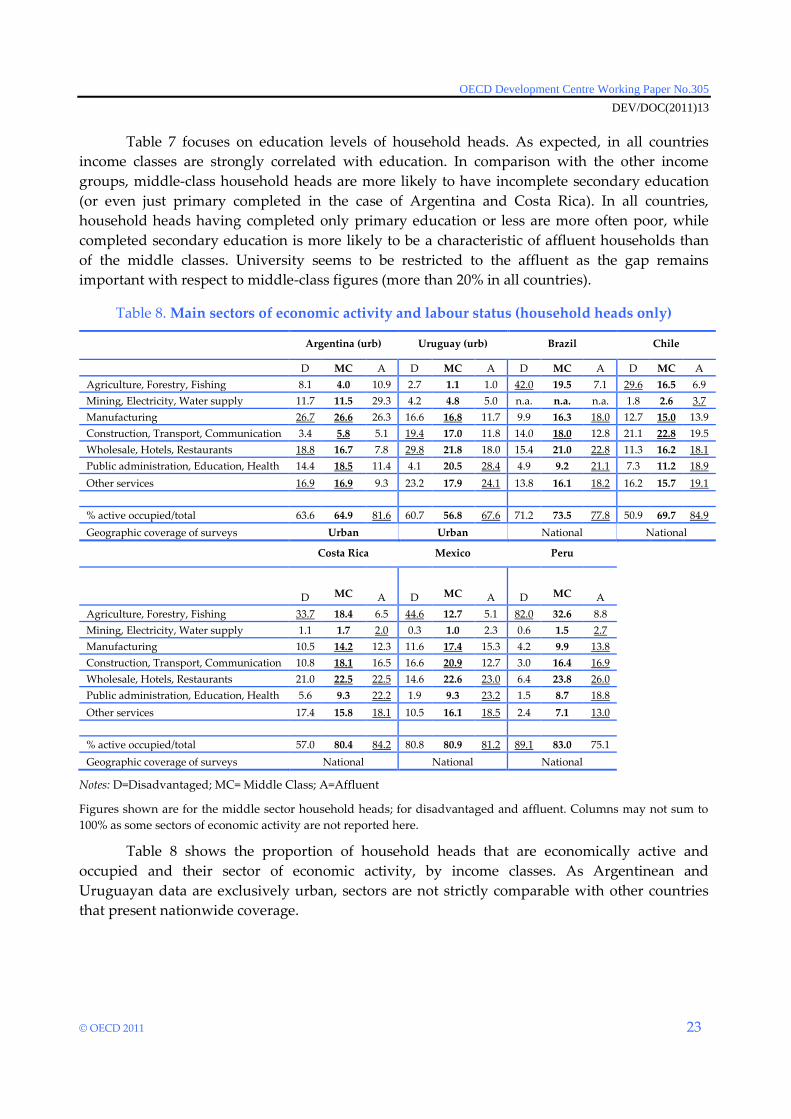
Table 8 shows the proportion of household heads that are economically active and
occupied and their sector of economic activity, by income classes. As Argentinean and
Uruguayan data are exclusively urban, sectors are not strictly comparable with other countries
that present nationwide coverage.
Being “Middle-Class” in Latin America
DEV/DOC(2011)13
24 © OECD 2011
There is a positive correlation between income and the proportion of active and occupied
heads, with the notable exception of Peru where the relation is completely inversed:
disadvantaged household heads are more often active and occupied but mostly in agriculture
(82%) where incomes usually are very low and might reflect household subsistence production
rather that labour market participation.
In urban Argentina and Uruguay, disadvantaged households are more likely to be
employed in wholesale, hotels and restaurants (and construction for Uruguay). Middle-class
households are more often employed in service sector in Argentina. In all other countries, the
agricultural sector is mainly occupied by the poor, while the service sector (Public
Administration, Education and Health as well as other services) is associated with higher ranks
on the social scale. Latin America’s middle class works more often in manufacturing and
construction sectors (also wholesale, hotel restaurants).
OECD Development Centre Working Paper No.305
DEV/DOC(2011)13
© OECD 2011 25
V. INTERGROUP INCOME GAPS: A HINT AT SOCIAL MOBILITY
POTENTIAL
Social mobility, intrinsic to income and middle class size evolution overtime, is often
analysed in terms of intergenerational mobility, which considers the socioeconomic status
differences between parents and children (OECD, 2010, Daude (2011)). This mobility reflects the
changes in social status inside the family, in particular the possibility to climb the social ladder,
as a result of better socio-economic conditions.
Intergenerational mobility is the result of several elements, which range from inherited
abilities and social context to environmental factors. The latter are shaped by the policies
determining access to human capital formation, such as public support for early childhood
development, primary, secondary and tertiary education, as well as redistributive policies
(e.g. tax and transfer schemes).
In what follows, we examine the gaps across income classes, using the median income-
based distribution of households, and take these distances as an indication of mobility potential
of households to move along the income ladder (i.e. a poverty gap, a middle class gap from the
poverty line, from the median income and from the middle class upper threshold). In a nutshell,
we gauge mobility potential as the distance to climb into the next income group or to avoid
falling into a lower income group, estimating the potential to move up and down the social
(i.e. income) ladder based on total household income.12
We calculate several indices to gauge the ‚potential‛ of income groups to climb the
ladder that can provide useful signals to foster mobility. To do so, we use our median income-
based definition (50-150% of the median total household income, adjusted for family composition
using the OECD adult equivalent scale). This has the advantage of being both country-specific
and comparable across countries. To simplify interpretation, we distinguish a lower and upper
middle class, as the vulnerability to exit middle class is unlikely to be the same for both
categories.
Indicators are calculated as ‚gaps‛ or mean ‚income distance‛ over population,
indicating the mean shortfall from respective thresholds. All indicators are normalised to 1 to
simplify interpretation.
12. Weber (1905) argued that ‚class stratification‛ had a clear and important economic dimension, he
believed in two other related dimensions of stratification, namely: status and power.
Being “Middle-Class” in Latin America
DEV/DOC(2011)13
26 © OECD 2011
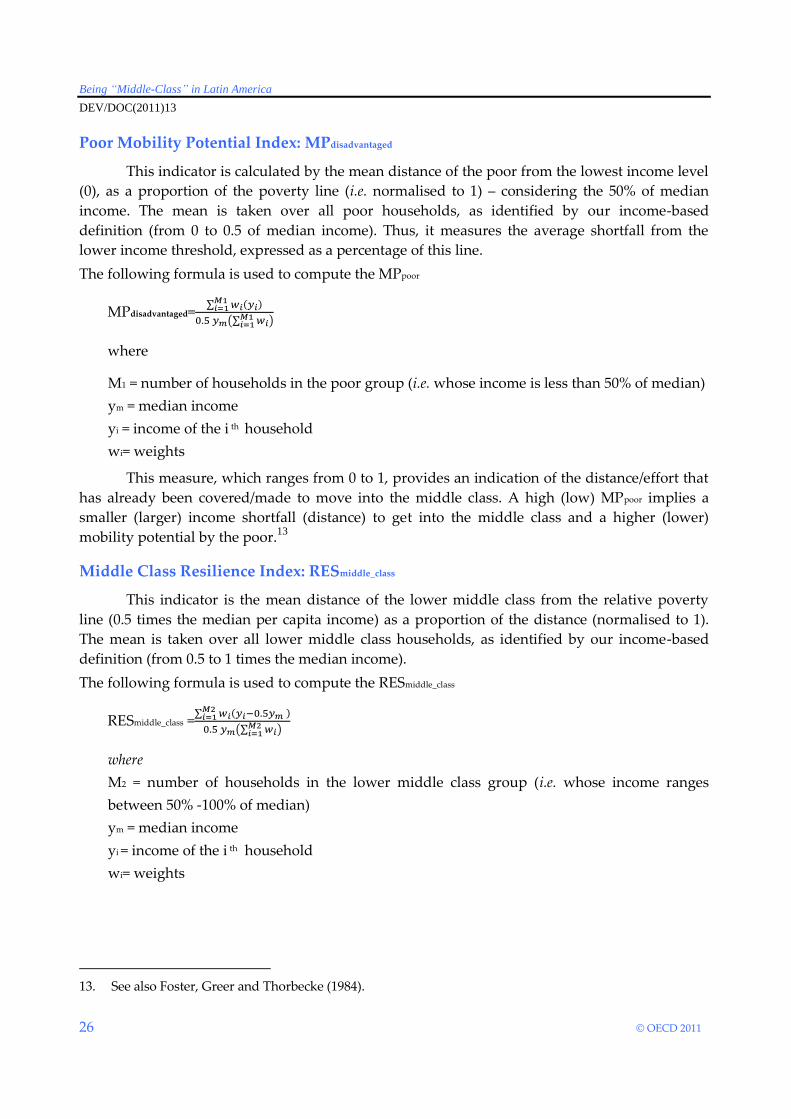
Poor Mobility Potential Index: MPdisadvantaged
This indicator is calculated by the mean distance of the poor from the lowest income level
(0), as a proportion of the poverty line (i.e. normalised to 1) – considering the 50% of median
income. The mean is taken over all poor households, as identified by our income-based
definition (from 0 to 0.5 of median income). Thus, it measures the average shortfall from the
lower income threshold, expressed as a percentage of this line.
The following formula is used to compute the MPpoor
MPdisadvantaged=
where
M1 = number of households in the poor group (i.e. whose income is less than 50% of median)
ym = median income
yi = income of the i th household
wi= weights
This measure, which ranges from 0 to 1, provides an indication of the distance/effort that
has already been covered/made to move into the middle class. A high (low) MPpoor implies a
smaller (larger) income shortfall (distance) to get into the middle class and a higher (lower)
mobility potential by the poor.13
Middle Class Resilience Index: RESmiddle_class
This indicator is the mean distance of the lower middle class from the relative poverty
line (0.5 times the median per capita income) as a proportion of the distance (normalised to 1).
The mean is taken over all lower middle class households, as identified by our income-based
definition (from 0.5 to 1 times the median income).
The following formula is used to compute the RESmiddle_class
RESmiddle_class =
where
M2 = number of households in the lower middle class group (i.e. whose income ranges
between 50% -100% of median)
ym = median income
yi = income of the i th household
wi= weights
13. See also Foster, Greer and Thorbecke (1984).
OECD Development Centre Working Paper No.305
DEV/DOC(2011)13
© OECD 2011 27
This measure, which ranges from 0 to 1, provides an indication of the distance of a lower
middle class member from the poverty line (0.5 median income), or the effort they already made
to stay in the middle class. A high (low) RESmiddle_class implies a lower (higher) risk of falling into
poverty and a higher (lower) resilience of staying in the middle class, as lower middle class
individuals would be concentrated close to the median income rather than the poverty line.
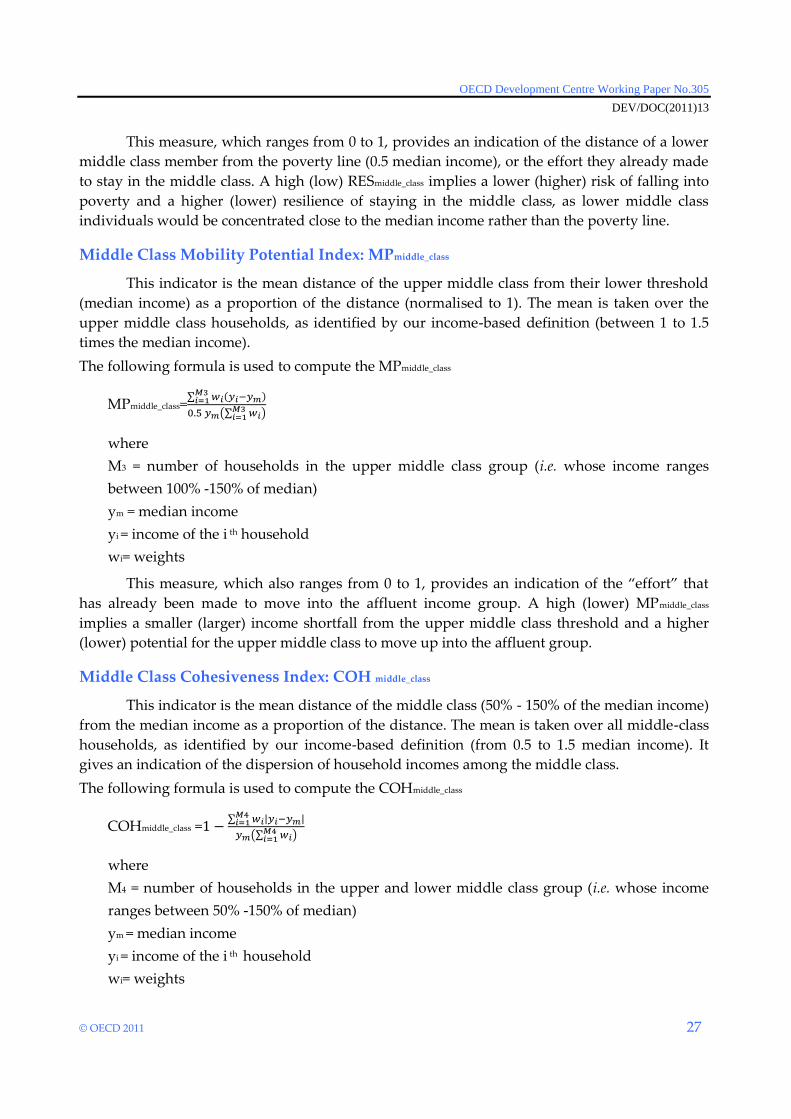
Middle Class Mobility Potential Index: MPmiddle_class
This indicator is the mean distance of the upper middle class from their lower threshold
(median income) as a proportion of the distance (normalised to 1). The mean is taken over the
upper middle class households, as identified by our income-based definition (between 1 to 1.5
times the median income).
The following formula is used to compute the MPmiddle_class
MPmiddle_class=
where
M3 = number of households in the upper middle class group (i.e. whose income ranges
between 100% -150% of median)
ym = median income
yi = income of the i th household
wi= weights
This measure, which also ranges from 0 to 1, provides an indication of the ‚effort‛ that
has already been made to move into the affluent income group. A high (lower) MPmiddle_class
implies a smaller (larger) income shortfall from the upper middle class threshold and a higher
(lower) potential for the upper middle class to move up into the affluent group.
Middle Class Cohesiveness Index: COH middle_class
This indicator is the mean distance of the middle class (50% - 150% of the median income)
from the median income as a proportion of the distance. The mean is taken over all middle-class
households, as identified by our income-based definition (from 0.5 to 1.5 median income). It
gives an indication of the dispersion of household incomes among the middle class.
The following formula is used to compute the COHmiddle_class
COHmiddle_class =
where
M4 = number of households in the upper and lower middle class group (i.e. whose income
ranges between 50% -150% of median)
ym = median income
yi = income of the i th household
wi= weights
Being “Middle-Class” in Latin America
DEV/DOC(2011)13
28 © OECD 2011
This measure, which also is between 0 and 1, provides an indication of the degree of
polarisation within the middle income group.
A high (lower) COHmiddle_class implies a lower (higher) distance from median income
(i.e. centre of the middle class distribution range) and a higher (lower) cohesiveness of the middle
class. A more homogeneous income distribution might contribute to income equality. So, if on
one hand we are confronted with a lower probability to move up the ladder, this also hints at a
lower probability to move into poverty.
All indicators have been defined so that a high (low) indicator means a positive (negative)
implication regarding social mobility potential.
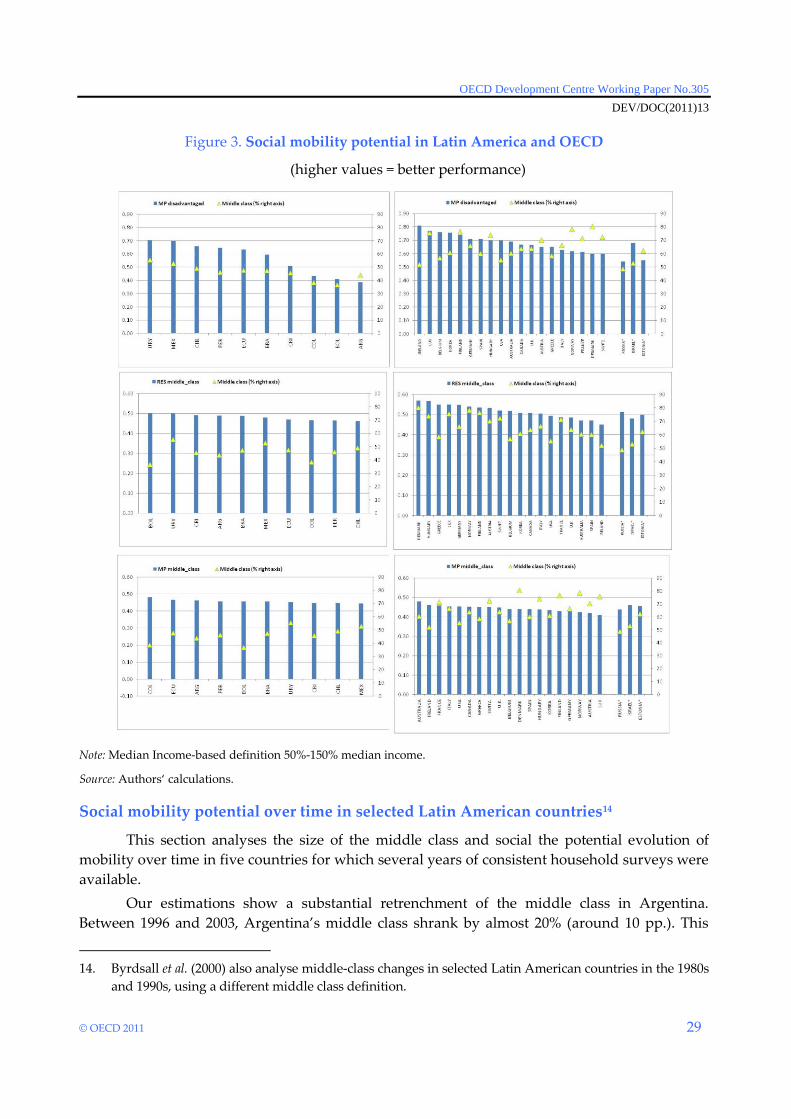
Figure 3 allows comparing Latin American and OECD countries, showing that, while
middle class mobility potential is not very different, mobility potential for the poor and middle
class resilience are higher in OECD countries. Uruguay, with the largest middle class in the
region, shows also the highest mobility potential for the poor, in addition to the most cohesive
middle class.
OECD Development Centre Working Paper No.305
DEV/DOC(2011)13
© OECD 2011 29
Figure 3. Social mobility potential in Latin America and OECD
(higher values = better performance)
Note: Median Income-based definition 50%-150% median income.
Source: Authors‘ calculations.
Social mobility potential over time in selected Latin American countries14
This section analyses the size of the middle class and social the potential evolution of
mobility over time in five countries for which several years of consistent household surveys were
available.
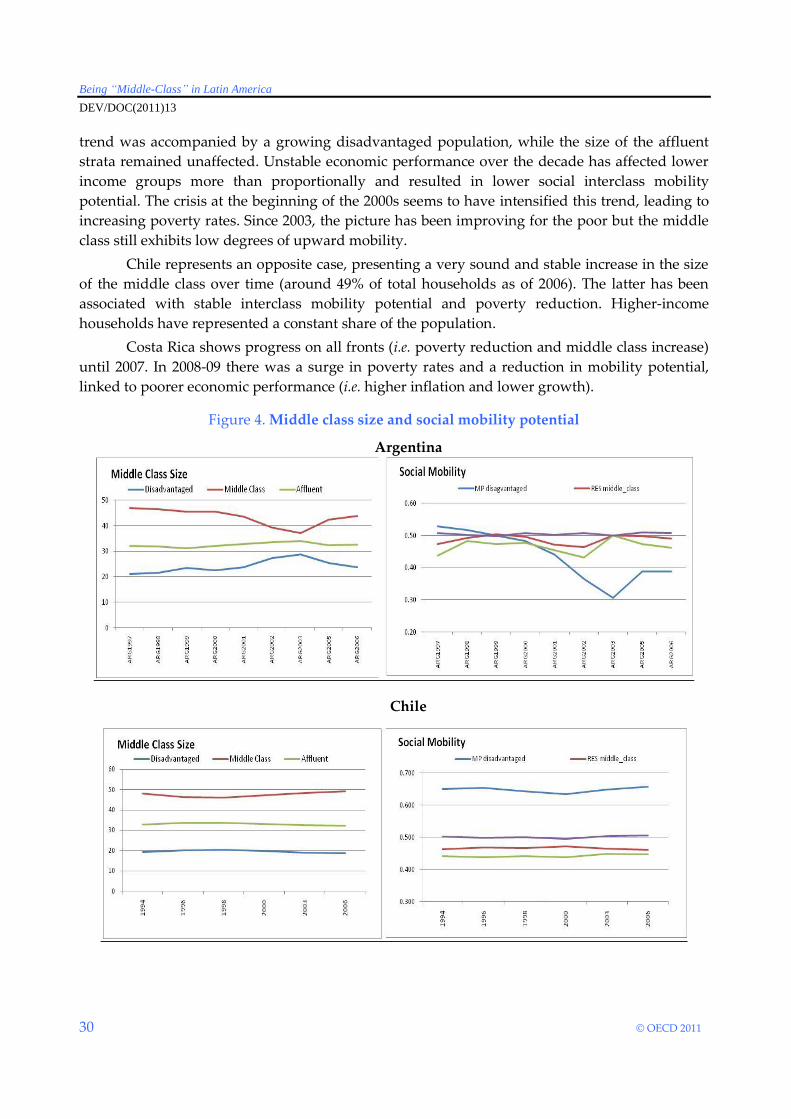
Our estimations show a substantial retrenchment of the middle class in Argentina.
Between 1996 and 2003, Argentina’s middle class shrank by almost 20% (around 10 pp.). This
14. Byrdsall et al. (2000) also analyse middle-class changes in selected Latin American countries in the 1980s
and 1990s, using a different middle class definition.
Being “Middle-Class” in Latin America
DEV/DOC(2011)13
30 © OECD 2011
trend was accompanied by a growing disadvantaged population, while the size of the affluent
strata remained unaffected. Unstable economic performance over the decade has affected lower
income groups more than proportionally and resulted in lower social interclass mobility
potential. The crisis at the beginning of the 2000s seems to have intensified this trend, leading to
increasing poverty rates. Since 2003, the picture has been improving for the poor but the middle
class still exhibits low degrees of upward mobility.
Chile represents an opposite case, presenting a very sound and stable increase in the size
of the middle class over time (around 49% of total households as of 2006). The latter has been
associated with stable interclass mobility potential and poverty reduction. Higher-income
households have represented a constant share of the population.
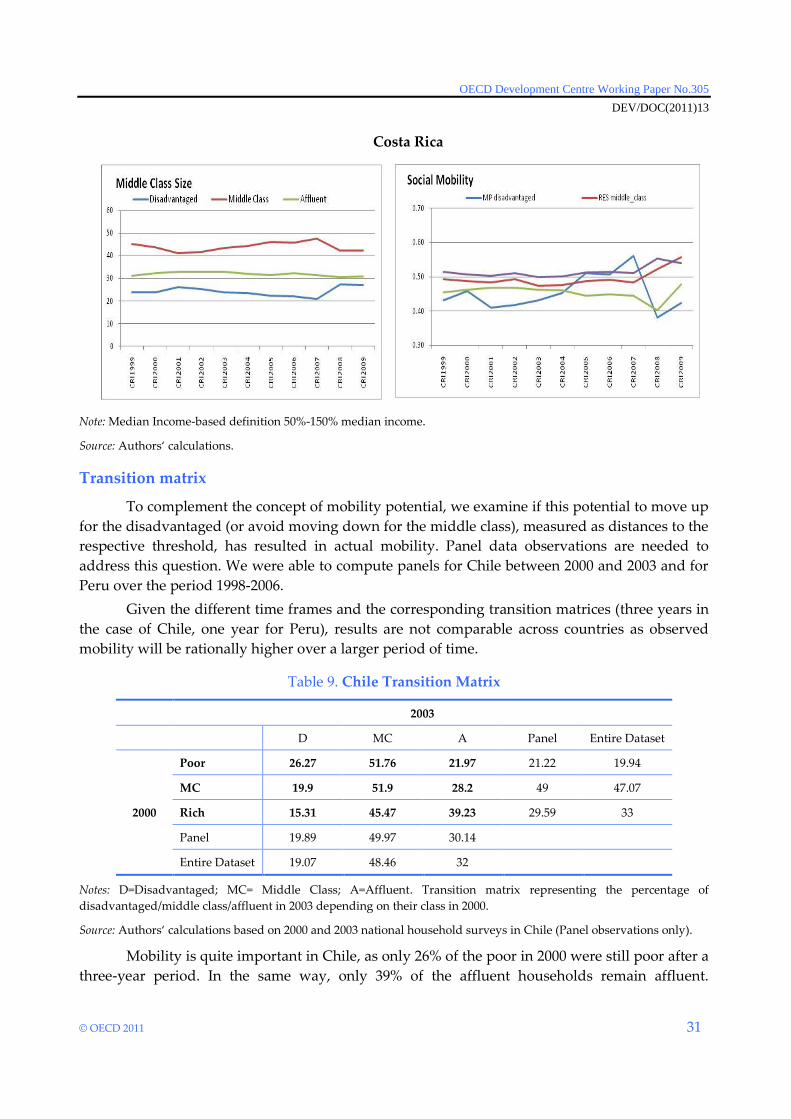
Costa Rica shows progress on all fronts (i.e. poverty reduction and middle class increase)
until 2007. In 2008-09 there was a surge in poverty rates and a reduction in mobility potential,
linked to poorer economic performance (i.e. higher inflation and lower growth).
Figure 4. Middle class size and social mobility potential
Argentina
Chile
OECD Development Centre Working Paper No.305
DEV/DOC(2011)13
© OECD 2011 31
Costa Rica
Note: Median Income-based definition 50%-150% median income.
Source: Authors‘ calculations.
Transition matrix
To complement the concept of mobility potential, we examine if this potential to move up
for the disadvantaged (or avoid moving down for the middle class), measured as distances to the
respective threshold, has resulted in actual mobility. Panel data observations are needed to
address this question. We were able to compute panels for Chile between 2000 and 2003 and for
Peru over the period 1998-2006.
Given the different time frames and the corresponding transition matrices (three years in
the case of Chile, one year for Peru), results are not comparable across countries as observed
mobility will be rationally higher over a larger period of time.
Table 9. Chile Transition Matrix
2003
D MC A Panel Entire Dataset
2000
Poor 26.27 51.76 21.97 21.22 19.94
MC 19.9 51.9 28.2 49 47.07
Rich 15.31 45.47 39.23 29.59 33
Panel 19.89 49.97 30.14
Entire Dataset 19.07 48.46 32
Notes: D=Disadvantaged; MC= Middle Class; A=Affluent. Transition matrix representing the percentage of
disadvantaged/middle class/affluent in 2003 depending on their class in 2000.
Source: Authors‘ calculations based on 2000 and 2003 national household surveys in Chile (Panel observations only).
Mobility is quite important in Chile, as only 26% of the poor in 2000 were still poor after a
three-year period. In the same way, only 39% of the affluent households remain affluent.
Being “Middle-Class” in Latin America
DEV/DOC(2011)13
32 © OECD 2011
Upward mobility affected 27.8% of all household, but downward mobility is also high (29.5% of
households decent one or two income group). According to these numbers, only 42.7% of
Chilean households do not change income groups between 2000 and 2003.
Table 10. Peru Transition Matrix
2006
D MC A Panel Entire Dataset
2005
Poor 63.61 32.04 4.36 21.67 21.57
MC 17.35 64.03 18.62 49.67 48.52
Rich 1.58 30.67 67.75 28.66 29.9
Panel 22.85 47.54 29.61
Entire Dataset 21.64 46.86 31.5
Notes: D= Disadvantaged; MC= Middle Class; A=Affluent. Transition matrix representing the percentage of
disadvantaged/middle class/affluent in 2006 depending on their class in 2005.
Source: Authors‘ calculations based on 2005 and 2006 national household surveys in Peru (Panel observations only).
Mobility 1998-1999 1999-2000 2001-2002 2002-2003 2003-2004 2004-2005 2005-2006
Downward 16.86 19.86 19.04 16.49 17.48 17.24 17.13
Stability 67.64 68.81 65.02 67.02 63.2 64.04 65
Upward 15.5 11.33 15.95 16.5 19.32 18.72 17.86
As expressed above, the reference period for the following matrix is not the same as for
Chile; results are thus not comparable between countries. Nevertheless, data for Peru allow us to
construct panels for a larger period of time (1998-2006), and to observe the evolution of mobility
between classes over time.
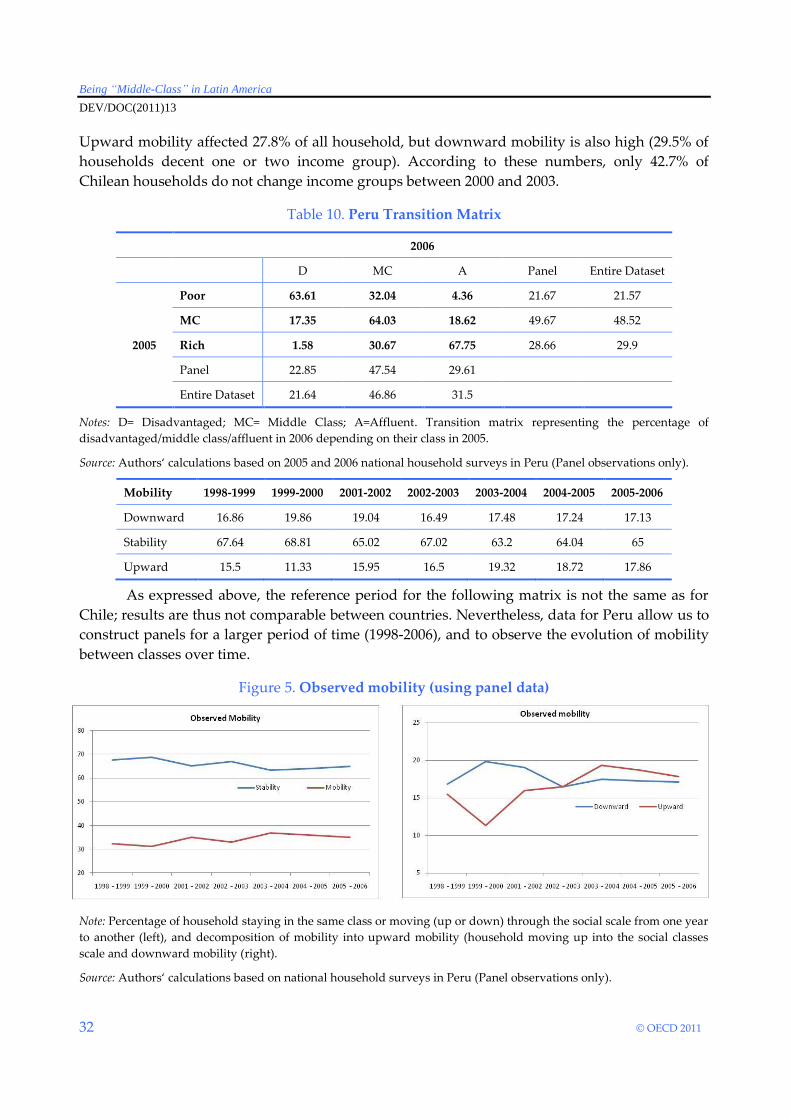
Figure 5. Observed mobility (using panel data)
Note: Percentage of household staying in the same class or moving (up or down) through the social scale from one year
to another (left), and decomposition of mobility into upward mobility (household moving up into the social classes
scale and downward mobility (right).
Source: Authors‘ calculations based on national household surveys in Peru (Panel observations only).
OECD Development Centre Working Paper No.305
DEV/DOC(2011)13
© OECD 2011 33
It appears from the 2005-2006 transition matrix that upward mobility is quite high for the
poor compared to downward mobility of affluent households). Since 1998, Peru increased its
social mobility: upward mobility rose by 70% between 1999 and 2004 (only 11.3% of households
in 1999 moved up while they were 19.3% on 2004). In the meantime, downward mobility
decreased. This is consistent with the strong rise in our Poor Mobility Potential Index as
expressed above. This indicator, measuring the distance of the poor from the middle class
threshold, appears to give some indication about the mobility we observe on panel data.
Being “Middle-Class” in Latin America
DEV/DOC(2011)13
34 © OECD 2011
VI. CONCLUSIONS
The estimation of the size and the analysis of some relevant characteristics of the Latin
American middle class reveal similar patterns across the region. The region shows smaller
middle classes than more advanced countries, pointing to its higher levels of inequality. As
expected, income groups are strongly correlated with education, pointing to the importance of
education access and quality in enhancing social and economic welfare. In most of the countries
in our sample, agriculture remains a primary sector of employment for the poor, while the
middle-class works more often in manufacturing and construction sectors. Comparisons between
Latin American and OECD countries show that, while middle class mobility potential is not very
different, the mobility potential of the poor as well as the resilience of the middle class are
significantly higher in OECD countries. Therefore, attention should be paid to mitigating the
impact of economic hardship on middle class families, as they are more vulnerable to fall into
poverty. Last but not at least, the impact that macroeconomic performance appears to have had
on the middle class – shrinking in countries during episodes of crisis and high volatility –
strengthens the role of macroeconomic stability in fostering the middle class and its contribution
to economic development.
OECD Development Centre Working Paper No.305
DEV/DOC(2011)13
© OECD 2011 35
REFERENCES
ACEMOGLU, D. and F. ZILIBOTTI (1997), ‚Was Prometheus Unbound by Chance? Risk, Diversification and
Growth‛, Journal of Political Economy, Vol. 105(4), pp. 709-51, August.
ALESINA, A. and R. PEROTTI (1996). ‚Income Distribution, Political Instability and Investment‛, European
Economic Review, 40(6): 1203-1228
ALESINA, A. and E. SPOLAORE (1997), ‚On the Number and Size of Nations‛, Quarterly Journal of Economics,
113, 1027-56.
BANERJEE, A. and E. DUFLO (2008), ‚What is Middle Class about the Middle Classes around the World?‛,
Journal of Economic Perspectives, Vol. 22, No. 2, Spring 2008, pp. 3–28.
BARRO, R. J. (1991), ‚Economic Growth in a Cross-Section of Countries‛, Quarterly Journal of Economics, 106,
407-43.
BARRO, R. J. (1997), ‚Determinants of Economic Growth: A Cross-Country Empirical Study‛, MIT Press,
Cambridge, MA.
BARRO, R. J. (1999), ‚Determinants of Democracy‛, Journal of Political Economy, 107, 6, 158-83.
BHALLA, S. (2009), The Middle Class Kingdoms of India and China, Peterson Institute for International
Economics, Washington, DC.
BIRDSALL N. (2007), ‚Stuck in the Tunnel: Is Globalization Muddling the Middle Class?‛, Working Paper,
130, Center for Global Development, Washington, DC.
BIRDSALL N., C. GRAHAM and S. PETTINATO (2000), ‚Stuck in the Tunnel: Is Globalization Muddling the
Middle Class?‛ Center on Social and Economic Dynamics, Working Paper 14, Brookings Institution,
Washington, DC.
BIRDSALL, N. (2010), ‚The (Indispensable) Middle Class in Developing Countries; or The Rich and the Rest,
Not the Poor and the Rest‛, Working Paper 207, Center for Global Development, Washington, DC.
CASHELL, B. W. (2007), ‚Who are the ‚middle class‛, Congressional Research Service, Washington, DC.
DAUDE, C. (2011), ‚Ascendance by Descendants? On Intergenerational Education Mobility in Latin
America‛, OECD Development Centre Working Paper No. 297, Paris.
DAVIES, J. C. and J. H. HUSTON (1992), ‚The Shrinking Middle-Income Class: A Multivariate Analysis‛,
Eastern Economic Journal, 18.3, 277-85.
DOEPKE, M. and F. ZILIBOTTI (2005), ‚Social Class and the Spirit of Capitalism‛, Journal of the European
Economic Association Vol. 3(2-3), pp. 516–24.
DOEPKE, M. and F. ZILIBOTTI (2008), "Occupational Choice and the Spirit of Capitalism‛, Quarterly Journal of
Economics, Vol. 123(2), pp. 747-93.
EASTERLY, W. (2001), ‚The middle class consensus and economic development‛, Journal of Economic Growth,
Vol. 6(4), pp. 317-35.
Being “Middle-Class” in Latin America
DEV/DOC(2011)13
36 © OECD 2011
ECLAC (2009, 2010), Anuario Estadístico de America Latina y el Caribe, United Nations Economic Commission
for Latin America and the Caribbean, Santiago de Chile.
EISENHAUER, J.G. (2008), ‚An Economic Definition of the Middle Class‛, Forum for Social Economics, Vol. 37,
No. 2, pp. 103-113.
FOSTER, J., J. GREER and E. THORBECKE (1984), ‚A class of decomposable poverty measures‛, Econometrica. 2
81: 761–766.
FAJARDO, J. and E. LORA (2010), Understanding the Latin American Middle Classes: Reality and Perception, Inter-
American Development Bank, Research Department, June.
KHARAS, H., (2010), ‚The Emerging Middle Class in Developing Countries‛, OECD Development Centre
Working Paper No. 285, Paris.
LOPEZ-CALVA, L.F. and N. LUSTIG (2010), Declining Inequality in Latin America: A Decade of Progress, United
Nations Development Programme, New York, and Brookings Institution, Washington DC.
MURPHY, K., A. SCHLEIFER and R. VISHNY (1989), ‚Industrialisation and the Big Push‛, Journal of Political
Economy, 97(5), pp. 1003–26.
OECD (2008), Growing Unequal? Income Distribution and Poverty in OECD Countries, OECD, Paris.
OECD (2010), ‚Family Affair: Intergenerational Social Mobility across OECD Countries‛, in Economic Policy
Reforms Going for Growth, OECD, Paris.
PRESSMAN, S. (1997), ‚Consumption Income Distribution and Taxation: Keynes’s Fiscal Policy‛, Journal of
Income Distribution, 7(1), 29-44.
PRESSMAN, S. (2001), ‚The Role of the State and the State Budget‛, in R. HOLT and S. PRESSMAN (Eds) A New
Guide to Post Keynesian Economics, Routledge, New York & London, 102-13.
PRESSMAN, S. (2007), ‚The decline of the middle class: an international perspective‛, Journal of Economic
Issues, 40 (1).
RAVALLION, M. (2009), ‚The Developing World's Bulging (but Vulnerable) Middle Class‛, World
Development, Vol. 38, No. 4, pp. 445-454.
SOLIMANO, A (2008), ‚The Middle Class and the Development Process‛, Serie Macroeconomía del Desarrollo
No. 65, United Nations-ECLAC, Santiago, Chile.
THUROW, L. (1984), ‚The Disappearance of the Middle Class,‛ New York Times.
THUROW, L. (1987), ‚A Surge in Inequality,‛ Scientific American, 256, 30-7.
THUROW, L. (1987), ‚A Surge in Inequality‛, Scientific American, 256, pp. 30-37.
TORCHE, F. and L. LOPEZ-CALVA (2011). ‚Stability and Vulnerability of the Latin American Middle Class‛,
forthcoming in K. NEWMAN ed. Dilemmas of the Middle Class around the World, Oxford University
Press, New York.
WEBER, M. (1905), Die protestantische Ethik und der 'Geist' des Kapitalismus, English translation by T. Parsons,
1930, The Protestant Ethic and the Spirit of Capitalism, Unwin Hyman, London and Boston.
WEBER, M. (1958), ‚Class, Status and Party‛, in H. GERTH, and C.W. MILLS (eds.), From Max Weber: Essays in
Sociology, Oxford University Press, Oxford.
OECD Development Centre Working Paper No.305
DEV/DOC(2011)13
© OECD 2011 37
OTHER TITLES IN THE SERIES/
AUTRES TITRES DANS LA SÉRIE
The former series known as ‚Technical Papers‛ and ‚Webdocs‛ merged in November 2003
into ‚Development Centre Working Papers‛. In the new series, former Webdocs 1-17 follow
former Technical Papers 1-212 as Working Papers 213-229.
All these documents may be downloaded from:
http://www.oecd.org/dev/wp or obtained via e-mail ([email protected]).
Working Paper No.1, Macroeconomic Adjustment and Income Distribution: A Macro-Micro Simulation Model, by François Bourguignon,
William H. Branson and Jaime de Melo, March 1989.
Working Paper No. 2, International Interactions in Food and Agricultural Policies: The Effect of Alternative Policies, by Joachim Zietz and
Alberto Valdés, April, 1989.
Working Paper No. 3, The Impact of Budget Retrenchment on Income Distribution in Indonesia: A Social Accounting Matrix Application, by
Steven Keuning and Erik Thorbecke, June 1989.
Working Paper No. 3a, Statistical Annex: The Impact of Budget Retrenchment, June 1989.
Document de travail No. 4, Le Rééquilibrage entre le secteur public et le secteur privé : le cas du Mexique, par C.-A. Michalet, juin 1989.
Working Paper No. 5, Rebalancing the Public and Private Sectors: The Case of Malaysia, by R. Leeds, July 1989.
Working Paper No. 6, Efficiency, Welfare Effects and Political Feasibility of Alternative Antipoverty and Adjustment Programs, by Alain de
Janvry and Elisabeth Sadoulet, December 1989.
Document de travail No. 7, Ajustement et distribution des revenus : application d’un modèle macro-micro au Maroc, par Christian Morrisson,
avec la collabouration de Sylvie Lambert et Akiko Suwa, décembre 1989.
Working Paper No. 8, Emerging Maize Biotechnologies and their Potential Impact, by W. Burt Sundquist, December 1989.
Document de travail No. 9, Analyse des variables socio-culturelles et de l’ajustement en Côte d’Ivoire, par W. Weekes-Vagliani, janvier 1990.
Working Paper No. 10, A Financial CompuTable General Equilibrium Model for the Analysis of Ecuador’s Stabilization Programs, by André
Fargeix and Elisabeth Sadoulet, February 1990.
Working Paper No. 11, Macroeconomic Aspects, Foreign Flows and Domestic Savings Performance in Developing Countries: A ”State of The
Art” Report, by Anand Chandavarkar, February 1990.
Working Paper No. 12, Tax Revenue Implications of the Real Exchange Rate: Econometric Evidence from Korea and Mexico, by Viriginia
Fierro and Helmut Reisen, February 1990.
Working Paper No. 13, Agricultural Growth and Economic Development: The Case of Pakistan, by Naved Hamid and Wouter Tims,
April 1990.
Working Paper No. 14, Rebalancing the Public and Private Sectors in Developing Countries: The Case of Ghana, by H. Akuoko-Frimpong,
June 1990.
Working Paper No. 15, Agriculture and the Economic Cycle: An Economic and Econometric Analysis with Special Reference to Brazil, by
Florence Contré and Ian Goldin, June 1990.
Working Paper No. 16, Comparative Advantage: Theory and Application to Developing Country Agriculture, by Ian Goldin, June 1990.
Working Paper No. 17, Biotechnology and Developing Country Agriculture: Maize in Brazil, by Bernardo Sorj and John Wilkinson,
June 1990.
Working Paper No. 18, Economic Policies and Sectoral Growth: Argentina 1913-1984, by Yair Mundlak, Domingo Cavallo, Roberto
Domenech, June 1990.
Working Paper No. 19, Biotechnology and Developing Country Agriculture: Maize In Mexico, by Jaime A. Matus Gardea, Arturo Puente
Gonzalez and Cristina Lopez Peralta, June 1990.
Working Paper No. 20, Biotechnology and Developing Country Agriculture: Maize in Thailand, by Suthad Setboonsarng, July 1990.
Working Paper No. 21, International Comparisons of Efficiency in Agricultural Production, by Guillermo Flichmann, July 1990.
Being “Middle-Class” in Latin America
DEV/DOC(2011)13
38 © OECD 2011
Working Paper No. 22, Unemployment in Developing Countries: New Light on an Old Problem, by David Turnham and Denizhan Eröcal,
July 1990.
Working Paper No. 23, Optimal Currency Composition of Foreign Debt: the Case of Five Developing Countries, by Pier Giorgio Gawronski,
August 1990.
Working Paper No. 24, From Globalization to Regionalization: the Mexican Case, by Wilson Peres Núñez, August 1990.
Working Paper No. 25, Electronics and Development in Venezuela: A User-Oriented Strategy and its Policy Implications, by Carlota Perez,
October 1990.
Working Paper No. 26, The Legal Protection of Software: Implications for Latecomer Strategies in Newly Industrialising Economies (NIEs) and
Middle-Income Economies (MIEs), by Carlos Maria Correa, October 1990.
Working Paper No. 27, Specialization, Technical Change and Competitiveness in the Brazilian Electronics Industry, by Claudio R. Frischtak,
October 1990.
Working Paper No. 28, Internationalization Strategies of Japanese Electronics Companies: Implications for Asian Newly Industrializing
Economies (NIEs), by Bundo Yamada, October 1990.
Working Paper No. 29, The Status and an Evaluation of the Electronics Industry in Taiwan, by Gee San, October 1990.
Working Paper No. 30, The Indian Electronics Industry: Current Status, Perspectives and Policy Options, by Ghayur Alam, October 1990.
Working Paper No. 31, Comparative Advantage in Agriculture in Ghana, by James Pickett and E. Shaeeldin, October 1990.
Working Paper No. 32, Debt Overhang, Liquidity Constraints and Adjustment Incentives, by Bert Hofman and Helmut Reisen,
October 1990.
Working Paper No. 34, Biotechnology and Developing Country Agriculture: Maize in Indonesia, by Hidjat Nataatmadja et al., January 1991.
Working Paper No. 35, Changing Comparative Advantage in Thai Agriculture, by Ammar Siamwalla, Suthad Setboonsarng and Prasong
Werakarnjanapongs, March 1991.
Working Paper No. 36, Capital Flows and the External Financing of Turkey’s Imports, by Ziya Önis and Süleyman Özmucur, July 1991.
Working Paper No. 37, The External Financing of Indonesia’s Imports, by Glenn P. Jenkins and Henry B.F. Lim, July 1991.
Working Paper No. 38, Long-term Capital Reflow under Macroeconomic Stabilization in Latin America, by Beatriz Armendariz de Aghion,
July 1991.
Working Paper No. 39, Buybacks of LDC Debt and the Scope for Forgiveness, by Beatriz Armendariz de Aghion, July 1991.
Working Paper No. 40, Measuring and Modelling Non-Tariff Distortions with Special Reference to Trade in Agricultural Commodities, by
Peter J. Lloyd, July 1991.
Working Paper No. 41, The Changing Nature of IMF Conditionality, by Jacques J. Polak, August 1991.
Working Paper No. 42, Time-Varying Estimates on the Openness of the Capital Account in Korea and Taiwan, by Helmut Reisen and Hélène
Yèches, August 1991.
Working Paper No. 43, Toward a Concept of Development Agreements, by F. Gerard Adams, August 1991.
Document de travail No. 44, Le Partage du fardeau entre les créanciers de pays débiteurs défaillants, par Jean-Claude Berthélemy et Ann
Vourc’h, septembre 1991.
Working Paper No. 45, The External Financing of Thailand’s Imports, by Supote Chunanunthathum, October 1991.
Working Paper No. 46, The External Financing of Brazilian Imports, by Enrico Colombatto, with Elisa Luciano, Luca Gargiulo, Pietro
Garibaldi and Giuseppe Russo, October 1991.
Working Paper No. 47, Scenarios for the World Trading System and their Implications for Developing Countries, by Robert Z. Lawrence,
November 1991.
Working Paper No. 48, Trade Policies in a Global Context: Technical Specifications of the Rural/Urban-North/South (RUNS) Applied General
Equilibrium Model, by Jean-Marc Burniaux and Dominique van der Mensbrugghe, November 1991.
Working Paper No. 49, Macro-Micro Linkages: Structural Adjustment and Fertilizer Policy in Sub-Saharan Africa, by Jean-Marc Fontaine
with the collabouration of Alice Sindzingre, December 1991.
Working Paper No. 50, Aggregation by Industry in General Equilibrium Models with International Trade, by Peter J. Lloyd, December 1991.
Working Paper No. 51, Policy and Entrepreneurial Responses to the Montreal Protocol: Some Evidence from the Dynamic Asian Economies, by
David C. O’Connor, December 1991.
Working Paper No. 52, On the Pricing of LDC Debt: an Analysis Based on Historical Evidence from Latin America, by Beatriz Armendariz
de Aghion, February 1992.
Working Paper No. 53, Economic Regionalisation and Intra-Industry Trade: Pacific-Asian Perspectives, by Kiichiro Fukasaku,
February 1992.
Working Paper No. 54, Debt Conversions in Yugoslavia, by Mojmir Mrak, February 1992.
Working Paper No. 55, Evaluation of Nigeria’s Debt-Relief Experience (1985-1990), by N.E. Ogbe, March 1992.
Document de travail No. 56, L’Expérience de l’allégement de la dette du Mali, par Jean-Claude Berthélemy, février 1992.
Working Paper No. 57, Conflict or Indifference: US Multinationals in a World of Regional Trading Blocs, by Louis T. Wells, Jr., March 1992.
Working Paper No. 58, Japan’s Rapidly Emerging Strategy Toward Asia, by Edward J. Lincoln, April 1992.
Working Paper No. 59, The Political Economy of Stabilization Programmes in Developing Countries, by Bruno S. Frey and Reiner
Eichenberger, April 1992.
Working Paper No. 60, Some Implications of Europe 1992 for Developing Countries, by Sheila Page, April 1992.
OECD Development Centre Working Paper No.305
DEV/DOC(2011)13
© OECD 2011 39
Working Paper No. 61, Taiwanese Corporations in Globalisation and Regionalisation, by Gee San, April 1992.
Working Paper No. 62, Lessons from the Family Planning Experience for Community-Based Environmental Education, by Winifred
Weekes-Vagliani, April 1992.
Working Paper No. 63, Mexican Agriculture in the Free Trade Agreement: Transition Problems in Economic Reform, by Santiago Levy and
Sweder van Wijnbergen, May 1992.
Working Paper No. 64, Offensive and Defensive Responses by European Multinationals to a World of Trade Blocs, by John M. Stopford,
May 1992.
Working Paper No. 65, Economic Integration in the Pacific Region, by Richard Drobnick, May 1992.
Working Paper No. 66, Latin America in a Changing Global Environment, by Winston Fritsch, May 1992.
Working Paper No. 67, An Assessment of the Brady Plan Agreements, by Jean-Claude Berthélemy and Robert Lensink, May 1992.
Working Paper No. 68, The Impact of Economic Reform on the Performance of the Seed Sector in Eastern and Southern Africa, by Elizabeth
Cromwell, June 1992.
Working Paper No. 69, Impact of Structural Adjustment and Adoption of Technology on Competitiveness of Major Cocoa Producing Countries,
by Emily M. Bloomfield and R. Antony Lass, June 1992.
Working Paper No. 70, Structural Adjustment and Moroccan Agriculture: an Assessment of the Reforms in the Sugar and Cereal Sectors, by
Jonathan Kydd and Sophie Thoyer, June 1992.
Document de travail No. 71, L’Allégement de la dette au Club de Paris : les évolutions récentes en perspective, par Ann Vourc’h, juin 1992.
Working Paper No. 72, Biotechnology and the Changing Public/Private Sector Balance: Developments in Rice and Cocoa, by Carliene Brenner,
July 1992.
Working Paper No. 73, Namibian Agriculture: Policies and Prospects, by Walter Elkan, Peter Amutenya, Jochbeth Andima, Robin
Sherbourne and Eline van der Linden, July 1992.
Working Paper No. 74, Agriculture and the Policy Environment: Zambia and Zimbabwe, by Doris J. Jansen and Andrew Rukovo,
July 1992.
Working Paper No. 75, Agricultural Productivity and Economic Policies: Concepts and Measurements, by Yair Mundlak, August 1992.
Working Paper No. 76, Structural Adjustment and the Institutional Dimensions of Agricultural Research and Development in Brazil: Soybeans,
Wheat and Sugar Cane, by John Wilkinson and Bernardo Sorj, August 1992.
Working Paper No. 77, The Impact of Laws and Regulations on Micro and Small Enterprises in Niger and Swaziland, by Isabelle Joumard,
Carl Liedholm and Donald Mead, September 1992.
Working Paper No. 78, Co-Financing Transactions between Multilateral Institutions and International Banks, by Michel Bouchet and Amit
Ghose, October 1992.
Document de travail No. 79, Allégement de la dette et croissance : le cas mexicain, par Jean-Claude Berthélemy et Ann Vourc’h,
octobre 1992.
Document de travail No. 80, Le Secteur informel en Tunisie : cadre réglementaire et pratique courante, par Abderrahman Ben Zakour et
Farouk Kria, novembre 1992.
Working Paper No. 81, Small-Scale Industries and Institutional Framework in Thailand, by Naruemol Bunjongjit and Xavier Oudin,
November 1992.
Working Paper No. 81a, Statistical Annex: Small-Scale Industries and Institutional Framework in Thailand, by Naruemol Bunjongjit and
Xavier Oudin, November 1992.
Document de travail No. 82, L’Expérience de l’allégement de la dette du Niger, par Ann Vourc’h et Maina Boukar Moussa, novembre 1992.
Working Paper No. 83, Stabilization and Structural Adjustment in Indonesia: an Intertemporal General Equilibrium Analysis, by David
Roland-Holst, November 1992.
Working Paper No. 84, Striving for International Competitiveness: Lessons from Electronics for Developing Countries, by Jan Maarten de Vet,
March 1993.
Document de travail No. 85, Micro-entreprises et cadre institutionnel en Algérie, par Hocine Benissad, mars 1993.
Working Paper No. 86, Informal Sector and Regulations in Ecuador and Jamaica, by Emilio Klein and Victor E. Tokman, August 1993.
Working Paper No. 87, Alternative Explanations of the Trade-Output Correlation in the East Asian Economies, by Colin I. Bradford Jr. and
Naomi Chakwin, August 1993.
Document de travail No. 88, La Faisabilité politique de l’ajustement dans les pays africains, par Christian Morrisson, Jean-Dominique Lafay
et Sébastien Dessus, novembre 1993.
Working Paper No. 89, China as a Leading Pacific Economy, by Kiichiro Fukasaku and Mingyuan Wu, November 1993.
Working Paper No. 90, A Detailed Input-Output Table for Morocco, 1990, by Maurizio Bussolo and David Roland-Holst November 1993.
Working Paper No. 91, International Trade and the Transfer of Environmental Costs and Benefits, by Hiro Lee and David Roland-Holst,
December 1993.
Working Paper No. 92, Economic Instruments in Environmental Policy: Lessons from the OECD Experience and their Relevance to Developing
Economies, by Jean-Philippe Barde, January 1994.
Working Paper No. 93, What Can Developing Countries Learn from OECD Labour Market Programmes and Policies?, by Åsa Sohlman with
David Turnham, January 1994.
Being “Middle-Class” in Latin America
DEV/DOC(2011)13
40 © OECD 2011
Working Paper No. 94, Trade Liberalization and Employment Linkages in the Pacific Basin, by Hiro Lee and David Roland-Holst,
February 1994.
Working Paper No. 95, Participatory Development and Gender: Articulating Concepts and Cases, by Winifred Weekes-Vagliani,
February 1994.
Document de travail No. 96, Promouvoir la maîtrise locale et régionale du développement : une démarche participative à Madagascar, par
Philippe de Rham et Bernard Lecomte, juin 1994.
Working Paper No. 97, The OECD Green Model: an Updated Overview, by Hiro Lee, Joaquim Oliveira-Martins and Dominique van der
Mensbrugghe, August 1994.
Working Paper No. 98, Pension Funds, Capital Controls and Macroeconomic Stability, by Helmut Reisen and John Williamson,
August 1994.
Working Paper No. 99, Trade and Pollution Linkages: Piecemeal Reform and Optimal Intervention, by John Beghin, David Roland-Holst
and Dominique van der Mensbrugghe, October 1994.
Working Paper No. 100, International Initiatives in Biotechnology for Developing Country Agriculture: Promises and Problems, by Carliene
Brenner and John Komen, October 1994.
Working Paper No. 101, Input-based Pollution Estimates for Environmental Assessment in Developing Countries, by Sébastien Dessus,
David Roland-Holst and Dominique van der Mensbrugghe, October 1994.
Working Paper No. 102, Transitional Problems from Reform to Growth: Safety Nets and Financial Efficiency in the Adjusting Egyptian
Economy, by Mahmoud Abdel-Fadil, December 1994.
Working Paper No. 103, Biotechnology and Sustainable Agriculture: Lessons from India, by Ghayur Alam, December 1994.
Working Paper No. 104, Crop Biotechnology and Sustainability: a Case Study of Colombia, by Luis R. Sanint, January 1995.
Working Paper No. 105, Biotechnology and Sustainable Agriculture: the Case of Mexico, by José Luis Solleiro Rebolledo, January 1995.
Working Paper No. 106, Empirical Specifications for a General Equilibrium Analysis of Labour Market Policies and Adjustments, by Andréa
Maechler and David Roland-Holst, May 1995.
Document de travail No. 107, Les Migrants, partenaires de la coopération internationale : le cas des Maliens de France, par Christophe Daum,
juillet 1995.
Document de travail No. 108, Ouverture et croissance industrielle en Chine : étude empirique sur un échantillon de villes, par Sylvie
Démurger, septembre 1995.
Working Paper No. 109, Biotechnology and Sustainable Crop Production in Zimbabwe, by John J. Woodend, December 1995.
Document de travail No. 110, Politiques de l’environnement et libéralisation des échanges au Costa Rica : une vue d’ensemble, par Sébastien
Dessus et Maurizio Bussolo, février 1996.
Working Paper No. 111, Grow Now/Clean Later, or the Pursuit of Sustainable Development?, by David O’Connor, March 1996.
Working Paper No. 112, Economic Transition and Trade-Policy Reform: Lessons from China, by Kiichiro Fukasaku and Henri-Bernard
Solignac Lecomte, July 1996.
Working Paper No. 113, Chinese Outward Investment in Hong Kong: Trends, Prospects and Policy Implications, by Yun-Wing Sung,
July 1996.
Working Paper No. 114, Vertical Intra-industry Trade between China and OECD Countries, by Lisbeth Hellvin, July 1996.
Document de travail No. 115, Le Rôle du capital public dans la croissance des pays en développement au cours des années 80, par Sébastien
Dessus et Rémy Herrera, juillet 1996.
Working Paper No. 116, General Equilibrium Modelling of Trade and the Environment, by John Beghin, Sébastien Dessus, David Roland-
Holst and Dominique van der Mensbrugghe, September 1996.
Working Paper No. 117, Labour Market Aspects of State Enterprise Reform in Viet Nam, by David O’Connor, September 1996.
Document de travail No. 118, Croissance et compétitivité de l’industrie manufacturière au Sénégal, par Thierry Latreille et Aristomène
Varoudakis, octobre 1996.
Working Paper No. 119, Evidence on Trade and Wages in the Developing World, by Donald J. Robbins, December 1996.
Working Paper No. 120, Liberalising Foreign Investments by Pension Funds: Positive and Normative Aspects, by Helmut Reisen,
January 1997.
Document de travail No. 121, Capital Humain, ouverture extérieure et croissance : estimation sur données de panel d’un modèle à coefficients
variables, par Jean-Claude Berthélemy, Sébastien Dessus et Aristomène Varoudakis, janvier 1997.
Working Paper No. 122, Corruption: The Issues, by Andrew W. Goudie and David Stasavage, January 1997.
Working Paper No. 123, Outflows of Capital from China, by David Wall, March 1997.
Working Paper No. 124, Emerging Market Risk and Sovereign Credit Ratings, by Guillermo Larraín, Helmut Reisen and Julia von
Maltzan, April 1997.
Working Paper No. 125, Urban Credit Co-operatives in China, by Eric Girardin and Xie Ping, August 1997.
Working Paper No. 126, Fiscal Alternatives of Moving from Unfunded to Funded Pensions, by Robert Holzmann, August 1997.
Working Paper No. 127, Trade Strategies for the Southern Mediterranean, by Peter A. Petri, December 1997.
Working Paper No. 128, The Case of Missing Foreign Investment in the Southern Mediterranean, by Peter A. Petri, December 1997.
Working Paper No. 129, Economic Reform in Egypt in a Changing Global Economy, by Joseph Licari, December 1997.
OECD Development Centre Working Paper No.305
DEV/DOC(2011)13
© OECD 2011 41
Working Paper No. 130, Do Funded Pensions Contribute to Higher Aggregate Savings? A Cross-Country Analysis, by Jeanine Bailliu and
Helmut Reisen, December 1997.
Working Paper No. 131, Long-run Growth Trends and Convergence Across Indian States, by Rayaprolu Nagaraj, Aristomène Varoudakis
and Marie-Ange Véganzonès, January 1998.
Working Paper No. 132, Sustainable and Excessive Current Account Deficits, by Helmut Reisen, February 1998.
Working Paper No. 133, Intellectual Property Rights and Technology Transfer in Developing Country Agriculture: Rhetoric and Reality, by
Carliene Brenner, March 1998.
Working Paper No. 134, Exchange-rate Management and Manufactured Exports in Sub-Saharan Africa, by Khalid Sekkat and Aristomène
Varoudakis, March 1998.
Working Paper No. 135, Trade Integration with Europe, Export Diversification and Economic Growth in Egypt, by Sébastien Dessus and
Akiko Suwa-Eisenmann, June 1998.
Working Paper No. 136, Domestic Causes of Currency Crises: Policy Lessons for Crisis Avoidance, by Helmut Reisen, June 1998.
Working Paper No. 137, A Simulation Model of Global Pension Investment, by Landis MacKellar and Helmut Reisen, August 1998.
Working Paper No. 138, Determinants of Customs Fraud and Corruption: Evidence from Two African Countries, by David Stasavage and
Cécile Daubrée, August 1998.
Working Paper No. 139, State Infrastructure and Productive Performance in Indian Manufacturing, by Arup Mitra, Aristomène Varoudakis
and Marie-Ange Véganzonès, August 1998.
Working Paper No. 140, Rural Industrial Development in Viet Nam and China: A Study in Contrasts, by David O’Connor, September 1998.
Working Paper No. 141,Labour Market Aspects of State Enterprise Reform in China, by Fan Gang,Maria Rosa Lunati and David
O’Connor, October 1998.
Working Paper No. 142, Fighting Extreme Poverty in Brazil: The Influence of Citizens’ Action on Government Policies, by Fernanda Lopes
de Carvalho, November 1998.
Working Paper No. 143, How Bad Governance Impedes Poverty Alleviation in Bangladesh, by Rehman Sobhan, November 1998.
Document de travail No. 144, La libéralisation de l’agriculture tunisienne et l’Union européenne: une vue prospective, par Mohamed
Abdelbasset Chemingui et Sébastien Dessus, février 1999.
Working Paper No. 145, Economic Policy Reform and Growth Prospects in Emerging African Economies, by Patrick Guillaumont, Sylviane
Guillaumont Jeanneney and Aristomène Varoudakis, March 1999.
Working Paper No. 146, Structural Policies for International Competitiveness in Manufacturing: The Case of Cameroon, by Ludvig Söderling,
March 1999.
Working Paper No. 147, China’s Unfinished Open-Economy Reforms: Liberalisation of Services, by Kiichiro Fukasaku, Yu Ma and Qiumei
Yang, April 1999.
Working Paper No. 148, Boom and Bust and Sovereign Ratings, by Helmut Reisen and Julia von Maltzan, June 1999.
Working Paper No. 149, Economic Opening and the Demand for Skills in Developing Countries: A Review of Theory and Evidence, by David
O’Connor and Maria Rosa Lunati, June 1999.
Working Paper No. 150, The Role of Capital Accumulation, Adjustment and Structural Change for Economic Take-off: Empirical Evidence from
African Growth Episodes, by Jean-Claude Berthélemy and Ludvig Söderling, July 1999.
Working Paper No. 151, Gender, Human Capital and Growth: Evidence from Six Latin American Countries, by Donald J. Robbins,
September 1999.
Working Paper No. 152, The Politics and Economics of Transition to an Open Market Economy in Viet Nam, by James Riedel and William
S. Turley, September 1999.
Working Paper No. 153, The Economics and Politics of Transition to an Open Market Economy: China, by Wing Thye Woo, October 1999.
Working Paper No. 154, Infrastructure Development and Regulatory Reform in Sub-Saharan Africa: The Case of Air Transport, by Andrea
E. Goldstein, October 1999.
Working Paper No. 155, The Economics and Politics of Transition to an Open Market Economy: India, by Ashok V. Desai, October 1999.
Working Paper No. 156, Climate Policy Without Tears: CGE-Based Ancillary Benefits Estimates for Chile, by Sébastien Dessus and David
O’Connor, November 1999.
Document de travail No. 157, Dépenses d’éducation, qualité de l’éducation et pauvreté : l’exemple de cinq pays d’Afrique francophone, par
Katharina Michaelowa, avril 2000.
Document de travail No. 158, Une estimation de la pauvreté en Afrique subsaharienne d’après les données anthropométriques, par Christian
Morrisson, Hélène Guilmeau et Charles Linskens, mai 2000.
Working Paper No. 159, Converging European Transitions, by Jorge Braga de Macedo, July 2000.
Working Paper No. 160, Capital Flows and Growth in Developing Countries: Recent Empirical Evidence, by Marcelo Soto, July 2000.
Working Paper No. 161, Global Capital Flows and the Environment in the 21st Century, by David O’Connor, July 2000.
Working Paper No. 162, Financial Crises and International Architecture: A “Eurocentric” Perspective, by Jorge Braga de Macedo,
August 2000.
Document de travail No. 163, Résoudre le problème de la dette : de l’initiative PPTE à Cologne, par Anne Joseph, août 2000.
Working Paper No. 164, E-Commerce for Development: Prospects and Policy Issues, by Andrea Goldstein and David O’Connor,
September 2000.
Being “Middle-Class” in Latin America
DEV/DOC(2011)13
42 © OECD 2011
Working Paper No. 165, Negative Alchemy? Corruption and Composition of Capital Flows, by Shang-Jin Wei, October 2000.
Working Paper No. 166, The HIPC Initiative: True and False Promises, by Daniel Cohen, October 2000.
Document de travail No. 167, Les facteurs explicatifs de la malnutrition en Afrique subsaharienne, par Christian Morrisson et Charles
Linskens, octobre 2000.
Working Paper No. 168, Human Capital and Growth: A Synthesis Report, by Christopher A. Pissarides, November 2000.
Working Paper No. 169, Obstacles to Expanding Intra-African Trade, by Roberto Longo and Khalid Sekkat, March 2001.
Working Paper No. 170, Regional Integration In West Africa, by Ernest Aryeetey, March 2001.
Working Paper No. 171, Regional Integration Experience in the Eastern African Region, by Andrea Goldstein and Njuguna S. Ndung’u,
March 2001.
Working Paper No. 172, Integration and Co-operation in Southern Africa, by Carolyn Jenkins, March 2001.
Working Paper No. 173, FDI in Sub-Saharan Africa, by Ludger Odenthal, March 2001
Document de travail No. 174, La réforme des télécommunications en Afrique subsaharienne, par Patrick Plane, mars 2001.
Working Paper No. 175, Fighting Corruption in Customs Administration: What Can We Learn from Recent Experiences?, by Irène Hors;
April 2001.
Working Paper No. 176, Globalisation and Transformation: Illusions and Reality, by Grzegorz W. Kolodko, May 2001.
Working Paper No. 177, External Solvency, Dollarisation and Investment Grade: Towards a Virtuous Circle?, by Martin Grandes, June 2001.
Document de travail No. 178, Congo 1965-1999: Les espoirs déçus du « Brésil africain », par Joseph Maton avec Henri-Bernard Solignac
Lecomte, septembre 2001.
Working Paper No. 179, Growth and Human Capital: Good Data, Good Results, by Daniel Cohen and Marcelo Soto, September 2001.
Working Paper No. 180, Corporate Governance and National Development, by Charles P. Oman, October 2001.
Working Paper No. 181, How Globalisation Improves Governance, by Federico Bonaglia, Jorge Braga de Macedo and Maurizio Bussolo,
November 2001.
Working Paper No. 182, Clearing the Air in India: The Economics of Climate Policy with Ancillary Benefits, by Maurizio Bussolo and David
O’Connor, November 2001.
Working Paper No. 183, Globalisation, Poverty and Inequality in sub-Saharan Africa: A Political Economy Appraisal, by Yvonne M. Tsikata,
December 2001.
Working Paper No. 184, Distribution and Growth in Latin America in an Era of Structural Reform: The Impact of Globalisation, by Samuel
A. Morley, December 2001.
Working Paper No. 185, Globalisation, Liberalisation, Poverty and Income Inequality in Southeast Asia, by K.S. Jomo, December 2001.
Working Paper No. 186, Globalisation, Growth and Income Inequality: The African Experience, by Steve Kayizzi-Mugerwa, December 2001.
Working Paper No. 187, The Social Impact of Globalisation in Southeast Asia, by Mari Pangestu, December 2001.
Working Paper No. 188, Where Does Inequality Come From? Ideas and Implications for Latin America, by James A. Robinson,
December 2001.
Working Paper No. 189, Policies and Institutions for E-Commerce Readiness: What Can Developing Countries Learn from OECD Experience?,
by Paulo Bastos Tigre and David O’Connor, April 2002.
Document de travail No. 190, La réforme du secteur financier en Afrique, par Anne Joseph, juillet 2002.
Working Paper No. 191, Virtuous Circles? Human Capital Formation, Economic Development and the Multinational Enterprise, by Ethan
B. Kapstein, August 2002.
Working Paper No. 192, Skill Upgrading in Developing Countries: Has Inward Foreign Direct Investment Played a Role?, by Matthew
J. Slaughter, August 2002.
Working Paper No. 193, Government Policies for Inward Foreign Direct Investment in Developing Countries: Implications for Human Capital
Formation and Income Inequality, by Dirk Willem te Velde, August 2002.
Working Paper No. 194, Foreign Direct Investment and Intellectual Capital Formation in Southeast Asia, by Bryan K. Ritchie, August 2002.
Working Paper No. 195, FDI and Human Capital: A Research Agenda, by Magnus Blomström and Ari Kokko, August 2002.
Working Paper No. 196, Knowledge Diffusion from Multinational Enterprises: The Role of Domestic and Foreign Knowledge-Enhancing
Activities, by Yasuyuki Todo and Koji Miyamoto, August 2002.
Working Paper No. 197, Why Are Some Countries So Poor? Another Look at the Evidence and a Message of Hope, by Daniel Cohen and
Marcelo Soto, October 2002.
Working Paper No. 198, Choice of an Exchange-Rate Arrangement, Institutional Setting and Inflation: Empirical Evidence from Latin America,
by Andreas Freytag, October 2002.
Working Paper No. 199, Will Basel II Affect International Capital Flows to Emerging Markets?, by Beatrice Weder and Michael Wedow,
October 2002.
Working Paper No. 200, Convergence and Divergence of Sovereign Bond Spreads: Lessons from Latin America, by Martin Grandes,
October 2002.
Working Paper No. 201, Prospects for Emerging-Market Flows amid Investor Concerns about Corporate Governance, by Helmut Reisen,
November 2002.
Working Paper No. 202, Rediscovering Education in Growth Regressions, by Marcelo Soto, November 2002.
OECD Development Centre Working Paper No.305
DEV/DOC(2011)13
© OECD 2011 43
Working Paper No. 203, Incentive Bidding for Mobile Investment: Economic Consequences and Potential Responses, by Andrew Charlton,
January 2003.
Working Paper No. 204, Health Insurance for the Poor? Determinants of participation Community-Based Health Insurance Schemes in Rural
Senegal, by Johannes Jütting, January 2003.
Working Paper No. 205, China’s Software Industry and its Implications for India, by Ted Tschang, February 2003.
Working Paper No. 206, Agricultural and Human Health Impacts of Climate Policy in China: A General Equilibrium Analysis with Special
Reference to Guangdong, by David O’Connor, Fan Zhai, Kristin Aunan, Terje Berntsen and Haakon Vennemo, March 2003.
Working Paper No. 207, India’s Information Technology Sector: What Contribution to Broader Economic Development?, by Nirvikar Singh,
March 2003.
Working Paper No. 208, Public Procurement: Lessons from Kenya, Tanzania and Uganda, by Walter Odhiambo and Paul Kamau,
March 2003.
Working Paper No. 209, Export Diversification in Low-Income Countries: An International Challenge after Doha, by Federico Bonaglia and
Kiichiro Fukasaku, June 2003.
Working Paper No. 210, Institutions and Development: A Critical Review, by Johannes Jütting, July 2003.
Working Paper No. 211, Human Capital Formation and Foreign Direct Investment in Developing Countries, by Koji Miyamoto, July 2003.
Working Paper No. 212, Central Asia since 1991: The Experience of the New Independent States, by Richard Pomfret, July 2003.
Working Paper No. 213, A Multi-Region Social Accounting Matrix (1995) and Regional Environmental General Equilibrium Model for India
(REGEMI), by Maurizio Bussolo, Mohamed Chemingui and David O’Connor, November 2003.
Working Paper No. 214, Ratings Since the Asian Crisis, by Helmut Reisen, November 2003.
Working Paper No. 215, Development Redux: Reflections for a New Paradigm, by Jorge Braga de Macedo, November 2003.
Working Paper No. 216, The Political Economy of Regulatory Reform: Telecoms in the Southern Mediterranean, by Andrea Goldstein,
November 2003.
Working Paper No. 217, The Impact of Education on Fertility and Child Mortality: Do Fathers Really Matter Less than Mothers?, by Lucia
Breierova and Esther Duflo, November 2003.
Working Paper No. 218, Float in Order to Fix? Lessons from Emerging Markets for EU Accession Countries, by Jorge Braga de Macedo and
Helmut Reisen, November 2003.
Working Paper No. 219, Globalisation in Developing Countries: The Role of Transaction Costs in Explaining Economic Performance in India,
by Maurizio Bussolo and John Whalley, November 2003.
Working Paper No. 220, Poverty Reduction Strategies in a Budget-Constrained Economy: The Case of Ghana, by Maurizio Bussolo and
Jeffery I. Round, November 2003.
Working Paper No. 221, Public-Private Partnerships in Development: Three Applications in Timor Leste, by José Braz, November 2003.
Working Paper No. 222, Public Opinion Research, Global Education and Development Co-operation Reform: In Search of a Virtuous Circle, by Ida
Mc Donnell, Henri-Bernard Solignac Lecomte and Liam Wegimont, November 2003.
Working Paper No. 223, Building Capacity to Trade: What Are the Priorities?, by Henry-Bernard Solignac Lecomte, November 2003.
Working Paper No. 224, Of Flying Geeks and O-Rings: Locating Software and IT Services in India’s Economic Development, by David
O’Connor, November 2003.
Document de travail No. 225, Cap Vert: Gouvernance et Développement, par Jaime Lourenço and Colm Foy, novembre 2003.
Working Paper No. 226, Globalisation and Poverty Changes in Colombia, by Maurizio Bussolo and Jann Lay, November 2003.
Working Paper No. 227, The Composite Indicator of Economic Activity in Mozambique (ICAE): Filling in the Knowledge Gaps to Enhance
Public-Private Partnership (PPP), by Roberto J. Tibana, November 2003.
Working Paper No. 228, Economic-Reconstruction in Post-Conflict Transitions: Lessons for the Democratic Republic of Congo (DRC), by
Graciana del Castillo, November 2003.
Working Paper No. 229, Providing Low-Cost Information Technology Access to Rural Communities In Developing Countries: What Works?
What Pays? by Georg Caspary and David O’Connor, November 2003.
Working Paper No. 230, The Currency Premium and Local-Currency Denominated Debt Costs in South Africa, by Martin Grandes, Marcel
Peter and Nicolas Pinaud, December 2003.
Working Paper No. 231, Macroeconomic Convergence in Southern Africa: The Rand Zone Experience, by Martin Grandes, December 2003.
Working Paper No. 232, Financing Global and Regional Public Goods through ODA: Analysis and Evidence from the OECD Creditor
Reporting System, by Helmut Reisen, Marcelo Soto and Thomas Weithöner, January 2004.
Working Paper No. 233, Land, Violent Conflict and Development, by Nicolas Pons-Vignon and Henri-Bernard Solignac Lecomte,
February 2004.
Working Paper No. 234, The Impact of Social Institutions on the Economic Role of Women in Developing Countries, by Christian Morrisson
and Johannes Jütting, May 2004.
Document de travail No. 235, La condition desfemmes en Inde, Kenya, Soudan et Tunisie, par Christian Morrisson, août 2004.
Working Paper No. 236, Decentralisation and Poverty in Developing Countries: Exploring the Impact, by Johannes Jütting,
Céline Kauffmann, Ida Mc Donnell, Holger Osterrieder, Nicolas Pinaud and Lucia Wegner, August 2004.
Working Paper No. 237, Natural Disasters and Adaptive Capacity, by Jeff Dayton-Johnson, August 2004.
Being “Middle-Class” in Latin America
DEV/DOC(2011)13
44 © OECD 2011
Working Paper No. 238, Public Opinion Polling and the Millennium Development Goals, by Jude Fransman, Alphonse L. MacDonnald,
Ida Mc Donnell and Nicolas Pons-Vignon, October 2004.
Working Paper No. 239, Overcoming Barriers to Competitiveness, by Orsetta Causa and Daniel Cohen, December 2004.
Working Paper No. 240, Extending Insurance? Funeral Associations in Ethiopia and Tanzania, by Stefan Dercon, Tessa Bold, Joachim
De Weerdt and Alula Pankhurst, December 2004.
Working Paper No. 241, Macroeconomic Policies: New Issues of Interdependence, by Helmut Reisen, Martin Grandes and Nicolas Pinaud,
January 2005.
Working Paper No. 242, Institutional Change and its Impact on the Poor and Excluded: The Indian Decentralisation Experience, by
D. Narayana, January 2005.
Working Paper No. 243, Impact of Changes in Social Institutions on Income Inequality in China, by Hiroko Uchimura, May 2005.
Working Paper No. 244, Priorities in Global Assistance for Health, AIDS and Population (HAP), by Landis MacKellar, June 2005.
Working Paper No. 245, Trade and Structural Adjustment Policies in Selected Developing Countries, by Jens Andersson, Federico Bonaglia,
Kiichiro Fukasaku and Caroline Lesser, July 2005.
Working Paper No. 246, Economic Growth and Poverty Reduction: Measurement and Policy Issues, by Stephan Klasen, (September 2005).
Working Paper No. 247, Measuring Gender (In)Equality: Introducing the Gender, Institutions and Development Data Base (GID),
by Johannes P. Jütting, Christian Morrisson, Jeff Dayton-Johnson and Denis Drechsler (March 2006).
Working Paper No. 248, Institutional Bottlenecks for Agricultural Development: A Stock-Taking Exercise Based on Evidence from Sub-Saharan
Africa by Juan R. de Laiglesia, March 2006.
Working Paper No. 249, Migration Policy and its Interactions with Aid, Trade and Foreign Direct Investment Policies: A Background Paper, by
Theodora Xenogiani, June 2006.
Working Paper No. 250, Effects of Migration on Sending Countries: What Do We Know? by Louka T. Katseli, Robert E.B. Lucas and
Theodora Xenogiani, June 2006.
Document de travail No. 251, L’aide au développement et les autres flux nord-sud : complémentarité ou substitution ?, par Denis Cogneau et
Sylvie Lambert, juin 2006.
Working Paper No. 252, Angel or Devil? China’s Trade Impact on Latin American Emerging Markets, by Jorge Blázquez-Lidoy, Javier
Rodríguez and Javier Santiso, June 2006.
Working Paper No. 253, Policy Coherence for Development: A Background Paper on Foreign Direct Investment, by Thierry Mayer, July 2006.
Working Paper No. 254, The Coherence of Trade Flows and Trade Policies with Aid and Investment Flows, by Akiko Suwa-Eisenmann and
Thierry Verdier, August 2006.
Document de travail No. 255, Structures familiales, transferts et épargne : examen, par Christian Morrisson, août 2006.
Working Paper No. 256, Ulysses, the Sirens and the Art of Navigation: Political and Technical Rationality in Latin America, by Javier Santiso
and Laurence Whitehead, September 2006.
Working Paper No. 257, Developing Country Multinationals: South-South Investment Comes of Age, by Dilek Aykut and Andrea
Goldstein, November 2006.
Working Paper No. 258, The Usual Suspects: A Primer on Investment Banks’ Recommendations and Emerging Markets, by Sebastián Nieto-
Parra and Javier Santiso, January 2007.
Working Paper No. 259, Banking on Democracy: The Political Economy of International Private Bank Lending in Emerging Markets, by Javier
Rodríguez and Javier Santiso, March 2007.
Working Paper No. 260, New Strategies for Emerging Domestic Sovereign Bond Markets, by Hans Blommestein and Javier Santiso, April
2007.
Working Paper No. 261, Privatisation in the MEDA region. Where do we stand?, by Céline Kauffmann and Lucia Wegner, July 2007.
Working Paper No. 262, Strengthening Productive Capacities in Emerging Economies through Internationalisation: Evidence from the
Appliance Industry, by Federico Bonaglia and Andrea Goldstein, July 2007.
Working Paper No. 263, Banking on Development: Private Banks and Aid Donors in Developing Countries, by Javier Rodríguez and Javier
Santiso, November 2007.
Working Paper No. 264, Fiscal Decentralisation, Chinese Style: Good for Health Outcomes?, by Hiroko Uchimura and Johannes Jütting,
November 2007.
Working Paper No. 265, Private Sector Participation and Regulatory Reform in Water supply: the Southern Mediterranean Experience, by
Edouard Pérard, January 2008.
Working Paper No. 266, Informal Employment Re-loaded, by Johannes Jütting, Jante Parlevliet and Theodora Xenogiani, January 2008.
Working Paper No. 267, Household Structures and Savings: Evidence from Household Surveys, by Juan R. de Laiglesia and Christian
Morrisson, January 2008.
Working Paper No. 268, Prudent versus Imprudent Lending to Africa: From Debt Relief to Emerging Lenders, by Helmut Reisen and Sokhna
Ndoye, February 2008.
Working Paper No. 269, Lending to the Poorest Countries: A New Counter-Cyclical Debt Instrument, by Daniel Cohen, Hélène Djoufelkit-
Cottenet, Pierre Jacquet and Cécile Valadier, April 2008.
Working Paper No.270, The Macro Management of Commodity Booms: Africa and Latin America’s Response to Asian Demand, by Rolando
Avendaño, Helmut Reisen and Javier Santiso, August 2008.
OECD Development Centre Working Paper No.305
DEV/DOC(2011)13
© OECD 2011 45
Working Paper No. 271, Report on Informal Employment in Romania, by Jante Parlevliet and Theodora Xenogiani, July 2008.
Working Paper No. 272, Wall Street and Elections in Latin American Emerging Democracies, by Sebastián Nieto-Parra and Javier Santiso,
October 2008. Working Paper No. 273, Aid Volatility and Macro Risks in LICs, by Eduardo Borensztein, Julia Cage, Daniel Cohen and Cécile Valadier,
November 2008.
Working Paper No. 274, Who Saw Sovereign Debt Crises Coming?, by Sebastián Nieto-Parra, November 2008.
Working Paper No. 275, Development Aid and Portfolio Funds: Trends, Volatility and Fragmentation, by Emmanuel Frot and Javier Santiso,
December 2008.
Working Paper No. 276, Extracting the Maximum from EITI, by Dilan Ölcer, February 2009.
Working Paper No. 277, Taking Stock of the Credit Crunch: Implications for Development Finance and Global Governance, by Andrew Mold,
Sebastian Paulo and Annalisa Prizzon, March 2009.
Working Paper No. 278, Are All Migrants Really Worse Off in Urban Labour Markets? New Empirical Evidence from China, by Jason
Gagnon, Theodora Xenogiani and Chunbing Xing, June 2009.
Working Paper No. 279, Herding in Aid Allocation, by Emmanuel Frot and Javier Santiso, June 2009.
Working Paper No. 280, Coherence of Development Policies: Ecuador’s Economic Ties with Spain and their Development Impact, by Iliana
Olivié, July 2009.
Working Paper No. 281, Revisiting Political Budget Cycles in Latin America, by Sebastián Nieto-Parra and Javier Santiso, August 2009.
Working Paper No. 282, Are Workers’ Remittances Relevant for Credit Rating Agencies?, by Rolando Avendaño, Norbert Gaillard and
Sebastián Nieto-Parra, October 2009.
Working Paper No. 283, Are SWF Investments Politically Biased? A Comparison with Mutual Funds, by Rolando Avendaño and Ja vier
Santiso, December 2009.
Working Paper No. 284, Crushed Aid: Fragmentation in Sectoral Aid, by Emmanuel Frot and Javier Santiso, January 2010.
Working Paper No. 285, The Emerging Middle Class in Developing Countries, by Homi Kharas, January 2010.
Working Paper No. 286, Does Trade Stimulate Innovation? Evidence from Firm-Product Data, by Ana Margarida Fernandes and Caroline
Paunov, January 2010.
Working Paper No. 287, Why Do So Many Women End Up in Bad Jobs? A Cross-Country Assessment, by Johannes Jütting, Angela Luci
and Christian Morrisson, January 2010.
Working Paper No. 288, Innovation, Productivity and Economic Development in Latin America and the Caribbean, by Christian Daude,
February 2010.
Working Paper No. 289, South America for the Chinese? A Trade-Based Analysis, by Eliana Cardoso and Márcio Holland, April 2010.
Working Paper No. 290, On the Role of Productivity and Factor Accumulation in Economic Development in Latin America and the Caribbean,
by Christian Daude and Eduardo Fernández-Arias, April 2010.
Working Paper No. 291, Fiscal Policy in Latin America: Countercyclical and Sustainable at Last?, by Christian Daude, Ángel Melguizo and
Alejandro Neut, July 2010.
Working Paper No. 292, The Renminbi and Poor-Country Growth, by Christopher Garroway, Burcu Hacibedel, Helmut Reisen and
Edouard Turkisch, September 2010.
Working Paper No. 293, Rethinking the (European) Foundations of Sub-Saharan African Regional Economic Integration, by Peter Draper,
September 2010.
Working Paper No. 294, Taxation and more representation? On fiscal policy, social mobility and democracy in Latin America, by Christian
Daude and Angel Melguizo, September 2010.
Working Paper No. 295, The Economy of the Possible: Pensions and Informality in Latin America, by Rita Da Costa, Juan R. de Laiglesia,
Emmanuelle Martínez and Angel Melguizo, January 2011.
Working Paper No. 296, The Macroeconomic Effects of Large Appreciations, by Markus Kappler, Helmut Reisen, Moritz Schularick and
Edourd Turkisch, February 2011.
Working Paper No. 297, Ascendance by descendants? On intergenerational education mobility in Latin America, by Christian Daude,
March 2011.
Working Paper No. 298, The Impact of Migration Policies on Rural Household Welfare in Mexico and Nicaragua, by J. Edward Taylor and
Mateusz Filipski, May 2011.
Working Paper No. 299, Continental vs. intercontinental migration: an empirical analysis of the impact of immigration reforms on Burkina
Faso, by Fleur Wouterse, May 2011.
Working Paper No. 300, “Stay with us”? The impact of emigration on wages in Honduras, by Jason Gagnon, June 2011.
Working Paper No. 301, Public infrastructure investment and fiscal sustainability in Latin America: Incompatible goals?, by Luis Carranza,
Angel Melguizo and Christian Daude, June 2011.
Working Paper No. 302, Recalibrating Development Co-operation: How Can African Countries Benefit from Emerging Partners?, by Myriam
Dahman Saidi and Christina Wolf, July 2011.
Working Paper No. 303, Sovereign Wealth Funds as Investors in Africa: Opportunities and Barriers, by Edouard Turkisch, September 2011.
Working Paper No. 304, The Process of Reform in Latin America: A Review Essay, by Jeff Dayton-Johnson, Juliana Londoño and Sebastián
Nieto-Parra, October 2011.