oecd policy work on green investments nelly petkova oecd, environment directorate second...
TRANSCRIPT

OECD POLICY WORK ON GREEN INVESTMENTS
Nelly PetkovaOECD, Environment Directorate
Second international forum for sustainable business development 17 October 2013, Kiev, Ukraine

0
0.5
1
1.5
2
2.5
3
3.5
4
2
Closing the investment gap to 2030
Source: Compilation based on OECD, IEA, ITF, Mc Kinsey, WEF, Kennedy,C.,Corfee-Morlot,J.Energy Policy(2013)Note: Infrastructure sectors including roads, rail, ports, airports, power, water and telecoms
1: Annual average based on global investments over the period 1996-20122. Annual average needs for the period 2012-2030
US
D t
n/ y
ear
+60%
0
0.5
1
1.5
2
2.5
3
3.5
4
Global infrastructure investments - current
Global infrastructure investments needs - BAU
Global infrastructure investments needs - 2°C
scenario
0
0.5
1
1.5
2
2.5
3
3.5
4
Global infrastructure investments - current
Global infrastructure investments needs - BAU
Global infrastructure investments needs - 2°C
scenario
0
0.5
1
1.5
2
2.5
3
3.5
4
Global infrastructure investments - current
Global infrastructure investments needs - BAU
Global infrastructure investments needs - 2°C
scenario
1 2
?
+10% to -16%
?
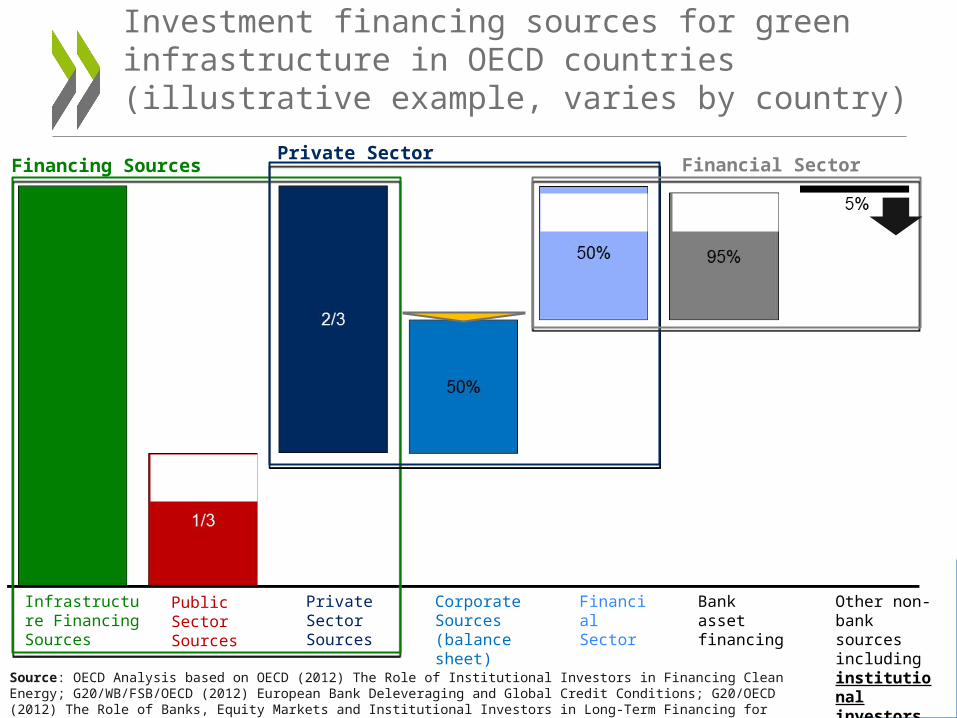
Investment financing sources for green infrastructure in OECD countries (illustrative example, varies by country)
Source: OECD Analysis based on OECD (2012) The Role of Institutional Investors in Financing Clean Energy; G20/WB/FSB/OECD (2012) European Bank Deleveraging and Global Credit Conditions; G20/OECD (2012) The Role of Banks, Equity Markets and Institutional Investors in Long-Term Financing for Growth and Development
Infrastructure Financing Sources
Private Sector Sources
Corporate Sources (balance sheet)
Financial Sector
Bank asset financing
Other non-bank sources including institutional investors
Public Sector Sources
Financing SourcesPrivate Sector
Financial Sector

Average annual ODA to climate-relevant sectors 2010-2011: USD 54 billion
Average annual total ODA 2010-2011: USD 129.3 billion
• ODA to climate-relevant sectors (eg emitting ones) comprises 42% of total ODA from DAC donors in 2010-11.
• Of the total ODA to climate-relevant sectors, 16% of this is to support climate action (i.e. mitigation and/or adaptation is a principal or significant objective).
ODA to climate action, annual average 2010-2011: USD 21 billion
Green vs. brown: Climate-focused ODA as a proportion of total ODA to climate-relevant sectors
* Illustrative chart : represents sectors considered most mitigation and/or adaptation relevant.

New investment in clean energy, 2004 - 2012
Source: Bloomberg New Energy Finance.
Note: Total values include estimates for undisclosed deals. Includes corporate and government R&D. Includes digital energy & energy storage asset investment.

Top 10 countries in clean investments, billion USD
Source: Bloomberg New Energy Finance.

Scale of energy subsidiesEstimated energy subsidies, 2010, USD billion (fossil fuels - USD 409 billion; renewables - USD 66 billion), non-OECD countries
Source: IEA, World Energy Outlook 2011.
Subsidies to fossil fuels Subsidies to renewables

Carbon intensity measured in kilogrammes of CO2 per 2005 USD of GDP
EECCA countries – among the most carbon intensive economies in the world
Source: IEA..

Access to private finance for green investments in EECCA – Objectives of the project

Access to private finance for green investments in EECCA

OECD-Ukraine Co-ordination Council
Agribusiness:Access to Finance
Machinery/Aircraft Manufacturing
Working Group 1 Working Group 3
Civil society and private sector representatives
Relevant ministries and government agencies
Chaired by First Deputy Prime Minister of Ukraine
OECD + donors(including relevant WG members)
The project Sector Competitiveness Strategy for Ukraine was launched in 2009The OECD Eurasia Competitiveness Programme
Energy-efficiency/ Renewable Energy
Working Group 4
Agribusiness:Human Capital
Working Group 2
Facilitate access to finance for SMEs
Improve investment policy and promotion
Strengthen the industry cluster
Ensure appropriate skills provision to the industry
Public-Private dialogue through Working Groups