of crops various phosphate - auburn university
TRANSCRIPT
BULLETIN No. 270
RESPONSE of CROPS toVARIOUS PHOSPHATEFERTILIZERS
ADVAN CEMENT
OF SCIENCE S ZM
AGRICULTURAL EXPERIMENTolie ALABAMA POLYTECHNICM. J. Funchess, Director
STATIONINSTITUTE
Auburn, Alabama
FEBRUARY 1950
FOREWORD
"Response of Crops to Various Phosphate Fertilizers," apresentation of significant results from 88 years of researchinvolving over 1,800 experiments by the Alabama AgriculturalExperiment Station, was prepared by L. E. Ensminger, Asso-ciate Soil Chemist, who since joining the staff in late 1944has been concerned with phosphorus research. In preparingthis report, Dr. Ensminger has compiled the results of manyworkers of this Station.
Summarized are results of phosphorus experiments at theMain Station, Auburn, Alabama, carried on by R. Y. Bailey*,F. E. Bertram, E. F. Cauthen**, J. F. Duggar**, FranklinFudge*, M. J. Funchess, W. H. Pierre*, F. W. Parker*, G. D.Scarseth*, D. G. Sturkie, J. W. Tidmore**, H. B. Tisdale, andG. W. Volk*.
Phosphorus response studies at the Experiment Fields re-ported herein were conducted by H. R. Benford*, F. E.Bertram, C. L. Breedlove*, J. W. Richardson, J. F. Segrest,Jr., J. R. Taylor*, R. W. Taylor*, and J. T. Williamson.
Phosphorus studies at the Substations were done by K. G.Baker, R. C. Christopher*, S. E. Gissendanner, Fred Stewart,
and J. P. Wilson**.Cooperative cotton, peanut, and pasture tests with farmers
were conducted by E. L. Mayton, H. T. Rogers*, J. M. Scholl*,E. H. Stewart*, and J. T. Williamson. - Editor.
* Resigned** Deceased
CONTENTS
Page
DESCRIPTION OF MATERIALS--------------- - 8 ----- 3
RESULTS OF EXPERIMENTS 6--------------------
EXPERIMENTS OF LONG DURATION -- --- ---- 6
EXPERIMENTS OF SHORT DURATION.------------------------- 19RESPONSE OF CLOVER PASTURES TO SOURCES OF PHOS-
PHOROUS ---------------------------------- --------------- 29
DISCUSSION----------------------------------- -------- 34
SUMMARY ----- ------------------------------------------------ 36
LITERATURE CITED --------------------------------------------------------- 389
FIRST PRINTING 5M
RESPONSE of CROPS to VARIOUSPHOSPHATE FERTILIZERSL. E. ENSMINGER, Associate Soil Chemist*
MANY OF THE SOILS of Alabama are low in available phosphor-ous; consequently, phosphate fertilizers must be used to obtainsatisfactory crop yields. Most of these soils were deficient in avail-able phosphorous when first cleared; unless they have been givenlarge applications of an available source of phosphorus duringthe period of cultivation, they have remained deficient in avail-able phosphorus. As will be pointed out later, loss of phosphorusby erosion is one reason why rather large applications of phos-phorus may be required over a period of years to build up anappreciable supply of phosphorus in soils. It should be pointedout in this connection that, since removal of phosphorus by theharvested portion of most crops is small, it should not precludethe possibility of considerable accumulation of applied phos-phorus.
The importance of phosphorus in Alabama agriculture is shownby the volume of consumption. During the 1945-46 crop year,Alabama farmers spent approximately 11.5 million dollars forphosphorus in mixed fertilizers and as separate material. TheState ranked third in the United States in consumption of phos-phate fertilizers during that crop year, with a total of 91,6380tons of P2 0 5 being applied. The trend has been upward, asshown by an annual average of 55,306 tons of P205 used duringthe period 1935-44 (6).
DESCRIPTION of MATERIALS
There are several kinds of phosphate materials available fordistribution and there are others that may be placed on themarket if found satisfactory as sources of phosphorus for plantgrowth. Sources on the market at present include such materialsas raw rock phosphate, treated phosphate (superphosphate),and by-product phosphates. Solubility of these materials varies
* Author-compiler, see FOREWORD.
4 ALABAMA AGRICULTURAL EXPERIMENT STATION
considerably; usually the more soluble the material, the morequickly its phosphorus is released for plant growth. However,the comparative availability of different sources of phosphorusmay depend to a considerable extent on soil conditions and thecrop being grown. The sources of phosphorus used in the experi-ments reported herein are briefly discussed with respect to prep-aration and properties.
Rocx PHOSPHATE. Rock phosphate occurs in natural depositsthroughout the world. The ones of greatest commercial im-portance in the United States are located in Florida and Ten-nessee in the East, and in an area comprising Idaho, Montana,Utah, and Wyoming in the West. The principal constituent ofthe American phosphate rock is fluorapatite, which may berepresented by the formula CaloF 2 (PO4) 6. Raw rock phosphateis not used extensively for direct application to the soil becauseof its insolubility. To be effective it must be finely ground. Agood grade of rock phosphate will contain about 32 per centtotal P20 5. Only a trace of this is water-soluble.
COLLOIDAL PHOSPHATE. The USDA Yearbook of Agriculture,Soils and Men, 1938 (10), gives the following description of col-loidal phosphate: "'Colloidal phosphate' is a trade name appliedto finely divided, comparatively low-grade rock phosphate orphosphatic clay. It is also designated 'waste pond phosphate'for the reason that in the hydraulic operation involved in miningrock phosphate in Florida a considerable quantity of fine phos-phatic material, virtually colloidal from a mechanical standpoint,is washed into ponds and settles out. When removed, followingdrainage and evaporation of water, it contains a relatively highproportion of clay, so that the Colloidal phosphate usually con-tains only from 18 to 23 per cent of phosphoric acid. On accountof the presence of so much foreign material, principally clay,Colloidal phosphate is considered to be unsatisfactory for treat-ment with sulfuric acid. The claim is made for this materialand others of a similar nature that not only is the phosphoricacid more quickly available than that of mechanical groundrock phosphate, but also that the content of minor elements inColloidal phosphate makes it superior to its close relative, rockphosphate. These claims, while highly interesting, have failedof substantiation in a number of states, particularly so when acomparison of such materials with superphosphate is taken intoconsideration." According to the above discussion, colloidal phos-
CROP RESPONSE to VARIOUS PHOSPHATE FERTILIZERS 5
phate may be considered as rock phosphate diluted with col-loidal material.
SUPERPHOSPHATE. Superphosphate (16 to 20 per cent avail-able P2 0 5 ) is made by treating ground rock phosphate withsulfuric acid in about equal proportions by weight. In this processall of the sulfuric acid is consumed. This results in a mixtureof more soluble phosphates and calcium sulfate (gypsum). Or-dinary superphosphate usually contains 18 to 20 per cent avail-able P20 5. Its P20 5 content depends largely on the grade ofrock phosphate used. Practically all of the phosphorus in super-phosphate is water-soluble. It is used as a source of phosphorusin mixed fertilizers as well as for direct application, and itranks first among phosphatic materials in quantity consumedfor fertilizer use.
TRIPLE SUPERPHOSPHATE. Triple superphosphate is made bytreating rock phosphate with phosphoric acid instead of sul-furic acid. This results in a product higher in P20 5 than ordinarysuperphosphate. Triple superphosphate usually contains 42 to52 per cent P205 and it may contain up to 10 per cent gypsum,depending upon method of manufacture. It is largely mono-calcium phosphate, and most of the phosphorus is water-soluble.It should be pointed out here that the TVA triple superphosphateused in the experiments reported herein did not contain anyappreciable amount of gypsum.
AMMO-PHOS A. Ammo-phos A is a trade name used to desig-nate a grade of mono-ammonium phosphate used as a fertilizermaterial. It contains about 11 per cent N and 45 to 48 per centP205. It is produced by partially neutralizing phosphoric acidwith ammonia.
DI-AMMONIUM PHOSPHATE. Di-ammonium phosphate is madeby adding ammonia in the proper proportion to a solution ofmono-ammonium phosphate. The di-ammonium phosphate, be-ing less soluble, separates as crystals. It contains about 21 percent N and 53 per cent P2 05s.
FUSED TRICALCIUM PHOSPHATE. Fused tricalcium phosphateis made by heating rock phosphate to the fusion point in thepresence of water vapor and silica. This causes most of thefluorine to volatilize, resulting in the formation of a tricalciumphosphate containing about 80 per cent P20 5, most of whichis soluble in ammonium citrate.
6 ALABAMA AGRICULTURAL EXPERIMENT STATION
PRECIPITATED TRICALCIUM PHOSPHATE. Tricalcium phosphatemay be formed by ammoniation of mono-calcium phosphate. Itcontains approximately 42 per cent total P20 5.
CALCIUM METAPHOSPHATE. Calcium metaphosphate is pro-duced by bringing hot gaseous phosphorus in contact with phos-phate rock at high temperature. After the mass melts, it iswithdrawn from the furnace and allowed to cool. When groundit is ready for use as a fertilizer. It contains 62 per cent avail-able P205 (soluble in ammonium citrate solution).
POTASSIUM METAPHOSPHATE. It is the potassium salt of meta-phosphoric acid and contains about 60 per cent P20 5 and 40per cent K20.
BASIC SLAG. Basic slag is produced as a by-product of the steelindustry. Phosphorus occurs in some iron ores, and steel madefrom them is brittle unless the phosphorus is largely removed.In removing the phosphorus and other impurities, a blast of airis blown through the molten iron in a converter containing lime.The phosphorus oxidizes and unites with the lime. The resultingmass is lighter than iron and thus rises to the surface where itis drawn off, cooled, and ground to a certain fineness. Basicslag usually contains 8 to 10 per cent total P20 5, most of whichis soluble in citric acid. Basic slag should not be confused withblast furnace slag which is calcium silicate.
RESULTS of EXPERIMENTS
The importance of phosphorus in Alabama agriculture wasrecognized years ago. Some of the experimental work reportedin this bulletin was started as early as 1911.
Experiments of short and of long duration were conductedin order to test the immediate relative efficiencies of varioussources of phosphorus, as well as relative efficiencies involvingcumulative effects. Since the relative efficiency of sources maydepend on conditions, a number of crops were tested at a largenumber of locations in the State. For convenience in discussingthe results, the work reported herein is divided into experimentsof long duration and of short duration dealing with crops otherthan pastures, and experiments with permanent pastures.
EXPERIMENTS OF LONG DURATION
STUDY OF SOURCES OF PHOSPHOROUS IN A ROTATION OF CORN AND
COTTON WITH WINTER LEGUMES. In 1930 a sources-of-phosphorusstudy was started at the Tennessee Valley, Sand Mountain and
CROP RESPONSE to VARIOUS PHOSPHATE FERTILIZERS 7
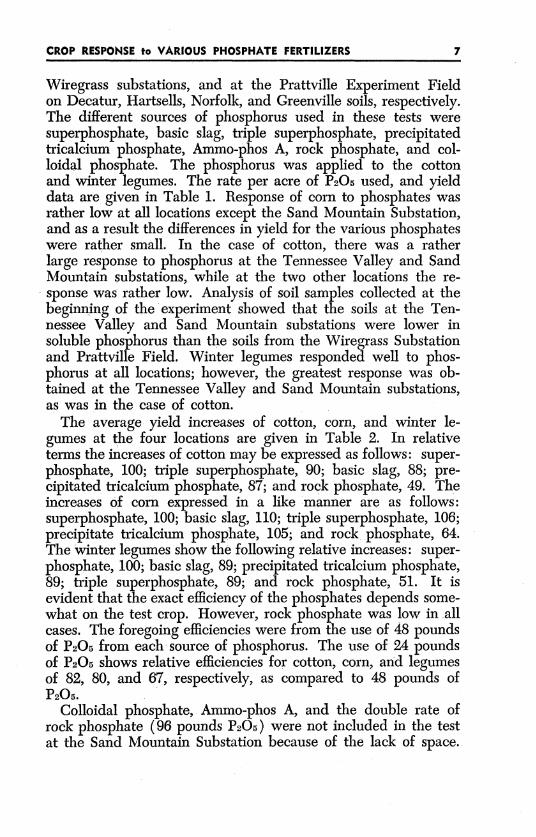
Wiregrass substations, and at the Prattville Experiment Fieldon Decatur, Hartsells, Norfolk, and Greenville soils, respectively.The different sources of phosphorus used in these tests weresuperphosphate, basic slag, triple superphosphate, precipitatedtricalcium phosphate, Ammo-phos A, rock phosphate, and col-loidal phosphate. The phosphorus was applied to the cottonand winter legumes. The rate per acre of P20 5 used, and yielddata are given in Table 1. Response of corn to phosphates wasrather low at all locations except the Sand Mountain Substation,and as a result the differences in yield for the various phosphateswere rather small. In the case of cotton, there was a ratherlarge response to phosphorus at the Tennessee Valley and SandMountain substations, while at the two other locations the re-sponse was rather low. Analysis of soil samples collected at thebeginning of the experiment showed that the soils at the Ten-nessee Valley and Sand Mountain substations were lower insoluble phosphorus than the soils from the Wiregrass Substationand Prattville Field. Winter legumes responded well to phos-phorus at all locations; however, the greatest response was ob-tained at the Tennessee Valley and Sand Mountain substations,as was in the case of cotton.
The average yield increases of cotton, corn, and winter le-gumes at the four locations are given in Table 2. In relativeterms the increases of cotton may be expressed as follows: super-phosphate, 100; triple superphosphate, 90; basic slag, 88; pre-cipitated tricalcium phosphate, 87; and rock phosphate, 49. Theincreases of corn expressed in a like manner are as follows:superphosphate, 100; basic slag, 110; triple superphosphate, 106;precipitate tricalcium phosphate, 105; and rock phosphate, 64.The winter legumes show the following relative increases: super-phosphate, 100; basic slag, 89; precipitated tricalcium phosphate,89; triple superphosphate, 89; and rock phosphate, 51. It isevident that the exact efficiency of the phosphates depends some-what on the test crop. However, rock phosphate was low in allcases. The foregoing efficiencies were from the use of 48 poundsof P20 5 from each source of phosphorus. The use of 24 poundsof P20 5 shows relative efficiencies for cotton, corn, and legumesof 82, 80, and 67, respectively, as compared to 48 pounds ofP20 5.
Colloidal phosphate, Ammo-phos A, and the double rate ofrock phosphate (96 pounds P20 5 ) were not included in the testat the Sand Mountain Substation because of the lack of space.
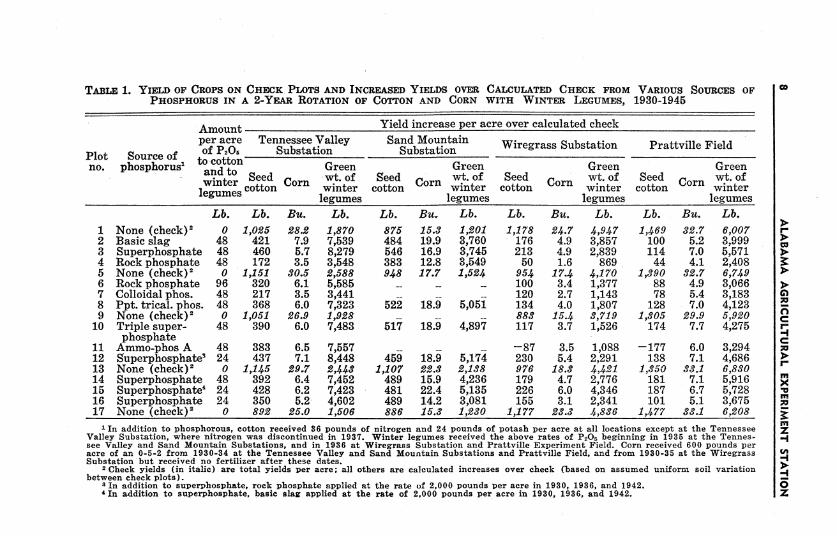
TABLE 1. YIELD OF CROPS ON CHECK PLOTS AND INCREASED YIELDS OVER CALCULATED CHECK FROM VARIOUS SOURCES OFPHOSPHORUS IN A 2-YEAR ROTATION OF COTTON AND CORN WITH WINTER LEGUMES, 1930-1945
Amount Yield increase per acre over calculated checkper acre Tennessee Valley Sand Mountain Wiregrass Substation Prattville Field
Plot Source of of P 20 5 Substation Substation
no. phosphorus to cotton Green Green Green Greenno. phsphrus iand to Seed Corn wt. of Seed Corn wt. of Seed Corn wt. of Seed Corn wt. of
legumes cotton winter cotton winter cotton winter cotton winterlegumes legumes legumes legumes
Lb. Lb. Bu. Lb. Lb. Bu. Lb. Lb. Bu. Lb. Lb. Bu. Lb.
1 None (check) 2 0 1,025 28.2 1,870 875 15.3 1,201 1,178 24.7 4,947 1,469 32.7 6,007 r2 Basic slag 48 421 7.9 7,539 484 19.9 3,760 176 4.9 3,857 100 5.2 3,9993 Superphosphate 48 460 5.7 8,279 546 16.9 3,745 213 4.9 2,839 114 7.0 5,571 >4 Rock phosphate 48 172 3.5 3,548 383 1.2.8 3,549 50 1.6 869 44 4.1 2,408 E5 None (check) 2 0 1,151 30.5 2,588 948 17.7 1,524 954 17.4 4,170 1,390 32.7 6,7496 Rock phosphate 96 320 6.1 5,585 - - 100 3.4 1,377 88 4.9 3,0667 Colloidal phos. 48 217 3.5 3,441 120 2.7 1,143 78 5.4 3,183 G8 Ppt. trical. phos. 48 368 6.0 7,323 522 18.9 5,051 134 4.0 1,807 128 7.0 4,1239 None (check)2 0 1,051 26.9 1,928 . 883 15.4 3,719 1,305 29.9 5,920 c
10 Triple super- 48 390 6.0 7,483 517 18.9 4,897 117 3.7 1,526 174 7.7 4,275 rphosphate
11 Ammo-phos A 48 383 6.5 7,557 -87 3.5 1,088 -177 6.0 3,294 o12 Superphosphate2 24 437 7.1 8,448 459 18.9 5,174 230 5.4 2,291 138 7.1 4,686 r13 None (check) '2 0 1,145 29.7 2,443 1,107 22.3 2,138 976 18.3 4,421 1,350 33.1 6,83014 Superphosphate 48 392 6.4 7,452 489 15.9 4,236 179 4.7 2,776 181 7.1 5,916 x15 Superphosphate4 24 428 6.2 7,423 481 22.4 5,135 226 6.0 4,346 187 6.7 5,728 -o16 Superphosphate 24 350 5.2 4,602 489 14.2 3,081 155 3.1 2,341 101 5.1 3,675 m17 None (check) 2 0 892 25.0 1,506 886 15.3 1,230 1,177 23.3 4,836 1,477 33.1 6,208
1 In addition to phosphorous, cotton received 36 pounds of nitrogen and 24 pounds of potash per acre at all locations except at the Tennessee ZValley Substation, where nitrogen was discontinued in 1937. Winter legumes received the above rates of P2 0 5 beginning in 1935 at the Tennes- ...see Valley and Sand Mountain Substations, and in 1936 at Wiregrass Substation and Prattville Experiment Field. Corn received 600 pounds peracre of an 0-5-2 from 1930-34 at the Tennessee Valley and Sand Mountain Substations and Prattville Field, and from 1930-35 at the WiregrassSubstation but received no fertilizer after these dates. 42 Check yields (in italic) are total yields per acre; all others are calculated increases over check (based on assumed uniform soil variation >between check plots).-4
In addition to superphosphate, rock phosphate applied at the rate of 2,000 pounds per acre in 1930, 1936, and 1942. O0In addition to superphosphate, basic slag applied at the rate of 2,000 pounds per acre in 1930, 1936, and 1942. Z
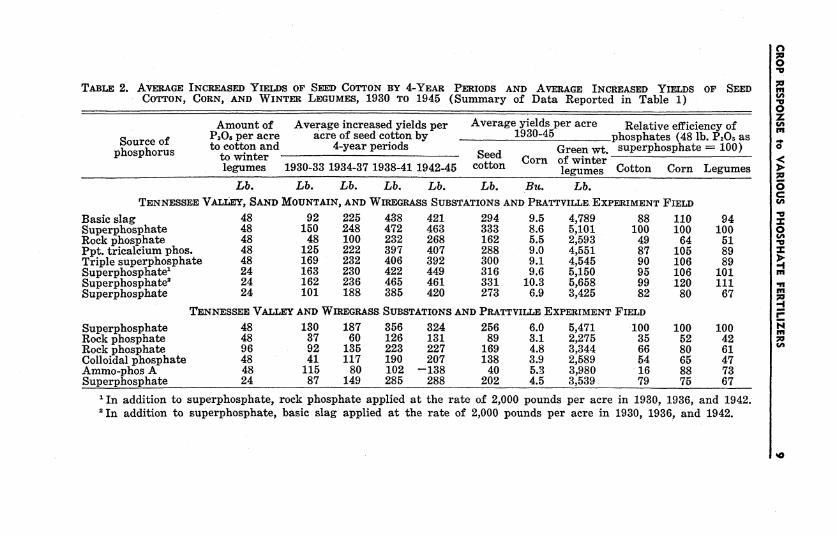
TABLE 2. AVERAGE INCREASED YIELSS OF SEED COTTON BY 4-YEAR PERIODS AND AVERAGE INCREASED YIELDS OF SEEDCOTTON, CORN, AND WINTER LEGUMES, 1930 TO 1945 (Summary of Data Reported in Table 1)
Amount of Average increased yields per Average yields per acre Relative efficiency ofSource of P 205 per acre acre of seed cotton by 1930-45 phosphates (48 lb. P205 as
phosphorus t ttownternd_ 4-year___periods__SeedGreen wt. superphosphate =100)ctontad4-ereeiosSed Corn of winterlegumes 1930-33 1934-37 1938-41 1942-45 cotton legumes Cotton Corn Legumes
Basic slagSuperphosRock phos;Ppt. tricalTriple supSuperphosSuperphosSuperphos
Lb. Lb. Lb. Lb. Lb. Lb. Bu. Lb.TENNESSEE VALLEY, SAND MOUNTAIN, AND WIREGRASS SUBSTATIONS AND PRATTYILLE. EXPERIMENT FIELD
48 92 225 438 421 294 9.5 4,789 88 110 943phate 48 150 248 472 463 333 8.6 5,101 100 100 100phate 48 48 100 232 268 162 5.5 2,593 49 64 51cium phos. 48 125 222 397 407 288 9.0 4,551 87 105 89erphosphate 48 169 232 406 392 300 9.1 4,545 90 106 893phate1 24 163 230 422 449 316 9.6 5,150 95 106 101,phate' 24 162 236 465 461 331 10.3 5,658 99 120 1113phate 24 101 188 385 420 273 6.9 3,425 82 80 67
SuperphosphateRock phosphateRock phosphateColloidal phosphateAmmo-phos ASuperphosphate
TENNESSEE VALLEY AND WIREGRASS SUBSTATIONS AND PRATTYILLE EXPERIMENT FIELD48 130 187 356 324 256 6.0 5,471 -10048 37 60 126 131 89 3.1 2,275 3596 92 135 223 227 169 4.8 3,344 6648 41 117 190 207 138 3.9 2,589 5448 115 80 102 -138 40 5.3 3,980 1624 87 149 285 288 202 4.5 3,539 79
100 100S 52 42
S 80 6165 47
3 88 7375 67
SIn addition to superphosphate, rock phosphate applied at the rate of 2,000 pounds per acre in 1930, 1936, and 1942.zIn addition to superphosphate, basic slag applied at the rate of 2,000 pounds per acre in 1930, 1936, and 1942.
0
0z-r.0
0CN'
00'O
a~mf
m1mIM~
N
ALABAMA AGRICULTURAL EXPERIMENT STATION
As reported in Table 2, these phosphates show the followingrelative efficiencies for cotton at the three locations: super-phosphate, 100; colloidal phosphate, 54; double rate of rock phos-phate, 66; rock phosphate, 35; and Ammo-phos A, 16. For cornthe relative increases are in the following order: superphosphate,100; Ammo-phos A, 88; double rate of rock phosphate, 80; col-loidal phosphate, 65; rock phosphate, 52. The order of effciencyfor winter legumes is the same as for corn. The double rate ofrock phosphate, which is about equivalent in cost to 48 poundsof P20 5 from superphosphate, did not give as large an increase inyields as superphosphate. Colloidal phosphate produced greateryields than the same amount of P20 5 in the form of rock phos-phate. However, colloidal phosphate did not give as large in-creases in yields as 24 pounds of P20 5 from superphosphate,which would be about equivalent in cost to the colloidal phos-phate.
It has been suggested that the relative efficiency of the in-soluble phosphates may increase with successive applications.Increased yields of seed cotton from 1930 to 1945 by 4-yearperiods are reported in Table 2. These data show that there isa tendency for the relative efficiency of the insoluble phosphatesto increase with time. However, with time the actual increases inyield show a wider spread between superphosphate and the in-soluble phosphates. Studies in Alabama (5, 9, 11) have shownthat considerable added phosphorus may be lost by erosion.Such loss of phosphorus would tend to prevent a cumulativeeffect of added phosphates.
Certain plots received 24 pounds of P20 5 as superphosphateplus periodic applications of rock phosphate or basic slag. Asindicated by data in Table 2, the addition of 2,000 pounds ofrock phosphate or basic slag every 6 years increased the yieldsof cotton, corn, and winter legumes appreciably. The additionof basic slag gave somewhat higher yields than did the additionof rock phosphate.
STUDY OF SOURCES OF PHOSPHORUS IN A ROTATION OF CORN AND
COTrTON WITHOUT WINTER LEGUMES. A source-of-phosphorustest was started in 1930 at the Tennessee Valley, Sand Mountainand Wiregrass substations, and at the Monroeville and Alexandriaexperiment fields using corn and cotton in rotation as test crops.The sources of phosphorus (superphosphate, basic slag, triplesuperphosphate, precipitated tricalcium phosphate, Ammo-phos
10
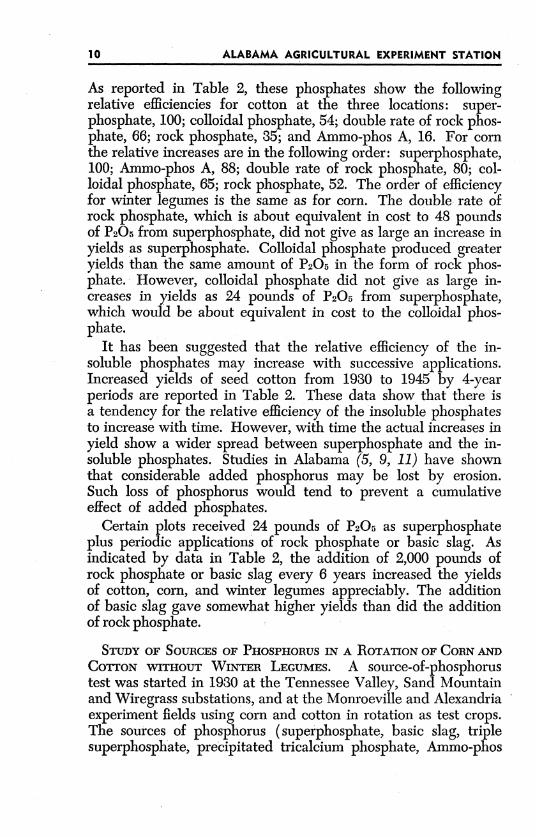
TABLE 3. INCREASED YIELDS FROM VARIOUS SOURCES OF PHOSPHORUS OVER CALCULATED CHECK PLOT YIELDS IN A 2-YEARROTATION OF COTTON AND CORN, 1930-45
Amount Yield increase per acre over calculated check 2
Plot Source of of PO,2 Tenn. Valley Sand Mountain Wiregrass Monroeville AlexandriaPlot Sourceuofs per Substation Substation Substation Field Field
acre to Seed Corn Seed Corn Seed Corn Seed Corn Seed Corncottoncotton cotton cotton cotton cotton
Lb. Lb. Bu. Lb. Bu. Lb. Bu. Lb. Bu. Lb. Bu.
1 None (check) 2 0 828 81.9 831 28.1 1,141 22.9 858 31.2 732 31.42 Basic slag 48 387 7.1 452 9.1 115 2.3 227 2.1 343 2.53 Superphosphate 48 455 7.0 485 7.9 123 1.8 320 2.0 441 3.24 Rock phosphate 48 204 2.1 390 7.7 23 1.8 148 0.9 215 2.95 None (check) 2 0 973 31.5 779 27.6 1,104 21.5 867 29.0 863 36.56 Rock phosphate 96 328 4.8 . -- 73 1.8 170 2.2 407 3.07 Colloidal phosphate 48 233 3.2 110 1.9 136 1.68 Ppt. tricalcium phos. 48 382 5.4 494 8.4 136 3.5 221 1.89 None (check) 2 0 861 30.1 1,079 23.1 872 29.5
10 Triple superphosphate 48 399 4.7 563 8.8 142 1.4 189 1.611 Ammo-phos A 48 340 3.0 . -217 -2.4 -6 1.5 329 1.712 Superphosphate' 24 433 4.9 567 9.3 146 -1.9 288 1.0 440 2.613 None (check) 2 0 978 32.3 724 25.7 1,139 22.9 906 29.7 835 35.014 Superphosphate 48 426 4.4 528 9.3 147 0.4 330 1.1 404 2.115 Superphosphate' 24 458 5.7 575 12.3 160 2.4 305 0.8 387 2.816 Superphosphate 24 378 5.0 500 7.9 88 0.7 291 2.3 328 2.117 None (check) 2 0 805 28.3 698 25.2 1,155 24.0 789 29.8 678 30.0
SCotton received 600 pounds per acre of 6-10-4 from 1930 to 1934, inclusive, and 600 pounds of 6-8-4 thereafter at alllocations except at the Wiregrass Substation where the fertilizer was changed to a 6-8-4 in 1936. Corn received 600pounds per acre of 6-5-2 from 1930 to 1934 and 36 pounds of nitrogen only thereafter at all locations except at theWiregrass Substation where the fertilizer was changed to 36 pounds of nitrogen only in 1936.
2 Check yields (in italic) are total yields per acre; all others are calculated increases over check (based on assumeduniform soil variation between check plots).
2 In addition to superphosphate, rock phosphate applied at the rate of 2,000 pounds per acre in 1930, 1936, and 1942.'In addition to superphosphate, basic slag applied at the rate of 2,000 pounds per acre in 1930, 1936, and 1942.
AOo
0m
O
Z
in
0z7v
m
CH'O
*wz0
fl
z
-r-4mm
N
In
_mr_
A, rock phosphate, and colloidal phosphate) were the same asthose used in the study previously discussed.
Yield data for each of the five locations are presented in Table3. The response of cotton to phosphorus was rather large at alllocations except at the Wiregrass Substation. In most cases corngave little response to phosphorus and as a result is not a verysatisfactory crop to use in evaluating sources of phosphorus.
Since each source of phosphorus was not tested at every loca-tion, Table 4 has been divided into two sections so that com-parisons may be made between phosphates tested at the sameplaces. The relative efficiencies of materials tested at five locationsare as follows for cotton: superphosphate, 100; basic slag, 83;and rock phosphate, 58. A half rate of superphosphate (24pounds P20 5) gave 87 per cent as large an increase in yieldas 48 pounds of P205 from the same source. The use of a tonof rock phosphate or basic slag every 6 years in addition to thehalf rate of superphosphate increased the yield of seed cottonby 56 and 58 pounds, respectively. The relative efficiencies ofsources tested at the Tennessee Valley and Wiregrass substationsand at the Monroeville Field are: superphosphate, 100; doublerate of rock phosphate, 61; colloidal phosphate, 51; rock phos-phate, 40; and Ammo-phos A, 22. The double rate of rockphosphate did not increase the yield of cotton as much as super-phosphate. Colloidal phosphate (48 pounds P20 5) did not pro-duce as large an increase in yield as superphosphate applied atthe rate of 24 pounds of P20 5 per acre. According to these data,the insoluble phosphates did not increase the yield of cottonas much as superphosphate when applied on an approximatelyequal cost basis.
The cotton yields by 4-year periods are given in Table 4. Aswas the case for the rotation with legumes, the efficiency ofthe insoluble phosphates tends to increase with time. The actualspread between superphosphate and the insoluble phosphates,however, becomes larger with time.
LIME PHOSPHATE EXPERIMENT. In 1922 an experiment wasstarted to test the value of basic slag, superphosphate, and tworates of rock phosphate with and without lime. This experimentwas conducted at Atmore, Prattville, Cusseta, Sylacauga, andHackleburg on Greenville, Red Bay, Cecil, Decatur, and Atwoodsoils, respectively. The phosphates were applied at the rate of600 pounds per acre with a second rate of rock phosphate ap-
12 ALABAMA AGRICULTURAL EXPERIMENT STATION

TABLE 4. AVERAGE INCREASED YIELs OF SEED COTTON BY 4-YEAR PERIODS AND AVERAGE INCREASED YIELDS OF SEEDCOTTON AND CoRN, 1930-45 (Summary of Data Reported in Table 3)
Source of P205 per Average increased yield per acre of Average yields per Relative efficiency
acre applied seed cotton by 4-year periods acre, 1930-45 (48 lb. P205 as super-phosphorus acreapplied phosphate = 100)
to cotton 1930-33 1934-37 1938-41 1942-45 Seed cotton Corn Cotton Corn
Lb. Lb. Lb. Lb. Lb. Lb. Bu.
TENNESSEE VALLEY, SAND MOUNTAIN AND WIREGRASS SUBSTATIONS AND MONROEVILLE AND ALEXANDRIA EXPERIMENT FIELDS
Basic slag 48 118 233 397 465 303 4.6 83 102Superphosphate 48 210 293 454 504 365 4.5 100 100Rock phosphate 48 97 159 235 352 211 3.1 58 69Superphosphate1 24 232 295 462 504 373 4.0 102 89Superphosphate2 24 220 276 489 517 375 4.8 103 107Superphosphate 24 162 230 407 468 317 3.6 87 80
TENNESSEE VALLEY AND WIREGRASS SUBSTATIONS AND MONROEVILLE EXPERIMENT FIELD
Superphosphate 48 259 251 367 352 307 3.6 100 100Rock phosphate 48 88 77 138 190 123 1.6 40 44Rock phosphate 96 135 157 206 253 188 2.9 61 81Colloidal phosphate 48 76 118 188 245 157 2.2 51 61Ammo-phos A 48 123 77 163 -162 67 1.0 22 28Superphosphate 24 161 170 324 355 252 2.7 82 75
1In addition to superphosphate, rock phosphate applied at the rate of 2,000 pounds per acre in 1930, 1936, and 1942.2In addition to superphosphate, basic slag applied at the rate of 2,000 pounds per acre in 1930, 1936, and 1942.
n0
m
0zm
0c
0
in
in
N
nm
(a)

TABLE 5. RESPONSE' OF CROPS TO PHOSPHATE WITH AND WITHOUT LIME AT ATMORE, PRATTVILLE, CUSSETA, SYLACAUGA,AND HACKLEBURG, 1923-30
Lime Weighted yield averages per acre of Increases in yield per acreSur fper acre P locations from 1923-303 due to phosphorus
Sorce of per acre
phosphorus1 applied per acre Sphosphorus' in fall applied Cotton, Oats, Semier C Summer1922 annually2 23 years 13 years 2 umes, 26 or Cotton Oats20years yerleu sLb. Lb. Lb. Bu. Lb. Bu. Lb. Bu. Lb. Bu.
None 0 0 584 27.2 4,166 14.6Basic slag 0 96 829 35.6 5,254 19.4 245 8.4 1,088 4.8Superphosphate 0 96 880 33.2 4,454 18.0 296 6.0 288 3.6Rock phosphate 0 192 736 30.5 4,160 15.7 152 3.3 -4 1.1Rock phosphate 0 768 774 31.6 4,279 19.1 190 4.4 113 4.5None 4000 0 654 26.6 5,261 19.6 - -
Basic slag 4000 96 879 33.7 6,402 20.2 225 7.1 1,141 0.6Superphosphate 4000 96 914 35.7 6,524 20.4 260 9.1 1,263 0.8Rock phosphate 4000 192 763 81.4 5,806 18.9 109 4.8 545 -0.7Rock phosphate 4000 768 777 29.4 6,036 18.0 123 2.8 775 -1.6
1 Each plot received 200 pounds of sodium nitrate ('/ 2N to oats and 1 2N in drill to cotton) and 100 pounds ofmuriate of :potash (%/ to winter legume preceding cotton and %/ in drill to cotton).
2 Two-thirds of phosphorus to winter legume preceding cotton and %/ in drill to cotton.'Weighted averages based on number of crops harvested; experiment did not run the full time at all locations.
orf
)IfI-
AC
C
r-
m
L..v
m
z
0
i.z

CROP RESPONSE to VARIOUS PHOSPHATE FERTILIZERS
plied at 2,400 pounds per acre. Yields and treatments for thisexperiment are reported in Table 5. The increased yields ofcotton were in the following decreasing order for the phosphateswith and without lime: superphosphate, basic slag, high rateof rock phosphate, and rock phosphate. For oats the positionsof superphosphate and basic slag were reversed. In the caseof summer legumes without lime, basic slag gave the best re-sults, while with lime superphosphate resulted in slightly higheryields than those from slag. Differences between treatmentsfor corn were small, especially for the limed plots.
At these five locations an exceptionally high rate of rock phos-phate failed to produce as much cotton as 600 pounds of su-perphosphate. Slag also gave somewhat lower yields than super-phosphate.
ROCK PHOSPHATE Vs. SUPERPHOSPHATE, AUBURN. An experi-ment designed to evaluate superphosphate and rock phosphatefor production of cotton was located on a Chesterfield soil. Theexperiment was begun in 1920 and was continued through 1931.The phosphates were applied annually at the rate of 320 poundsper acre, which means that twice as much P20 5 in the form ofrock phosphate was used as was applied in the form of super-phosphate. Results of the experiment are presented in Table 6.
TABLE 6. RESPONSE OF COTTON TO ROCK PHOSPHATE AND SUPERPHOSPHATE,MAIN STATION, 1920-31
Source of Phosphate Average yield Increase per Relativephosphorus applied per acre of seed acre due to efficiency
pper acre cotton 1920-31 phosphorus
Lb. Lb. Lb.
None 0 597Superphosphate 320 894 297 100Rock phosphate 320 851 254 85
1 In addition to phosphate each plot received 160 pounds per acre ofkainit containing 12.5 per cent K2O and 100 pounds per acre of sodiumnitrate from 1920-23, inclusive, and 160 pounds per acre thereafter.
Superphosphate resulted in an average increase of 297 poundsper acre of seed cotton as compared to a 254-pound averageincrease from rock phosphate. Thus, rock phosphate had a rela-tive efficiency of 85 in the 12-year experiment.
FERTILIZER ROTATION EXPERIMENT. Fertilizer rotation experi-ments, started in 1916, were located on a Hartsells soil nearAlbertville and on a Greenville soil near Jackson. Yield data
15
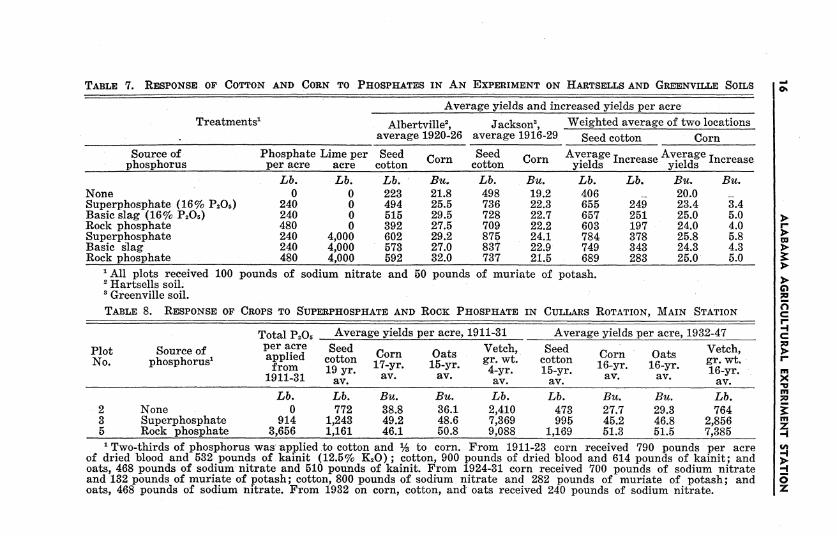
TABLE 7. RESPONSE OF COTTON AND CORN TO PHOSPHATES IN AN EXPERIMENT ON HARTSELLS AND GREENVILLE SOILS
Average yields and increased yields per acre
Treatments' Albertville', Jackson3 , Weighted average of two locationsaverage 1920-26 average 1916-29 Seed cotton Corn
Source of Phosphate Lime per Seed Corn Seed Corn Average Increase Average Increasephosphorus per acre acre cotton cotton yields yields
Lb. Lb. Lb. Bu. Lb. Bu. Lb. Lb. Bu. Bu.None 0 0 223 21.8 498 19.2 406 20.0Superphosphate (16% P2 0 5 ) 240 0 494 25.5 736 22.3 655 249 23.4 3.4Basic slag (16% P0Os) 240 0 515 29.5 728 22.7 657 251 25.0 5.0Rock phosphate 480 0 392 27.5 709 22.2 603 197 24.0 4.0Superphosphate 240 4,000 602 29.2 875 24.1 784 378 25.8 5.8Basic slag 240 4,000 573 27.0 837 22.9 749 343 24.3 4.3Rock phosphate 480 4,000 592 32.0 737 21.5 689 283 25.0 5.0
'All plots received 100 pounds of sodium nitrate and 50 pounds of muriate of potash.2 Hartsells soil.* Greenville soil.
TABLE 8. RESPONSE OF CROPS TO SUPERPHOSPHATE AND ROCK PHOSPHATE IN CULLARS ROTATION, MAIN STATION
Total P20 5 Average yields per acre, 1911-31 Average yields per acre, 1932-47
Plot Source of per acre Seed Corn Oats Vetch, Seed Corn Oats Vetch,19 17-yr. 15-yr. 4-yr. 15-yr. 16-yr. 16-yr.
1911-31 av. av. av. av. av. av. av. av.
Lb. Lb. Bu. Bu. Lb. Lb. Bu. Bu. Lb.2 None 0 772 38.8 36.1 2,410 473 27.7 29.3 7643 Superphosphate 914 1,243 49.2 48.6 7,369 995 45.2 46.8 2,8565 Rock phosphate 3,656 1,161 46.1 50.8 9,088 1,169 51.3 51.5 7,385
'Two-thirds of phosphorus was applied to cotton and % to corn. From 1911-23 corn received 790 pounds per acreof dried blood and 532 pounds of kainit (12.5% K 20); cotton, 900 pounds of dried blood and 614 pounds of kainit; andoats, 468 pounds of sodium nitrate and 510 pounds of kainit. From 1924-31 corn received 700 pounds of sodium nitrateand 132 pounds of muriate of potash; cotton, 800 pounds of sodium nitrate and 282 pounds of muriate of potash; andoats, 468 pounds of sodium nitrate. From 1932 on corn, cotton, and oats received 240 pounds of sodium nitrate.
0%
I-
w
0
]>
W
C
I-
c
*"n
c
F
-4
c
mxmm
z-I
-z
I
z
CROP RESPONSE to VARIOUS PHOSPHATE FERTILIZERS
from the Albertville test for the first 4 years were lost by fire.According to the data in Table 7, the average cotton yields forthe two areas show that 240 pounds per acre of slag (16 percent P20 5) produced as much cotton as 240 pounds of super-phosphate on the unlimed plots. However, on the limed plotssuperphosphate was superior to basic slag. An application of 480pounds of rock phosphate (four times as much P20s) did notincrease the yield of cotton as much as superphosphate on eitherthe limed or unlimed plots. There was little response of cornto phosphorus; consequently, differences in yields due to sourceswere small.
ROCK PHOSPHATE Vs. SUPERPHOSPHATE, CULLARS ROTATION.
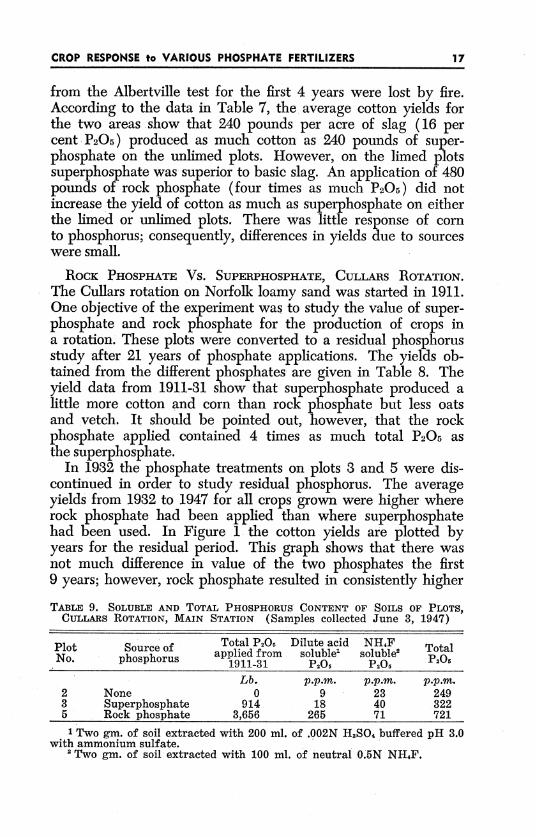
The Cullars rotation on Norfolk loamy sand was started in 1911.One objective of the experiment was to study the value of super-phosphate and rock phosphate for the production of crops ina rotation. These plots were converted to a residual phosphorusstudy after 21 years of phosphate applications. The yields ob-tained from the different phosphates are given in Table 8. Theyield data from 1911-31 show that superphosphate produced alittle more cotton and corn than rock phosphate but less oatsand vetch. It should be pointed out, however, that the rockphosphate applied contained 4 times as much total P20 5 asthe superphosphate.
In 1932 the phosphate treatments on plots 3 and 5 were dis-continued in order to study residual phosphorus. The averageyields from 1932 to 1947 for all crops grown were higher whererock phosphate had been applied than where superphosphatehad been used. In Figure 1 the cotton yields are plotted byyears for the residual period. This graph shows that there wasnot much difference in value of the two phosphates the first9 years; however, rock phosphate resulted in consistently higher
TABLE 9. SOLUBLE AND TOTAL PHOSPHORUS CONTENT OF SOILS OF PLOTS,CULLARS ROTATION, MAIN STATION (Samples collected June 3, 1947)
Plot Source of Total P205 Dilute acid NH4F Total
No. phosphorus applied from soluble soluble2
1911-31 P2 0 5 P20 5 P205
Lb. p.p.m. p.p.m. p.p.m.2 None 0 9 23 2493 Superphosphate 914 18 40 3225 Rock phosphate 3,656 265 71 721
1 Two gin. of soil extracted with 200 ml. of .002N H2 SO4 buffered pH 3.0with ammonium sulfate.
2 Two gmi. of soil extracted with 100 ml. of neutral 0.5N NH4 F.
17

yields than superphosphate the last 7 years. The total and solublephosphorus contents of samples taken in June, 1947, are givenin Table 9. It is evident from these data that the high rate ofrock phosphate caused a greater accumulation of total phosphorusas well as soluble phosphorus than superphosphate. The super-phosphate plot contained little more total or soluble phosphorus
Lb. per acre of seed2000 F
FIGURE 1. The effect of residual phosphate on the yield of cotton grown inCullars rotation at Auburn. The superphosphate plots received a total of 914pounds per acre of PsO5 from 1911 to 1931. The rock phosphate plots received atotal of 3,656 pounds per acre of P20 5 during the same period.
ALABAMA AGRICULTURAL EXPERIMENT STATION18
CROP RESPONSE to VARIOUS PHOSPHATE FERTILIZERS
than the check plot. The fact that most of the added phosphorushad been removed from the superphosphate plot by crops anderosion helps to explain the lower yields from superphosphatein the later years of the residual study.
EXPERIMENTS OF SHORT DURATION
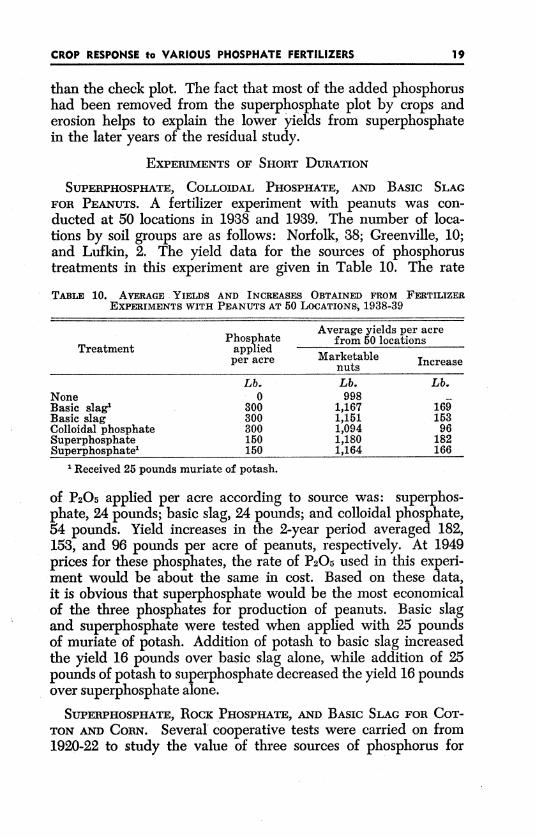
SUPERPHOSPHATE, COLLOIDAL PHOSPHATE, AND BASIC SLAG
FOR PEANUTS. A fertilizer experiment with peanuts was con-ducted at 50 locations in 1988 and 1989. The number of loca-tions by soil groups are as follows: Norfolk, 38; Greenville, 10;and Lufkin, 2. The yield data for the sources of phosphorustreatments in this experiment are given in Table 10. The rate
TABLE 10. AVERAGE YIELDS AND INCREASES OBTAINED FROM FERTILIZEREXPERIMENTS WITH PEANUTS AT 50 LOCATIONS, 1938-39
Average yields per acrePhosphate from 50 locations
Treatment appliedper acre Marketable Increase
Lb. Lb. Lb.None 0 998Basic slag 300 1,167 169Basic slag 300 1,151 153Colloidal phosphate 300 1,094 96Superphosphate 150 1,180 182Superphosphate' 150 1,164 166
1 Received 25 pounds muriate of potash.
of P20 5 applied per acre according to source was: superphos-phate, 24 pounds; basic slag, 24 pounds; and colloidal phosphate,54 pounds. Yield increases in the 2-year period averaged 182,153, and 96 pounds per acre of peanuts, respectively. At 1949prices for these phosphates, the rate of P20 5 used in this experi-ment would be about the same in cost. Based on these data,it is obvious that superphosphate would be the most economicalof the three phosphates for production of peanuts. Basic slagand superphosphate were tested when applied with 25 poundsof muriate of potash. Addition of potash to basic slag increasedthe yield 16 pounds over basic slag alone, while addition of 25pounds of potash to superphosphate decreased the yield 16 poundsover superphosphate alone.
SUPERPHOSPHATE, ROCK PHOSPHATE, AND BASIC SLAG FOR COT-
TON AND CORN. Several cooperative tests were carried on from1920-22 to study the value of three sources of phosphorus for
19

20 ALABAMA AGRICULTURAL EXPERIMENT STATION
TABLE 11. RESPONSE OF COTTON AND CORN TO SOURCES OF PHOSPHORUS,1920-22
Fertilizers1 Cotton yields per Corn yields per acre,___________________________acre, Av.eih Conyldprac,acre, Av. eight Av. three locations
Sources of Phosphate locationsSocspofadded Seedphosphorus per acre cotton Increase Crn Increase
Lb. Lb. Lb. Bu. Bu.
None 0 885 32.5Superphosphate, 16% P2 01 240 1,023 138 29.9 -2.6Basic slag, 16% P2 0 5 240 969 84 33.3 0.8Rock phosphate 480 1,001 116 32.3 -0.2
1All plots received 200 pounds per acre of cottonseed meal and 200pounds of kainit, which contained 12.5 per cent potash.
production of cotton and corn. The data for these tests are givenin Table 11. The average increases in yield of seed cotton forthe phosphates at eight locations were as follows: superphos-phate, 138 pounds; rock phosphate, 116 pounds; and basicslag,84 pounds. The order of response was probably influenced toa considerable extent by the quantity of P20 5 supplied by eachsource. Basic slag, superphosphate, and rock phosphate wereapplied at rates equivalent to 38, 38, and 152 pounds of P20 5per acre, respectively. In these tests superphosphate was superiorto basic slag and rock phosphate, even though the amount ofP205 in the rockphosphate was four times greater than that ofthe superphosphate.
There was no response of corn to phosphorus. This is in linewith data from experiments presented earlier in the report.
SUPERPHOSPHATE Vs. BASIC SLAG FOR COTTON. Since super-phosphate and basic slag are used in large quantities. in theState, they have been tested at a number of locations for pro-duction of cotton. Results obtained from these two materials aregiven in Table 12. Where, superphosphate and basic slag wereused with ammonium sulfate as the source of nitrogen, super-phosphate produced 914 pounds per acre of seed cotton and basicslag 852 pounds. These are averages obtained from 222 ex-periments conducted from 1927 to 1931. The data presentedby soil groups show that in most cases superphosphate wassuperior to basic slag.
Presented. also in Table 12 are data from 106 experimentscomparing superphosphate and basic slag when used with sodiumnitrate as the source of nitrogen. The average yield from super-

TABLE 12. YIELD OF COTTON IN POUNDS PER ACRE FROM SUPERPHOSPHATE AND BASIC SAG
Average yield of seed cotton, pounds per acre, by soil groupsSource of Clarksville Decatur Holston Hartsells Cecil Oktibbeha Greenville Norfolk General
phosphorus' soil soil soil soil soil soil soil soil averagegroup group group group group group group group
COOPERATIVE TESTS, 1927-31
10 expt. 32 expt. 21 expt. 36 expt. 17 expt. 15 expt. 34 expt. 57 expt. 222 expt.Superphosphate' 932 804 999 1,036 892 791 936 891 914Basic Slag2 787 739 970 926 800 796 872 855 852
COOPERATIVE TESTS, 1926-30
7 expt. 19 expt. 8 expt. 18 expt. 3 expt. 9 expt. 19 expt. 23 expt. 106 expt.
None3 434 721 914 852 899 599 815 773 762Superphosphate 3 937 899 1,112 1,003 951 676 932 928 930Basic Slag3 751 789 1,072 904 890 709 892 869 859
Phosphates applied at rate of 64 pounds P2 05 per acre; all plots received 25 pounds K20 as muriate of potash.2Received ammonium sulfate at rate of 30 pounds per acre of N.'Received sodium nitrate at rate of 30 pounds per acre of N.
A
*0
mN,0zm0450
0C,
H
-ImOn1m-4
Nm
N.
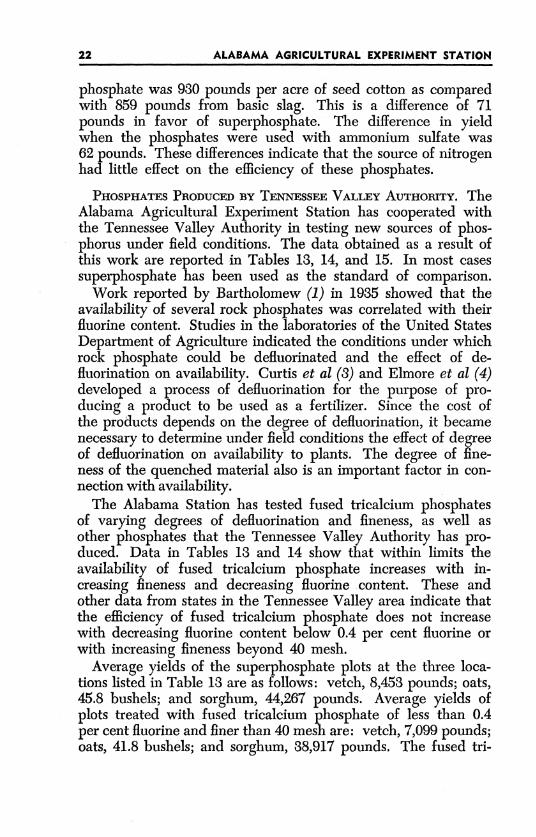
phosphate was 930 pounds per acre of seed cotton as comparedwith 859 pounds from basic slag. This is a difference of 71pounds in favor of superphosphate. The difference in yieldwhen the phosphates were used with ammonium sulfate was62 pounds. These differences indicate that the source of nitrogenhad little effect on the efficiency of these phosphates.
PHOSPHATES PRODUCED BY TENNESSEE VALLEY AUTHORITY. TheAlabama Agricultural Experiment Station has cooperated withthe Tennessee Valley Authority in testing new sources of phos-phorus under field conditions. The data obtained as a result ofthis work are reported in Tables 13, 14, and 15. In most casessuperphosphate has been used as the standard of comparison.
Work reported by Bartholomew (1) in 1985 showed that theavailability of several rock phosphates was correlated with theirfluorine content. Studies in the laboratories of the United StatesDepartment of Agriculture indicated the conditions under whichrock phosphate could be defluorinated and the effect of de-fluorination on availability. Curtis et al (3) and Elmore et al (4)developed a process of defluorination for the purpose of pro-ducing a product to be used as a fertilizer. Since the cost ofthe products depends on the degree of defluorination, it becamenecessary to determine under field conditions the effect of degreeof defluorination on availability to plants. The degree of fine-ness of the quenched material also is an important factor in con-nection with availability.
The Alabama Station has tested fused tricalcium phosphatesof varying degrees of defluorination and fineness, as well asother phosphates that the Tennessee Valley Authority has pro-duced. Data in Tables 18 and 14 show that within limits theavailability of fused tricalcium phosphate increases with in-creasing fineness and decreasing fluorine content. These andother data from states in the Tennessee Valley area indicate thatthe efficiency of fused tricalcium phosphate does not increasewith decreasing fluorine content below 0.4 per cent fluorine orwith increasing fineness beyond 40 mesh.
Average yields of the superphosphate plots at the three loca-tions listed in Table 13 are as follows: vetch, 8,453 pounds; oats,45.8 bushels; and sorghum, 44,267 pounds. Average yields ofplots treated with fused tricalcium phosphate of less than 0.4per cent fluorine and finer than 40 mesh are: vetch, 7,099 pounds;oats, 41.8 bushels; and sorghum, 38,917 pounds. The fused tri-
22 ALABAMA AGRICULTURAL' EXPERIMENT STATION
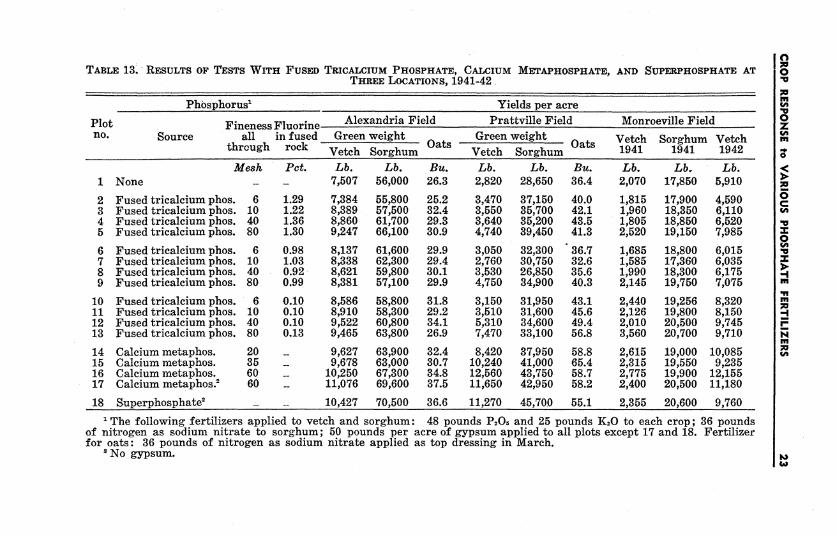
TABLE 13. RESULTS OF TESTS WITH FUSED TRICALCIUM PHOSPHATE, CALCIUM METAPHOSPHATE, AND SUPERPHOSPHATE ATTHREE LOCATIONS, 1941-42
Phosphorus' Yields per acre
Plot Fineness Fluorine Alexandria Field Prattville Field Monroeville Fieldno. Source all in fused Green weight Green weight Vetch Sorghum Vetch
through rock Vetch Sorghum Oats Vetch Sorghum 1941 1941 1942
Mesh Pet. Lb. Lb. Bu. Lb. Lb. Bu. Lb. Lb. Lb.1 None -- _ 7,507 56,000 26.3 2,820 28,650 36.4 2,070 17,850 5,910
2 Fused tricalcium phos. 6 1.29 7,384 55,800 25.2 3,470 37,150 40.0 1,815 17,900 4,5903 Fused tricalcium phos. 10 1.22 8,389 57,500 32.4 3,550 35,700 42.1 1,960 18,350 6,1104 Fused tricalcium phos. 40 1.36 8,860 61,700 29.3 3,640 35,200 43.5 1,805 18,850 6,5205 Fused tricalcium phos. 80 1.30 9,247 66,100 30.9 4,740 39,450 41.3 2,520 19,150 7,985
6 Fused tricalcium phos. 6 0.98 8,137 61,600 29.9 3,050 32,300 36.7 1,685 18,800 6,0157 Fused tricalcium phos. 10 1.03 8,338 62,300 29.4 2,760 30,750 32.6 1,585 17,360 6,0358 Fused tricalcium phos. 40 0.92 8,621 59,800 30.1 3,530 26,850 35.6 1,990 18,300 6,1759 Fused tricalcium phos. 80 0.99 8,381 57,100 29.9 4,750 34,900 40.3 2,145 19,750 7,075
10 Fused tricalcium phos. 6 0.10 8,586 58,800 31.8 3,150 31,950 43.1 2,440 19,256 8,32011 Fused tricalcium phos. 10 0.10 8,910 58,300 29.2 3,510 31,600 45.6 2,126 19,800 8,15012 Fused tricalcium phos. 40 0.10 9,522 60,800 34.1 5,310 34,600 49.4 2,010 20,500 9,74513 Fused tricalcium phos. 80 0.13 9,465 63,800 26.9 7,470 33,100 56.8 3,560 20,700 9,710
14 Calcium metaphos. 20 - 9,627 63,900 32.4 8,420 37,950 58.8 2,615 19,000 10,08515 Calcium metaphos. 35 9,678 63,000 30.7 10,240 41,000 65.4 2,315 19,550 9,23516 Calcium metaphos. 60 10,250 67,300 34.8 12,560 43,750 58.7 2,775 19,900 12,15517 Calcium metaphos.2 60 11,076 69,600 37.5 11,650 42,950 58.2 2,400 20,500 11,180
18 Superphosphate' 10,427 70,500 36.6 11,270 45,700 55.1 2,355 20,600 9,760
The following fertilizers applied to vetch and sorghum: 48 pounds P20 5 and 25 pounds K20 to each crop; 36 poundsof nitrogen as sodium nitrate to sorghum; 50 pounds per acre of gypsum applied to all plots except 17 and 18. Fertilizerfor oats: 36 pounds of nitrogen as sodium nitrate applied as top dressing in March.
2 No gypsum.
M
'o
mz
ou
"Cz
.4m
-4
I-Nm
an
W
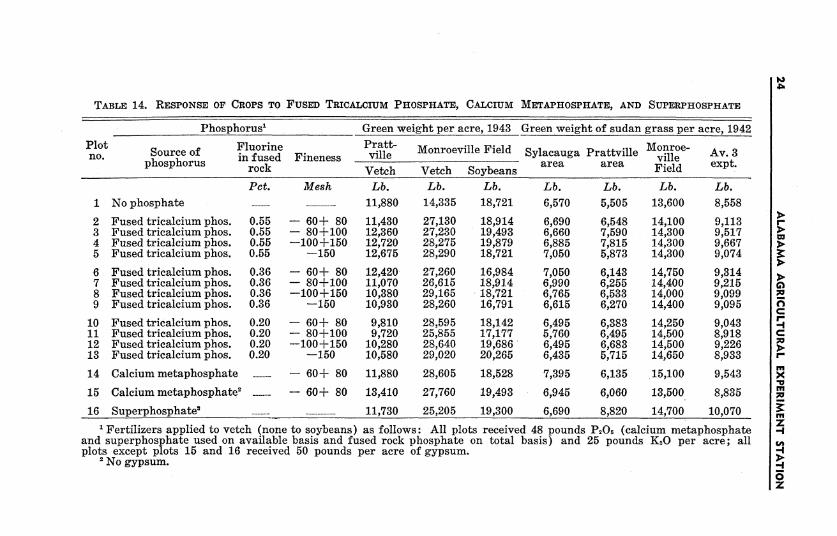
TABLE 14. RESPONSE OF CROPS TO FUSED TRICALCIUM PHOSPHATE, CALCIUM METAPHOSPHATE, AND SUPERPHOSPHATE
Phosphorus1 Green weight per acre, 1943 Green weight of sudan grass per acre, 1942
Plot Source of Fluorine Pratt- Monroeville Field Sylacauga Prattville Monroe- Av. 3no. phosphorus in fused Fineness ville villephosphorus rock Vetch Vetch Soybeans area area Field expt.
Pet. Mesh Lb. Lb. Lb. Lb. Lb. Lb. Lb.
1 No phosphate ___ 11,880 14,335 18,721 6,570 5,505 13,600 8,558
2 Fused tricalcium phos. 0.55 - 60+ 80 11,430 27,130 18,914 6,690 6,548 14,100 9,1133 Fused tricalcium phos. 0.55 - 80+100 1.2,360 27,230 19,493 6,660 7,590 14,300 9,5174 Fused tricalcium phos. 0.55 -100+150 12,720 28,275 19,879 6,885 7,815 14,300 9,6675 Fused tricalcium phos. 0.55 -150 12,675 28,290 18,721 7,050 5,873 14,300 9,074
6 Fused tricalcium phos. 0.36 - 60+ 80 12,420 27,260 16,984 7,050 6,143 14,750 9,3147 Fused tricalcium phos. 0.36 - 80+-100 11,070 26,615 18,914 6,990 6,255 14,400 9,2158 Fused tricalcium phos. 0.36 -100+150 10,380 29,165 18,721 6,765 6,533 14,000 9,0999 Fused tricalcium phos. 0.36 -150 10,930 28,260 16,791 6,615 6,270 14,400 9,095
10 Fused tricalcium phos. 0.20 - 60+ 80 9,810 28,595 18,142 6,495 6,383 14,250 9,04311 Fused tricalcium phos. 0.20 - 80+100 9,720 25,855 17,177 5,760 6,495 14,500 8,91812 Fused tricalcium phos. 0.20 -100+150 10,280 28,640 19,686 6,495 6,683 14,500 9,22613 Fused tricalcium phos. 0.20 -150 10,580 29,020 20,265 6,435 5,715 14,650 8,933
14 Calcium metaphosphate -- 60+ 80 11,880 28,605 18,528 7,395 6,135 15,100 9,543
15 Calcium metaphosphate' - 60+ 80 13,410 27,760 19,493 6,945 6,060 13,500 8,835
16 Superphosphate_ - -_ 11,730 25,205 19,300 6,690 8,820 14,700 10,0701 Fertilizers applied to vetch (none to soybeans) as follows: All plots received 48 pounds P 205 (calcium metaphosphate
and superphosphate used on available basis and fused rock phosphate on total basis) and 25 pounds K 20 per acre; allplots except plots 15 and 16 received 50 pounds per acre of gypsum.
2 No gypsum.
r-aFW
a
a
CI-cF"-IC
m
xm
mz-I
-I
-I
*o
H
a
z
CROP RESPONSE to VARIOUS PHOSPHATE FERTILIZERS
calcium phosphate plots received 50 pounds per acre of gypsumto eliminate sulfur as a variable. Average yields of the super-phosphate plots for the experiments listed in Table 14 are:vetch, 18,467 pounds; and sudan grass, 10,070. For fused tri-calcium phosphate containing less than 0.4 per cent fluorine andfiner than 60 mesh, the yields are: vetch, 19,287 pounds; andsudan grass, 9,105.
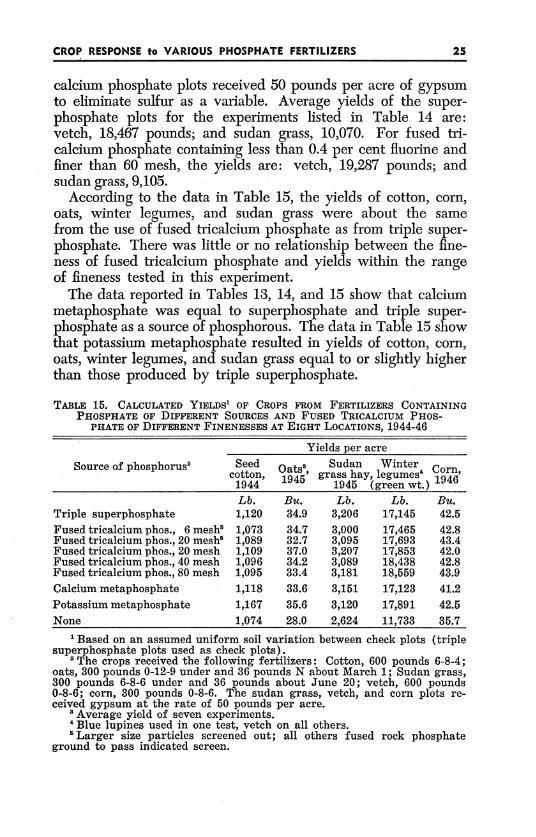
According to the data in Table 15, the yields of cotton, corn,oats, winter legumes, and sudan grass were about the samefrom the use of fused tricalcium phosphate as from triple super-phosphate. There was little or no relationship between the fine-ness of fused tricalcium phosphate and yields within the rangeof fineness tested in this experiment.
The data reported in Tables 13, 14, and 15 show that calciummetaphosphate was equal to superphosphate and triple super-phosphate as a source of phosphorous. The data in Table 15 showthat potassium metaphosphate resulted in yields of cotton, corn,oats, winter legumes, and sudan grass equal to or slightly higherthan those produced by triple superphosphate.
TABLE 15. CALCULATED YIELDS' OF CROPS FROM FERTILIZERS CONTAININGPHOSPHATE OF DIFFERENT SOURCES AND FUSED TRICALCIUM PHOS-
PHATE OF DIFFERENT FINENESSES AT EIGHT LOCATIONS, 1944-46
Yields per acre
Source of phosphorus2 Seed Oats Sudan WinterCorncotton, 1945 grass hay, legumes 4 Corn,1944 1945 (green wt.)Lb. Bu. Lb. Lb. Bu.
Triple superphosphate 1,120 34.9 3,206 17,145 42.5
Fused tricalcium phos., 6 mesh5 1,073 34.7 3,000 17,465 42.8Fused tricalcium phos., 20 mesh5 1,089 32.7 3,095 17,693 43.4Fused tricalcium phos., 20 mesh 1,109 37.0 3,207 17,853 42.0Fused tricalcium phos., 40 mesh 1,096 34.2 3,089 18,438 42.8Fused tricalcium phos., 80 mesh 1,095 33.4 3,181 18,559 43.9
Calcium metaphosphate 1,118 33.6 3,151 17,123 41.2
Potassium metaphosphate 1,167 35.6 3,120 17,891 42.5
None 1,074 28.0 2,624 11,733 35.7
'Based on an assumed uniform soil variation between check plots (triplesuperphosphate plots used as check plots).
2 The crops received the following fertilizers: Cotton, 600 pounds 6-8-4;oats, 300 pounds 0-12-9 under and 36 pounds N about March 1; Sudan grass,300 pounds 6-8-6 under and 36 pounds about June 20; vetch, 600 pounds0-8-6; corn, 300 pounds 0-8-6. The sudan grass, vetch, and corn plots re-ceived gypsum at the rate of 50 pounds per acre.
SAverage yield of seven experiments.Blue lupines used in one test, vetch on all others.Larger size particles screened out; all others fused rock phosphate
ground to pass indicated screen.
25
EFFECT OF SUPPLEMENTS ON RESPONSE OF CROPS TO SOURCES
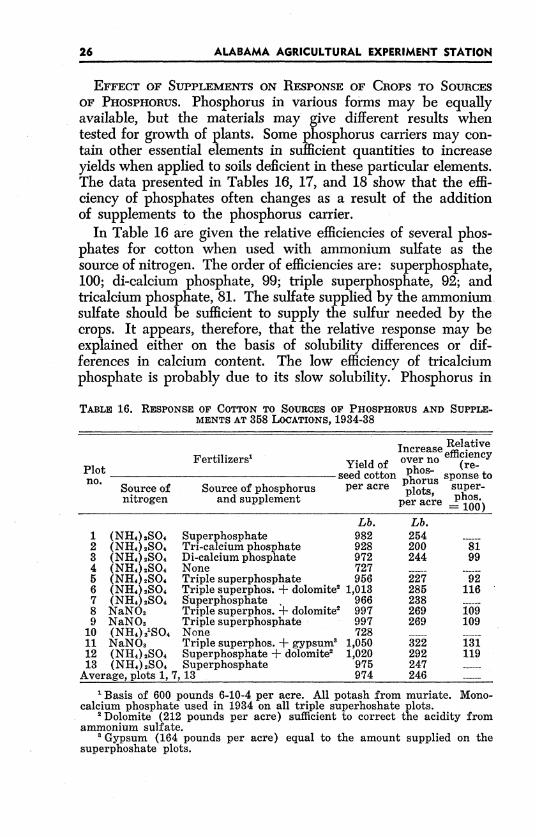
OF PHOSPHORUS. Phosphorus in various forms may be equallyavailable, but the materials may give different results whentested for growth of plants. Some phosphorus carriers may con-tain other essential elements in sufficient quantities to increaseyields when applied to soils deficient in these particular elements.The data presented in Tables 16, 17, and 18 show that the effi-ciency of phosphates often changes as a result of the additionof supplements to the phosphorus carrier.
In Table 16 are given the relative efficiencies of several phos-phates for cotton when used with ammonium sulfate as thesource of nitrogen. The order of efficiencies are: superphosphate,100; di-calcium phosphate, 99; triple superphosphate, 92; andtricalcium phosphate, 81. The sulfate supplied by the ammoniumsulfate should be sufficient to supply the sulfur needed by thecrops. It appears, therefore, that the relative response may beexplained either on the basis of solubility differences or dif-ferences in calcium content. The low efficiency of tricalciumphosphate is probably due to its slow solubility. Phosphorus in
TABLE 16. RESPONSE OF COTTON TO SOURCES OF PHOSPHORUS AND SUPPLE-MENTS AT 358 LOCATIONS, 1934-38
Increase RelativeFertilizers Yield of over no effiiency
no. seed cotton phorus sponse toSource of Source of phosphorus per acre plots, super-nitrogen and supplement per acre hos 100)
Lb. Lb.1 (NH 4 ) 2S0 4 Superphosphate 982 2542 (NH 4) 2SO Tri-calcium phosphate 928 200 813 (NH 4) 2S0 4 Di-calcium phosphate 972 244 994 (NH 4 ) 2SO4 None 7275 (NH 4 )2SO 4 Triple superphosphate 956 227 926 (NH 4) 2SO Triple superphos. + dolomite 2 1,013 285 1167 (NH 4 ) 2SO, Superphosphate 966 238 ...8 NaNO, Triple superphos. +- dolomite2 997 269 1099 NaNO3 Triple superphosphate 997 269 109
10 (NH 4) 2 S0 4 None 72811 NaNO3 Triple superphos. + gypsum' 1,050 322 13112 (NH 4 ) 2SO 4 Superphosphate + dolomite 2 1,020 292 11913 (NH 4 )2SO 4 Superphosphate 975 247
Average, plots 1, 7, 13 974 246
1 Basis of 600 pounds 6-10-4 per acre. All potash from muriate. Mono-calcium phosphate used in 1934 on all triple superhoshate plots.
2 Dolomite (212 pounds per acre) sufficient to correct the acidity fromammonium sulfate.
3 Gypsum (164 pounds per acre) equal to the amount supplied on thesuperphoshate plots.
26 ALABAMA AGRICULTURAL EXPERIMENT STATION
CROP RESPONSE to VARIOUS PHOSPHATE FERTILIZERS
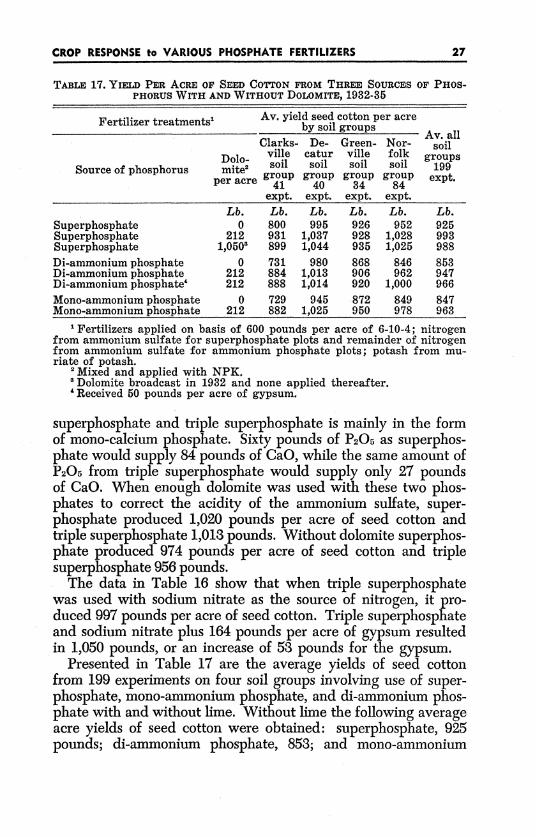
TABLE 17. YIELD PER ACRE OF SEED COTTON FROM THREE SOURCES OF PHOS-PHORUS WITH AND WITHOUT DOLOMITE, 1932-35
Fertilizer treatments 1 Av. yield seed cotton per acreby soil groups Av. all
Clarks- De- Green- Nor- soilDolo- ville catur ville folk groups
soil soi ol si
Source of phosphorus mite2 soil soil soil soil 199per acre group group group group expt.
41 40 34 84expt. expt. expt. expt.
Lb. Lb. Lb. Lb. Lb. Lb.Superphosphate 0 800 995 926 952 925Superphosphate 212 931 1,037 928 1,028 993Superphosphate 1,0503 899 1,044 935 1,025 988
Di-ammonium phosphate 0 731 980 868 846 853Di-ammonium phosphate 212 884 1,013 906 962 947Di-ammonium phosphate 212 888 1,014 920 1,000 966
Mono-ammonium phosphate 0 729 945 872 849 847Mono-ammonium phosphate 212 882 1,025 950 978 963
1 Fertilizers applied on basis of 600 pounds per acre of 6-10-4; nitrogenfrom ammonium sulfate for superphosphate plots and remainder of nitrogenfrom ammonium sulfate for ammonium phosphate plots; potash from mu-riate of potash.
'Mixed and applied with NPK.3 Dolomite broadcast in 1932 and none applied thereafter.Received 50 pounds per acre of gypsum.
superphosphate and triple superphosphate is mainly in the formof mono-calcium phosphate. Sixty pounds of P20 5 as superphos-phate would supply 84 pounds of CaO, while the same amount ofP20 5 from triple superphosphate would supply only 27 poundsof CaO. When enough dolomite was used with these two phos-phates to correct the acidity of the ammonium sulfate, super-phosphate produced 1,020 pounds per acre of seed cotton andtriple superphosphate 1,013 pounds. Without dolomite superphos-phate produced 974 pounds per acre of seed cotton and triplesuperphosphate 956 pounds.
The data in Table 16 show that when triple superphosphatewas used with sodium nitrate as the source of nitrogen, it pro-duced 997 pounds per acre of seed cotton. Triple superphosphateand sodium nitrate plus 164 pounds per acre of gypsum resultedin 1,050 pounds, or an increase of 53 pounds for the gypsum.
Presented in Table 17 are the average yields of seed cottonfrom 199 experiments on four soil groups involving use of super-phosphate, mono-ammonium phosphate, and di-ammonium phos-phate with and without lime. Without lime the following averageacre yields of seed cotton were obtained: superphosphate, 925pounds; di-ammonium phosphate, 853; and mono-ammonium
27
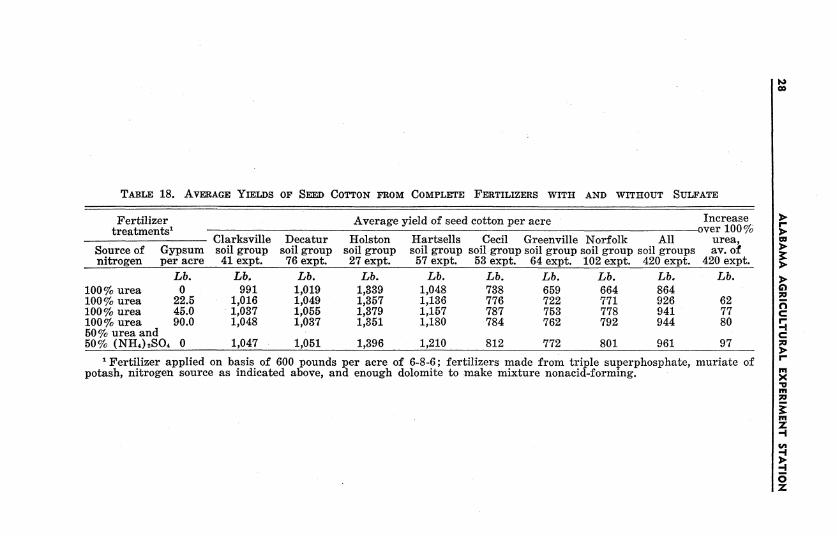
TABLE 18. AVERAGE YIEDS OF SEED COTTON FROM COMPLETE FERTILIZERS WITH AND WITHOUT SULFATE
Fertilizer Average yield of seed cotton per acre Increasetreatments' over 100%
Clarksville Decatur Holston Hartsells Cecil Greenville Norfolk All urea,Source of Gypsum soil group soil group soil group soil group soil group soil group soil group soil groups av. ofnitrogen per acre 41 expt. 76 expt. 27 expt. 57 expt. 53 expt. 64 expt. 102 expt. 420 expt. 420 expt.
Lb. Lb. Lb. Lb. Lb. Lb. Lb. Lb. Lb. Lb.100%1 urea 0 991 1,019 1,339 1,048 738 659 664 864100% urea 22.5 1,016 1,049 1,357 1,136 776 722 771 926 62100% urea 45.0 1,037 1,055 1,379 1,157 787 753 778 941 77100% urea 90.0 1,048 1,037 1,351 1,180 784 762 792 944 8050 % urea and50% (NH 4) 2S0 4 0 1,047 1,051 1,396 1,210 812 772 801 961 97
' Fertilizer applied on basis of 600 pounds per acre of 6-8-6; fertilizers made from triple superphosphate, muriate ofpotash, nitrogen source as indicated above, and enough dolomite to make mixture nonacid-forming.
IN
r-
0
Mc
mx-v
m
z-I
-I-40z
CROP RESPONSE to VARIOUS PHOSPHATE FERTILIZERS
phosphate, 847. With 212 pounds of lime per acre, the averageyields were: superphosphate, 993 pounds; mono-ammoniumphosphate, 963; and di-ammonium phosphate, 947. Although theyields from superphosphate were highest in both cases, the ad-dition of lime brought the yields closer together. Ammonium sul-fate was used with the phosphates to bring the total nitrogenapplied to 36 pounds per acre. Each plot, therefore, received adifferent quantity of sulfate supplement because of the varyingnitrogen content of the phosphorus carriers. The di-ammoniumphosphate received 62 pounds of ammonium sulfate as com-pared with 109 pounds for the mono-ammonium phosphate plots.Sixty-two pounds of ammonium sulfate evidently did not furnishsufficient sulfur for maximum yields, since the addition of 50pounds of gypsum to di-ammonium phosphate increased theaverage yield of seed cotton 19 pounds. Di-ammonium andmono-ammonium phosphates produced 966 and 963 pounds ofseed cotton, respectively, when each received about the samesulfur supplement.
RESPONSE OF COTTON TO GYPSUM. An experiment was startedin 1939 to determine the response of cotton to sulfur under awide range of conditions. This experiment was conducted from1939 to 19438 at 420 locations involving a number of soil types.The fertilizer was applied at the rate of 600 pounds per acreof 6-8-6 made from triple superphosphate, urea, and muriateof potash. Results of this experiment are reported in Table 18.Addition of 22.5, 45, and 90 pounds per acre of gypsum to thefertilizer mixture increased cotton yields 62, 77, and 80 pounds,respectively. According to these data, ordinary superphosphateapplied at 48 to 60 pounds of P205O per acre would supply morethan enough sulfur for cotton.
RESPONSE OF CLOVER PASTURES TO SOURCES OF PHOSPHORUS
The development of a livestock industry in Alabama dependsto a large extent on production of an adequate supply of feed.Many pastures will not produce a satisfactory quantity of goodquality forage without fertilization. Since phosphorus is likelyto be one of the deficient elements, use of the proper sourceof phosphorus is of considerable importance. A number of co-operative tests have been conducted over the State to evaluatesources of phosphorus for pasture production under a wide rangeof conditions. Clipping yields were obtained as a measure ofthe availability of the phosphates used.
29
O
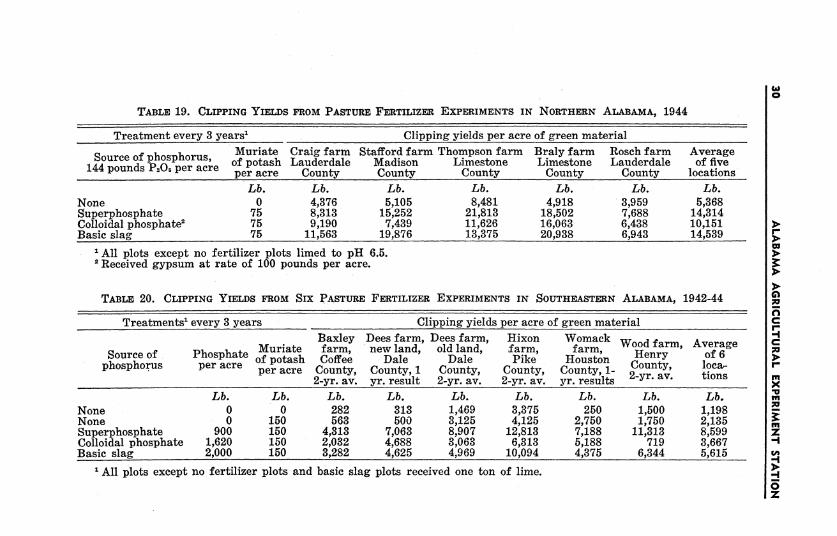
TABLE 19. CLIPPING YIELDS FROM PASTURE FERTILIZER EXPERIMENT'S IN NORTHERN ALABAMA, 1944
Treatment every 3 years' Clipping yields per acre of green material
Muriate Craig farm Stafford farm Thompson farm Braly farm Rosch farm AverageSource of phosphorus, of potash Lauderdale Madison Limestone Limestone Lauderdale of five144 pounds P5 peracre per acre County County County County County locations
Lb. Lb. Lb. Lb. Lb. Lb. Lb.
None 0 4,376 5,105 8,481 4,918 3,959 5,368Superphosphate 75 8,313 15,252 21,813 18,502 7,688 14,314Colloidal phosphate2 75 9,190 7,439 11,626 16,063 6,438 10,151>Basic slag 75 11,563 19,876 13,375 20,938 6,943 14,539
' All plots except no fertilizer plots limed to pH 6.5.2 Received gypsum at rate of 100 pounds per acre.
TABLE 20. CLIPPING YIELDS FROM SIX PASTURE FERTILIZER EXPERIMENTS IN SOUTHEASTERN ALABAMA, 1942-44
Treatments' every 3 years Clipping yields per acre of green material
Baxley Dees farm, Dees farm, Hixon Womack Wood farm, AverageSMuriate farm, new land, old land, farm, farm, Henry of 6
Source of Phosphate of potash Coffee Dale Dale Pike Houston County, locaphosphorus per acre per acre County, County, 1 County, County, County, 1-C ,
2-yr. av. yr. result 2-yr. av. 2-yr. av. yr. results 2-yr. av. tions
Lb. Lb. Lb. Lb. Lb. Lb. Lb. Lb. Lb.
None 0 0 282 313 1,469 3,375 250 1,500 1,198None 0 150 563 500 3,125 4,125 2,750 1,750 2,135Superphosphate 900 150 4,313 7,063 8,907 12,813 7,188 11,313 8,599Colloidal phosphate 1,620 150 2,032 4,688 3,063 6,313 5,188 719 3,667Basic slag 2,000 150 3,282 4,625 4,969 10,094 4,375 6,344 5,615
SAll plots except no fertilizer plots and basic slag plots received one ton of lime.
a
cCr-
m
.. 4.
z-mx
m
m
z-4
m
z
z
CROP RESPONSE to VARIOUS PHOSPHATE FERTILIZERS
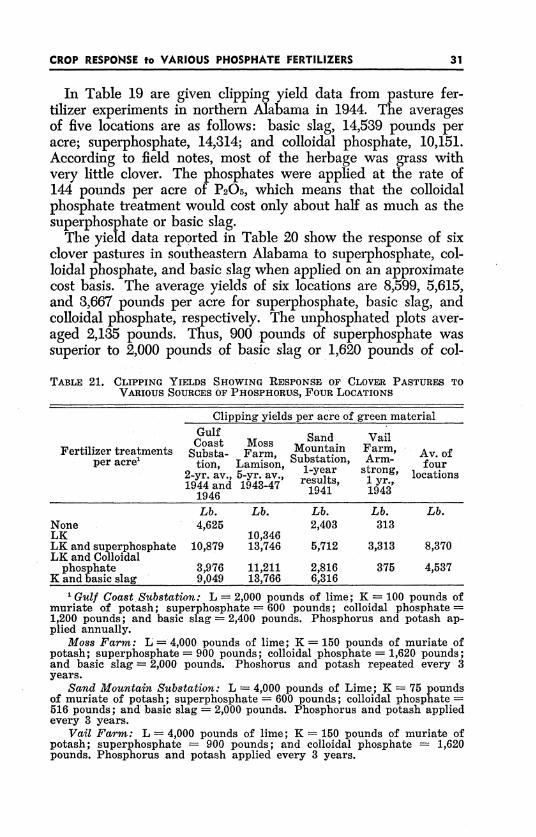
In Table 19 are given clipping yield data from pasture fer-tilizer experiments in northern Alabama in 1944. The averagesof five locations are as follows: basic slag, 14,539 pounds peracre; superphosphate, 14,314; and colloidal phosphate, 10,151.According to field notes, most of the herbage was grass withvery little clover. The phosphates were applied at the rate of144 pounds per acre of P20 5, which means that the colloidalphosphate treatment would cost only about half as much as thesuperphosphate or basic slag.
The yield data reported in Table 20 show the response of sixclover pastures in southeastern Alabama to superphosphate, col-loidal phosphate, and basic slag when applied on an approximatecost basis. The average yields of six locations are 8,599, 5,615,and 3,667 pounds per acre for superphosphate, basic slag, andcolloidal phosphate, respectively. The unphosphated plots aver-aged 2,135 pounds. Thus, 900 pounds of superphosphate wassuperior to 2,000 pounds of basic slag or 1,620 pounds of col-
TABLE 21. CLIPPING YIELDS SHOWING RESPONSE OF CLOVER PASTURES TOVARIOUS SOURCES OF PHOSPHORUS, FOUR LOCATIONS
Clipping yields per acre of green material
Gulf Sand VailCoast Moss MFertilizer treatments stountain Farm, Av. of
Fertilizer acreatments Substa- Farm, Substation, Arm- fourper acre tion, Lamison, 1-year strong, locations2-yr. av., 5-yr. av., results, 1 yr.,1944 and 1943-47 re1941 194
1946
Lb. Lb. Lb. Lb. Lb.None 4,625 2,403 313LK 10,346LK and superphosphate 10,879 13,746 5,712 3,313 8,370LK and Colloidal
phosphate 3,976 11,211 2,816 375 4,537K and basic slag 9,049 13,766 6,316
'Gulf Coast Substation: L = 2,000 pounds of lime; K = 100 pounds ofmuriate of potash; superphosphate = 600 pounds; colloidal phosphate =1,200 pounds; and basic slag = 2,400 pounds. Phosphorus and potash ap-plied annually.
Moss Farm: L = 4,000 pounds of lime; K = 150 pounds of muriate ofpotash; superphosphate -= 900 pounds; colloidal phosphate -= 1,620 pounds;and basic slag = 2,000 pounds. Phoshorus and potash repeated every 3years.
Sand Mountain Substation: L =4,000 pounds of Lime; K =75 poundsof muriate of potash; superphosphate = 600 pounds; colloidal phosphate =516 pounds; and basic slag = 2,000 pounds. Phosphorus and potash appliedevery 3 years.
Vail Farm: L = 4,000 pounds of lime; K = 150 pounds of muriate ofpotash; superphosphate = 900 pounds; and colloidal phosphate = 1,620pounds. Phosphorus and potash applied every 3 years.
31

TABLE 22. CLIPPING YIELDS SHOWING RESPONSE OF CLOVER PASTURES TOVARIOUS SOURCES OF PHOSPHORUS AND TO RATES OF COLLOIDAL
PHOSPHATE, FOUR LOCATIONS
Clipping yields per acre of green material
UpperGulfMCoastal
Fertilizer treatment Coast McCreary tal Piedmont Av. ofper acre1 Sub- Farm , Sub, station, loo
station, B-rw station,av.,2 1 yr., tions-yr.av2-yr. av., 1946 2-yr. av., 19471946-47 1946 and
1948
Lb. Lb. Lb. Lb. Lb.None 1,776 2,097LK and superphosphate 9,890 8,265 12,607 6,757 9,380LK and colloidal
phosphate 3,587 3,185 6,109 1,631 3,628LK and double rate
colloidal phosphate 2,603 5,067 7,271K and basic slag 6,886 8,432 9,561 7,223 8,025
1 Gulf Coast Substation and McCreary Farm: L = 2,000 pounds of lime;K = 150 pounds of muriate of potash annually; superphosphate = 600pounds; colloidal phosphate = 1,000 pounds; double rate of colloidal phos-phate = 2,000 pounds; and basic slag = 1,000 pounds. Phosphorus appliedevery 2 years.
Upper Coastal Plain Substation: L = 3,000 uounds of lime; K = 100pounds of muriate of potash; superphosphate = 800 pounds; colloidal phos-phate = 1,500 pounds; double rate of colloidal phosphate = 3,000 pounds;and basic slag = 1,500 pounds. Phosphorus and potash applied every 2years.
Piedmont Substation: L = 2,000 pounds of lime; K= 100 pounds ofmuriate of potash; superphosphate = 800 pounds; colloidal phosphate -1,500 pounds; and basic slag = 1,500 pounds. Phosphorus and potash ap-plied every 2 years.
loidal phosphate. The basic slag plots did not receive lime inthese experiments, and the low yield from basic slag may havebeen due to inadequate lime.
In Table 21 are given the results from four other locationsin the State, showing response of clover pastures to sources ofphosphorus. Superphosphate produced an average 8,370 poundsof green material as compared with 4,537 pounds from colloidalphosphate. The two phosphates were applied on an approxi-mately equal cost basis except at the Sand Mountain Substation.There was not much difference between the yields from super-phosphate and colloidal phosphate on the Moss farm. This. isto be expected, since the plot getting no phosphate yielded ratherhigh. At the three locations where basic slag was used, it pro-duced 9,710 pounds of herbage as compared with 10,112 fromsuperphosphate.
The clipping yields in Table 22 show the response of clover
32 ALABAMA AGRICULTURAL EXPERIMENT STATION
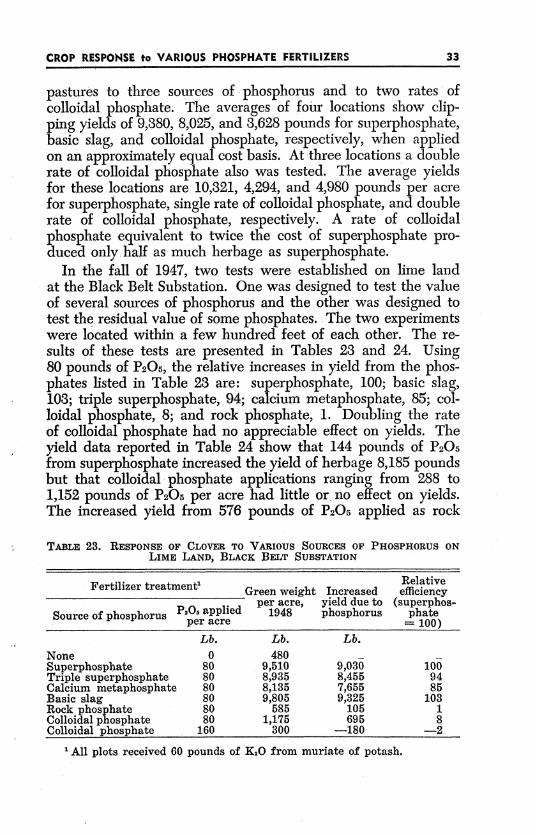
CROP RESPONSE to VARIOUS PHOSPHATE FERTILIZERS
pastures to three sources of phosphorus and to two rates ofcolloidal phosphate. The averages of four locations show clip-ping yields of 9,380, 8,025, and 3,628 pounds for superphosphate,basic slag, and colloidal phosphate, respectively, when appliedon an approximately equal cost basis. At three locations a doublerate of colloidal phosphate also was tested. The average yieldsfor these locations are 10,321, 4,294, and 4,980 pounds per acrefor superphosphate, single rate of colloidal phosphate, and doublerate of colloidal phosphate, respectively. A rate of colloidalphosphate equivalent to twice the cost of superphosphate pro-duced only half as much herbage as superphosphate.
In the fall of 1947, two tests were established on lime landat the Black Belt Substation. One was designed to test the valueof several sources of phosphorus and the other was designed totest the residual value of some phosphates. The two experimentswere located within a few hundred feet of each other. The re-sults of these tests are presented in Tables 23 and 24. Using80 pounds of P20 5, the relative increases in yield from the phos-phates listed in Table 23 are: superphosphate, 100; basic slag,103; triple superphosphate, 94; calcium metaphosphate, 85; col-loidal phosphate, 8; and rock phosphate, 1. Doubling the rateof colloidal phosphate had no appreciable effect on yields. Theyield data reported in Table 24 show that 144 pounds of P20 5from superphosphate increased the yield of herbage 8,185 poundsbut that colloidal phosphate applications ranging from 288 to1,152 pounds of P20 5 per acre had little or no effect on yields.The increased yield from 576 pounds of P20 5 applied as rock
TABLE 23. RESPONSE OF CLOVER TO VARIOUS SOURCES OF PHOSPHORUS ONLIME LAND, BLACK BELT SUBSTATION
Relative
Fertilizer treatment' Green weight Increased efficiencyper acre, yield due to (superphos-
Source of phosphorus P2 O applied 1948 phosphorus phateper acre - 100)
Lb. Lb. Lb.
None 0 480Superphosphate 80 9,510 9,030 100Triple superphosphate 80 8,935 8,455 94Calcium metaphosphate 80 8,135 7,655 85Basic slag 80 9,805 9,325 103Rock phosphate 80 585 105 1Colloidal phosphate 80 1,175 695 8Colloidal phosphate 160 300 -180 -2
All plots received 60 pounds of KO20 from muriate of potash.
33

TABLE 24. RESPONSE OF CLOVER TO HIGH RATES OF COLLOIDAL AND ROCKPHOSPHATES ON LIME LAND, BLACK BELT SUBSTATION
Fertilizer treatmentRelativeFertilizer treatment1
Green weight Increased efficiencyper acre, yield due to (super-
Source of phosphorus P2O5 applied 1948 phosphorus phosphateper acre - 100)
Lb. Lb. Lb.None 0 1,595Superphosphate 144 9,780 8,185 100Colloidal phosphate 288 2,865 1,270 16Colloidal phosphate 576 1,730 135 2Colloidal phosphate 1,152 2,260 665 8Rock phosphate 576 2,345 750 9'All plots to receive 90 pounds of K20 from muriate of potash every2 years.
phosphate was slight. One year's results on lime land show thatcolloidal and rock phosphates are inferior to the processed phos-phates for the growth of clover pastures.
DISCUSSION
Results of studies presented herein show that different phos-phates vary as to their efficiency for crop production. Relativevalues of these materials vary somewhat depending upon soilconditions and the crop grown. Some of the raw phosphates,such as rock and colloidal, were not satisfactory sources of phos-phorus for the crops studied, but were relatively more efficientfor cotton than they were for pastures.
Certain soil conditions may affect the response obtained fromphosphates. The more insoluble phosphates are usually bettersources of phosphorus for acid soils than for alkaline soils. Am-monium phosphates give relatively better response when appliedto soils containing considerable calcium than when applied to lightsandy soils low in calcium. This was especially evident in theexperiments of long duration. The lack of sulfur may be anotherreason for the low response obtained from ammonium phosphates.
Since a number of variables affect the efficiency of phosphates,it is impossible to give ratings that will apply under all condi-tions. However, certain phosphates give consistently high re-sponse, while others are consistently low. For example, resultsof these studies show that the superphosphate plots always rankedat the top or near the top in yields. It appears that superphos-phate would be a satisfactory source of phosphorus under a widerange of conditions.
34 ALABAMA AGRICULTURAL EXPERIMENT STATION

CROP RESPONSE to VARIOUS PHOSPHATE FERTILIZERS
From a practical standpoint, the best source of phosphorous forthe farmer to use is the one that gives the greatest returns overcost of material. A cheap source of phosphorus may be 80 percent as efficient for cotton as another and yet give a lowerreturn over cost of material. At present the cost of an averageapplication of superphosphate (48 pounds P20 5) would be about$1.60 more than the cheapest source of phosphorus. It is evident,therefore, that the efficiency of the cheap source must be verynear that of superphosphate to be considered a satisfactory sourceof phosphorus.
It is often suggested that the cheaper insoluble phosphatesmay have a greater cumulative effect or residual value thanprocessed phosphates. Results from experiments of long durationdo not indicate any appreciable cumulative effect.
The data reported herein are in agreement with those obtainedby other experiment stations. Salter and Barnes (8) working withOhio soils found that, for both grain crops and clover on un-limed land, rock phosphate was 40 per cent as efficient as super-phosphate. Under the same conditions basic slag showed an ef-ficiency of 85 per cent for cereals and 140 per cent for clover.Efficiency of rock phosphate and basic slag decreased with lim-ing. Noll and Irvin (7) studied the response of a number of cropsto sources of phosphorus when grown on a Hagerstown siltloam in Pennsylvania. They found that on unlimed land withmanure, basic slag and superphosphate yielded nearly alike andexceeded the yields from rock phosphate applied at twice theequivalent rate of P2 05 . On limed land, rock phosphate gavelower yields than superphosphate when applied at two and threetimes the equivalent rate of P20 5. Indiana (12) results show that715 pounds of superphosphate and 1,000 pounds of rock phos-phate ($5.00 worth in each case) produced average annualcrop increases of $5.19 for superphosphate and $2.80 for rockphosphate when each was used alone. When nitrogen and potashwere applied, the increase was $8.11 for superphosphate and$3.61 for rock phosphate.
Results reported by Bauer et al (2) of the Illinois Station showthat on limed land at five locations superphosphate producedgreater increases in yield on the average than rock phosphate.On unlimed land at the same location, rock phosphate was moreeffective than superphosphate. In 1929, the Carthage and Leb-anon fields were modified for the purpose of comparing super-phosphate and rock phosphate. Rock phosphate was applied
35
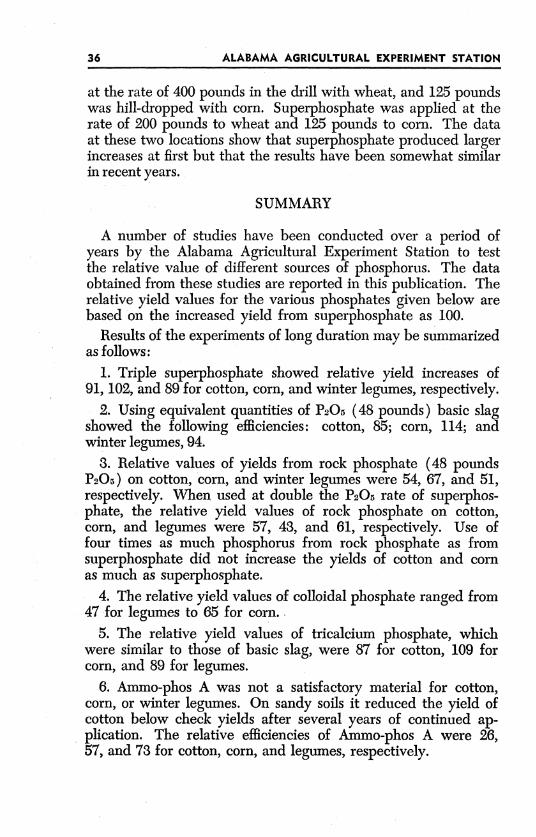
at the rate of 400 pounds in the drill with wheat, and 125 poundswas hill-dropped with corn. Superphosphate was applied at therate of 200 pounds to wheat and 125 pounds to corn. The dataat these two locations show that superphosphate produced largerincreases at first but that the results have been somewhat similarin recent years.
SUMMARY
A number of studies have been conducted over a period ofyears by the Alabama Agricultural Experiment Station to testthe relative value of different sources of phosphorus. The dataobtained from these studies are reported in this publication. Therelative yield values for the various phosphates given below arebased on the increased yield from superphosphate as 100.
Results of the experiments of long duration may be summarizedas follows:
1. Triple superphosphate showed relative yield increases of91, 102, and 89 for cotton, corn, and winter legumes, respectively.
2. Using equivalent quantities of P20 5 (48 pounds) basic slagshowed the following efficiencies: cotton, 85; corn, 114; andwinter legumes, 94.
3. Relative values of yields from rock phosphate (48 poundsP20 5) on cotton, corn, and winter legumes were 54, 67, and 51,respectively. When used at double the P2 0 5 rate of superphos-phate, the relative yield values of rock phosphate on cotton,corn, and legumes were 57, 43, and 61, respectively. Use offour times as much phosphorus from rock phosphate as fromsuperphosphate did not increase the yields of cotton and cornas much as superphosphate.
4. The relative yield values of colloidal phosphate ranged from47 for legumes to 65 for corn.
5. The relative yield values of tricalcium phosphate, whichwere similar to those of basic slag, were 87 for cotton, 109 forcorn, and 89 for legumes.
6. Ammo-phos A was not a satisfactory material for cotton,corn, or winter legumes. On sandy soils it reduced the yield ofcotton below check yields after several years of continued ap-plication. The relative efficiencies of Ammo-phos A were 26,57, and 73 for cotton, corn, and legumes, respectively.
36 ALABAMA AGRICULTURAL EXPERIMENT STATION

CROP RESPONSE to VARIOUS PHOSPHATE FERTILIZERS
The following is a summary of the results of experiments ofshort duration:
1. Fertilizer experiments conducted at 50 locations show thefollowing increases in yield of peanuts: superphosphate, 182pounds per acre; basic slag, 153; and colloidal phosphate, 96.
2. Results of experiments conducted at eight locations showthat superphosphate, rock phosphate, and basic slag increasedthe yield of seed cotton 138, 116, and 84 pounds per acre,respectively. Superphosphate and basic slag were applied atthe rate of 240 pounds per acre, while rock phosphate was ap-lied at the rate of 480 pounds.
3. An average of 222 experiments shows that where ammoniumsulfate was used as the source of nitrogen, 914 pounds of seedcotton was obtained from superphosphate, while the same amountof P20 5 from slag yielded 852 pounds. Where sodium nitratewas used as the source of nitrogen, 930 pounds was obtainedfrom superphosphate and 859 pounds from slag.
4. Fused tricalcium phosphate of 40-mesh fineness or less andof less than 0.4 per cent fluorine content produced relative yieldincreases of 84, 72, 40, and 34 for vetch, oats, sorghum, andsudan grass, respectively. In another series of tests using triplesuperphosphate as the standard, fused tricalcium phosphate pro-duced practically the same yields of cotton, corn, oats, winterlegumes, and sudan grass as triple superphosphate.
5. Calcium and potassium metaphosphates were as effectiveas the superphosphate and triple superphosphate in increasingyields of most of the crops tested.
6. Results of 858 tests in which ammonium sulfate was usedas the source of nitrogen show the following relative yield valuesof seed cotton, with that of superphosphate representing 100:triple superphosphate, 92; di-calcium phosphate, 99; and trical-cium phosphate, 81. The use of enough dolomite to correctacidity from ammonium sulfate gave relative yields of 119 forsuperphosphate and 109 for triple superphosphate. The additionof gypsum to triple superphosphate increased the yield of seedcotton 58 pounds.
7. Mono-ammonium and di-ammonium phosphates were aboutas satisfactory sources of phosphorus for cotton as superphosphatewhen used with dolomite. The use of gypsum and dolomite withdi-ammonium phosphate increased the yield of seed cotton 19pounds over dolomite alone.
37

8. Many Alabama soils responded to sulfur. An average of420 experiments shows that 22.5, 45, and 90 pounds per acreof gypsum increased the yield of seed cotton 62, 77, and 80pounds per acre respectively. Therefore, the response of certaincrops to superphosphate may be due partially to the sulfate sup-plied by the phosphate.
The results from pasture experiments dealing with the valueof various sources of phosphorus are briefly summarized:
1. Clipping yields from eight experiments on acid land showthat colloidal phosphate produced less than half as much herbageas superphosphate when the two phosphates were applied onan equivalent cost basis.
2. In three experiments on acid land, colloidal phosphate ap-plied at double the cost of superphosphate produced only i5-per cent as much herbage as superphosphate.
3. One year's results on lime land of the Black Belt showedthat colloidal and rock phosphates produced little more herbagethan the plots getting no phosphate. The plots receiving super-phosphate produced a satisfactory growth of clover.
4. On acid land basic slag produced 88 per cent as muchherbage as superphosphate. The slag plots were not limed; thismay account for the lower response of slag in some cases.
38 ALABAMA AGRICULTURAL EXPERIMENT STATION

CROP RESPONSE to VARIOUS PHOSPHATE FERTILIZERS
LITERATURE CITED
(1) BARTHOLOMEW, R. P. Fluorine, its effect on plant growth and itsrelation to the availability to plants of phosphorus in phosphaterocks. Soil Sci. 40: 203-217. 1935.
(2) BAUER, F. C., LANG, A. L., BADGER, C. J., MILLER, L. B., FARNHAM,C. H., JOHNSON, P. E., MARRIOTT, L. F., AND NELSON, M. H. Theeffects of soil treatment on soil productivity. Ill. Agr. Expt. Sta.Bul. 516. 1945.
(3) CURTIs, H. A., COPSON, R. L., BROWN, E. H., AND POLE, G. R. Fer-tilizer from rock phosphate. Indus. and Engin. Chem. 29: 766-70.1987.
(4) ELMORE, K. L., HUFFMAN, E. O., AND WOLF, W. W. Defluorinationof phosphate rock in the molten state. Indus. and Engin. Chem.34: 40-48. 1942.
(5) ENSMINGER, L. E., AND COPE, J. T., JR. Effect of soil reaction on theefficiency of various phosphates for cotton and on loss of phosphorusby erosion. Jour. Amer. Soc. Agron. 39: 1-11. 1947.
(6) MEHRING, A. L., WALLACE, H. M., AND DRAIN, MILDRED. Nitrogen,phosphoric acid and potash consumption in the United States, byyears and by states, with preliminary figures for 1944. Jour. Amer.Soc. Agron. 37: 595-609. 1945.
(7) NOLL, C. F., AND IRVIN, C. J. Field test of phosphate fertilizers.Penn. Agr. Expt. Sta. Bul. 428. 1942.
(8) SALTER, R. M., AND BARNES, E. E. The efficiency of soil and fer-tilizer phosphorus as affected by soil reaction. Ohio Agr. Expt. Sta.Bul. 53388. 1985.
(9) SCARSETH, GEORGE D., AND CHANDLER, W. V. Losses of phosphatefrom a light-textured soil in Alabama and its relation to some aspectsof soil conservation. Jour. Amer. Soc. Agron. 80: 361-374. 1988.
(10) SCHREINER, OSWALD, MERZ, ALBERT R., AND BROWN, B. E. Fer-tilizer materials. U.S.D.A. Yearbook 514. 1988.
(11) VOLK, GARTH W. Response to residual phosphorus of cotton incontinuous culture. Jour. Amer. Soc. Agron. 87: 880-840. 1945.
(12) WIANCKO, A. G., AND CONNER, S. D. Acid phosphate vs. raw rockphosphate as fertilizer. Ind. Agr. Expt. Sta. Bul. 187. 1916.
39
