of e-marketing and technological opportunism on the firm
TRANSCRIPT
Abasyn Journal of Social Sciences – Vol (10), Issue (2), 2017.
212
The Impact of Market Orientation, Top Management Support, Use
of E-Marketing and Technological Opportunism on the Firm
Performance: A Mediated-Moderation and Moderated-Mediation
Analysis
Adnan Ahmed Sheikh
PhD Markerting, Othman Yeop Abdullah Graduate School of Business,
Universiti Utara Malaysia (UUM)
Arfan Shahzad Senior Lecturer, Othman Yeop Abdullah Graduate School of Business,
Universiti Utara Malaysia (UUM)
Awanis ku Ishak
Senior Lecturer, School of Business Management (SBM),
Universiti Utara Malaysia (UUM)
Abstract
Understanding the effective use of technological innovation’s, for instance e-
Marketing, is debatably considered as the vital challenge faced by the
businesses. The past studies indicated that the association among organizational
factors and firm performance is mediated by the influence of the adopted
innovation like e-Marketing uses. Though, the antecedents of e-Marketing to
enhance firm performance have received little attention. Drawing on the
Resource Based View and diffusion of innovation theory, this article has
empirically examined the effect of Market Orientation (MO), top management
support (TMS), Technological Opportunism (TOP) and mediating effect of use
of e-Marketing (UEM) on textile performance by using SmartPLS 3.0 with a
sample size of 278 textile firms in Pakistan. A moderated mediation analysis
revealed that the relationship between MO and UEM is moderated by top
management support and the mediated moderation analysis revealed that
technological opportunism moderates the relationship between use of e-
Marketing and performance of textile firms. The direct hypothesis also found
significant showing the positive relationships. Implications for theory and
practice are discussed regarding bundling of IV and moderators in order to
increase both UEM and firm performance.
Keywords: Use of e-Marketing, Market Orientation, Top Management Support,
Technological Opportunism, Firm Performance, Textile Firms
Nowadays, Performance by industrial sector has gained
considerable attention from many academicians and practitioners (Arifin
& Frmanzah, 2015). Therefore, a great deal of interest has raised in the
field of innovation that has significantly supported the business
operations and helped the firms to enhance their global reach. However,
the recent revolution in e-Marketing has considerably affected the
performance of the business (Eid & El-Gohary, 2013; El Gohary, 2012).
In line with the statement, today, a growing number of organizations are
using the internet or other electronic tools to communicate with their
trading partners, government institutes, customers and also with end-
Abasyn Journal of Social Sciences – Vol (10), Issue (2), 2017.
213
users of their products and services (Ahmad, Rahim, Bakar, &
Mohamed, 2014; El-Gohary, 2010, 2012; Mosawi et al., 2016).
Recently, it is widely accepted that technological change and
innovation are fundamental sources of productivity and sustainable
growth for a business (Arifin & Frmanzah, 2015; Johnson, Scholes, &
Fréry, 2002; Markides, 1997). Furthermore, use of technology is a form
of strategic innovation that is basically a different way of competing with
competitors and also improving the financial of existing businesses
(Ireland & Webb, 2007; Riddell & Song, 2012), therefore, the successful
adoption of technology in the firms is that which is significantly
“affecting their competitive advantages” to achieve the firm’s
performance (Arifin & Frmanzah, 2015; Barney, 1991; Das, Majumdar,
Chakrabarti, & Chakrabarti, 2013).
In the outlook of Economic Survey Of Pakistan (2015) explains
that, Pakistan, is one of the developing country of South Asia with a
population of more than 190 million with major industrial production
based on agriculture. But still, the performance of textile sector in
Pakistan has considered to be one of the major issues in the progress of
Pakistan economy and its concerns for all the customers, shareholders,
suppliers, policy makers and the industrialist of Pakistan which are
getting affected by the slugging performance of this sector from last
decade. While, as compared to other regional competitors like China,
India and Bangladesh, Pakistan textile performance is on the lowest side,
even in the global market share, Pakistan textile share is less than 1%,
which is an alarming situation and questionable on the future of textile
industry in Pakistan (Abrar et al., 2008; Adnan, 2014; Ahmed, 2012).
The use of technology has been studied mainly with the help of
several theories like “technology acceptance model (TAM)” (Davis,
Bagozzi, & Warshaw, 1989; Davis, 1986, 1989) “theory of planned
behavior (TPB)” (Ajzen, 1985; Ajzen, 1991) “unified theory of
acceptance and use of technology (UTAUT)” Venkatesh, Morris, Davis
and Davis (2003) and many other theories related to individual behavior
but limited studies has seen its effect on firm level and to see the impact
of firm performance with the help of TOE framework, DOI and RBV
theory. However, this study extends previous literatures of technology
usage in emerging countries, particularly in the textile industry and
shows the relevance of their theories and empirical findings. The
Resource Based View theory (RBV) and the TOE framework consistent
with Diffusion of Innovation theory will be used to identify the variables
that might influence the adoption of e-Marketing by textile industry
alongside previous studies and theories within the field.
Moreover, innovation diffusion is an antecedent that likely
increases performance as it implies IT integration. So, technology
opportunism capability enhances IT diffusion strategy, which, in turn,
impact on firm performance and also technological opportunism directly
affect the firm performance (Voola, Casimir, Carlson, & Anushree
Abasyn Journal of Social Sciences – Vol (10), Issue (2), 2017.
214
Agnihotri, 2012). Also the literature explaining the relationship of
technological opportunism with firm performance has been found in the
following studies (Sarkees, 2011; Srinivasan, Lilien, & Rangaswamy,
2002) as well as these studies also explained the relationship of
technological opportunism with e-business, but the moderating role of
technological opportunism in relationship between use of e-Marketing
and firm performance is unknown and not yet been explained by any of
the past studies. Therefore the current research is tended to analyze the
moderating effect of technological opportunism between use of e-
Marketing and performance of textile sector in Pakistan (Sheikh,
Shahzad, & Ku Ishak, 2017; Sheikh, Shahzad, & Ishak, 2016a, 2016b).
Besides, a study by Ahmad, Rahim, Bakar and Mohamed (2014)
clarifies about those companies who have positive management attitude
towards adoption of e-Marketing would have more inclination to start e-
commerce activities because when top managers in any company
understand the significance of a particular technology like e-Marketing,
they incline to play a vital role in persuading other organizational
members to accept it. Therefore the study has uncluded top management
support as a moderating variable between market orientation (MO) and
use of e-Marketing (UEM) to strengthen the inconsistent relationship
between MO and UEM. Previous studies also suggested to include top
management support as a moderating variable particularly between
market orientation and use of e-Marketing (Sheikh, Shahzad, & Ku
Ishak, 2017; Sheikh, Shahzad, & Ishak, 2016a, 2016b).
Theoretically, the current study is expected to contribute to the
current knowledge in order to enhance the performance of textile sector
with the help of underpinning and supporting theory. Thus, its explicit
contribution is the conceptual explanation of the indirect effects of e-
Marketing uses at firm level that can be a key predictor of firm
performance in e-business or e-Marketing environment. In conclusion,
this study will enrich the literature by examining the relationship
between use of e-Marketing and firm’s performance in dynamic process
and also in a rapid changing environment with the help of several
independent variables. Other than that, the practical contribution is
concerned the conclusions of the this research probably facilitates
industrialist, policy maker, head of department, marketing manager’s,
and particularly the management of textile sector to grow efficiently to
get improved performance.
Reserarch Questions and Objectives
1. Does market orientation, top management support influence use of e-
Marketing and textile sector performance in Pakistan?
2. Does use of e-Marketing mediates the relationship between market
orientation, top management support and textile sector performance
in Pakistan?
Abasyn Journal of Social Sciences – Vol (10), Issue (2), 2017.
215
3. Does top management support moderates the relationship between
market orientation and use of e-Marketing?
4. Does technological opportunism moderates the relationship between
use of e-Marketing and textile performance in Pakistan?
The derived questions has been examined further and consider as an
objectives for current study.
Literature Review
Top Management Support and Firm Performance
Several studies claimed that top management is responsible for
firm beyond production management. It implies that, top management is
responsible for overall decisions of the firm. The role of TM includes;
management of external relationships, continuous improvement of the
organization. The actions and decisions thru by the top-managements
would likely to have an influence on the organizational growth, change,
and expansion because those who are at the higher management would
have greater impact on the decisions and these decisions are strategic in
nature (Carpenter, Geletkanycz, & Sanders, 2004; Varukolu, 2007). As
revealed by Rahim et al. (2015), the management support is found to be
the most essential factor of innovation
However, literature has used top management support as an
independent variable in the studies related to technology adoption (e.g.
Related to innovation, e-business or e-commerce, e-Marketing, e-
procurement, e-government) (Ahmad, Rahim, et al., 2014; Al-qirim,
2007; Arifin & Frmanzah, 2015; Rahayu & Day, 2015). But very few
studies have empirically examined the impact of top management
support on firm performance, so this main issue needs to be addressed in
the current study. Therefore, based on the above discussed literature the
recommended proposition is;
H1: Top management support positively influence on firm performance.
Market Orientation and Firm Performance
Marketing and management science have argued that superior
customer value is instrumental in achieving a sustainable competitive
advantage (Rohit Deshpandé & Farley, 2004; Porter, 2008). In the field
of marketing, there are numerous definitions of market orientation
(Deshpandé, 1999; Jaworski & Kohli, 1993; Narver & Slater, 1990). But
in this study, the definition of Narver and Slater (1990) has been
highlighted, which argues that “market orientation consists of a (a)
competitor orientation, which includes the activities involved in
acquiring information about the competitors in the target market and
transmitting it throughout the firm, (b) customer orientation, which
includes the activities involved in acquiring information about the
customers in the target market and disseminating it through- out the firm,
and (c) inter-functional coordination, which comprises the firm’s
Abasyn Journal of Social Sciences – Vol (10), Issue (2), 2017.
216
coordinated efforts, involving more than the marketing department, to
create superior value for the customers.
Empirical studies have found sturdy evidence that, market-
orientation is a crucial strategic determinant of a firm’s long-term
competitive position e.g., (Homburg & Pflesser, 2000; Narver & Slater,
1990), because it upsurges the customer satisfaction, new product’s
success, and customer loyalty. Studies found that customers mainly from
the European Union and US is moving to China, India and Bangladesh
on a continuous basis and Pakistan global market share have been
affected badly for last few years (World Trade Organization, 2014). So it
needs to address that, how the market orientation will help the firms to
fill the gap between customers and firms through the help of external
environment analysis and finally, to understand, what is the role of
market orientation towards textile sector performance.
Past studies have used market orientation as a predictor in the
studies related to firm performance. But limited studies have empirically
examined the impact of market orientation on the firm performance
through e-Marketing adoption (Rahim et al., 2015; Voola, Casimir,
Carlson, & Agnihotri, 2012). Therefore, based on the above discussed
literature the recommended proposition is;
H2: Market orientation positively influence on the firm performance
Use of e-Marketing and Firm Performance
Studies have reported mixed findings on the impact of e-
Marketing uses on firm performance. Yet, the benefits achieved were
inconsistent in different sectors due to the sizes and regions (Johnston &
Wright, 2004). However, in the same perspective, the realized benefits
were positively associated with the use of e-Marketing (Sam & Leng,
2006). Despite all the arguments, that highlight the importance of the use
of e-Marketing to increase the firm performance. The studies linked
these two variables are very limited in numbers, previous studies have
normally used e-business, e-commerce and innovation as a mediation
with the firm performance, but use of e-Marketing is still neglected by
the previous researchers to use as a mediator with firm performance.
Nevertheless, the literature focusing on e-Marketing adoption
and extension has some gaps that need to be addressed. Likewise, several
past studies have claimed inconsistency in the relationship between the
use of e-Marketing and the firm performance. Secondly, scholars have
traditionally focused on western organizations. Even though e-Marketing
practices will increase the performance, especially, needed by Pakistani
organizations, particularly in the textile sector of Pakistan (Sheikh, A.A.,
Shahzad, A., & Ku Ishak, 2017; Sheikh et al., 2016a, 2016b; Voola et al.,
2012). Further, according to Iddris and Ibrahim (2015) recommended
that, there is a need to establish a relationship between the use of e-
Marketing factors and the firm performance.
Abasyn Journal of Social Sciences – Vol (10), Issue (2), 2017.
217
According to Eid and El-Gohary (2013) found that, there is a
positive association among e-Marketing and the marketing activities. A
successful use of e-Marketing is one of the leading problem to succeed in
achieving the business objectives. These objectives can be a new way to
increase the sales, creating new customers, new digital markets, and
reduction in the physical, operational-cost, increased-profit, increased
market-shares, increased brand-equity that is set by the organization.
Furthermore, Eid and El-Gohary (2013) indicates that, assigning an
adequate budget for the electronic marketing implementation will allow
companies to interact, communicate and respond more efficiently with
customers both locally and globally.
The literature revealed that, the association between antecedents
and firm performance is mediated by the effect of the accepted
innovations (for instance e-Marketing). However, further illuminated
that, there is a positive effect of innovation on firm performance
specifically in manufacturing industries. Managers working in different
firms must put additional effort on innovations because it will ultimately
help in achieving the sustainable growth. However, good and innovative
performance is depending upon the severity of implementing the
innovative technology (Ahmad et al., 2014). Therefore, from the
supported previous literature, it can conclude that the use of e-Marketing
is one of the strongest and imperative predictor of firm performance.
Thus, based on the above literature, below hypothesis has been
articulated;
H3: Use of e-Marketing positively associated with firm performance.
Use of e-Marketing relationship with Top Management Support,
Market Orientation and Firm Performance (Mediation)
According to Liang et al. (2010), there is a weak relationship
between organizational factors and firm performance, however, findings
also imply that, more studies are required in the future to examine why
this relationship is weak and whether there are better ways through
which it can divulge more depth into the character of organization
resources in order to increase the firm performance. However, this study
has been conducted in the context of Pakistan textile sector to understand
the role of top management support and market orientation in
relationship with firm performance through mediating role of e-
Marketing adoption.
Furthermore, recent studies have stressed the unique role of
management commitment and perceptions of ICT benefits, which
influence the management to adopt the desired technology. While,
management support reinforces firm’s technology motivation to adopt e-
Marketing technology in order to observe long term firm performance
and competitive edge (Beekhuyzen, Hellens, & Siedle, 2005;
Mombourquette, 2008). On the other side, a study by Ahmad et al.
(2014) indicated that, top management’s plays a vital role to adopt IT as

Abasyn Journal of Social Sciences – Vol (10), Issue (2), 2017.
218
it is one of the factors, that contribute toward use of e-commerce. It can
be expected that, companies that have positive management attitude
toward e-commerce have more tendency to initiate e-commerce activities
in order to accelerate business performance more effectively.
Competitive advantage is aided by the ambiguous nature of the
multiple relationships between market orientation, e-Marketing use and
firm performance. The marketing literature has demonstrated the
importance of mediators such as innovation with respect to the
capability-performance relationship (Foley & Fahy, 2009). Innovation
has been argued by Wu et al. (2003) to mediate the effects of customer
orientation on performance. In line with previous discussions, it is
mentioned that, the capabilities such as market orientation create and
shape of the firm’s e-Marketing usage strategy, which will enhance the
firm performance in terms of more revenue.
The study by Rapp, Schillewaert and Hao (2008) also suggests
that efforts towards, how the different corporate factors impacting a
firm’s-orientation to the market as well as its customers in order to gain a
deeper understanding about the overall market orientation → innovation
→ performance framework. Finally, it might be important to look at
more particular outcomes of performance and also organization
effectiveness. For instance, an examination of the effects of market
orientation and innovation on organizational commitment and
satisfaction should prove a worthwhile effort. Therefore, based on the
above discussed literature the recommended propositions are;
H4: e-Marketing uses mediates the relation between top management
support and firm performance.
H5: top management support has a positive link with use of e-Marketing.
H6: e-Marketing uses mediates the relation between market orientation
and firm performance.
H7: Market orientation has a positive link with use of e-Marketing.
Top Management Support (TMS) as a Moderating Variable
In current study the top management support is selected as a
moderating variable between market orientation and use of e-Marketing.
Past studies have identified that top management support plays a vital
role in the decision making of technology diffusion and found as a strong
predictor and performs a multiple role in the significance of the
relationship. Based on the previous research, this study has included
TMS as a moderating variable between market orientation and use of e-
Marketing.
A study by Haugh and Robson (2005) found that those firms, in
which top management commitment is more towards adoption process
are likely to adopt information technology more rapidly. Whereas,
management support has a strong influence on the implementation of
infusion and diffusion systems of intranet in the firms. Therefore, a
researcher claims that management support motivates to adopt e-
Abasyn Journal of Social Sciences – Vol (10), Issue (2), 2017.
219
Marketing technology by giving strength to the firm’s technology to
become more efficient in internal processes as well as in external
communication to reduce customer and trading partner’s communication
gap and to increase its credibility in the market.
Next, several studies have indicated that structure of the
organizations are becoming more complex and with such density the
focus has shifted to include more factors that directly impact on the use
of technology. The top management factors are vital for the success of
information systems within organizations because top management
support is found as a significant moderator of e-Marketing adoption
(Ahmad, Rahim, et al., 2014; Al-qirim, 2007; Arifin & Frmanzah, 2015;
Rahayu & Day, 2015). However, the findings will contribute to the
existing literature to see the role of top management support as a
moderator in a relationship between market orientation and use of e-
Marketing. Hence, based on the literature, the following hypothesis has
been developed:
H8: Top management support moderates the relationship between
market orientation and use of e-Marketing.
Technological Opportunism (Moderator)
Innovation diffusion is an antecedent that likely increases
performance as it implies IT integration. So, technology opportunism
capability enhances IT diffusion strategy, which, in turn, impact on firm
performance and also technology opportunism directly affects the firm
performance (Voola et al., 2012). Also the literature explaining the
relationship of technological opportunism with firm performance
(Sarkees, 2011; Srinivasan, Lilien, & Rangaswamy, 2002), these studies
also explained the relationship of technological opportunism with e-
business, but the moderating role of technological opportunism in
relationship between use of e-Marketing and firm performance is
unknown and not yet been explained by any of the past studies.
Therefore the current research is tending to analyze the moderating effect
of technological opportunism as it remained significant predictor and
also a moderator with other DV’s and mediating variables. So researcher
has selected this variable to confirm its applicability in current research
to strengthen the inconsistent relationship between use of e-Marketing
and firm performance.
H9: Technological opportunism moderates the relationship between use
of e-Marketing and firm performance
H10: Technological opportunism has a positive significant relationship
with firm performance

Abasyn Journal of Social Sciences – Vol (10), Issue (2), 2017.
220
Figure 1. Conceptual Framework
Research Methodology
The respondents for this study were marketing managers
working in textile firms in Pakistan. The study included only two major
provinces of Pakistan for data collection purposes, which are Punjab and
Sindh province. The study has selected these two provinces because
these provinces consist of major cities of Pakistan like Lahore,
Bahawalpur, Rahimyar Khan, Multan, D.G Khan, Karachi, Sukkur,
Hyderabad etc. According to APTMA and APBUMA, there are major
textile hubs with approximately 955 textile firms. The rest of the two
provinces which are Balochistan and Khyber Pakhtunkha have very few
textile firms which have been neglected in this study due to research cost
and generalizability issues. However, 278 cases or sample size has been
selected in this study according to the Morgan table and also
recommended by Hair et al. (2014) about the rule of thumb that the
sample size must be 10-20 times larger than the total number of variables
of the study.
Determination of the Sample Size
The sample size of the current study was based on the morgan
table, which suggest that, sample size of 278 or above is sufficient for the
population between 950-1000 (Morgan, 1960). Therefore, the researcher
has collected the sample of marketing managers from the textile firms
located in Punjab and Sindh province of Pakistan. The sampling
technique employed for current study is a cluster proportionate random
sampling also known as area sampling. According to the cluster
sampling, the population of textile firms of Pakistan is divided into four
provinces, therefore, two provinces has been selected based on the
importance of these provinces, after that major city has been highlighted
based on the list provided by APTMA and APBUMA regarding number
of textile firms in these cities and after finalizing the list proportionate
technique has been used to properly segregate the sample to generalize
the findings.
Technological
Opportunism
Performance of
Textile Business
In Pakistan
Use of e-
Marketing
Market
Orientation
(MO)
Top
Management
Support
Abasyn Journal of Social Sciences – Vol (10), Issue (2), 2017.
221
Research Measures
The variables and items of current research have been adapted
from the past studies after doing pilot and pre-test to validate the
instrument for current study perspective. Though, the research
questionnaire is divided into two major sections. The first section
contains seven Likert-type scale items and the second section intended to
get the demographic data of the respondents. The Likert scale is intended
to notice the degree of response about how sturdily the respondents get
agree and disagree with a specific question (Sekaran, 2006).
Additionally, the aim to select 7-point Likert scale is to provide
additional choices to the respondents to internment of better
capriciousness of respondents attitude and behavior (Hinkin, 1995).
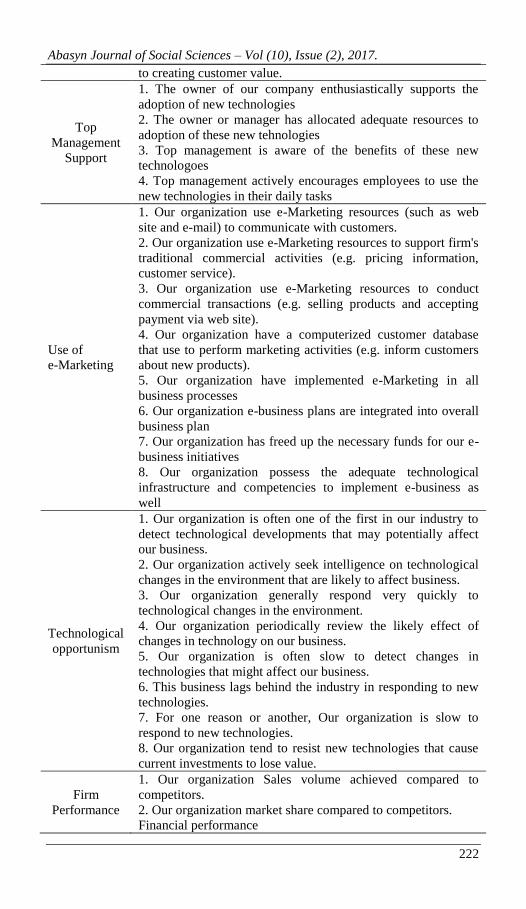
Therefore, several items have been selected, likewise, 12-item
scale to measure market orientation has been adapted as given by
(Narver & Slater, 1990). Also, 4-item scale to measure top management
support has been adapted from (Premkumar, Ramamurthy, & Nilakanta,
1994). Additional, 8-item scale to measure use of e-Marketing has been
adapted from (Srinivasan, Lilien, & Rangaswamy, 2002). Besides, 8-
item of technological opportunism has been adapted from (Srinivasan,
Lilien, & Rangaswamy, 2002). Lastly, 7-item scale to measure firm
performance has been adapted from (Hooley et al., 2005).
Table 1. Variables, No. of Items, Sources Variables of
the study Number of items
Market
Orientation
1. Our organization rapidly respond to competitive actions that
threaten us.
2. Our salespeople regularly share information concerning
competitors’ strategies.
3. Top management regularly discusses competitors’ strengths
and strategies.
4. Our company business objectives are driven primarily by
customer satisfaction.
5. Our company strategy for competitive advantage is based on
understanding of customer needs.
6. Our company strategies are driven by beliefs about how we
can create greater value for customers.
7. Our organization measure customer satisfaction
systematically and frequently.
8. All of our business functions are integrated in serving the
needs of our target markets.
9. All of our business functions are responsive to each other’s
needs and requests.
10. Our company top managers from every function regularly
visit current and prospective customers
11. Our company communicate information about customer
experiences across all business functions
12. Our company managers understand how we can contribute
Abasyn Journal of Social Sciences – Vol (10), Issue (2), 2017.
222
to creating customer value.
Top
Management
Support
1. The owner of our company enthusiastically supports the
adoption of new technologies
2. The owner or manager has allocated adequate resources to
adoption of these new tehnologies
3. Top management is aware of the benefits of these new
technologoes
4. Top management actively encourages employees to use the
new technologies in their daily tasks
Use of
e-Marketing
1. Our organization use e-Marketing resources (such as web
site and e-mail) to communicate with customers.
2. Our organization use e-Marketing resources to support firm's
traditional commercial activities (e.g. pricing information,
customer service).
3. Our organization use e-Marketing resources to conduct
commercial transactions (e.g. selling products and accepting
payment via web site).
4. Our organization have a computerized customer database
that use to perform marketing activities (e.g. inform customers
about new products).
5. Our organization have implemented e-Marketing in all
business processes
6. Our organization e-business plans are integrated into overall
business plan
7. Our organization has freed up the necessary funds for our e-
business initiatives
8. Our organization possess the adequate technological
infrastructure and competencies to implement e-business as
well
Technological
opportunism
1. Our organization is often one of the first in our industry to
detect technological developments that may potentially affect
our business.
2. Our organization actively seek intelligence on technological
changes in the environment that are likely to affect business.
3. Our organization generally respond very quickly to
technological changes in the environment.
4. Our organization periodically review the likely effect of
changes in technology on our business.
5. Our organization is often slow to detect changes in
technologies that might affect our business.
6. This business lags behind the industry in responding to new
technologies.
7. For one reason or another, Our organization is slow to
respond to new technologies.
8. Our organization tend to resist new technologies that cause
current investments to lose value.
Firm
Performance
1. Our organization Sales volume achieved compared to
competitors.
2. Our organization market share compared to competitors.
Financial performance
Abasyn Journal of Social Sciences – Vol (10), Issue (2), 2017.
223
3. Our organization overall profit levels achieved compared to
competitors.
4. Our organization profit margins compared to competitors.
5. Our organization return on investment compared to
competitors.
Customer loyalty performance
6. Our organization levels of customer loyalty compared to
competitors.
7. Our organization levels of customer satisfaction compared to
last year.
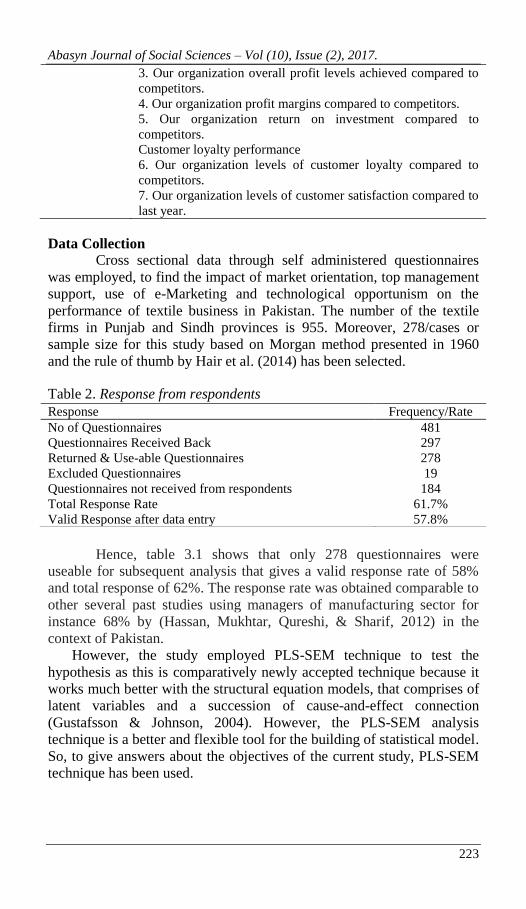
Data Collection
Cross sectional data through self administered questionnaires
was employed, to find the impact of market orientation, top management
support, use of e-Marketing and technological opportunism on the
performance of textile business in Pakistan. The number of the textile
firms in Punjab and Sindh provinces is 955. Moreover, 278/cases or
sample size for this study based on Morgan method presented in 1960
and the rule of thumb by Hair et al. (2014) has been selected.
Table 2. Response from respondents
Hence, table 3.1 shows that only 278 questionnaires were
useable for subsequent analysis that gives a valid response rate of 58%
and total response of 62%. The response rate was obtained comparable to
other several past studies using managers of manufacturing sector for
instance 68% by (Hassan, Mukhtar, Qureshi, & Sharif, 2012) in the
context of Pakistan.
However, the study employed PLS-SEM technique to test the
hypothesis as this is comparatively newly accepted technique because it
works much better with the structural equation models, that comprises of
latent variables and a succession of cause-and-effect connection
(Gustafsson & Johnson, 2004). However, the PLS-SEM analysis
technique is a better and flexible tool for the building of statistical model.
So, to give answers about the objectives of the current study, PLS-SEM
technique has been used.
Response Frequency/Rate
No of Questionnaires 481
Questionnaires Received Back 297
Returned & Use-able Questionnaires 278
Excluded Questionnaires 19
Questionnaires not received from respondents 184
Total Response Rate 61.7%
Valid Response after data entry 57.8%
Abasyn Journal of Social Sciences – Vol (10), Issue (2), 2017.
224
Data Analysis and Results
In this segment the results of confirmatory analysis for this present
study by using principle component analysis method. Items of the study
variables have been adapted from previous studies, while this research
commenced only factor analysis by using SmartPLS 3.0 (Ringle et al.,
2015) which have a built-in feature of the CFA.
PLS (SEM) technique has used to validate the measurement model
and test the hypotheses through the help of algorithm and bootstrapping
techniques. However, the PLS technique uses a component-based
approach for estimation of model and is much suitable for testing the
complex structure models. In the current study, the PLS-SEM technique
is employed because it does not execute any normality requirements for
the research data. This is a two step modeling, firstly, which assess the
quality of the measurements by using this measurement model (outer
model), and then test the hypotheses by using the structural model also
called inner model (Ringle et al., 2015). This technique employs to
measure the reliability and validity of the variables.
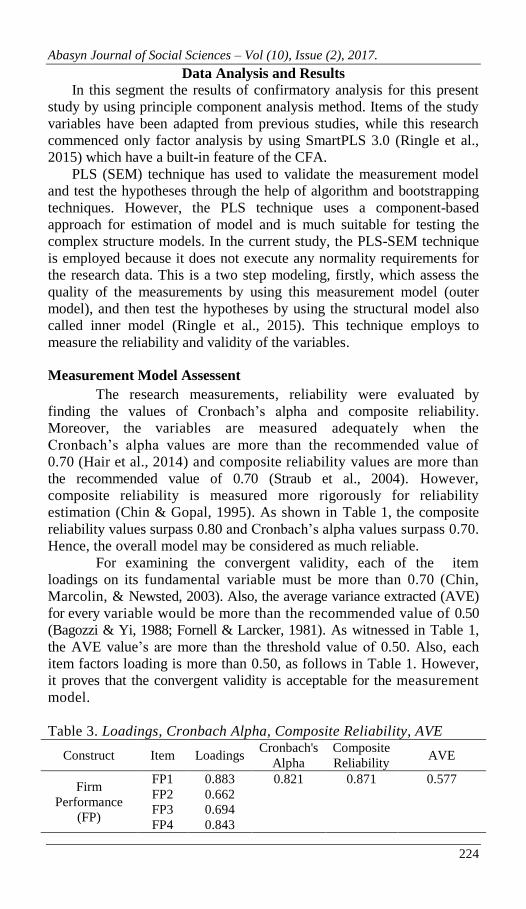
Measurement Model Assessent
The research measurements, reliability were evaluated by
finding the values of Cronbach’s alpha and composite reliability.
Moreover, the variables are measured adequately when the
Cronbach’s alpha values are more than the recommended value of
0.70 (Hair et al., 2014) and composite reliability values are more than
the recommended value of 0.70 (Straub et al., 2004). However,
composite reliability is measured more rigorously for reliability
estimation (Chin & Gopal, 1995). As shown in Table 1, the composite
reliability values surpass 0.80 and Cronbach’s alpha values surpass 0.70.
Hence, the overall model may be considered as much reliable.
For examining the convergent validity, each of the item
loadings on its fundamental variable must be more than 0.70 (Chin,
Marcolin, & Newsted, 2003). Also, the average variance extracted (AVE)
for every variable would be more than the recommended value of 0.50
(Bagozzi & Yi, 1988; Fornell & Larcker, 1981). As witnessed in Table 1,
the AVE value’s are more than the threshold value of 0.50. Also, each
item factors loading is more than 0.50, as follows in Table 1. However,
it proves that the convergent validity is acceptable for the measurement
model.
Table 3. Loadings, Cronbach Alpha, Composite Reliability, AVE
Construct Item Loadings Cronbach's
Alpha
Composite
Reliability AVE
Firm
Performance
(FP)
FP1 0.883 0.821 0.871 0.577
FP2 0.662
FP3 0.694
FP4 0.843
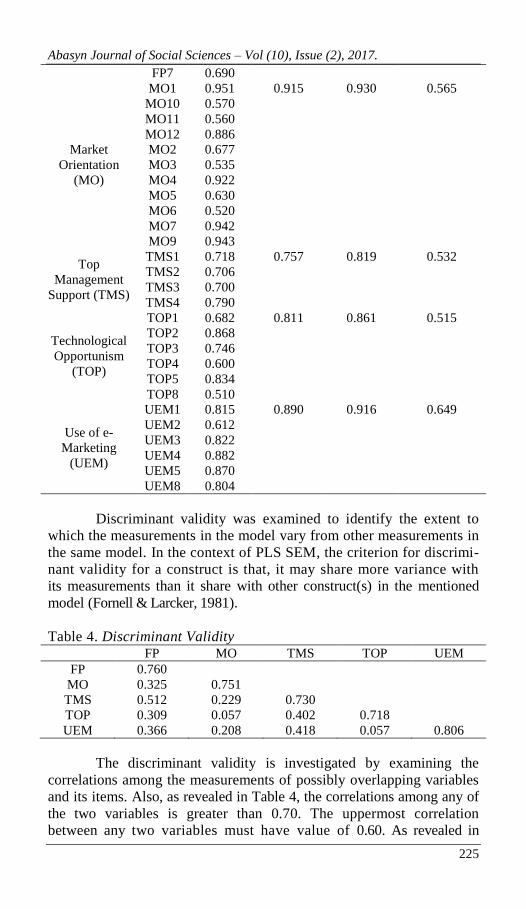
Abasyn Journal of Social Sciences – Vol (10), Issue (2), 2017.
225
FP7 0.690
Market
Orientation
(MO)
MO1 0.951 0.915 0.930 0.565
MO10 0.570
MO11 0.560
MO12 0.886
MO2 0.677
MO3 0.535
MO4 0.922
MO5 0.630
MO6 0.520
MO7 0.942
MO9 0.943
Top
Management
Support (TMS)
TMS1 0.718 0.757 0.819 0.532
TMS2 0.706
TMS3 0.700
TMS4 0.790
Technological
Opportunism
(TOP)
TOP1 0.682 0.811 0.861 0.515
TOP2 0.868
TOP3 0.746
TOP4 0.600
TOP5 0.834
TOP8 0.510
Use of e-
Marketing
(UEM)
UEM1 0.815 0.890 0.916 0.649
UEM2 0.612
UEM3 0.822
UEM4 0.882
UEM5 0.870
UEM8 0.804
Discriminant validity was examined to identify the extent to
which the measurements in the model vary from other measurements in
the same model. In the context of PLS SEM, the criterion for discrimi-
nant validity for a construct is that, it may share more variance with
its measurements than it share with other construct(s) in the mentioned
model (Fornell & Larcker, 1981).
Table 4. Discriminant Validity
FP MO TMS TOP UEM
FP 0.760
MO 0.325 0.751
TMS 0.512 0.229 0.730
TOP 0.309 0.057 0.402 0.718
UEM 0.366 0.208 0.418 0.057 0.806
The discriminant validity is investigated by examining the
correlations among the measurements of possibly overlapping variables
and its items. Also, as revealed in Table 4, the correlations among any of
the two variables is greater than 0.70. The uppermost correlation
between any two variables must have value of 0.60. As revealed in
Abasyn Journal of Social Sciences – Vol (10), Issue (2), 2017.
226
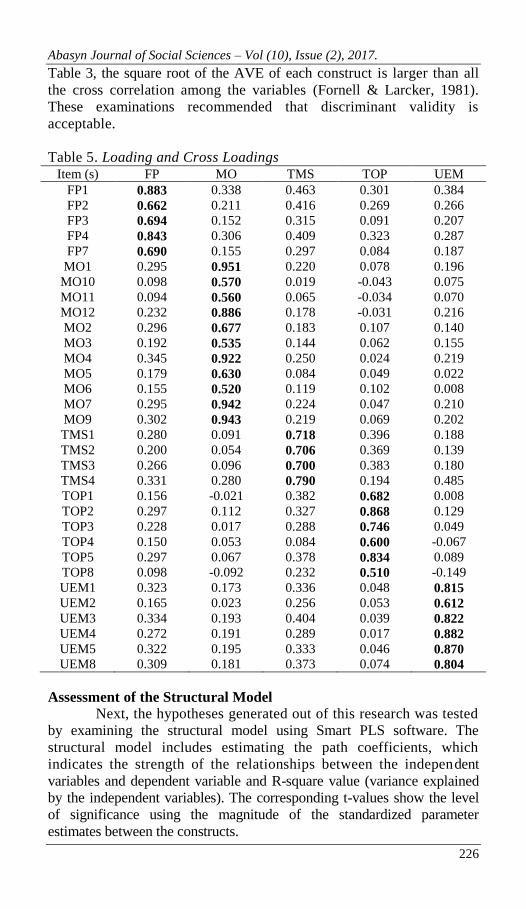
Table 3, the square root of the AVE of each construct is larger than all
the cross correlation among the variables (Fornell & Larcker, 1981).
These examinations recommended that discriminant validity is
acceptable.
Table 5. Loading and Cross Loadings Item (s) FP MO TMS TOP UEM
FP1 0.883 0.338 0.463 0.301 0.384
FP2 0.662 0.211 0.416 0.269 0.266
FP3 0.694 0.152 0.315 0.091 0.207
FP4 0.843 0.306 0.409 0.323 0.287
FP7 0.690 0.155 0.297 0.084 0.187
MO1 0.295 0.951 0.220 0.078 0.196
MO10 0.098 0.570 0.019 -0.043 0.075
MO11 0.094 0.560 0.065 -0.034 0.070
MO12 0.232 0.886 0.178 -0.031 0.216
MO2 0.296 0.677 0.183 0.107 0.140
MO3 0.192 0.535 0.144 0.062 0.155
MO4 0.345 0.922 0.250 0.024 0.219
MO5 0.179 0.630 0.084 0.049 0.022
MO6 0.155 0.520 0.119 0.102 0.008
MO7 0.295 0.942 0.224 0.047 0.210
MO9 0.302 0.943 0.219 0.069 0.202
TMS1 0.280 0.091 0.718 0.396 0.188
TMS2 0.200 0.054 0.706 0.369 0.139
TMS3 0.266 0.096 0.700 0.383 0.180
TMS4 0.331 0.280 0.790 0.194 0.485
TOP1 0.156 -0.021 0.382 0.682 0.008
TOP2 0.297 0.112 0.327 0.868 0.129
TOP3 0.228 0.017 0.288 0.746 0.049
TOP4 0.150 0.053 0.084 0.600 -0.067
TOP5 0.297 0.067 0.378 0.834 0.089
TOP8 0.098 -0.092 0.232 0.510 -0.149
UEM1 0.323 0.173 0.336 0.048 0.815
UEM2 0.165 0.023 0.256 0.053 0.612
UEM3 0.334 0.193 0.404 0.039 0.822
UEM4 0.272 0.191 0.289 0.017 0.882
UEM5 0.322 0.195 0.333 0.046 0.870
UEM8 0.309 0.181 0.373 0.074 0.804
Assessment of the Structural Model
Next, the hypotheses generated out of this research was tested
by examining the structural model using Smart PLS software. The
structural model includes estimating the path coefficients, which
indicates the strength of the relationships between the independent
variables and dependent variable and R-square value (variance explained
by the independent variables). The corresponding t-values show the level
of significance using the magnitude of the standardized parameter
estimates between the constructs.
Abasyn Journal of Social Sciences – Vol (10), Issue (2), 2017.
227
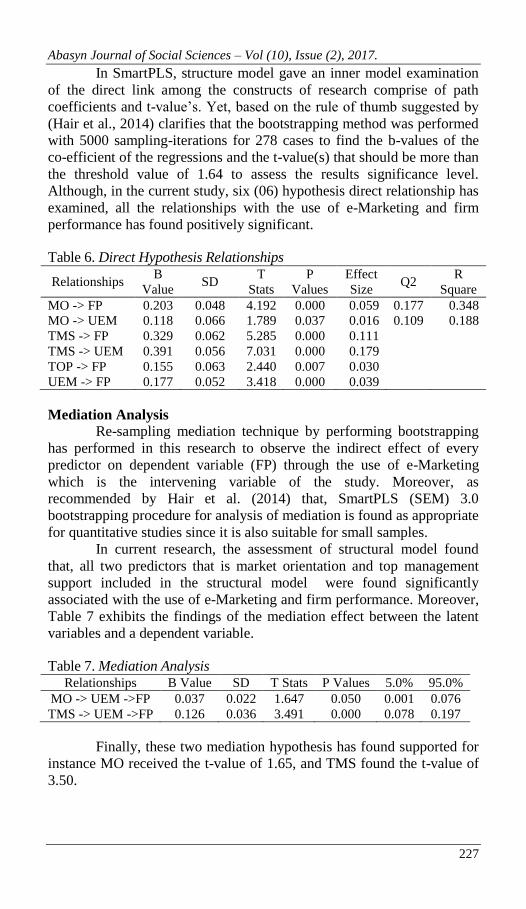
In SmartPLS, structure model gave an inner model examination
of the direct link among the constructs of research comprise of path
coefficients and t-value’s. Yet, based on the rule of thumb suggested by
(Hair et al., 2014) clarifies that the bootstrapping method was performed
with 5000 sampling-iterations for 278 cases to find the b-values of the
co-efficient of the regressions and the t-value(s) that should be more than
the threshold value of 1.64 to assess the results significance level.
Although, in the current study, six (06) hypothesis direct relationship has
examined, all the relationships with the use of e-Marketing and firm
performance has found positively significant.
Table 6. Direct Hypothesis Relationships
Relationships B
Value SD
T
Stats
P
Values
Effect
Size Q2
R
Square
MO -> FP 0.203 0.048 4.192 0.000 0.059 0.177 0.348
MO -> UEM 0.118 0.066 1.789 0.037 0.016 0.109 0.188
TMS -> FP 0.329 0.062 5.285 0.000 0.111
TMS -> UEM 0.391 0.056 7.031 0.000 0.179
TOP -> FP 0.155 0.063 2.440 0.007 0.030
UEM -> FP 0.177 0.052 3.418 0.000 0.039
Mediation Analysis
Re-sampling mediation technique by performing bootstrapping
has performed in this research to observe the indirect effect of every
predictor on dependent variable (FP) through the use of e-Marketing
which is the intervening variable of the study. Moreover, as
recommended by Hair et al. (2014) that, SmartPLS (SEM) 3.0
bootstrapping procedure for analysis of mediation is found as appropriate
for quantitative studies since it is also suitable for small samples.
In current research, the assessment of structural model found
that, all two predictors that is market orientation and top management
support included in the structural model were found significantly
associated with the use of e-Marketing and firm performance. Moreover,
Table 7 exhibits the findings of the mediation effect between the latent
variables and a dependent variable.
Table 7. Mediation Analysis Relationships B Value SD T Stats P Values 5.0% 95.0%
MO -> UEM ->FP 0.037 0.022 1.647 0.050 0.001 0.076
TMS -> UEM ->FP 0.126 0.036 3.491 0.000 0.078 0.197
Finally, these two mediation hypothesis has found supported for
instance MO received the t-value of 1.65, and TMS found the t-value of
3.50.
Abasyn Journal of Social Sciences – Vol (10), Issue (2), 2017.
228
Technological Opportunism (TOP) and Top management Support
(TMS) as a Moderating Variable Analysis
A test of moderation, as illustrated by Ramaya et al. (2011) that
whatever the moderator variable is selected for the study it affects the
direction or strength of the relationship between the independent and
dependent variable. He further explained that moderator variable (s) are
typically introduced when there is inconsistent relationship or weak
relationship between the independent variable and dependent variable.
Apart from this side, there are a series of techniques for testing the
moderating effects such as hierarchal regression procedure, which is
based on three steps, but the drawback of this technique was to calculate
interaction terms manually by using functions, transforms, compute and
taking the product of each pair. Another technique is to apply the
moderating variable as additional construct using the cross products of
the indicator of the independent variable and the moderator (Chin et al.,
2003).
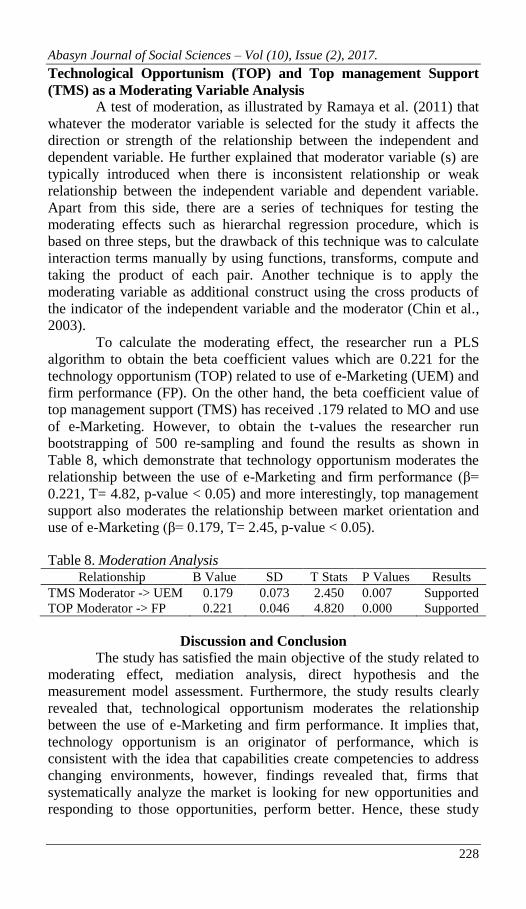
To calculate the moderating effect, the researcher run a PLS
algorithm to obtain the beta coefficient values which are 0.221 for the
technology opportunism (TOP) related to use of e-Marketing (UEM) and
firm performance (FP). On the other hand, the beta coefficient value of
top management support (TMS) has received .179 related to MO and use
of e-Marketing. However, to obtain the t-values the researcher run
bootstrapping of 500 re-sampling and found the results as shown in
Table 8, which demonstrate that technology opportunism moderates the
relationship between the use of e-Marketing and firm performance (β=
0.221, T= 4.82, p-value < 0.05) and more interestingly, top management
support also moderates the relationship between market orientation and
use of e-Marketing (β= 0.179, T= 2.45, p-value < 0.05).
Table 8. Moderation Analysis Relationship B Value SD T Stats P Values Results
TMS Moderator -> UEM 0.179 0.073 2.450 0.007 Supported
TOP Moderator -> FP 0.221 0.046 4.820 0.000 Supported
Discussion and Conclusion
The study has satisfied the main objective of the study related to
moderating effect, mediation analysis, direct hypothesis and the
measurement model assessment. Furthermore, the study results clearly
revealed that, technological opportunism moderates the relationship
between the use of e-Marketing and firm performance. It implies that,
technology opportunism is an originator of performance, which is
consistent with the idea that capabilities create competencies to address
changing environments, however, findings revealed that, firms that
systematically analyze the market is looking for new opportunities and
responding to those opportunities, perform better. Hence, these study
Abasyn Journal of Social Sciences – Vol (10), Issue (2), 2017.
229
results should encourage managers to invest resources in being
technologically opportunistic.
Additionally, top management support moderates the
relationship between market orientation and use of e-Marketing. It
implies that, bringing the technology in the organization only is not
enough, until it is properly implemented in the particular departments
and keep updated by reviewing the external environment and the demand
of the internal and external customers of the organization. Whereas, top
management support is essential for the firms in adopting the latest
technology in the firm, as the decision and investment to invest in the
particular technology lies in the hand of top management. In line with the
statement, for the successful implementation of technology requires
significant support from the top executives to encourage the adoption of
new technology and provides visionary leadership which clearly eloquent
the need for the technology across the organization. Concurrent with this
argument, management support has a strong influence on the
implementation of infusion and diffusion systems of intranet in the
organizations. Therefore, a researcher claims that, management support
motivates to adopt e-Marketing technology by giving strength to the
firm’s technology to be more efficient in internal processes as well as in
external communication to reduce customer and trading partner’s
communication gap and ultimately to upsurge its credibility in the market
(Sheikh, Shahzad, & Ku Ishak, 2017; Sheikh, Shahzad, & Ishak, 2016a,
2016b).
Moreover, all direct hypothesis have found significantly related
with the use of e-Marketing and firm performance. These results are also
concurrent with the previous studies that the use of e-Marketing has a
sturdy positive relationship with firm performance, the studies also
conclude that there is a positive association among e-Marketing and the
marketing activities, also, few studies indicated that, there is a strong
relationship between the e-Marketing usage and firm performance,
therefore a successful use of e-Marketing is one of the leading problem
to succeed in achieving the business objectives (El Gohary, 2012; Voola
et al., 2012; Chen & Lien, 2013; Eid & El-Gohary, 2013; Rahayu & Day,
2015; Sheikh, Shahzad, & Ishak, 2016).
Interestingly, the intervening variable that is use of e-Marketing
has played a significant role between market orientation and top
management support. It implies that, using e-Marketing in the firms
through its antecedents which are TMS and MO enhance the overall
performance of the business. This implies that, the direct as well as
indirect effects of TMS with the mediating effect of the use of e-
Marketing enhances the performance of the textile firms. In fact, in
Pakistan textile firms, the main decision making authority is the owner or
chairman of the company because he/she is the sole owner of all the
assets, whether tangible or intangible, therefore, all the departments are
responsible to report top management about each and every detail.
Abasyn Journal of Social Sciences – Vol (10), Issue (2), 2017.
230
However, in the current study, use of e-Marketing strongly mediates the
relationship of TMS and superior performance of textile firms. Besides,
regarding MO, to this end, the results suggest that a firm’s MO is an
ingredient for using the technology like e-Marketing, which would
provide the firm with capabilities to achieve superior performance.
Consequently, in this study, marketing orientation, top
management support and technological opportunism are the intangible
resources as explained by the RBV theory. Furthermore, DOI theory and
TOE model has also explained all these independent variables,
relationship directly with use of e-Marketing and extension of the
framework towards firm performance is a major contribution and
extension in DOI theory with combination of RBV theory to justify the
relationship properly as it is also recommended by Baker (2011) in its
future studies that by extending the model from innovation (e-Marketing)
to firm performance with the help of RBV theory, will be considered as a
major contribution in the existing literature.
Current research undertakes several vital contributions to both
theory and research of e-Marketing which is considerably a new area of
information. However, still the theory in the area of e-Marketing is at
beginning stage and getting provoked badly by the indistinct way of
dealing with the main definition and concept of e-Marketing, linked to
several marketing measurements and subsists in a fast changing
environment. Moreover, current research might be distinguished as a step
towards the theory building of e-Marketing. Thus, in this regard, the
research has combined a significantly large body of related marketing
literature, textile business literature, ICT and innovative technology
acceptance literature by combining diverse theories into a single
integrative aspect. The research also comprehend the theories of RBV
and DOI which are considered as most effective theories in predicting
the adoption and use of latest technologies. Also, this research is one of
the first to validate and explain empirically the different e-Marketing
forms, antecedents while enhancing the textile performance.
This research has filled the gap in the existing literature of a
firms’ technology usage, where existing clarifications have engrossed on
market characteristics, firms’ technology through the awareness of e-
Marketing uses. Lastly, the current research has delivered significant
results, mainly in the firm performance both directly and indirectly by
including the use of e-Marketing as an intervening variable. Our study
has revealed that, to understand the array of e-Marketing uses to improve
organizational performance is more vital in handling the technological
development.
Limitations and Future Research Directions
This research was primarily conducted on Pakistan textile firms
and may not be representative for other industries or countries. This
research is limited to in-depth study of only five variables, supported by
Abasyn Journal of Social Sciences – Vol (10), Issue (2), 2017.
231
the questionnaire survey. The limited sample size were 278 marketing
managers employed in this research. However, caution is needed in the
understanding of findings as these outcomes are not appropriate for other
regions or states of the country also on the other service industries.
However, future studies revealed from our research are to examine the
e-Marketing uses, its tools and performance of the businesses with
diverse theories and constructs by selecting other sizes of the firms like
micro-enterprises, medium-size enterprises or even large organizations
be subject to the anticipated causes produced in this research.
Research Implications
Textile Businesses of Pakistan have been recognized as one of
the major contributors to employment, economic growth and poverty
alleviation. Government and policymaker have to recognize that their
decisions relating to textile have a direct impact on activities of the
enterprises. It is, however, necessary to reveal that, what government and
policy makers can do to improve the performance and sustainability of
textile industry in Pakistan. From the literature review, this study has
identified that the textile sector lacks e-Marketing in their business
activities and operating in an unfriendly environment is the primary
cause of textile under-performance (SMEDA, 2016; Survey, 2015)
Based on this study’s findings and several past studies, it is
empirically established that TOE factors (RA, MO, and TP) generally
contribute to technology adoption or diffusion, which is the use of e-
Marketing based on RBV and DOI theory as well as TOE framework.
Moreover, few of these current study TOE factors also contributes in
performance of textile sector directly whether positively or negatively.
Therefore, textile sector owners-managers need to acknowledge the
importance of the use of e-Marketing in enhancing firm performance
indirectly as a mediator with all positive relationships, based on RBV
theory. It implies that market orientation is the major contributor of RBV
theory, which also increase with usage of e-Marketing and helps to
achieve superior performance. Similarly, market oriented firms bring
innovation in the firms to enrich the performance. Whereas, top
management support is one of the major contributors in the current study,
as a Pakistan textile industry is one of the leading industry, where,
ownership belongs to single person, families or group of families, in this
case, the decision to adopt or implement new technology lies in the court
of top management. However, the study also found a significant
relationship with top management support which is one of the attribute of
DOI theory, where management support pass from the five stages of
adoption.
Abasyn Journal of Social Sciences – Vol (10), Issue (2), 2017.
232
References
Abrar, M., Tian, Z., Usman, M., & Ali, A. (2008). E-Marketing Morphology in
the Textile Sector of Pakistan. In Seventh Wuhan International
Conference on E-business (pp. 1–8).
Adnan, H. (2014). An Analysis of the Factors Affecting Online Purchasing
Behavior of Pakistani Consumers. International Journal of Marketing
Studies, 6(5), 133–149.
Ahmad, N., & Kalim, R. (2014). Implications of Export Competitiveness, and
Performance of Textile and Clothing Sector of Pakistan: Pre and Post
Quota Analysis. Pakistan Journal of Commerce and Social Sciences,
8(3), 696–714. Retrieved from
Ahmad, S. Z., Bakar, A. R. A., Mohamed, T., Faziharudean, & Zaki, K. A. M.
(2014). Information Technology for Development An Empirical Study
of Factors Affecting e-Commerce Adoption among Small- and
Medium-Sized Enterprises in a Developing Country: Evidence from
Malaysia. Information Technology For Development, 21(4), 37–41.
Ahmed, P. K. (1998). Culture and climate for innovation. European Journal of
Innovation Management, 1(1), 30–43.
Ajzen, I. (1985). From intentions to actions: A theory of planned behavior.
Springer Berlin Heidelberg.
Ajzen, I. (1991). The theory of planned behavior. Organizational Behavior and
Human Decision Processes, 50(2), 179–211.
Al-Qirim, N. (2007). The adoption of eCommerce communications and
applications technologies in small businesses in New Zealand.
Electronic Commerce Research and Applications, 6(4), 462–473.
Arifin, Z., & Frmanzah. (2015). The Effect of Dynamic Capability to
Technology Adoption and its Determinant Factors for Improving
Firm’s Performance; Toward a Conceptual Model. Procedia - Social
and Behavioral Sciences, 207(2015), 786–796.
Baker, J. (2011). The Technology–Organization– Environment Framework. In
Information Systems Theory: Explaining and Predicting our Digital
Society Vol. 1 (pp. 231–245). Springer New York.
Barney, J. (1991). Firm Resources and Sustained Competitive Advantage.
Journal of Management, 17(1), 99–120.
http://doi.org/10.1177/014920639101700108
Beekhuyzen, J., Hellens, L. von, & Siedle, M. (2005). Cultural barriers in the
adoption of emerging technologies. In Proceedings of HCI
International.
Carpenter, M. A., Geletkanycz, M. A., & Sanders, W. G. (2004). Upper
echelons research revisited: Antecedents, elements, and consequences
of top management team composition. Journal of Management, 30(6),
749–778.
Das, A., Majumdar, L., Chakrabarti, S., & Chakrabarti, S. (2013). Chemical
evolution during the process of proto-star formation by considering a
two dimensional hydrodynamic model. New Astronomy, 23, 118–125.
Davis, F. (1986). A technology acceptance model for empirically testing new
end-user information systems: Theory and results. Massachusetts
Institute of Technology.
Davis, F. (1989). Perceived usefulness, perceived ease of use, and user
acceptance of information technology. In MIS quarterly (pp. 319–340).
Abasyn Journal of Social Sciences – Vol (10), Issue (2), 2017.
233
Davis, F. D., Bagozzi, R. P., & Warshaw, P. R. (1989). User Acceptance of
Computer Technology: A Comparison of Two Theoretical Models.
Management Science, 35(8), 982–1003.
Eid, R., & El-Gohary, H. (2013). The impact of E-marketing use on small
business enterprises’ marketing success. The Service Industries
Journal, 33(1), 31–50.
El Gohary, H. (2012). Factors affecting E-Marketing adoption and
implementation in tourism firms: An empirical investigation of Egyptian small
tourism organisations. Tourism Management, 33(5), 1256–1269
Foley, A., & Fahy, J. (2009). Seeing market orientation through a capabilities
lens. European Journal of Marketing, 43(1/2, 2009), 13–20.
Fornell, C., & Larcker, D. F. (1981). Evaluating structural equation models with
unobservable variables and measurement error. Journal of marketing
research, 39-50.
Hair Jr, J. F., & Lukas, B. (2014). Marketing research. McGraw-Hill Education
Australia.
Hair, J. F., Anderson, R. E., Babin, B. J., & Black, W. C. (2010). Multivariate
data analysis: A global perspective (Vol. 7). Upper Saddle River, NJ:
Pearson.
Hinkin, T. R. (1995). A review of scale development practices in the study of
organizations. Journal of management, 21(5), 967-988.
Homburg, C., & Pflesser, C. (2000). A multiple-layer model of market-oriented
organizational culture: Measurement issues and performance
outcomes. Journal of marketing research, 37(4), 449-462.
Hooley, G. J., Greenley, G. E., Cadogan, J. W., & Fahy, J. (2005). The
performance impact of marketing resources. Journal of Business
Research, 58(1), 18-27.
Johnson, G., Scholes, K., & Fréry, F. (2002). Stratégique, 2e éd.
Markides, C. (1997). Strategic innovation. MIT Sloan Management Review,
38(3), 9.
Mombourquette, P. (2008). A study of the nature and extent of Atlantic
Canadian small and medium business e-commerce usage leading to the
development and testing of a model to explain. UNIVERSITY OF
SOUTHERN QUEENSLAND.
Mosawi, N., Shahzad, A., Golamdin, A. G. B., Pasha, A. T., & Sheikh, A. A.
(2016). Third party recognition, perceived product related risk, and
perceived ease of use among online consumer trust: The moderating
role of internet experience. Pakistan Journal of Commerce and Social
Sciences, 10(2), 239–256.
Narver, J. C., & Slater, S. F. (1990). The effect of a market orientation on
business profitability. The Journal of marketing, 20-35.
Premkumar, G., Ramamurthy, K., & Nilakanta, S. (1994). Implementation of
electronic data interchange: an innovation diffusion
perspective. Journal of Management Information Systems, 11(2), 157-
186.
Rahim, A., Bakar, A. B. U., & Ahmed, Z. U. (2015). Technology Motivation in
E-Marketing Adoption Among Malaysian Manufacturers. Journal of
Transnational Management, 20(April), 126–152.
Rapp, A., Schillewaert, N. and Hao, A. (2008) ‘The Influence of Market
Orientation on E-Business Innovation and Performance: The Role of
Abasyn Journal of Social Sciences – Vol (10), Issue (2), 2017.
234
the Top Management Team’, The Journal of Marketing Theory and
Practice, 16(1), pp. 7–25.
Ringle, C. M., Wende, S., and Becker, J.-M. 2015. "SmartPLS 3."
Boenningstedt: SmartPLS GmbH, http://www.smartpls.com.
Sarkees, M. (2011). Understanding the links between technological
opportunism, marketing emphasis and firm performance: Implications
for B2B. Industrial Marketing Management, 40(5), 785–795.
Sekaran, U. (2006). Research methods for business: A skill building approach.
John Wiley & Sons.
Sheikh, A. A., Shahzad, A., & Ishak, A. B. K. (2016). The mediating impact of
e-marketing adoption on export performance of firms: A conceptual
study. Journal of Technology and Operations Management, 11(1), 48–
58.
Sheikh, A. A., Shahzad, A., & Ishak, A. B. K. (2016a). The mediating impact of
e-marketing adoption on export performance of firms: A conceptual
study. Journal of Technology and Operations Management, 11(1), 48–
58.
Sheikh, A. A., Shahzad, A., & Ishak, A. K. (2016b). The Effects of E-Marketing
Uses , Market Orientation , Relative Advantage and Trading Partners
Pressure on the Performance of Textile Business in Pakistan : A
Mediated-Moderation Analysis. International Journal of Economic
Perspectives, 10(4), 562–580.
Sheikh, A.A., Shahzad, A., & Ku Ishak, A. (2017). The Growth of E-Marketing
in Business-to-Business Industry and its effect on the Performance of
Businesses in Pakistan: Marketing Success. International and
Multidisciplinary Journal of Social Sciences, 6(2), 178–214.
Srinivasan, R., Lilien, G. L., & Rangaswamy, A. (2002). Technological
Opportunism and Radical Technology Adoption: An Application to E-
Business. Journal of Marketing, 66(3), 47–60.
Straub, D., Boudreau, M., & Gefen, D. (2004). Validation guidelines for IS
positivist research. The Communications of the Association for
Information Systems, 13(1), 63.
Varukolu, V. (2007). TECHNOLOGY ADOPTION OF INDIAN GARMENT
MANUFACTURING FIRMS (Doctoral dissertation, Faculty of the
Louisiana State University and Agricultural and Mechanical College in
partial fulfillment of the requirements for the degree of Master of
Science in The Schoo.
Venkatesh, V., Morris, M., Davis, G., & Davis, F. (2003). User acceptance of
information technology: Toward a unified view. In MIS quarterly (Vol.
27, pp. 425–478).
Voola, R., Casimir, G., Carlson, J., & Anushree Agnihotri, M. (2012). The
effects of market orientation, technological opportunism, and e-
business adoption on performance: A moderated mediation analysis.
Australasian Marketing Journal, 20(2), 136–146.
Wu, F., Mahajan, V., & Balasubramanian, S. (2003). An Analysis of E-Business
Adoption and its Impact on Business Performance An Analysis of E-
Business Adoption and its Impact on Business Performance. Journal of
the Academy of Marketing Science, 31(April 2003), 425–447.