of greece - nbg greece sold in bulk o compared with greece is the third largest producer of olive...
TRANSCRIPT

*
Greece is the third largest producer of olive oil in the world (11 per cent of total
volume production), following Spain (40 per cent) and Italy (14 per cent). Indeed,
Greek olive oil is of superior quality, since 80 per cent of production is extra virgin
olive oil (compared with 65 per cent in Italy and 30 per cent in Spain).
The increasing popularity of the healthy Mediterranean diet, and especially olive oil,
has more than doubled demand for olive oil in other countries (apart from the 3 main
producers) during the past 20 years.
Despite the comparative advantages of Greek olive oil:
o Only 27 per cent of Greek production reaches the stage of labeling/branding,
compared with 50 per cent in Spain and 80 per cent in Italy, with the remainder
sold in bulk form, including 70 per cent of exports (mainly to Italy for re-export).
o Greece‟s market share in the world market of branded olive oil decreased from 6
per cent during the 1990s to 4 per cent during the past 5 years.
Greek producers have failed to benefit from the global growth in olive oil demand,
mainly due to structural problems:
o The cost of olive production is relatively high in Greece (about €1/kg of olives,
compared with €0.6/kg in Spain), mainly because of the small size and low labor
productivity of olive farms.
o Most olive mills in Greece are smaller and less advanced (in terms of technology)
than those in Spain, leading to higher milling costs (€0.19/kg of olive oil for
Greek mills, compared with €0.16/kg of olive oil for Spanish mills). In Italy, even
though the mills are also small, they are vertically integrated with the olive
farming stage, as well as the distribution stage.
o The fragmented nature of Greek olive oil cooperatives does not facilitate the
standardization of quality control, which is necessary for the promotion of
premium olive oil.
o The small size of bottling and labeling companies does not allow for the
successful promotion of branded products.
Despite the expected further increase in olive oil demand (mainly in other countries,
i.e. apart from the main producers), the gradual decrease in CAP subsidies for Greek
olive oil is expected to make small producers, with low productivity, unprofitable. As a
result, Greek olive oil production is expected to decline to 280,000 tons in 2020
compared with an annual average of 310,000 tons during the past 5 years.
In the medium term, provided that certain structural changes are undertaken,
increasing global demand and the superior quality of Greek olive oil should result in
more value added for the Greek sector. In particular, a shift from bulk to branded
olive oil and a more efficient marketing strategy could increase the value of Greek
exports by approximately €250 million (about 80 per cent higher than 2014). Indeed,
a more vertically integrated production structure would increase the efficiency of the
sector, strengthen its marketing strategy, and consequently prove favorable for a
successful branding of Greek olive oil.
Economic Analysis Department Eolou 86, 10232 Athens, Greece
SECTORAL REPORT
May 2015 NATIONAL BANK
OF GREECE
Olive Oil: Establishing the Greek brand
Paul Mylonas, PhD +30 210-3341521, e-mail: [email protected]

NATIONAL BANK OF GREECE Sectoral Report May 2015 1
Research Coordinator:
Jessie Voumvaki, Senior Economist
+30 210 3341549
e-mail: [email protected]
Analysts:
Athanasia Koutouzou, Economist
+30 210 3341528
e-mail: [email protected]
Georgios Sakkas, Economist
+30 210 3341547
e-mail: [email protected]
Eirini Zampeti, Economist
+30 210 3341646
e-mail: [email protected]
9%
5%4%
1%
0%
2%
4%
6%
8%
10%
12%
Greece Spain Italy EU 27
avera
ge
shar
e
duri
ng
2001-2
014
Share of Olive Oil Production
in Agriculture
Source: Eurostat
Olive oil is one of the leading products of the Greek agricultural
sector, covering 9 per cent of total production value (compared
with 1 per cent in Europe). Greece ranks third in global olive oil
production (after Spain and Italy), with an average annual
production of about 0.3 million tons which contributes
approximately 0.4 per cent of GDP (or €750 million) per year, on
average, during the past 5 years1, compared with 0.3 per cent in
Spain and 0.1 per cent in Italy.
Led by Spain, world production of olive oil increased significantly
(about 90 per cent) over the past 25 years. While the top three
producers (Spain, Italy and Greece) continue to absorb about ½
of world olive oil consumption, the increased production was
mainly absorbed by non-producing countries, whose demand
more than doubled due to an increasing awareness of the health
benefits of olive oil compared with other vegetable oils.
During this surge in global demand for olive oil, Greece did not
succeed in exploiting its comparative advantage in terms of
quality. On the contrary, production remained low (with a
downward trend during the past 5 years), causing the Greek
market share in global production to decline from 19 per cent in
1990 to 11 per cent in 2014.
The reduction in Greek production was more than offset by lower
domestic consumption, which led to higher exports. Nevertheless,
Greece‟s export market share declined in a booming international
market. Specifically:
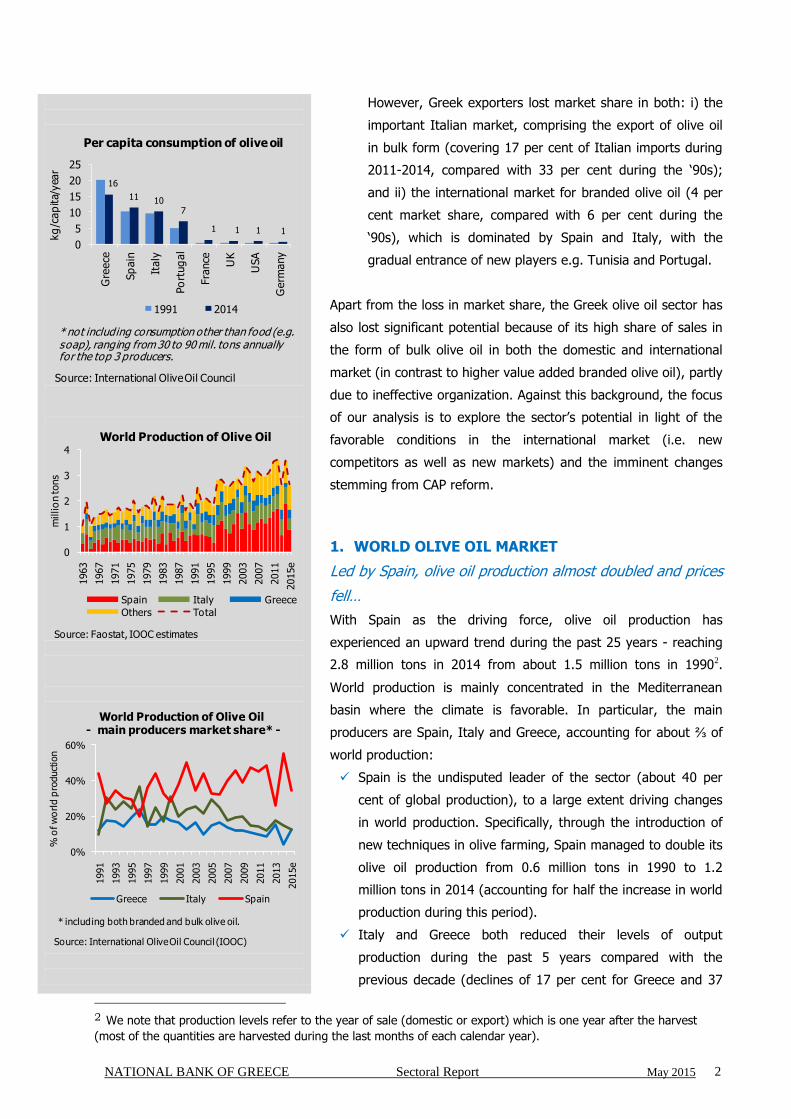
Though Greece has one of the highest levels of olive oil
consumption per capita, consumption has been declining
continuously, to 16 kg per capita in 2014 from 20 kg per
capita in 1990 (versus around 11 kg per capita in Spain and
Italy). Olive oil has been substituted by other cheaper
vegetable oils, covering 55 per cent of total vegetable oil
consumption in Greece in 2014 compared with 10 per cent
in 1980.
The export orientation of the Greek production has
increased during the past 2½ decades – in particular,
exports covered 42 per cent of production during the past 5
years compared with 35 per cent during the 1990s.
1 Excluding 2014 (harvest of 2013) when production fell sharply due to adverse weather conditions.
NATIONAL BANK OF GREECE Sectoral Report May 2015 2
16
11 107
1 1 1 1
0
5
10
15
20
25
Gre
ece
Sp
ain
Italy
Po
rtug
al
Fra
nce UK
USA
Germ
any
kg
/cap
ita/
yea
r
Per capita consumption of olive oil
1991 2014
Source: International Olive Oil Council
* not including consumption other than food (e.g. soap), ranging from 30 to 90 mil. tons annually for the top 3 producers.
0
1
2
3
4
1963
1967
1971
1975
1979
1983
1987
1991
1995
1999
2003
2007
2011
2015e
millio
n to
ns
World Production of Olive Oil
Spain Italy Greece
Others Total
Source: Faostat, IOOC estimates
0%
20%
40%
60%
1991
1993
1995
1997
1999
2001
2003
2005
2007
2009
2011
2013
2015e
% o
f w
orl
d p
roduct
ion
World Production of Olive Oil- main producers market share* -
Greece Italy Spain
Source: International Olive Oil Council (IOOC)
* including both branded and bulk olive oil.
However, Greek exporters lost market share in both: i) the
important Italian market, comprising the export of olive oil
in bulk form (covering 17 per cent of Italian imports during
2011-2014, compared with 33 per cent during the „90s);
and ii) the international market for branded olive oil (4 per
cent market share, compared with 6 per cent during the
„90s), which is dominated by Spain and Italy, with the
gradual entrance of new players e.g. Tunisia and Portugal.
Apart from the loss in market share, the Greek olive oil sector has
also lost significant potential because of its high share of sales in
the form of bulk olive oil in both the domestic and international
market (in contrast to higher value added branded olive oil), partly
due to ineffective organization. Against this background, the focus
of our analysis is to explore the sector‟s potential in light of the
favorable conditions in the international market (i.e. new
competitors as well as new markets) and the imminent changes
stemming from CAP reform.
1. WORLD OLIVE OIL MARKET
Led by Spain, olive oil production almost doubled and prices
fell…
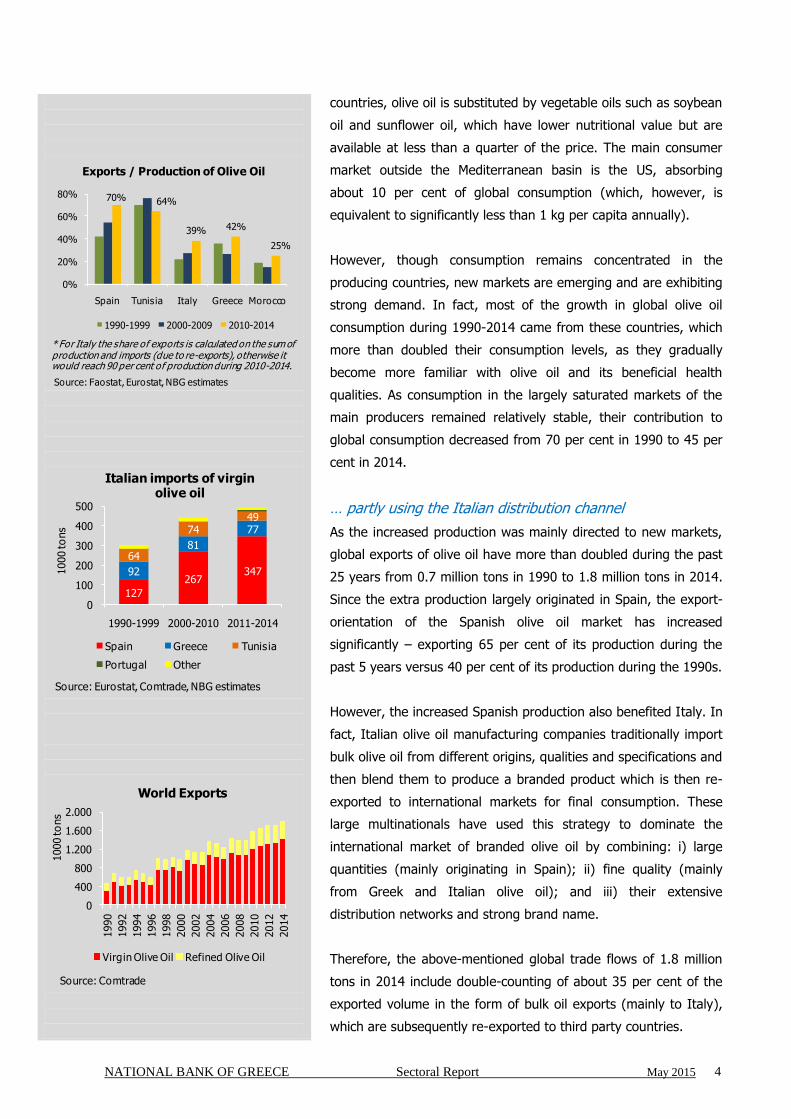
With Spain as the driving force, olive oil production has
experienced an upward trend during the past 25 years - reaching
2.8 million tons in 2014 from about 1.5 million tons in 19902.
World production is mainly concentrated in the Mediterranean
basin where the climate is favorable. In particular, the main
producers are Spain, Italy and Greece, accounting for about ⅔ of
world production:
Spain is the undisputed leader of the sector (about 40 per
cent of global production), to a large extent driving changes
in world production. Specifically, through the introduction of
new techniques in olive farming, Spain managed to double its
olive oil production from 0.6 million tons in 1990 to 1.2
million tons in 2014 (accounting for half the increase in world
production during this period).
Italy and Greece both reduced their levels of output
production during the past 5 years compared with the
previous decade (declines of 17 per cent for Greece and 37
2 We note that production levels refer to the year of sale (domestic or export) which is one year after the harvest
(most of the quantities are harvested during the last months of each calendar year).

NATIONAL BANK OF GREECE Sectoral Report May 2015 3
0
1
2
3
4
1990
1992
1994
1996
1998
2000
2002
2004
2006
2008
2010
2012
2014
€p
er kg
of o
live
oil
Olive oil Producer Price*
Producer Price Olive oil - Nominal
Producer Price Olive oil - Real terms (1990 prices)
* weighted average of producer prices in Greece, Italy and Spain based on their contribution in total production
Source: Faostat, Eurostat, NBG estimates
0,0
0,5
1,0
1,5
2,0
2,5
3,0
3,5
1992
1994
1996
1998
2000
2002
2004
2006
2008
2010
2012
2014
millio
n to
ns
World Consumption of Olive Oil
Italy Spain Greece
Other total
Source: International Olive Oil Council
US 10%
Greece 6% Turkey
5%
Morocco
4%
France
3%
Syria 3%
Portugal
2%Brazil
2%
UK 2%
Germany
2%
Japan
2%
Other 20%
Spain 18%
Italy 20%
Consumption of olive oil 2014
Source: International Olive Oil Council
per cent for Italy). As a result, they both lost market share in
world production (from 23 per cent to 14 per cent for Italy
and from 14 per cent to 11 per cent for Greece).
Other producers like Turkey, Tunisia, Morocco and Syria
almost doubled their production during 1990-2014, increasing
their market share in global production from 25 per cent to
35 per cent.
Apart from this long-term upward trend, global production
presents significant volatilities per harvest season, mainly due to
weather conditions. Indeed, global olive oil sales‟ volumes posted
a significant decline in 2013 (28 per cent) due to a severe draught
in Southern Spain in the previous year. Moreover, sales of Greek
olive oil fell significantly below the 25-year average in 2014 (0.13
million tons compared with 0.35 million tons during 1990-2013)
due to extreme weather conditions in Greece in the previous year.
Looking forward, global olive oil sales in 2015 (based on the
harvest of at the end of 2014) are expected to drop by about 25
per cent, driven by Spain and Italy, while Greek sales are
expected to reach 0.3 million tons (i.e. about 7 per cent higher
than the 5-year average).
The increasing global olive oil supply (combined with the
emergence of new lower-cost production methods as well as the
increasing market power of food manufacturers and retailers) has
put pressure on olive oil producer prices during the past 25 years.
Specifically, the international producer price3 declined by about
1.5 per cent annually, in real terms, during 1990-2014. Nominal
prices range between €2 per kg and €3.5 per kg, with prices
affected by harvest volatilities (e.g. the price increase in 2013 due
to the draught in Spain).
… with the increased quantity directed mainly to new
markets …
Olive oil production is, to a large extent, consumed in the main
producing countries. Specifically, the three main producers absorb
about 45 per cent of global consumption and have the highest
olive oil consumption per capita (about 10-12 kg annually
compared with 2.5 kg on average in other countries). In other
3 The international producer price is estimated as the weighted average of the prices in the top 3 producers
based on their contribution in production.
NATIONAL BANK OF GREECE Sectoral Report May 2015 4
70% 64%
39% 42%
25%
0%
20%
40%
60%
80%
Spain Tunis ia Italy Greece Morocco
Exports / Production of Olive Oil
1990-1999 2000-2009 2010-2014
Source: Faostat, Eurostat, NBG estimates
* For Italy the share of exports is calculated on the sum of production and imports (due to re-exports), otherwise it would reach 90 per cent of production during 2010-2014.
127
26734792
81
77
64
7449
0
100
200
300
400
500
1990-1999 2000-2010 2011-2014
1000 to
ns
Italian imports of virginolive oil
Spain Greece Tunis ia
Portugal Other
Source: Eurostat, Comtrade, NBG estimates
0
400
800
1.200
1.600
2.000
1990
1992
1994
1996
1998
2000
2002
2004
2006
2008
2010
2012
2014
1000 to
ns
World Exports
Virgin Olive Oil Refined Olive Oil
Source: Comtrade
countries, olive oil is substituted by vegetable oils such as soybean
oil and sunflower oil, which have lower nutritional value but are
available at less than a quarter of the price. The main consumer
market outside the Mediterranean basin is the US, absorbing
about 10 per cent of global consumption (which, however, is
equivalent to significantly less than 1 kg per capita annually).
However, though consumption remains concentrated in the
producing countries, new markets are emerging and are exhibiting
strong demand. In fact, most of the growth in global olive oil
consumption during 1990-2014 came from these countries, which
more than doubled their consumption levels, as they gradually
become more familiar with olive oil and its beneficial health
qualities. As consumption in the largely saturated markets of the
main producers remained relatively stable, their contribution to
global consumption decreased from 70 per cent in 1990 to 45 per
cent in 2014.
… partly using the Italian distribution channel
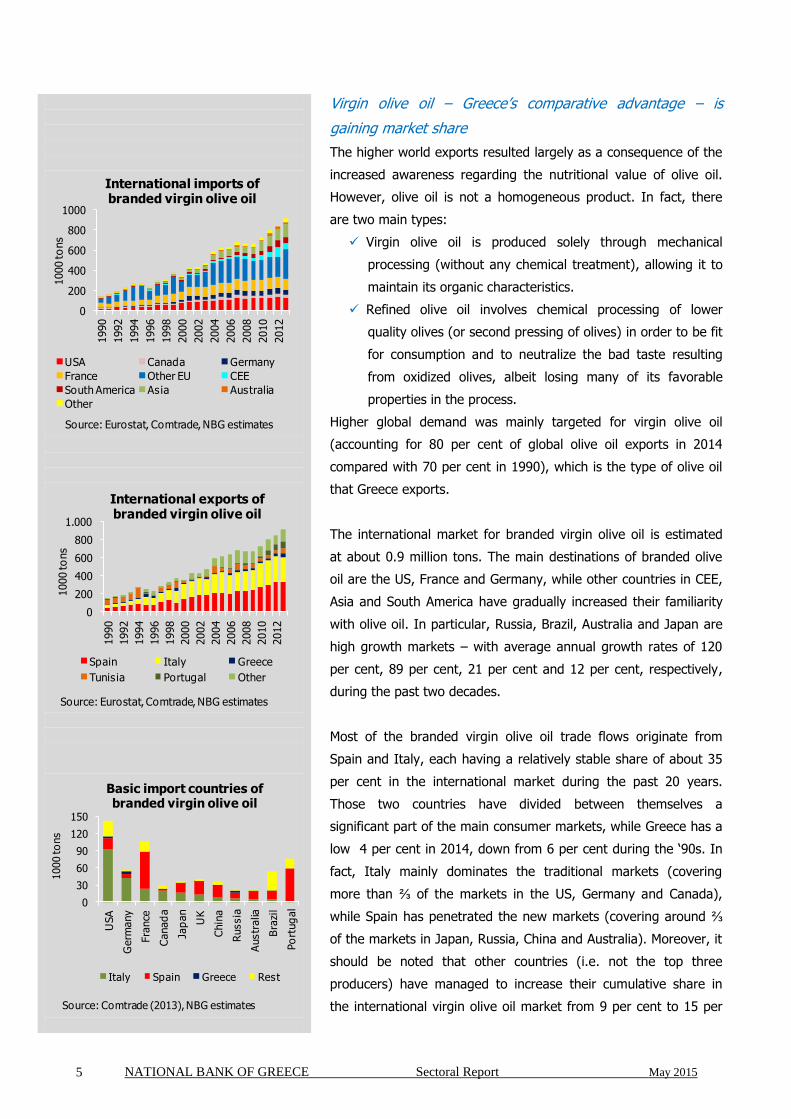
As the increased production was mainly directed to new markets,
global exports of olive oil have more than doubled during the past
25 years from 0.7 million tons in 1990 to 1.8 million tons in 2014.
Since the extra production largely originated in Spain, the export-
orientation of the Spanish olive oil market has increased
significantly – exporting 65 per cent of its production during the
past 5 years versus 40 per cent of its production during the 1990s.
However, the increased Spanish production also benefited Italy. In
fact, Italian olive oil manufacturing companies traditionally import
bulk olive oil from different origins, qualities and specifications and
then blend them to produce a branded product which is then re-
exported to international markets for final consumption. These
large multinationals have used this strategy to dominate the
international market of branded olive oil by combining: i) large
quantities (mainly originating in Spain); ii) fine quality (mainly
from Greek and Italian olive oil); and iii) their extensive
distribution networks and strong brand name.
Therefore, the above-mentioned global trade flows of 1.8 million
tons in 2014 include double-counting of about 35 per cent of the
exported volume in the form of bulk oil exports (mainly to Italy),
which are subsequently re-exported to third party countries.
NATIONAL BANK OF GREECE Sectoral Report May 2015 5
0
200
400
600
800
1000
1990
1992
1994
1996
1998
2000
2002
2004
2006
2008
2010
2012
1000 to
ns
International imports of branded virgin olive oil
USA Canada Germany
France Other EU CEE
South America Asia Australia
Other
Source: Eurostat, Comtrade, NBG estimates
0
200
400
600
800
1.000
1990
1992
1994
1996
1998
2000
2002
2004
2006
2008
2010
2012
1000 to
ns
International exports of branded virgin olive oil
Spain Italy Greece
Tunisia Portugal Other
Source: Eurostat, Comtrade, NBG estimates
0
30
60
90
120
150
USA
Germ
any
Fra
nce
Canad
a
Jap
an
UK
Chin
a
Russia
Austr
alia
Bra
zil
Po
rtug
al
1000 to
ns
Basic import countries of branded virgin olive oil
Italy Spain Greece Rest
Source: Comtrade (2013),NBG estimates
Virgin olive oil – Greece‟s comparative advantage – is
gaining market share
The higher world exports resulted largely as a consequence of the
increased awareness regarding the nutritional value of olive oil.
However, olive oil is not a homogeneous product. In fact, there
are two main types:
Virgin olive oil is produced solely through mechanical
processing (without any chemical treatment), allowing it to
maintain its organic characteristics.
Refined olive oil involves chemical processing of lower
quality olives (or second pressing of olives) in order to be fit
for consumption and to neutralize the bad taste resulting
from oxidized olives, albeit losing many of its favorable
properties in the process.
Higher global demand was mainly targeted for virgin olive oil
(accounting for 80 per cent of global olive oil exports in 2014
compared with 70 per cent in 1990), which is the type of olive oil
that Greece exports.
The international market for branded virgin olive oil is estimated
at about 0.9 million tons. The main destinations of branded olive
oil are the US, France and Germany, while other countries in CEE,
Asia and South America have gradually increased their familiarity
with olive oil. In particular, Russia, Brazil, Australia and Japan are
high growth markets – with average annual growth rates of 120
per cent, 89 per cent, 21 per cent and 12 per cent, respectively,
during the past two decades.
Most of the branded virgin olive oil trade flows originate from
Spain and Italy, each having a relatively stable share of about 35
per cent in the international market during the past 20 years.
Those two countries have divided between themselves a
significant part of the main consumer markets, while Greece has a
low 4 per cent in 2014, down from 6 per cent during the „90s. In
fact, Italy mainly dominates the traditional markets (covering
more than ⅔ of the markets in the US, Germany and Canada),
while Spain has penetrated the new markets (covering around ⅔
of the markets in Japan, Russia, China and Australia). Moreover, it
should be noted that other countries (i.e. not the top three
producers) have managed to increase their cumulative share in
the international virgin olive oil market from 9 per cent to 15 per

NATIONAL BANK OF GREECE Sectoral Report May 2015 6
3,7
2,63,0
2,32,8
2,2
3,5
0
1
2
3
4
Gre
ece
Sp
ain
Po
rtug
al
Tunis
ia
Turk
ey
Mo
rocc
o
Italy
€p
er kg
Export prices of virgin olive oil
Bulk* Branded*
Source: Eurostat, Comtrade, NBG estimates
* Bulk exports are estimated as exports to Italy (and Spain for Greece)** Average prices 2010-2013
0%
20%
40%
60%
80%
100%
1 2 1 2 1 2 1 2 1 2 1 2
Greece Spain TunisiaMoroccoTurkeyPortugal
% o
f exp
ort
s
Exports of bulk olive oil to Italy
change in share: -18% -7% -15% -3% 15% 1%
1: Period 1990-19992: Period 2011-2014
Source: Eurostat, Comtrade, NBG estimates
0
50
100
150
200
250
1991
1993
1995
1997
1999
2001
2003
2005
2007
2009
2011
2013
1000 to
ns
US Market
bottled bulk
Source: USITC
cent. Indicatively, about 15 per cent of the global increase in
branded virgin olive oil trade comprises exports from Tunisia, Syria
and Turkey to the US.
A closer look at the export prices of branded olive oil during the
past 5 years for the three main producers and newer entrants to
the market reveals differences in marketing strategies:
Italy and Greece (to a lesser extent) aim for the premium
segment of the international market, offering high quality
olive oil at a price of over €3.5 per kg.
Spain aims closer to the average consumer, with a moderate
level of both quality and price (€2.6 per kg).
Smaller producers like Turkey, Tunisia and Morocco
(gradually penetrating consumer markets) usually target
consumers seeking low prices instead of the high quality olive
oil offered by Italy and Greece. As a result, their export prices
are about 30 per cent lower than that of the three main
producers.
As already mentioned, the other international market of olive oil is
for bulk exports, which does not target final consumers but is
directed to Italy in order to be re-exported. These are low value
added exports, as is depicted in the lower export prices compared
with branded olive oil. While all countries are becoming less
dependent on Italian intermediaries to export their olive oil,
Greece remains the most dependent (channeling 69 per cent of its
exports to Italy during the past 5 years from 87 per cent in the
1990s). This is worrying, if we take into account the fact that
Italy‟s bulk channel is being gradually dominated by Spain (86 per
cent in 2014 from 38 per cent in 1994) – thus weakening the
bargaining power of Greek producers.
Another alarming development is that as the market for olive oil
matures, the bulk trade of virgin olive oil appears no longer limited
to Italy. For example, American imports of bulk olive oil have been
increasing during the past 2 decades. As a result, bulk virgin olive
oil covered 35 per cent of total imports to the US in 2014,
compared with 17 per cent in 1994.
NATIONAL BANK OF GREECE Sectoral Report May 2015 7
0%
1%
9%
9%
10%
14%
0% 5% 10% 15% 20%
France
Malta
Italy
Spain
Cyprus
Greece
% of Utilized Agricultural Area (UAA)
Olive Plantations / Total Plantations
Source: Eurostat, NBG estimates
Contribution to
olive production
Yield
(tons/ha)
Crete 30% 3,9
Peloponnese 39% 3,5
South Greece 69% 3,7
Greece total 100% 3,0
Andalousia 81% 3,3
South Spain 81% 3,3
Spain total 100% 2,5
Puglia 36% 3,3
Calabria 30% 5,5
South Italy 67% 4,0
Italy total 100% 2,9
Source: Eurostat
High olive yield regions
0%
25%
50%
75%
100%
Greece Italy Spain
Structure of Olive Plantations
<5 ha 5-20 ha 20-50 ha >50 ha
Source: Eurostat (2010), NBG estimates
2. GREEK OLIVE OIL VALUE CHAIN
Regarding structural characteristics of Greek olive oil production
and distribution processes, we focus on:
The cultivation of olives,
The processing of olives for olive oil production, and
The marketing and distribution of olive oil.
A. Cultivation of Olives
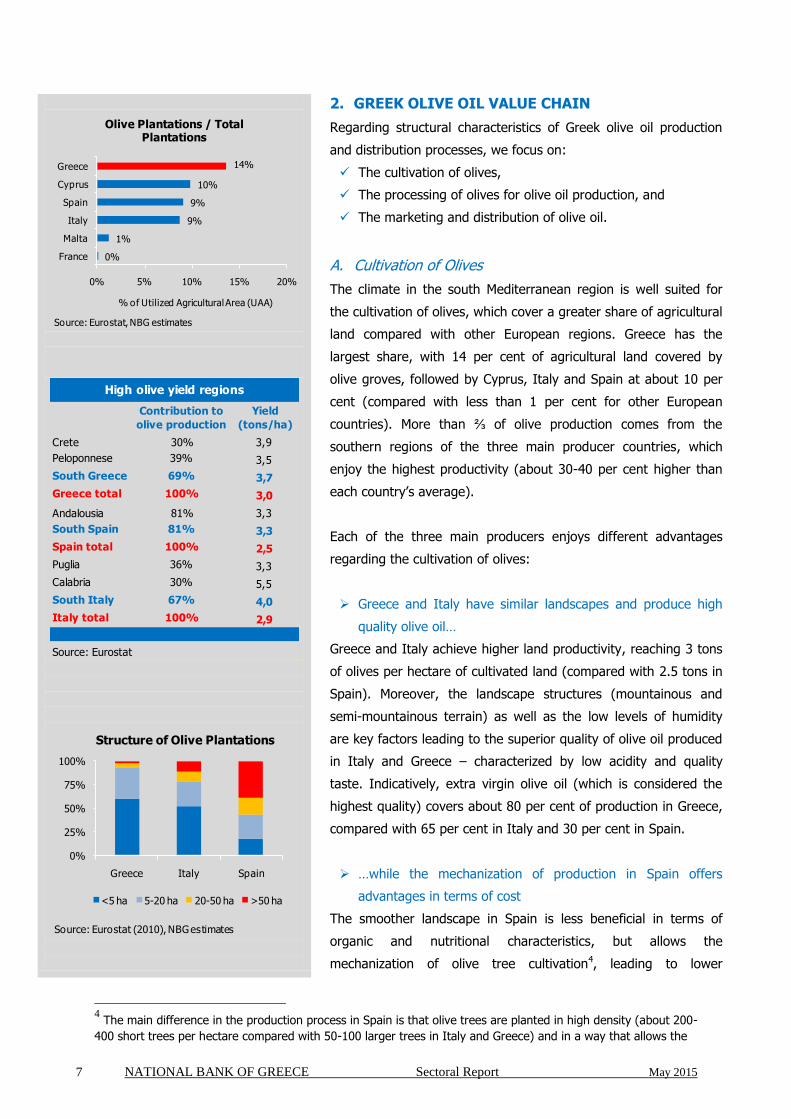
The climate in the south Mediterranean region is well suited for
the cultivation of olives, which cover a greater share of agricultural
land compared with other European regions. Greece has the
largest share, with 14 per cent of agricultural land covered by
olive groves, followed by Cyprus, Italy and Spain at about 10 per
cent (compared with less than 1 per cent for other European
countries). More than ⅔ of olive production comes from the
southern regions of the three main producer countries, which
enjoy the highest productivity (about 30-40 per cent higher than
each country‟s average).
Each of the three main producers enjoys different advantages
regarding the cultivation of olives:
Greece and Italy have similar landscapes and produce high
quality olive oil…
Greece and Italy achieve higher land productivity, reaching 3 tons
of olives per hectare of cultivated land (compared with 2.5 tons in
Spain). Moreover, the landscape structures (mountainous and
semi-mountainous terrain) as well as the low levels of humidity
are key factors leading to the superior quality of olive oil produced
in Italy and Greece – characterized by low acidity and quality
taste. Indicatively, extra virgin olive oil (which is considered the
highest quality) covers about 80 per cent of production in Greece,
compared with 65 per cent in Italy and 30 per cent in Spain.
…while the mechanization of production in Spain offers
advantages in terms of cost
The smoother landscape in Spain is less beneficial in terms of
organic and nutritional characteristics, but allows the
mechanization of olive tree cultivation4, leading to lower
4 The main difference in the production process in Spain is that olive trees are planted in high density (about 200-
400 short trees per hectare compared with 50-100 larger trees in Italy and Greece) and in a way that allows the
NATIONAL BANK OF GREECE Sectoral Report May 2015 8
13
17
19
26
28
54
0 10 20 30 40 50 60
Cyprus
France
Greece
Italy
Portugal
Spain
tons of olives per AWU (annual working unit)
Labour Force Productivity
Source: Eurostat, NBG estimates
-
2
4
6
8
2000
2001
2002
2003
2004
2005
2006
2007
2008
2009
2010
2011
2012
€p
er ho
ur
Olives real wage per hour
Greece Italy Spain
Source: FADN, Eurostat, NBG estimates
* Deflated values (2012 prices)
0.33 0.56
0.34
-
0,2
0,4
0,6
0,8
1,0
1,2
Greece Italy Spain
cost/
kg o
f o
lives
Olives production cost [2007-2012]
Farm owners' labor (incl. family)WagesOther costSpecific costs (seeds, fertilizers)Overhead (machinery, energy)
Source: FADN, Eurostat, NBG estimates
1.01 0.99
0.57
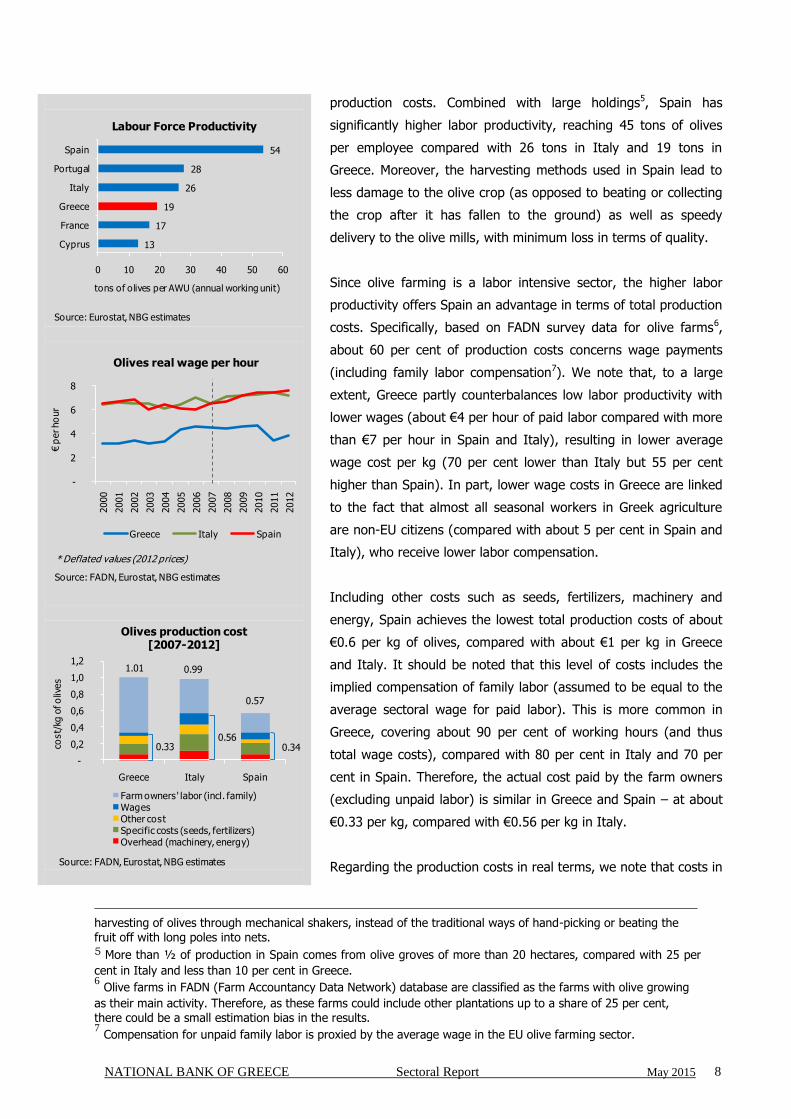
production costs. Combined with large holdings5, Spain has
significantly higher labor productivity, reaching 45 tons of olives
per employee compared with 26 tons in Italy and 19 tons in
Greece. Moreover, the harvesting methods used in Spain lead to
less damage to the olive crop (as opposed to beating or collecting
the crop after it has fallen to the ground) as well as speedy
delivery to the olive mills, with minimum loss in terms of quality.
Since olive farming is a labor intensive sector, the higher labor
productivity offers Spain an advantage in terms of total production
costs. Specifically, based on FADN survey data for olive farms6,
about 60 per cent of production costs concerns wage payments
(including family labor compensation7). We note that, to a large
extent, Greece partly counterbalances low labor productivity with
lower wages (about €4 per hour of paid labor compared with more
than €7 per hour in Spain and Italy), resulting in lower average
wage cost per kg (70 per cent lower than Italy but 55 per cent
higher than Spain). In part, lower wage costs in Greece are linked
to the fact that almost all seasonal workers in Greek agriculture
are non-EU citizens (compared with about 5 per cent in Spain and
Italy), who receive lower labor compensation.
Including other costs such as seeds, fertilizers, machinery and
energy, Spain achieves the lowest total production costs of about
€0.6 per kg of olives, compared with about €1 per kg in Greece
and Italy. It should be noted that this level of costs includes the
implied compensation of family labor (assumed to be equal to the
average sectoral wage for paid labor). This is more common in
Greece, covering about 90 per cent of working hours (and thus
total wage costs), compared with 80 per cent in Italy and 70 per
cent in Spain. Therefore, the actual cost paid by the farm owners
(excluding unpaid labor) is similar in Greece and Spain – at about
€0.33 per kg, compared with €0.56 per kg in Italy.
Regarding the production costs in real terms, we note that costs in
harvesting of olives through mechanical shakers, instead of the traditional ways of hand-picking or beating the fruit off with long poles into nets. 5 More than ½ of production in Spain comes from olive groves of more than 20 hectares, compared with 25 per
cent in Italy and less than 10 per cent in Greece. 6 Olive farms in FADN (Farm Accountancy Data Network) database are classified as the farms with olive growing
as their main activity. Therefore, as these farms could include other plantations up to a share of 25 per cent, there could be a small estimation bias in the results. 7 Compensation for unpaid family labor is proxied by the average wage in the EU olive farming sector.

NATIONAL BANK OF GREECE Sectoral Report May 2015 9
Greece Spain Italy
Total revenue 0.82 0.58 0.94
excl. subsidy 0.48 0.42 0.64
Subsidy 0.34 0.16 0.30
Cost 0.33 0.34 0.56
Cost* (incl. family
compensation)1.01 0.57 0.99
Net Income 0.49 0.24 0.38
Net Income* (incl.
family compensation)-0.19 0.01 -0.05
Source: FADN, Eurostat, NBG estimates
Olives Net income
Values in € per kg of olives (average 2007-2012)
* Cost and income are adjusted assuming family
labor gets equal compensation per hour as the
average worker in the EU olive farming sector.
41%
32%28%
0%
20%
40%
60%
Greece Italy Spain
% o
f re
venue
Contribution of subsidiesin olive farming [2007-2012]
Source: FADN, Eurostat, NBG estimates
-
0,5
1,0
1,5
2000
2001
2002
2003
2004
2005
2006
2007
2008
2009
2010
2011
2012
cost/
kg o
f o
lives
Olives real production cost*(including unpaid family labor)
Greece Italy Spain
Source: FADN, Eurostat, NBG estimates
* Deflated values (2012 prices)
Greece and Spain have followed a slightly downward trend after
2007 (-10 per cent and -15 per cent, respectively). In Greece, the
decrease was due both to lower real wages per hour (-15 per
cent) and, to a lesser extent, higher labor productivity, while Spain
posted the highest growth in labor productivity, of about 65 per
cent (with relatively stable wages per hour). On the other hand,
real production costs in Italy increased by about 10 per cent due
to higher wages per hour (up 18 per cent), as well as a greater
increase in other costs (mainly seeds and fertilizers).
Turning to olive farm revenue and profitability, Italy had the
highest revenue during 2007-2012, at €0.94 per kg of olives,
compared with €0.82 per kg in Greece and €0.58 per kg in Spain.
A disaggregation of that revenue indicates that Italy has the
highest selling price, excluding subsidies (€0.64 per kg compared
with €0.48 in Greece and €0.42 in Spain)8 and Greece has the
highest subsidy (€0.33 per kg compared with €0.3 in Italy and
€0.16 in Spain). Considering the above-mentioned production
costs per country, this leads to a profit of about €0.49 per kg in
Greece, €0.38 in Italy, while Spain remains low at €0.24 per kg
(including subsidies, but excluding the compensation of unpaid
family labor).
At this point, it is important to underline that subsidies comprise a
significant share of revenues (about 40 per cent in Greece,
compared with approximately 30 per cent in Italy and Spain
Spain). Indeed, excluding subsidies (and family payments),
profitability declines to €0.15 per kg in Greece, compared with
€0.08 in Spain and Italy. The prospective reduction in the total
level of CAP subsidies will pose significant challenges to the
sector. Specifically, the recent CAP reform requires the
convergence of income subsidies per hectare of agricultural land
between regions, irrespective of the type of farming (as opposed
to the current regime of individual support based on past
production). Considering that olive farming had been among the
high-subsidized sectors, the new CAP policy will have a large
negative effect on the sector (see BOX 1). Subsidies in 2020 are
expected to decline in Greece and Italy (about 30 per cent
decrease compared with 2007-2012), which would (ceteris
paribus) decrease profits to about €0.39 per kg and 0.3 per kg
8 Based on the average extraction rate of 0.2 kg olive oil per 1 kg of olives, these estimated prices of olives are
consistent with the producer prices of olive oil ranging between €2 and €3 per kg of olive oil (see page 3).

NATIONAL BANK OF GREECE Sectoral Report May 2015 10
0
20
40
60
80
100
120
0-2
2-5
5-1
0
10-2
0
20-3
0
30-5
0
50-1
00
>100
tons o
f o
lives
/AW
U
Labor productivity per farm size
Greece Spain Italy
Sources: Faostat, Eurostat, NBG estimates
-32%
22%
40%
-58%
-7%
7%
-60%
-40%
-20%
0%
20%
40%
<5 ha 5-50 ha >50 ha
Profit Margins* per farm size
Net profit margin adj. for unpaid labor
Net profit margin adj. for unpaid labor (excluding subsidies)
Source: FADN, NBG estimates
* weighted avg 2007-2012 for Greece, Italy and Spain
respectively. On the other hand, olive oil subsidies in Spain are
expected to remain relatively stable (with profits remaining about
€0.24 per kg of olives), mainly because of relatively lower total
CAP subsidies per hectare during 2007-2013.
It is important to note that the conclusions of the profitability
analysis change significantly if unpaid family labor is taken into
account. If family labor compensation was set equal to the
average sectoral labor cost, Greece would end up with significant
losses (about -€0.19 per kg) despite the existence of extensive
subsidies, while Italy and Spain would be in a more balanced
position (small loss -€0.05 per kg in Italy and marginal profit of
€0.01 per kg in Spain, which benefits from its more mechanized
approach).
Profitability is not uniform across all producers, since larger farms
appear to have higher labor productivity (see graph) and
consequently operate with higher profit margins. Specifically,
based on farm data for Greece, Italy and Spain during 2007-2012:
Small farms of less than 5 hectares (covering about 60 per
cent of Greek olive plantations) operate with losses (even
with the inclusion of subsidies, but adjusting for the cost of
unpaid labor); suggesting that farm owners‟ compensation
must be even lower than the average sectoral wage.
Medium farms of 5-50 hectares achieve a profit margin of
about 22 per cent (with the aid of subsidies) but have small
losses without them.
Larger farms of more than 50 hectares are more productive
and achieve profits both with and without subsidies (profit
margin of about 34 per cent and 6 per cent, respectively).
This is mostly the case in Spain, covering about 40 per cent
of olive plantations, compared with 10 per cent in Italy and
only 2 per cent in Greece).
Consequently, the small and dispersed nature of Greek farms
limits potential profits and increases dependence on subsidies and
own labor to achieve a satisfactory compensation for the owner.
The Greek landscape may not facilitate more efficient farming as
in Spain (even though there are some pilot intensive farms in the
regions of Ilia and Lakonia).
NATIONAL BANK OF GREECE Sectoral Report May 2015 11
0.190.16
0,00
0,05
0,10
0,15
0,20
0,25
3-phase mill 2-phase mill
€p
er kg
of o
live
oil
Average processing costby type of olive oil mill
Depreciation Personnel
Energy Other
Source: Chryssovalantou N., «Evaluation of 3-phaseand 2-phase technology of olive oil extraction»,National Technical University, 2010).
0%
20%
40%
60%
80%
100%
Spain Greece Italy
% o
f o
live o
il m
ills
Olive oil mills technology
Traditional press 3-phase centrifugal
2-phase centrifugal Other
Source: ARE Liguria (Italy), Electronical Technical Transfer Olive Oil Network
B. Processing of Olives for Olive Oil Production
After the harvesting of olives, the next stage in the production
process is the extraction of the olive oil, which takes place in olive
oil mills. We will examine the characteristics and efficiency of this
stage based on two significant parameters: i) the technology
used; and ii) the organization and ownership status in the sector.
i) Greek olive oil mills are less technologically advanced …
There are three main types of olive oil mills: a) traditional olive
presses; b) three-phase centrifugal mills, where the extraction
process produces olive oil, pomace and vegetation water; and c)
two-phase centrifugal mills, which are the most advanced,
producing olive oil and wet pomace. We note that pomace oil
resulting from that process of olive oil extraction is usually used
for industrial purposes only. However it can become suitable for
food consumption after it has been refined.
Summarizing the main attributes of each technology:
In traditional mills, pressure is applied to olive paste to
separate the liquid oil and vegetation water from the solid
material. This non-automatic process has a high risk of
contamination and an increase in acidity – thus decreasing
the quality of the extracted olive oil.
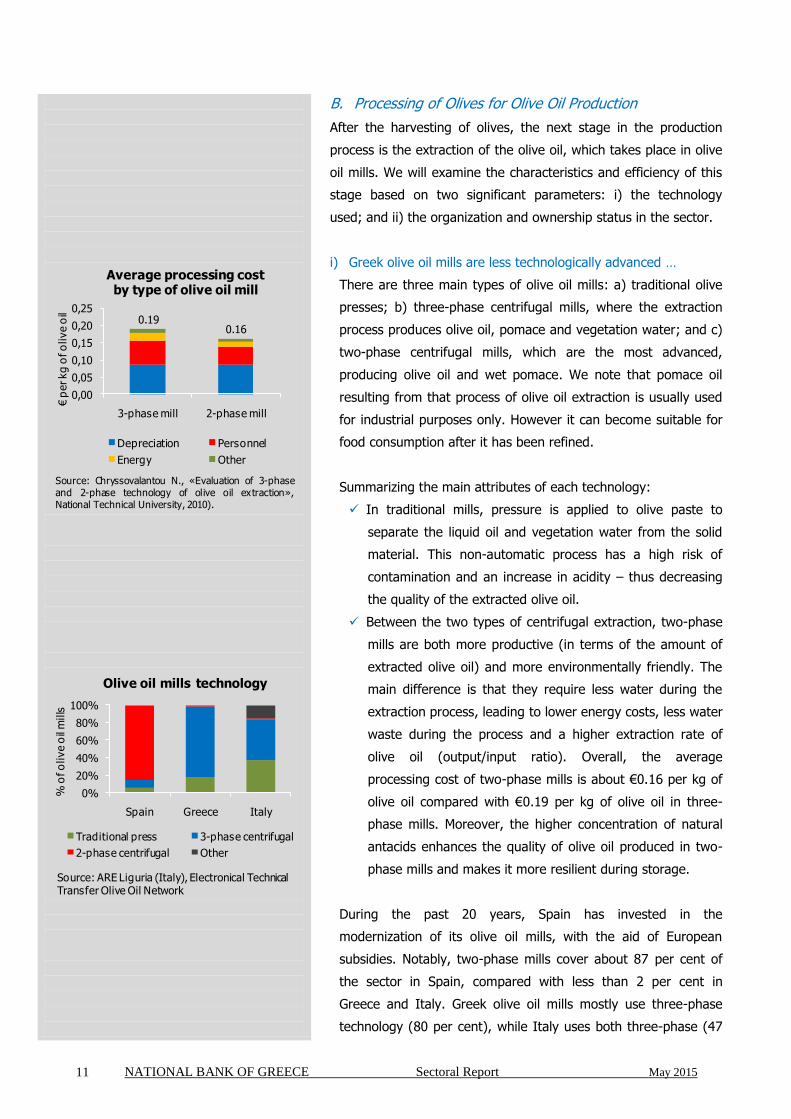
Between the two types of centrifugal extraction, two-phase
mills are both more productive (in terms of the amount of
extracted olive oil) and more environmentally friendly. The
main difference is that they require less water during the
extraction process, leading to lower energy costs, less water
waste during the process and a higher extraction rate of
olive oil (output/input ratio). Overall, the average
processing cost of two-phase mills is about €0.16 per kg of
olive oil compared with €0.19 per kg of olive oil in three-
phase mills. Moreover, the higher concentration of natural
antacids enhances the quality of olive oil produced in two-
phase mills and makes it more resilient during storage.
During the past 20 years, Spain has invested in the
modernization of its olive oil mills, with the aid of European
subsidies. Notably, two-phase mills cover about 87 per cent of
the sector in Spain, compared with less than 2 per cent in
Greece and Italy. Greek olive oil mills mostly use three-phase
technology (80 per cent), while Italy uses both three-phase (47

NATIONAL BANK OF GREECE Sectoral Report May 2015 12
70%
50%
15%
0%
20%
40%
60%
80%
Spain Greece Italy
% o
f o
live o
il p
roduct
ion
Cooperative olive oil mills
Source: USITC (August 2013), IOC presentation (June 2010)
752
173120
0
200
400
600
800
Spain Greece Italy
olive o
il p
roduct
ion (to
ns)
Average annual capacity
of olive oil mills
Source: EDOEE, (Greece) MARM (Spain), ARE Liguria (Italy)
per cent) and traditional mills (37 per cent). The promotion of
two-phase mills is expected to continue, aiming for higher
productivity combined with improved environmental protection.
ii) … and need better organization
In Greece and Spain, olive oil mills are, to a large extent, owned
by cooperatives controlled by farm owners (covering 50 per cent
and 70 per cent of olive oil production, respectively). This
organizational structure allows small farm owners to benefit from
economies of scale and increase their bargaining power against
large manufacturing companies and retailers.
On the other hand, farm owners in Italy do not follow the same
practice (cooperatives cover only 10 per cent of olive oil
production). This is mainly due to the different promotion
strategies of each country. Specifically, cooperatives often face
problems regarding quality control and traceability due to the
variety of producers (adverse selection, free-riding problems),
hindering the promotion of premium products. For Italian olive
oil producers, this is a very important factor, since they need to
ensure the promotion of high quality – branded olive oil. To that
end, it is common for small farm owners to own their private mill
and bottling unit, allowing them to market their own branded
product. On the other hand, Spain and Greece mainly market
their olive oil in bulk form (both exports and domestic
consumption – see below), which makes the need for traceability
less important.
Despite their organization in cooperatives, Greek olive oil mills
remain relatively small, with an average annual capacity of 170
tons of olive oil, compared with 120 tons in Italy and 750 tons in
Spain. More importantly, their operation is often limited to the
distribution of production subsidies to the farm owners and other
administrational activities, instead of acting as an organized
enterprise with a clear business strategy. In order to change the
Greek model towards the promotion of high quality branded
olive oil, the restructuring of the sector should be one of the
main priorities, inter alia, to comprise more vertically integrated
production, both upstream in the olive production stage, as well
as downstream in the production of branded products.
Moreover, Greek firms need larger economies of scale,
irrespective of the degree of vertical integration.

NATIONAL BANK OF GREECE Sectoral Report May 2015 13
BOX 1: Common Agricultural Policy
Since 1962, the European agricultural sector receives financial support through the Common Agricultural Policy
(CAP). However, although the EU CAP budget has followed a downward trend, from 50 per cent of the EU budget
in 2007 to 42 per cent in 2013 to an estimated 35 per cent in 2020, it is still the largest segment of the EU
budget, absorbing about €55.5 billion annually during 2014-2020.
In particular, under the new program period of 2014-2020, there are two main pillars of funds:
Pillar I mostly concerns direct payments to farm owners, as income support and to a smaller degree
market intervention measures, such as export refunds and private storage aid, which mainly serve as
a safety net tool when markets are unexpectedly destabilized (e.g. adverse weather conditions).
Pillar II provides support for long term rural development, helping farm owners modernize their farms
and become more competitive, while protecting the environment. These payments are part-financed
by the member countries as a part of their respective multiannual financial frameworks.
Moreover, the new CAP program (2014-2020) promotes measures aiming mainly towards greener, more
sustainable agriculture (through the concept of “cross-compliance”, and the introduction of the “Green Direct
Payment”) and more efficient agricultural activity. The latter is pursued through: i) stricter regulations for the
determination of active farm owners eligible for support; ii) administrational improvements; and iii) more flexibility
for member states concerning the allocation of CAP funding between the two pillars and the allocation of direct
payments to promote their individual agricultural strategy.
More importantly, the new CAP aims to the gradual convergence in the allocation of direct payments per hectare
among member states (external convergence) in order to diminish several disparities brought about by: i) historic
allocation systems; and ii) the introduction of new member states in the EU. Specifically, the target is to close ⅓
of the gap between the current level of subsidy in each member state and 90 per cent of the EU average by
2020. As Greece is one of the member states with a high direct subsidy per cultivated land (€384/ha in 2013 vs
an EU average of €293/ha), its share in the EU CAP budget is expected to fall to 3.5 per cent in 2019 from 5.6 per
cent in 2007 (approximately €2 billion annually for the period 2014-2020 compared with about €2.5 billion during
2007-2013).
0
200
400
600
800
Malt
aN
eth
erl
ands
Belg
ium
Italy
Gre
ece
Cyp
rus
Denm
ark
Slo
venia
Germ
any
Fra
nce
EU
-27
Luxe
mb
ourg
Irela
nd
Austr
iaH
ung
ary
Cze
chFin
land
Sw
ed
en
Bulg
aria
Sp
ain
U.K
.Po
land
Slo
vaki
aPo
rtug
al
Ro
mania
Lit
huania
Esto
nia
Latv
ia
€/H
ecta
re
Subsidy per Hectare
2013 2019Source: European Commission

NATIONAL BANK OF GREECE Sectoral Report May 2015 14
Implementation of CAP reforms in Greece
Against the background of the main principles of the new CAP, Greece has allocated its available funds to the two
Pillars (77 per cent in Pillar I and 23 per cent in Pillar II) by setting guidelines regarding the allocation of Pillar I
funds:
All types of farm owners are eligible for 85 per cent of annual payments, based on the following
allocation scheme:
a. arable land (absorbing 47 per cent of funds - €420/ha),
b. permanent crops (absorbing 28 per cent - €500/ha) and
c. pastures (absorbing 25 per cent - €250/ha).
Note that these funds include two distinct categories: i) the Basic Payment (55 per cent of annual
payments); and ii) the Green Direct Payment (30 per cent of annual payments) which is accompanied
by environmental criteria.
Farm owners of specific products (e.g. legumes, forage, sugar beet, hard wheat, bovine animals, goats,
rice, industrial tomato, seeds, oranges for juice and asparagus) will also receive extra subsidies. These
coupled payments will absorb 8 per cent of direct payments.
Farm owners in areas with natural constraints (e.g. mountainous areas) will absorb 5 per cent of direct
payments (transferred to pillar II).
Young farm owners (less than 40 years old) will absorb the remaining 2 per cent of direct payments (as
an incentive to join the sector and modernize the production process).
At this point, it is important to note that, in an effort to moderate the convergence process, there is a provision
for a maximum drop of 30 per cent for each farm owner per hectare during 2015-2019.
47%25%
28%
Greek CAP
Arable Areas
Pastures
Permanent Plantations
Source: OPEKEPE
55%
30%
2%
8%5%
Pillar I Decomposition
Basic Payments Greening
New & Young Farmers Coupled Payments
Transer to Pillar II
Source: OPEKEPE
Implications for the olive sector
While Greek olive producers will benefit from the fact that they will be allowed to receive the full amount of the
Green Direct Payment without the obligation to meet environmental requirements, their subsidies will suffer
through:
the reduction of the total CAP budget for Greece (about 17 per cent lower in 2019 than in 2013), and
the reduction of the share of the budget that they will receive (approximately 18 per cent in 2019 from
21 per cent in 2006).
NATIONAL BANK OF GREECE Sectoral Report May 2015 15
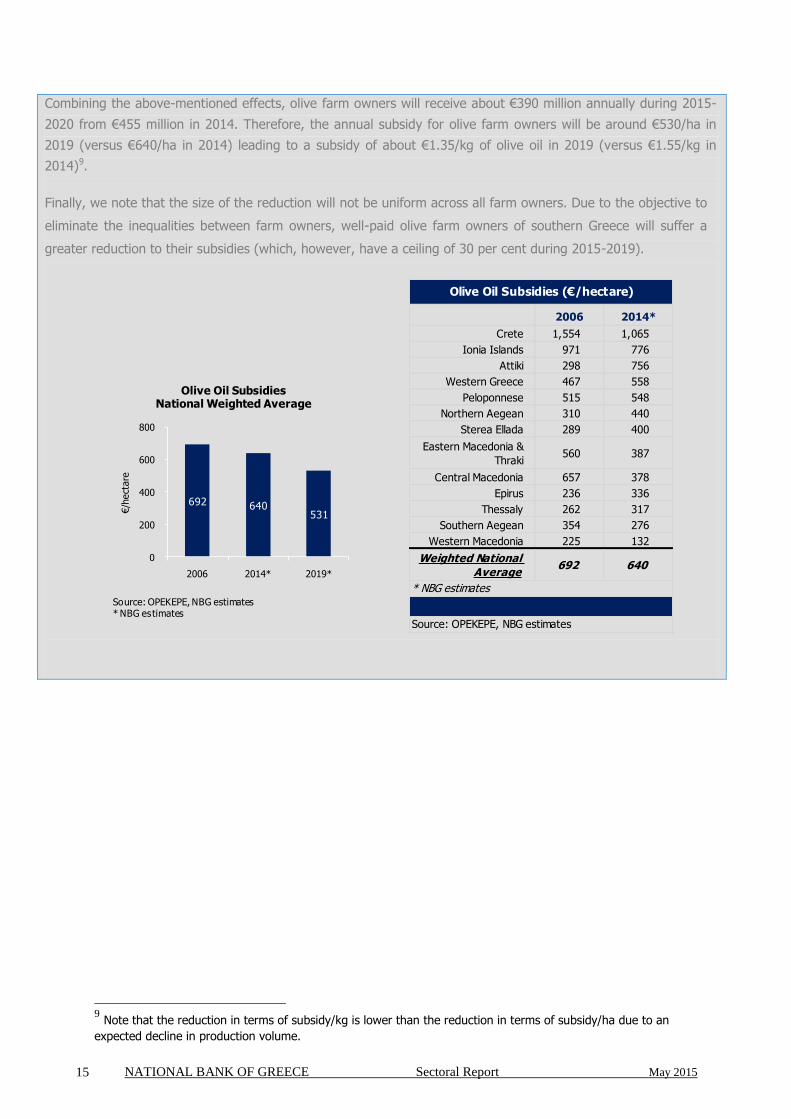
Combining the above-mentioned effects, olive farm owners will receive about €390 million annually during 2015-
2020 from €455 million in 2014. Therefore, the annual subsidy for olive farm owners will be around €530/ha in
2019 (versus €640/ha in 2014) leading to a subsidy of about €1.35/kg of olive oil in 2019 (versus €1.55/kg in
2014)9.
Finally, we note that the size of the reduction will not be uniform across all farm owners. Due to the objective to
eliminate the inequalities between farm owners, well-paid olive farm owners of southern Greece will suffer a
greater reduction to their subsidies (which, however, have a ceiling of 30 per cent during 2015-2019).
692 640 531
0
200
400
600
800
2006 2014* 2019*
€/h
ect
are
Olive Oil SubsidiesNational Weighted Average
Source: OPEKEPE, NBG estimates * NBG estimates
2006 2014*
Crete 1,554 1,065
Ionia Islands 971 776
Attiki 298 756
Western Greece 467 558
Peloponnese 515 548
Northern Aegean 310 440
Sterea Ellada 289 400
Eastern Macedonia &
Thraki560 387
Central Macedonia 657 378
Epirus 236 336
Thessaly 262 317
Southern Aegean 354 276
Western Macedonia 225 132
Weighted National Average
692 640
Olive Oil Subsidies (€/hectare)
* NBG estimates
Source: OPEKEPE, NBG estimates
9 Note that the reduction in terms of subsidy/kg is lower than the reduction in terms of subsidy/ha due to an
expected decline in production volume.

NATIONAL BANK OF GREECE Sectoral Report May 2015 16
Spain Italy Greece
Production 1.45 0.42 0.31
Imports - 0.54 -
Total 1.45 0.96 0.31
1. Domestic
consumption0.63 0.61 0.20
branded 0.32 0.41 0.05
bulk 0.24 0.19 0.13
bulk - non food 0.07 0.01 0.02
2. Exports 0.82 0.35 0.11
branded 0.41 0.35 0.03
bulk 0.41 - 0.08
* in million tons (average data for 2010-2012 due
to high volatility)
Main olive oil producers
Source: IOOC, Faostat, Comtrade, NBG estimates
Consumption
Available supply
Did not match
declared specifica
tions35%
Not suitable for food consumption18%
Impure17%
Virgin olive oil
30%
Quality of bulk olive oil
Source: "An examination of samples", Laboratory of Chemistry and Food Technology, Aristotele University Thessaloniki, 2003.
C. Marketing and Distribution of Olive Oil
After extraction in the olive mills, olive oil is distributed for
domestic consumption or exports. We note that only 27 per cent
of Greek olive oil production is distributed as a branded product
(compared with 50 per cent of production in Spain and about 80
per cent in Italy), while most of it is sold in bulk form. Bulk olive
oil distribution is a common practice in Greece for both exports
and domestic consumption. Specifically:
Domestic consumption absorbs about ⅔ of olive oil
production in Greece, of which 75 per cent is in bulk form
(compared with 50 per cent of domestic consumption in
Spain and only 32 per cent in Italy). The limited branding in
the Greek market is correlated to the high degree of self-
consumption, as Greek producers (who are small and
dispersed) keep a significant part of their production for
their relatives and friends, whereas in Italy and Spain
distribution follows more official channels. We note that
even though bulk sales, by definition, cannot be
accompanied by product quality guarantee, consumer
surveys show that bulk olive oil is considered of higher
quality (more pure) and, in most cases, is preferred by
Greek consumers, despite a price similar to that of branded
olive oil. However, scientific surveys suggest the contrary.
An examination of samples of bulk olive oil by the
Laboratory of Chemistry and Food Technology of the
Aristotle University in Thessaloniki (2003) showed that only
30 per cent was confirmed as virgin olive oil, while 35 per
cent did not fit the declared specifications, 18 per cent was
found unfit for consumption and 17 per cent was impure.
Exports absorb the remaining 35 per cent of Greek
production (compared with 36 per cent in Italy and 57 per
cent in Spain). Due to the lack of an effective export
strategy and the relevant sector organization, most of the
exported quantity (about 70 per cent) is directed to Italy in
bulk form, where it is mixed with olive oil of different origins
and then re-exported as branded Italian olive oil (as
mentioned above). This leads to two negative effects for
Greek olive oil: i) loss of value added from branding and ii)
low familiarity of foreign consumers with the taste of Greek
virgin olive oil (which is more intense than refined oils and

NATIONAL BANK OF GREECE Sectoral Report May 2015 17
Spain 9% Germany
5%
US 4%
Canada 2%
Russia 1%
UK 1%
Australia 1%Other
8%
Italy 71%
Greece: destination of exports of virgin olive oil
Source: Eurostat, USITC
* export partners of 2013 (2014 was less representative due to low level of exports)
Germany 14%
France 11%
Canada 8%
Japan 7% UK 3%
Switzerl. 2%
China 2%Belgium
2%Australia
2%
Brazil 2%Russia
2%
Other 18%
US 29%
Italy: destination of exports of virgin olive oil
* export partners 2014
Source: Eurostat, USITC
0
2
4
6
8
0,0
0,6
1,2
1,8
2,4
1995
1997
1999
2001
2003
2005
2007
2009
2011
2013
in m
illio
n €
in m
illio
n €
Average annual turnover of branded olive oil companies
Greece (left axis) Italy (left axis)
Spain (right axis)
Source: Eurostat, NBG estimates
blends).
Focusing on the manufacturing stage of the value chain, there are
about 460 companies producing branded olive oil in Greece10.
Contrary to the farming stage, the sector of branded olive oil is
highly concentrated and mainly targets the domestic market.
Specifically, consumption in Greece is dominated by two
companies, covering more than ½ of branded olive oil sales, while
another 20 per cent concerns private label products marketed by
large retailers. The export oriented segment of the Greek market
is less concentrated, with four companies covering 40 per cent of
Greek branded olive oil exports and the rest concerning mainly
cooperatives.
Compared with their competitors in Italy and Spain, Greek
enterprises are relatively small and compete at a disadvantage, as
they lack economies of scale and access to international
distribution networks. Specifically, the average annual sales of
Greek companies are about €0.7 million, compared with €2 million
in Italy and a significantly higher €7 million in Spain. We note that
the expansionary strategy of food manufacturers in Italy and
Spain during the past decade has led to the creation of powerful
groups with international presence. Indicatively, four groups
based in Spain (controlling most of the top Italian brands) cover
about ½ of global sales of branded olive oil.
In this competitive environment, there have been a considerable
number of small Greek brands which manage to reach
international markets. However, they only manage to maintain
their international presence for about one year on average11. The
small volume and short duration of those brands in international
markets, leads to low awareness of Greek branded olive oil among
foreign consumers.
The challenges become even greater considering the fact that the
distribution networks for branded olive oil are mostly controlled by
large retailers (supermarkets). A common strategy of those
retailers is to buy large quantities of branded olive oil at very low
prices that allow for promotion strategies, often acting as a loss
10
Companies that are licensed by the Ministry of Agriculture to market olive oil labeled as “Greek product”. 11
Data based on a survey by DK Consultants (2014)
NATIONAL BANK OF GREECE Sectoral Report May 2015 18
420
410
80
610
350
0
200
400
600
800
1000
Supply Demand
tho
usand
tons
Italian olive oil(supply vs. demand)
Production Imports from Spain
Imports from Greece Imports other
Consumption in Italy Exports
Source: ΙΟΟC,Comtrade,NBG estimates
* Average data for 2010-2012 due to high volatility
730
200 225
730
760
85
0
500
1.000
1.500
Spain Italy Greece
tho
usand
tons
Consumption* of olive oil
in branded or bulk form
Bulk Branded
Source: Eurostat, Faostat, NBG estimates
* Including domestic consumption and exports. * Average data for 2010-2012 due to high voliatility
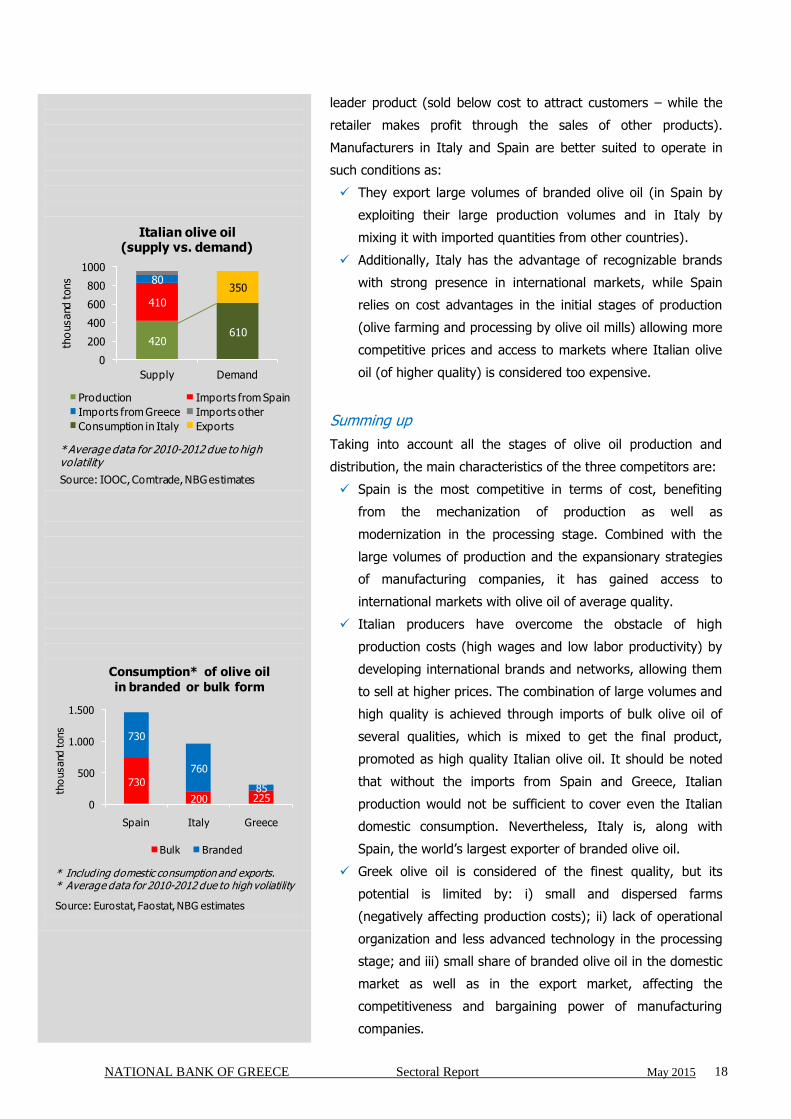
leader product (sold below cost to attract customers – while the
retailer makes profit through the sales of other products).
Manufacturers in Italy and Spain are better suited to operate in
such conditions as:
They export large volumes of branded olive oil (in Spain by
exploiting their large production volumes and in Italy by
mixing it with imported quantities from other countries).
Additionally, Italy has the advantage of recognizable brands
with strong presence in international markets, while Spain
relies on cost advantages in the initial stages of production
(olive farming and processing by olive oil mills) allowing more
competitive prices and access to markets where Italian olive
oil (of higher quality) is considered too expensive.
Summing up
Taking into account all the stages of olive oil production and
distribution, the main characteristics of the three competitors are:
Spain is the most competitive in terms of cost, benefiting
from the mechanization of production as well as
modernization in the processing stage. Combined with the
large volumes of production and the expansionary strategies
of manufacturing companies, it has gained access to
international markets with olive oil of average quality.
Italian producers have overcome the obstacle of high
production costs (high wages and low labor productivity) by
developing international brands and networks, allowing them
to sell at higher prices. The combination of large volumes and
high quality is achieved through imports of bulk olive oil of
several qualities, which is mixed to get the final product,
promoted as high quality Italian olive oil. It should be noted
that without the imports from Spain and Greece, Italian
production would not be sufficient to cover even the Italian
domestic consumption. Nevertheless, Italy is, along with
Spain, the world‟s largest exporter of branded olive oil.
Greek olive oil is considered of the finest quality, but its
potential is limited by: i) small and dispersed farms
(negatively affecting production costs); ii) lack of operational
organization and less advanced technology in the processing
stage; and iii) small share of branded olive oil in the domestic
market as well as in the export market, affecting the
competitiveness and bargaining power of manufacturing
companies.
NATIONAL BANK OF GREECE Sectoral Report May 2015 19
Against this background, a conversion to the Italian model
through a focus on differentiation and quality promotion is a
plausible strategy that would increase productivity and profits. The
certification of Greek olive oil as a high quality product would
facilitate that strategy, considering the small size of Greek
producers and their difficulty in promoting their products
independently. Currently, there are 29 labels of olive oil certified
as PDO (protected designation of origin) and PGI (protected
geographical indication) schemes, covering only 3 per cent of
Greek production. These categories could be broadened so as to
include wider regions (thus a higher share of production),
especially concerning PGI products where the rules are less strict.
More importantly there needs to be a coherent marketing
strategy, to educate consumers about Greek virgin olive oil. This
effort could comprise (i) organized campaigns by the State and/or
sector organizations to promote the Greek brand in international
markets and (ii) the cooperation between companies to create
international networks.
NATIONAL BANK OF GREECE Sectoral Report May 2015 20
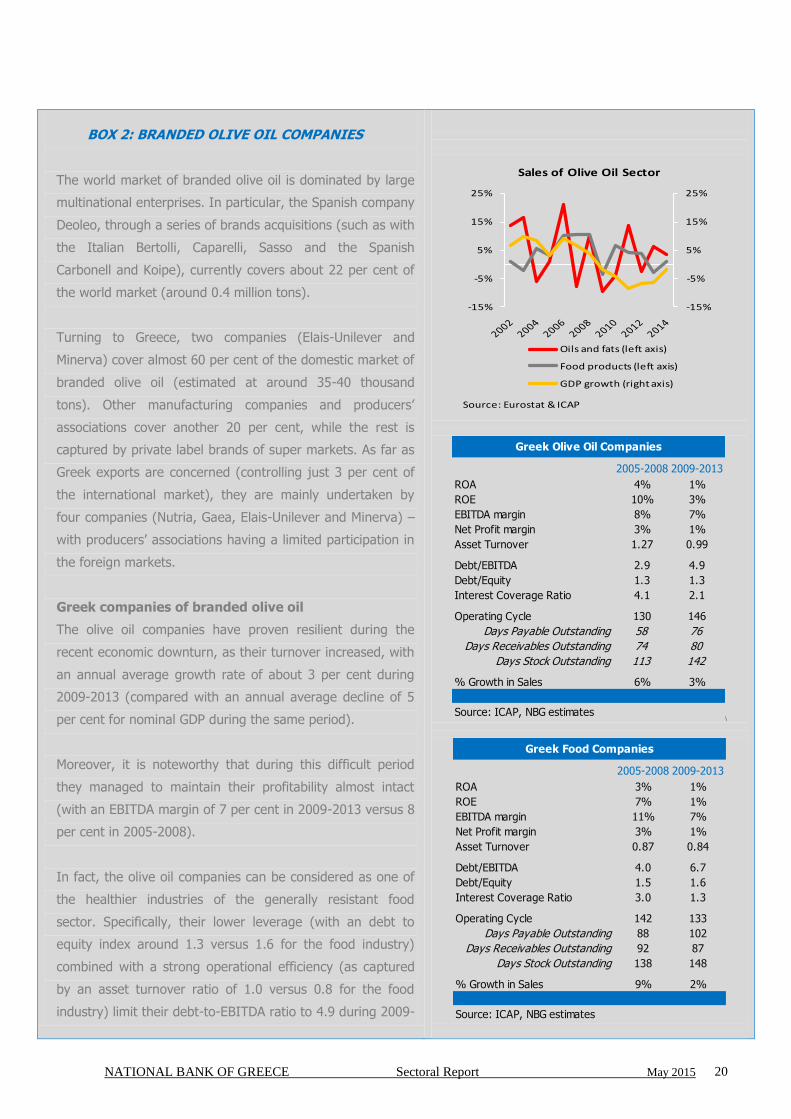
BOX 2: BRANDED OLIVE OIL COMPANIES
The world market of branded olive oil is dominated by large
multinational enterprises. In particular, the Spanish company
Deoleo, through a series of brands acquisitions (such as with
the Italian Bertolli, Caparelli, Sasso and the Spanish
Carbonell and Koipe), currently covers about 22 per cent of
the world market (around 0.4 million tons).
Turning to Greece, two companies (Elais-Unilever and
Minerva) cover almost 60 per cent of the domestic market of
branded olive oil (estimated at around 35-40 thousand
tons). Other manufacturing companies and producers‟
associations cover another 20 per cent, while the rest is
captured by private label brands of super markets. As far as
Greek exports are concerned (controlling just 3 per cent of
the international market), they are mainly undertaken by
four companies (Nutria, Gaea, Elais-Unilever and Minerva) –
with producers‟ associations having a limited participation in
the foreign markets.
Greek companies of branded olive oil
The olive oil companies have proven resilient during the
recent economic downturn, as their turnover increased, with
an annual average growth rate of about 3 per cent during
2009-2013 (compared with an annual average decline of 5
per cent for nominal GDP during the same period).
Moreover, it is noteworthy that during this difficult period
they managed to maintain their profitability almost intact
(with an EBITDA margin of 7 per cent in 2009-2013 versus 8
per cent in 2005-2008).
In fact, the olive oil companies can be considered as one of
the healthier industries of the generally resistant food
sector. Specifically, their lower leverage (with an debt to
equity index around 1.3 versus 1.6 for the food industry)
combined with a strong operational efficiency (as captured
by an asset turnover ratio of 1.0 versus 0.8 for the food
industry) limit their debt-to-EBITDA ratio to 4.9 during 2009-
-15%
-5%
5%
15%
25%
-15%
-5%
5%
15%
25%
Sales of Olive Oil Sector
Oils and fats (left axis)
Food products (left axis)
GDP growth (right axis)
Source: Eurostat & ICAP
2005-2008 2009-2013
ROA 4% 1%
ROE 10% 3%
EBITDA margin 8% 7%
Net Profit margin 3% 1%
Asset Turnover 1.27 0.99
Debt/EBITDA 2.9 4.9
Debt/Equity 1.3 1.3
Interest Coverage Ratio 4.1 2.1
Operating Cycle 130 146
Days Payable Outstanding 58 76
Days Receivables Outstanding 74 80
Days Stock Outstanding 113 142
% Growth in Sales 6% 3%
Greek Olive Oil Companies
Source: ICAP, NBG estimates\
2005-2008 2009-2013
ROA 3% 1%
ROE 7% 1%
EBITDA margin 11% 7%
Net Profit margin 3% 1%
Asset Turnover 0.87 0.84
Debt/EBITDA 4.0 6.7
Debt/Equity 1.5 1.6
Interest Coverage Ratio 3.0 1.3
Operating Cycle 142 133
Days Payable Outstanding 88 102
Days Receivables Outstanding 92 87
Days Stock Outstanding 138 148
% Growth in Sales 9% 2%
Source: ICAP, NBG estimates
Greek Food Companies

NATIONAL BANK OF GREECE Sectoral Report May 2015 21
2013 compared with 6.7 for the food sector on average.
This general outlook for the sector actually masks the
significant deviations between firms of different sizes. In
particular, small companies (with sales of less than €1
million) have shrunk by 40 per cent during 2009-2013. The
fall in their asset turnover ratio (0.47 from 0.74 during 2005-
2008) has led to net losses and a significant increase in their
debt-to-EBITDA ratio (8.4 during 2009-2013 versus 5.6
during 2005-2008).
On the other hand, the large companies of the sector (with
sales over €10 million) have had an exceptional performance
compared not only to their smaller Greek competitors but
also to their listed EU peers. Greek firms‟ high asset turnover
ratio (1.3 versus 0.5 of EU companies) counterbalances their
lower operational profitability (5 per cent versus 19 per cent
for EU companies), thus leading to a similar ROA to the EU
average. This is in fact noteworthy, as the EU listed
companies are more than 10 times bigger in terms of sales
compared with the large Greek companies.
EU
Small* Medium* Large*
ROA -3% -0.5% 2% 3%
ROE -7% -1% 4% 7%
EBITDA margin 8% 8% 5% 19%
Net Profit margin -7% -1% 1% 7%
Asset Turnover 0.47 0.66 1.28 0.47
Debt/EBITDA 8.4 5.5 4.0 3.5
Debt/Equity 1.3 1.0 1.2 0.8
Interest Coverage
Ratio-0.6 1.1 2.7 5.2
Operating Cycle 170 165 115 130
Days Payable Outstanding
150 69 72 40
Days Receivables Outstanding
101 99 72 93
Days Stock Outstanding
219 136 114 77
% Growth in Sales -10% 11% 1% -1%
Vegetable Oil Companies (2009-2013)
Source: Facset & ICAP, NBG estimates
*Small are companies with sales up to €1 million, Medium are companies with sales €1-10 million, Large arecompanies with sales more than €10 million.
Greece
EU
Small* Medium* Large*
ROA -1% 2% 4% 3%
ROE -2% 5% 10% 7%
EBITDA margin 8% 8% 7% 12%
Net Profit margin -1% 2% 3% 5%
Asset Turnover 0.74 1.06 1.42 0.64
Debt/EBITDA 5.6 3.2 3.0 4.9
Debt/Equity 1.5 1.1 1.4 1.1
Interest Coverage
Ratio0.8 3.2 3.8 3.5
Operating Cycle 107 109 130 113
Days Payable Outstanding
125 72 54 36
Days Receivables Outstanding
89 77 76 96
Days Stock Outstanding
143 104 108 53
% Growth in Sales 1% 3% 7% 10%
Vegetable Oil Companies (2005-2008)
*Small are companies with sales up to 1 million €, Mediumare companies with sales 1-10 million €, Large arecompanies with sales more than 10 million €.
Greece
Source: Facset & ICAP, NBG estimates
NATIONAL BANK OF GREECE Sectoral Report May 2015 22
5
10
15
20
25
1962
1966
1970
1974
1978
1982
1986
1990
1994
1998
2002
2006
2010
2014
ind
ex
Mediterannean diet*
Greece - Italy - Spain Other
Source: Faostat, NBG estimates
*The index consists of the consumption ofMediterannean products (cereal, fruit, vegetables,dairy and olive oil) relative to the consumption ofred meat (which is to be avoided based on theMediterannean diet) .
Elasticities t-statistics
GDP 0.75 6.51
Relative price -0.06 2.09
Mediterranean diet 0.25 2.37
GDP 2.02 7.63
Relative price -0.13 2.88
Mediterranean diet 1.19 2.61
Cost -0.17 2.36
CAP 0.22 2.83
Production -0.48 4.54
Relative bargaining
power 0.4 4.43
Source: NBG estimates
International Olive Oil Market:
Model Basic Equations
Demand of 3 countries (R 2=0,89)
Demand of rest countries (R 2=0,97)
Production of 3 countries (R 2=0,87)
Prices (R 2=0,89)
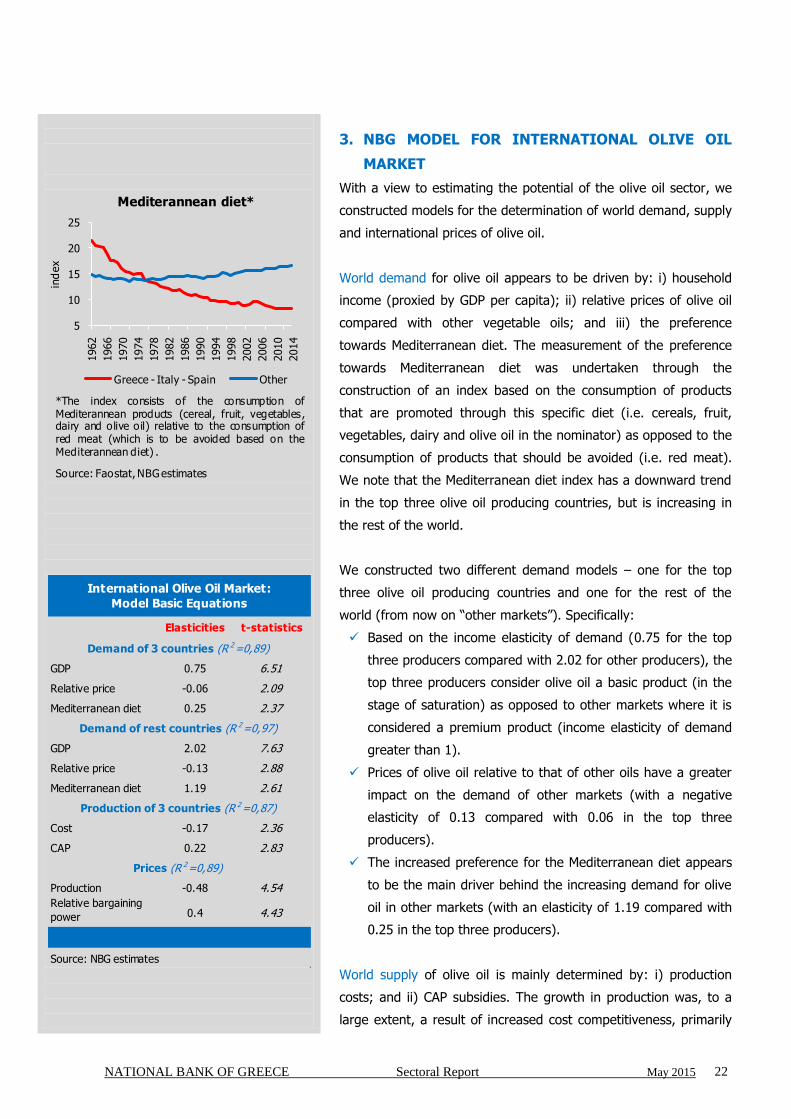
3. NBG MODEL FOR INTERNATIONAL OLIVE OIL
MARKET
With a view to estimating the potential of the olive oil sector, we
constructed models for the determination of world demand, supply
and international prices of olive oil.
World demand for olive oil appears to be driven by: i) household
income (proxied by GDP per capita); ii) relative prices of olive oil
compared with other vegetable oils; and iii) the preference
towards Mediterranean diet. The measurement of the preference
towards Mediterranean diet was undertaken through the
construction of an index based on the consumption of products
that are promoted through this specific diet (i.e. cereals, fruit,
vegetables, dairy and olive oil in the nominator) as opposed to the
consumption of products that should be avoided (i.e. red meat).
We note that the Mediterranean diet index has a downward trend
in the top three olive oil producing countries, but is increasing in
the rest of the world.
We constructed two different demand models – one for the top
three olive oil producing countries and one for the rest of the
world (from now on “other markets”). Specifically:
Based on the income elasticity of demand (0.75 for the top
three producers compared with 2.02 for other producers), the
top three producers consider olive oil a basic product (in the
stage of saturation) as opposed to other markets where it is
considered a premium product (income elasticity of demand
greater than 1).
Prices of olive oil relative to that of other oils have a greater
impact on the demand of other markets (with a negative
elasticity of 0.13 compared with 0.06 in the top three
producers).
The increased preference for the Mediterranean diet appears
to be the main driver behind the increasing demand for olive
oil in other markets (with an elasticity of 1.19 compared with
0.25 in the top three producers).
World supply of olive oil is mainly determined by: i) production
costs; and ii) CAP subsidies. The growth in production was, to a
large extent, a result of increased cost competitiveness, primarily
NATIONAL BANK OF GREECE Sectoral Report May 2015 23
0,0
0,5
1,0
1,5
2,0
2,5
1995
1997
1999
2001
2003
2005
2007
2009
2011
2013
Ind
ex
(1995=
1)
Average size trend* in each stage of olive oil distribution channel
Olive oil producersBranded olive oil companiesSupermarkets
Source: Eurostat, NBG estimates
* Weighted average annual sales of companies in Greece, Italy and Spain (EU27 average for supermarkets).
2000-
2009
2010-2014
2015-2020
GDP - top 3 0.5% -0.8% 1.5%
GDP - other 1.1% 1.9% 2,0%
Relative prices -
top 3-1,0% -0.9% 1.3%
Relative prices -
other-2.6% 4,0% 1.3%
Mediter. diet -
top 3-0.7% -0.8% -0.4%
Mediter. diet -
other0.6% 0.8% 0.5%
CAP (real) -0.9% -2.2% -2.8%
Production cost 2,0% 0.2% -0.5%
Relative bargaining
power-7.3% -5.7% -1.5%
* average annual growth rates
Source: Eurostat, Faostat, OECD, NBG estimates
International Olive Oil Market:
Assumptions
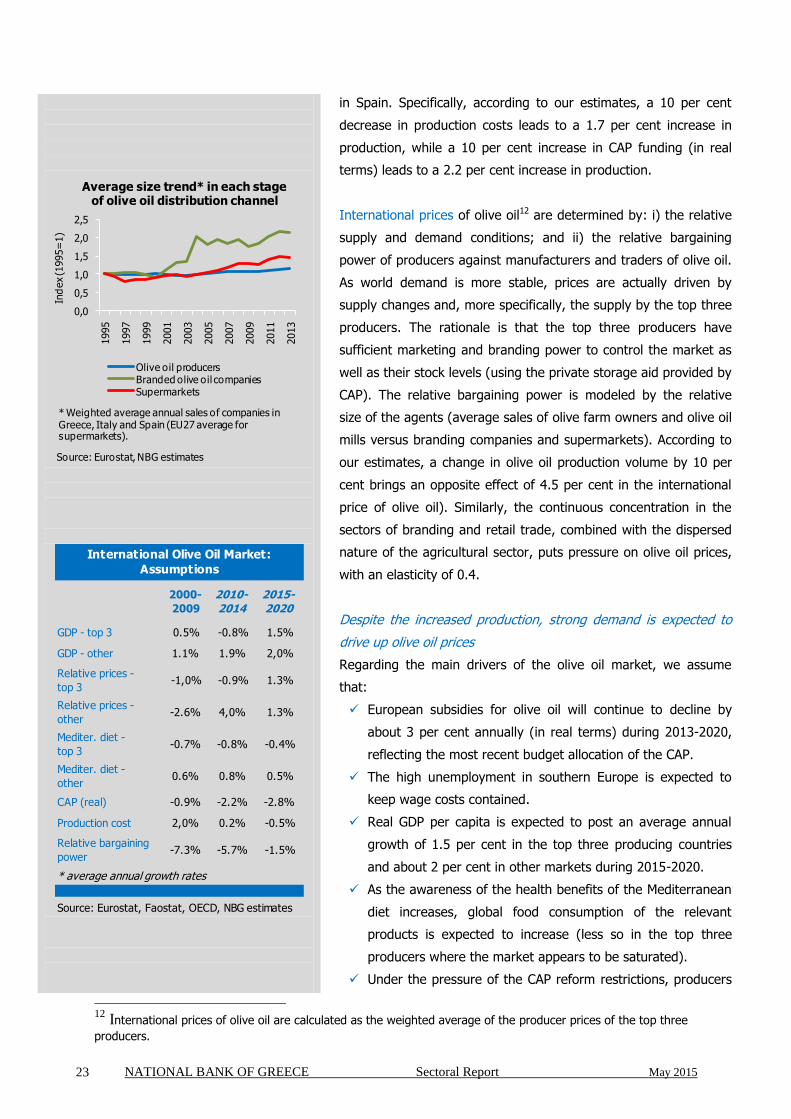
in Spain. Specifically, according to our estimates, a 10 per cent
decrease in production costs leads to a 1.7 per cent increase in
production, while a 10 per cent increase in CAP funding (in real
terms) leads to a 2.2 per cent increase in production.
International prices of olive oil12 are determined by: i) the relative
supply and demand conditions; and ii) the relative bargaining
power of producers against manufacturers and traders of olive oil.
As world demand is more stable, prices are actually driven by
supply changes and, more specifically, the supply by the top three
producers. The rationale is that the top three producers have
sufficient marketing and branding power to control the market as
well as their stock levels (using the private storage aid provided by
CAP). The relative bargaining power is modeled by the relative
size of the agents (average sales of olive farm owners and olive oil
mills versus branding companies and supermarkets). According to
our estimates, a change in olive oil production volume by 10 per
cent brings an opposite effect of 4.5 per cent in the international
price of olive oil). Similarly, the continuous concentration in the
sectors of branding and retail trade, combined with the dispersed
nature of the agricultural sector, puts pressure on olive oil prices,
with an elasticity of 0.4.
Despite the increased production, strong demand is expected to
drive up olive oil prices
Regarding the main drivers of the olive oil market, we assume
that:
European subsidies for olive oil will continue to decline by
about 3 per cent annually (in real terms) during 2013-2020,
reflecting the most recent budget allocation of the CAP.
The high unemployment in southern Europe is expected to
keep wage costs contained.
Real GDP per capita is expected to post an average annual
growth of 1.5 per cent in the top three producing countries
and about 2 per cent in other markets during 2015-2020.
As the awareness of the health benefits of the Mediterranean
diet increases, global food consumption of the relevant
products is expected to increase (less so in the top three
producers where the market appears to be saturated).
Under the pressure of the CAP reform restrictions, producers
12
International prices of olive oil are calculated as the weighted average of the producer prices of the top three
producers.

NATIONAL BANK OF GREECE Sectoral Report May 2015 24
2012-15 2020
DEMAND* 3.0 3.4
3 countries 1.3 1.4
other countries 1.7 2.0
SUPPLY* 2.8 3.3
3 countries 1.9 2.1
other countries 0.9 1.2
PRICES** 2.5 2.7
*in million tons
**Producer price: €/kg of olive oil
Source: Eurostat, Faostat, NBG estimates
International Olive Oil Market:
Estimates for basic variables
2012-15 2020
Relative cost 0.8 0.8
Relative subsidy 20% 18%
2012-15 2020
Greek share
(% top 3)16% 13%
Production (tons) 310.000 280.000
Elasticities t-statistics
Relative cost -0.54 2.48
Relative subsidy 1.23 4.71
* average 2013-2015 due to volatilities
Source: Eurostat, Faostat, NBG estimates
Greek Olive Oil: Assumptions and
Estimates
Assumptions
Estimates
Equation (R 2=0,88)
are expected to gradually increase their size and thus close
their gap with the following stages of the supply chain.
Against this background, we expect:
Demand for olive oil is expected to grow at an annual rate of
2.7 per cent during 2015-2020, with most of the increase
coming from markets other than the top three producers (1.5
per cent for the top three producers and 3.5 per cent for the
other markets).
Reflecting lower CAP support, olive oil production in the top
three producers is estimated to reach 2.1 million tons in 2020
(compared with 1.9 million tons during the past 4 years,
which however was significantly below their capacity level
due to extreme weather conditions). With other producers
continuing to increase their production (following the 10-year
average increase of 5 per cent p.a.), total olive oil production
is expected to reach 3.3 million tons in 2020 (compared with
2.8 million tons in 2014).
Despite the higher production (mostly by other producers),
prices for olive oil are expected to slightly increase to €2.7/kg
in 2020 from €2.5/kg in 2014, as (i) demand will grow faster
than the supply of the top three producers, (ii) the level of
subsidies will drop and (iii) the concentration in the sectors of
branding and retail trade seems to have run its course.
4. GREEK OLIVE OIL MARKET: LOOKING FORWARD
In the short run, Greece is expected to continue losing market
share in volume terms
The Greek share in olive oil production of the top three producers
has been following a downward trend for over a decade, from 25
per cent in 1995 to 21 per cent in 2000 and 16 per cent, on
average, during 2013-201513. The analysis indicates that the
Greek share is mainly determined by the relative position of Greek
producers compared with their main competitors in Spain and
Italy as regards: i) production costs; and ii) CAP funding for olive
oil. Specifically, an increase in the relative production cost in
Greece by 10 per cent causes a drop in the Greek market share by
5.4 per cent, while an equal increase in the relative CAP funding
increases the Greek market share by 12 per cent.
13
We apply a period average as this was a time of extreme production volatility.

NATIONAL BANK OF GREECE Sectoral Report May 2015 25
-19%
-45%-30%-15%0%
EpeirousEast Sterea Ellada
South AegeanIonian Is lands
North PeloponnisosNorth Aegean
West Sterea ElladaThessalia
South PeloponnisosWest MacedoniaEast Macedonia
ThraceCrete
Total Greece
Reduction of Olive Oil Plantations (2006-2014)
Source: OPEKEPE, NBG estimates
98 80 80
22
22 35
-
20
40
60
80
100
120
140
1990-1999 2000-2009 2010-2014
1000 to
ns
Greek exports of olive oil
Bulk (to Italy) Branded
Source: Eurostat, Comtrade, NBG
Considering the changes between 2007-2013 and 2014-2020 in
both the level of total CAP budget for each country and the
announced methods of internal convergence of subsidies per
hectare of land (see BOX 1 for CAP reform), we estimate that olive
oil subsidies will decrease in real terms by about 29 per cent in
Greece compared with 20 per cent in total for the top three
producers between 2013 and 2020. As a result, Greece‟s market
share in the three main producers‟ production is expected to
continue its downward trend, falling to 13 per cent in 2020
compared with 16 per cent on average during 2013-2015 (i.e.
from 11 per cent to 8.5 per cent of global production).
In the long run, Greece‟s potential can increase significantly if it
switches to the production of higher value-added products…
The potential of the Greek olive oil sector in terms of production
growth appears to be limited, in light of the decreasing CAP
budget and its recent reform and the fact that the profitability of
olive farms is highly dependent on subsidies. In fact, Greek
production has already followed a downward course during the
past 5 years, combined with a decrease in the area of declared
olive plantations (by 19 per cent during 2006-2014).
Against this background, there is a need for higher concentration
as well as vertical integration in the sector. In particular, relatively
larger farms (or more efficient cooperatives) could operate at a
lower production cost and attain the critical size in order to have
coherent marketing and export strategies. Moreover, better
organization along the value chain (including the stages of
processing, branding and distribution) could internalize “moral
hazard” issues and lead to the distribution of branded products of
standardized high quality.
A first step towards that direction would be to switch from bulk to
branded olive oil, both in the domestic market (75 per cent bulk,
compared with 50 per cent in Spain and 32 per cent in Italy) and
exported volumes (70 per cent bulk, compared with 50 per cent in
Spain and no bulk in Italy).
In view of the fact that Greece has one of the highest levels of per
capita consumption of olive oil, it is clear that the domestic market
could be used as the base for the Greek companies to grow.
According to our estimates, a potential shift in domestic

NATIONAL BANK OF GREECE Sectoral Report May 2015 26
2,1 2,4
2,6
3,7 3,5
0
1
2
3
4
Spain Greece Italy
€p
er kg
Export prices of virgin olive oil
Bulk* Branded*
Source: Eurostat, Comtrade, NBG estimates
* Bulk exports are estimated as exports to Italy ** Average prices 2010-2013
2,2 2,4
3,2
0
1
2
3
4
Greece Spain Italy
€p
er kg
Producer prices of bulk extra virgin olive oil*
Source: IOOC, NBG estimates
* Average producer prices 2010-2013 in Chania (Greece), Jaen (Spain) and Bari (Italy).
75%
50%
32%
0%
20%
40%
60%
80%
Greece Spain Italy
% b
ulk
olive o
il
Domestic consumption of olive oil in bulk form
Source: EDOEE, EU-MED AGROPOL Project (2005)
consumption from bulk to branded olive oil (meaning an additional
volume of about 110,000 tons14 would enter the manufacturing
stage), would increase the average annual turnover of Greek
branding companies to approximately €1.2 million – thus gradually
closing the gap with their Italian competitors. Another effect from
that shift of domestic consumption to branded olive oil would be
the increase of government revenues through the Value Added
Tax, as those extra tons would pass through official distribution
channels. With a retail price of about €6 per kg of branded olive
oil and the VAT for olive oil at 13 per cent, those revenues would
be around €85 million.
… gaining about €2.3/kg of olive oil…
Furthermore, the higher volumes of branded olive oil would allow
Greek manufacturing companies to increase their size and
compete on better terms in the international market. It should be
noted that Greece remains the country most dependent on Italian
distribution channels, as Greek exporters have not managed to
increase their penetration to the international olive oil market
during the past decade (as did countries like Tunisia, Portugal and
Turkey).The benefit from the switch from bulk to branded olive oil
is estimated at about €1.3/kg, which is the average price
difference in export prices of Greek olive oil to Italy compared with
other destinations.
In addition, another step towards the exploitation of the quality of
Greek olive oil is the better promotion of the Greek brand. We
note that even though Greece enjoys a higher share of high
quality extra virgin olive oil (80 per cent of production, compared
with 65 per cent in Italy), it has not managed to compete on
equal terms with Italian olive oil, which is considered a premium
product in the international market. This is reflected in the fact
that the producer price of Italian extra virgin olive oil is higher by
€1/kg compared with the producer price of Greek extra virgin olive
oil (€3.2/kg versus €2.2/kg on average during the past 5 years).
The branding strategy would be more effective if it covered a wide
range of products from specific regions with common
characteristics (like Messinia, Crete) or even the promotion of the
Greek brand as a whole, through products that fit certain quality
criteria.
14
In this scenario, we assume that only the family members of olive farm owners will consume olive oil in bulk
form.

NATIONAL BANK OF GREECE Sectoral Report May 2015 27
410
80
410
350 35
0
200
400
600
800
1000
Spain Italy Greece
tho
usand
tons
Olive oil exports:Three main producers
Bulk (to Italy) Branded
Source: ΙΟΟC,Comtrade,NBG estimates
80%
65%
30%
0%
20%
40%
60%
80%
100%
Greece Italy Spain
% o
f p
rod
uct
ion v
olu
me
Olive oil quality: (% extra virgin in production)
Source: USITC,:"Olive oil-conditions of competition between US and major foreign supplier industries" (August 2013), Market estimates
Australia
Belgium
Brazil
Canada
China
France
Germany
Japan
Russia
UK
USA-10%
10%
30%
50%
-5% 5% 15%
gro
wth
rate
of im
port
sd
uri
ng
2009-2
013
greek penetration(share in imports)
Penetration of Greek olive oil in basic import countries
Source: Comtrade,NBG estimates
* The size of the bubbles concerns the level of annual olive oil imports in each country.
With Greek production estimated to be around 280.000 tons in
2020, the exported quantity could stabilize in the range of
115.000 tons (of which only 35.000 tons are currently branded).
Combining the estimated effect from the shift to branded olive oil
(€1.3/kg for 80,000 tons of bulk oil) and a more efficient
marketing strategy to promote the superiority of Greek olive oil
(another €1/kg for the total of 115,000 tons) and taking into
account the higher world price (by €0.2/kg), the value of Greek
exports could increase by approximately €0.25 billion per year (to
€0.56 bn, from around €0.31 billion currently). We note that in
this case, the price of Greek exports of olive oil would be €4.7/kg
– higher than the Italian exports price – reflecting the fact that
Greek exports would be mainly in the form of extra virgin olive oil
while Italian exports also include lower quality olive oil (e.g.
refined or blends).
… with current market conditions being supportive of this change
in strategy
As the focus on targeting the premium segment of the
international market appears a necessity, it is fortunate that the
conditions in the international market currently seem favorable for
undertaking such a strategic shift:
Consumers in traditional as well as new international markets
appear to become more aware of the beneficial qualities of
virgin olive oil (in which Greece has an advantage), with its
share over refined olive oil increasing from 70 per cent in
1990 to 80 per cent in 2014. In the same vein, international
organizations and industry representatives are pushing for
more controls and higher quality standards concerning the
determination of commercial grades of olive oil. The stricter
definition of extra virgin olive oil would offer an advantage for
Greek producers (since most of the Greek production is extra
virgin olive oil) and allow them to differentiate their product.
To that end, Greek producers and olive oil mills can benefit
from the wide range of existing frameworks in Europe and
Greece (Investment Law, Horizon 2020, Leader and other
NSRF actions), supporting investments concerning the
processing of agricultural products (with Government support
that in certain areas can reach up to 50 per cent). Indicative
investments eligible for funding under these frameworks are:
purchase of farming machinery and equipment, research and

NATIONAL BANK OF GREECE Sectoral Report May 2015 28
0%
20%
40%
60%
80%
100%
US
Germ
any
Fra
nce
Canad
a
Jap
an
UK
Chin
a
Russia
Austr
alia
Bra
zil
quanti
ty
Basic import countries of branded virgin olive oil
Italy Spain Greece Other
Source: Comtrade (2013), NBG estimates
1991-
1999
2000-
2010
2011-
2014
Production of table olives
(% olives)4% 5% 9%
Exports of table olives
(% olives)8% 13% 18%
Relative export price
(table olives/ olives for oil)3.7 4.7 4.8
Source: Comtrade, IOOC, NBG estimates
Relative position of table olives to olives
0
1
2
kg
per ca
pit
a
Consumption of virgin olive oil and table olives
Virgin olive oil Table olives
Source: International Olive Council (2014), NBG estimates
development, quality control and traceability systems and
modernization of processing units (olive mills and bottling).
Concerning the potential for higher penetration in specific
international markets, the markets that have experienced
high olive oil import growth during the past five years are
China (40 per cent) and Russia (23 per cent), followed by
Japan Australia and Brazil (about 15 per cent). Greece has a
low market share in these markets, with the highest being in
Russia (15 per cent) and could easily increase its presence.
Due to the large size of these markets, even a small increase
in market share could have significant impact on Greek
export levels. It is important to note that most of these
markets have not yet been dominated by Italian oil, as is the
case in developed, more mature markets, where competition
is tougher.
Another opportunity for attracting consumers is through the
dynamic growth of the sector of table olives (see BOX 3) -
with its production volume increasing annually by 5 per cent
during the past decade and its exports volume by 9 per cent
during the same period. Therefore, table olives currently
absorb around 9 per cent of the total Greek production of
olives (from around 4-5 per cent during 1990-2010). With
olive oil being actually the juice of the olive crop, the
familiarity with the brand name and the taste of olives could
be beneficial. In addition, especially in markets with high
consumption of olives, there could be availability of
established marketing and distribution channels for Greek
olive oil.
Moreover, Greek olive oil could benefit from the tourism
sector - which attracts about 25 million foreign tourists per
year in Greece who could become customers of olive oil back
in their countries. Note that a crucial factor for the success of
this initiative is the promotion of branded olive oil in the
domestic market. Specifically, Greek restaurants should
replace the refillable bottles of bulk olive oil in their tables
with branded bottles of virgin olive oil, concurrently
guaranteeing the quality and increasing the awareness for
this Greek product. At a second stage, with proper marketing
and agro-tourism activities in oil-producing regions, high
NATIONAL BANK OF GREECE Sectoral Report May 2015 29
quality olive oil could become part of the experience of their
visit to Greece (linking the images of Greece with the
branding of olive oil). The potential of such initiatives could
be substantial – indicatively, if 1 in 10 tourists decides to
consume olive oil when they return to their countries (with a
low annual consumption of 5 kg), they could absorb the
current bulk exports and thus transform them to branded in
the course of 6 years.
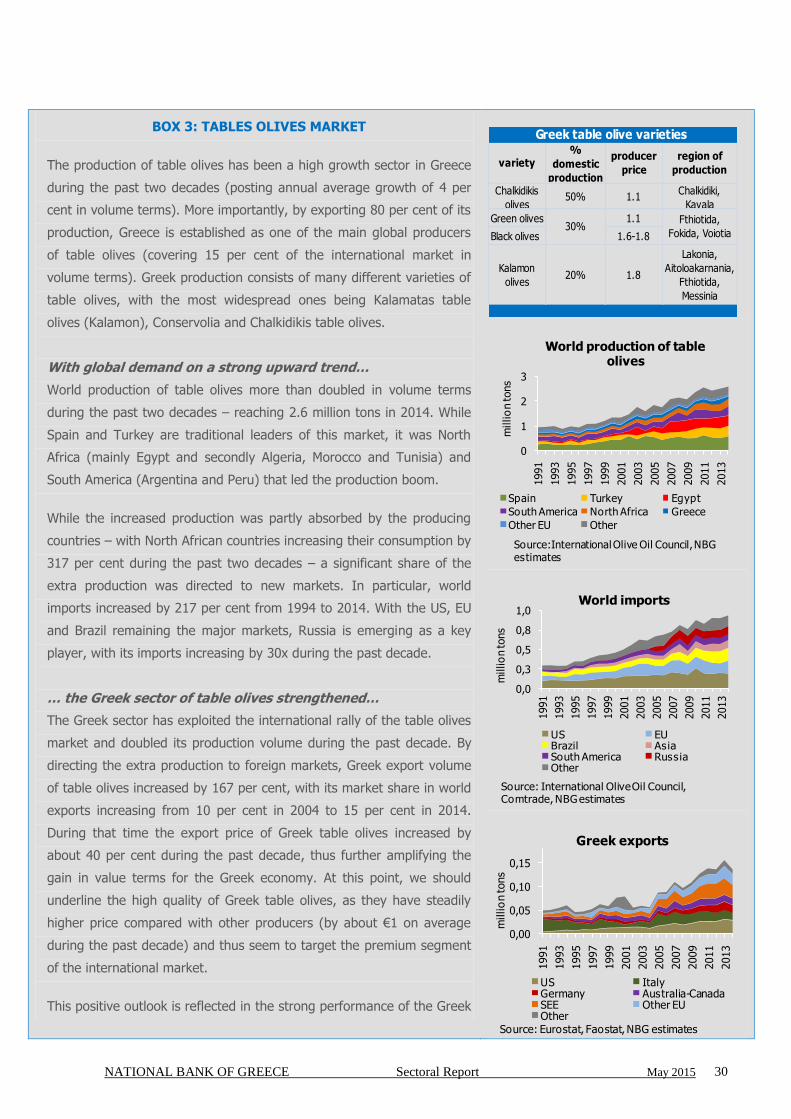
NATIONAL BANK OF GREECE Sectoral Report May 2015 30
BOX 3: TABLES OLIVES MARKET
The production of table olives has been a high growth sector in Greece
during the past two decades (posting annual average growth of 4 per
cent in volume terms). More importantly, by exporting 80 per cent of its
production, Greece is established as one of the main global producers
of table olives (covering 15 per cent of the international market in
volume terms). Greek production consists of many different varieties of
table olives, with the most widespread ones being Kalamatas table
olives (Kalamon), Conservolia and Chalkidikis table olives.
With global demand on a strong upward trend…
World production of table olives more than doubled in volume terms
during the past two decades – reaching 2.6 million tons in 2014. While
Spain and Turkey are traditional leaders of this market, it was North
Africa (mainly Egypt and secondly Algeria, Morocco and Tunisia) and
South America (Argentina and Peru) that led the production boom.
While the increased production was partly absorbed by the producing
countries – with North African countries increasing their consumption by
317 per cent during the past two decades – a significant share of the
extra production was directed to new markets. In particular, world
imports increased by 217 per cent from 1994 to 2014. With the US, EU
and Brazil remaining the major markets, Russia is emerging as a key
player, with its imports increasing by 30x during the past decade.
… the Greek sector of table olives strengthened…
The Greek sector has exploited the international rally of the table olives
market and doubled its production volume during the past decade. By
directing the extra production to foreign markets, Greek export volume
of table olives increased by 167 per cent, with its market share in world
exports increasing from 10 per cent in 2004 to 15 per cent in 2014.
During that time the export price of Greek table olives increased by
about 40 per cent during the past decade, thus further amplifying the
gain in value terms for the Greek economy. At this point, we should
underline the high quality of Greek table olives, as they have steadily
higher price compared with other producers (by about €1 on average
during the past decade) and thus seem to target the premium segment
of the international market.
This positive outlook is reflected in the strong performance of the Greek
variety%
domestic
production
producer
price
region of
production
Chalkidikis
olives50% 1.1
Chalkidiki,
Kavala
Green olives 1.1
Black olives 1.6-1.8
Kalamon
olives20% 1.8
Lakonia,
Aitoloakarnania,
Fthiotida,
Messinia
Greek table olive varieties
30%Fthiotida,
Fokida, Voiotia
0
1
2
3
1991
1993
1995
1997
1999
2001
2003
2005
2007
2009
2011
2013
millio
n to
ns
World production of table olives
Spain Turkey Egypt
South America North Africa Greece
Other EU Other
Source:International Olive Oil Council,NBG estimates
0,0
0,3
0,5
0,8
1,0
1991
1993
1995
1997
1999
2001
2003
2005
2007
2009
2011
2013
millio
n to
ns
World imports
US EUBrazil AsiaSouth America RussiaOther
Source: International OliveOil Council, Comtrade, NBG estimates
0,00
0,05
0,10
0,15
1991
1993
1995
1997
1999
2001
2003
2005
2007
2009
2011
2013
millio
n to
ns
Greek exports
US ItalyGermany Australia-CanadaSEE Other EU Other
Source: Eurostat, Faostat, NBG estimates
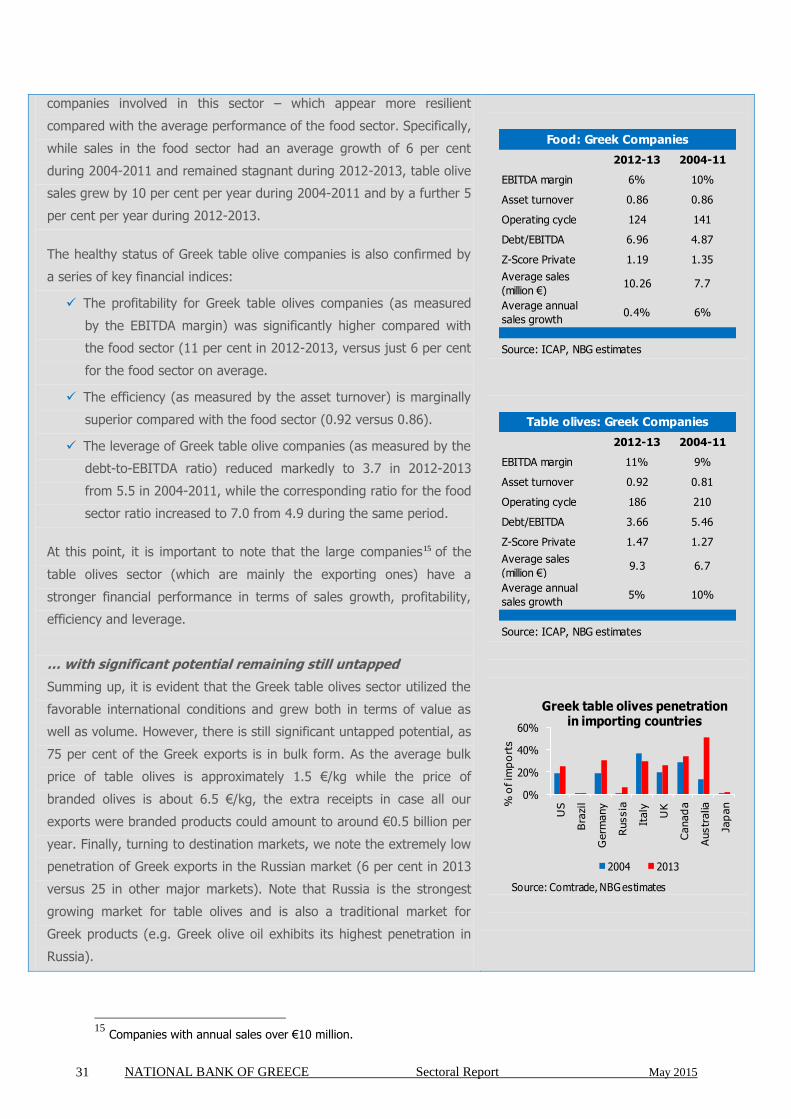
NATIONAL BANK OF GREECE Sectoral Report May 2015 31
companies involved in this sector – which appear more resilient
compared with the average performance of the food sector. Specifically,
while sales in the food sector had an average growth of 6 per cent
during 2004-2011 and remained stagnant during 2012-2013, table olive
sales grew by 10 per cent per year during 2004-2011 and by a further 5
per cent per year during 2012-2013.
The healthy status of Greek table olive companies is also confirmed by
a series of key financial indices:
The profitability for Greek table olives companies (as measured
by the EBITDA margin) was significantly higher compared with
the food sector (11 per cent in 2012-2013, versus just 6 per cent
for the food sector on average.
The efficiency (as measured by the asset turnover) is marginally
superior compared with the food sector (0.92 versus 0.86).
The leverage of Greek table olive companies (as measured by the
debt-to-EBITDA ratio) reduced markedly to 3.7 in 2012-2013
from 5.5 in 2004-2011, while the corresponding ratio for the food
sector ratio increased to 7.0 from 4.9 during the same period.
At this point, it is important to note that the large companies15 of the
table olives sector (which are mainly the exporting ones) have a
stronger financial performance in terms of sales growth, profitability,
efficiency and leverage.
… with significant potential remaining still untapped
Summing up, it is evident that the Greek table olives sector utilized the
favorable international conditions and grew both in terms of value as
well as volume. However, there is still significant untapped potential, as
75 per cent of the Greek exports is in bulk form. As the average bulk
price of table olives is approximately 1.5 €/kg while the price of
branded olives is about 6.5 €/kg, the extra receipts in case all our
exports were branded products could amount to around €0.5 billion per
year. Finally, turning to destination markets, we note the extremely low
penetration of Greek exports in the Russian market (6 per cent in 2013
versus 25 in other major markets). Note that Russia is the strongest
growing market for table olives and is also a traditional market for
Greek products (e.g. Greek olive oil exhibits its highest penetration in
Russia).
2012-13 2004-11
EBITDA margin 6% 10%
Asset turnover 0.86 0.86
Operating cycle 124 141
Debt/EBITDA 6.96 4.87
Z-Score Private 1.19 1.35
Average sales
(million €)10.26 7.7
Average annual
sales growth0.4% 6%
Source: ICAP, NBG estimates
Food: Greek Companies
2012-13 2004-11
EBITDA margin 11% 9%
Asset turnover 0.92 0.81
Operating cycle 186 210
Debt/EBITDA 3.66 5.46
Z-Score Private 1.47 1.27
Average sales
(million €)9.3 6.7
Average annual
sales growth5% 10%
Source: ICAP, NBG estimates
Table olives: Greek Companies
0%
20%
40%
60%
US
Bra
zil
Germ
any
Russia
Italy
UK
Canad
a
Austr
alia
Jap
an%
of im
po
rts
Greek table olives penetration in importing countries
2004 2013
Source: Comtrade, NBG estimates
15
Companies with annual sales over €10 million.
NATIONAL BANK OF GREECE Sectoral Report May 2015 32
NATIONAL BANK OF GREECE
This report is provided solely for the information of professional investors who are expected to make their own investment decisions without undue reliance on its contents. Under no circumstances is it to be used or considered as an offer to sell, or a solicitation of any offer to buy. Any data provided in this bulletin has been obtained from sources believed to be reliable. Because of the possibility of error on the part of such sources, National Bank of Greece does not guarantee the accuracy, timeliness or usefulness of any information. The National Bank of Greece and its affiliate companies accept no liability for any direct or consequential loss arising from any use of this report.
SECTORAL REPORT
May 2015