of muscular endurance, and vomax was predicted from the heart rate response to a sub-a maximal...
TRANSCRIPT

~-!.I! l t ) l .
[)pf(' n ·
1) c L L
() F
( " i (1 '· .. I ' i .l
: t • ~, ~ r ~- • ~- -' _,·;..
l ,
t .-. , -:
F ' I) ( ~ I \ 1 I L l F () !vi E l) I C ~ I N E
. I• ~ , 1 r ' ( . \ . (

APRIL 1986 DCIEM No. 86--22
RELATIONSHIP OF FIELD TESTS
TO LABORATORY TESTS OF
MUSCULAR STRENGTH AND ENDURANCE,
AND MAXIMAL AEROBIC POWER
U N L i I IT E D,--,5TRi3UT IONII P I T E E
D.G. Bell
I. Jacobs
Defence and Civil Institate of Environmental Medicine
1133 Sheppard Avenue West, P.O. Box 2000
Downsview, Ontario M3M 3B9
DEPARTMENT OF NATIONAL DEFENCE - CANADA
DTICJUN 11986- UNCLASSIIED A/ S L ECT E
* lDTMUl=flON SEMM-- B
D-io tbutiof Uu lm it
-2-
4. ABSTRACT
The purpose of this study was to evaluateCfthe relationship between established laboratory tests of
selected physical fitness components and a field test battery (EXPRES) presently used annually to
evaluate the physical fitness of $ personnel. Muscular strength, muscular endurance and maxi-
mal aerobic power (V0 2 rafc were evaluated in 33 male personnel. The EXPRES test battery in
cluded isometric handgrip dynamometry as an idicator of strength, pushups and situps as indica-
tors of muscular endurance, and VOmax was predicted from the heart rate response to a sub-A
maximal step-test. The laboratory measures of strength consisted of maximal isokinetic and
isometric contractions of the body's large muscle groups performed on a computerized strength
evaluation system. Maximal power generated during a 30 s cycle ergometer sprint( gate-T~wt)
was used as the laboratory measure of muscular endurance. VYOsa~x was measured directly dur-
ing exhaustive cycle exercise. When correlation coefficients were calculated for the various field
and laboratory tests, the values ranged from 0.46 - 0.67 for, muscular strength, 0.49 - 0.58 for
muscular endurance, and 0.65 for V 2m. All correlation coefficients were statistically significant
(p<0.01), but the standard errors about the regression lines were quite large. The EXPRES test
battery is considered appropriate for the gross fitness evaluation for which it was designed, but
users should be made aware of the rather large room for error in fitness evaluation. Seventeen of
the subjects performed the EXPRES and the laboratory tests before and after 12 weeks of hy-
draulic resistance weight training. The laboratory test results suggested that training induced im-
provements occurred in all of the fitness components evaluated. The EXPRES test battery was
not sensitive to these changes.
Accessloo
0 Dist
,QUALITY

-3-
INTRODUCTION
In view of the possible benefits of strength training in improving human per-
* formance during +G z exposure, a standard circuit training program has been
introduced by the CF Directorates of Preventive Medicine and Physical Educa-
tion, Recreation and Amenities (DPERA) at all bases where the CF-18 aircraft is
* presently, or will be, in service. The Applied Physiology Section, Biosciences
Divison, at DCIEM was requested by DPERA to evaluate the effects of adherence
to the training program on selected physiological and physical fitness com-
0 ponents. The results, published separately (1), showed that twelve weeks of cir-
cuit training with hydraulic resistance equipment resulted in increased lean body
mass, increased muscular strength, and increased maximal aerobic power (1).
• DPERA is also interested in knowing whether the EXPRES fitness test bat-
tery (2) is a valid means of evaluating the adaptations to the program described
above. In addition, the EXPRES test battery is being considered as a tool to test
0 whether military personnel are able to meet, as yet to be determined, minimum
physical fitness standards. Therefore, this report addresses two specific questions:
A. what is the relationship between EXPRES test values and esta-
0 blished laboratory test values of muscle strength, muscular endurance,
and maximal aerobic power ( O2 max);
B. are there concomitant and commensurate changes in both
0 EXPRES and laboratory test values after physical training.
METHODS
Subjects. The subjects were 33 male personnel from CFB Moose Jaw who were
aircrew, more specifically jet flight instructors and flight control personnel.
Although several of the subjects were engaged in regiflar physical activity, none
• could be classified as an elite athlete. Their physical characteristics are describe(l
I F
-4-
in Table 1.
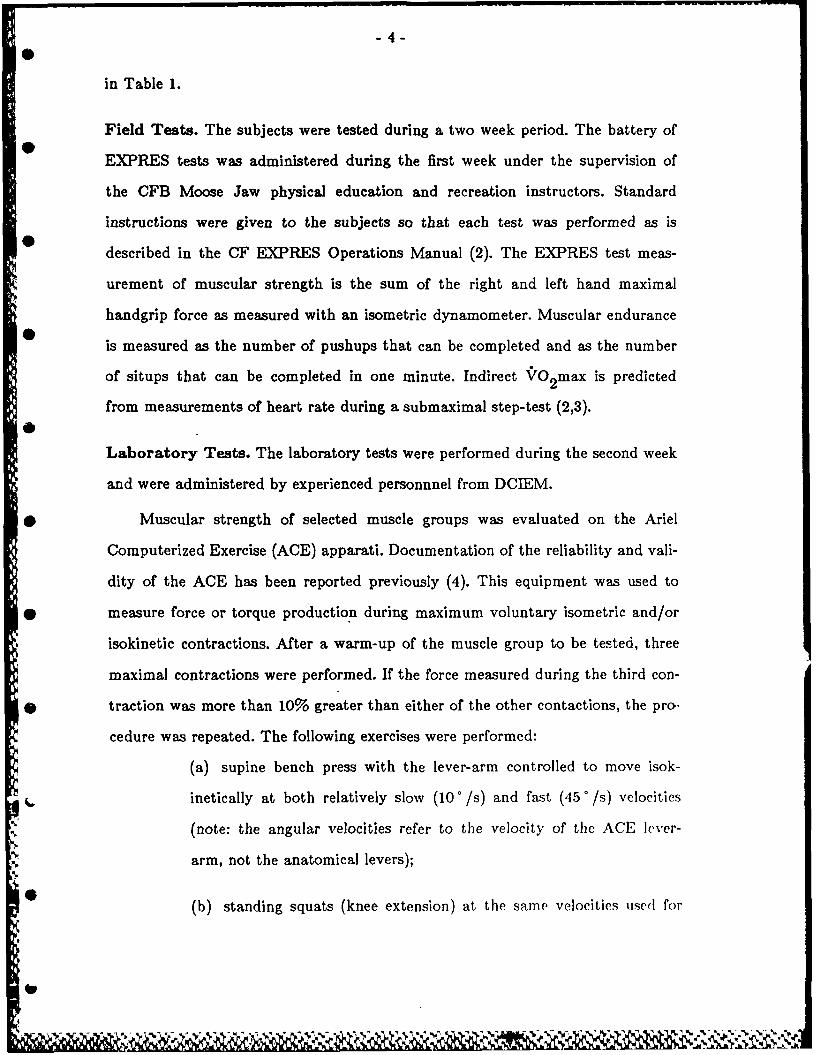
Field Tests. The subjects were tested during a two week period. The battery of
EXPRES tests was administered during the first week under the supervision of
the CFB Moose Jaw physical education and recreation instructors. Standard
instructions were given to the subjects so that each test was performed as is
described in the CF EXPRES Operations Manual (2). The EXPRES test meas-
urement of muscular strength is the sum of the right and left hand maximal
handgrip force as measured with an isometric dynamometer. Muscular endurance
is measured as the number of pushups that can be completed and as the number
of situps that can be completed in one minute. Indirect VO2 max is predicted
from measurements of heart rate during a submaximal step-test (2,3).
Laboratory Tests. The laboratory tests were performed during the second week
and were administered by experienced personnnel from DCIEM.
* Muscular strength of selected muscle groups was evaluated on the Ariel
Computerized Exercise (ACE) apparati. Documentation of the reliability and vali-
dity of the ACE has been reported previously (4). This equipment was used to
• measure force or torque production during maximum voluntary isometric and/or
isokinetic contractions. After a warm-up of the muscle group to be tested, three
maximal contractions were performed. If the force measured during the third con-
• traction was more than 10% greater than either of the other contactions, the pro.-
cedure was repeated. The following exercises were performed:
(a) supine bench press with the lever-arm controlled to move isok-
inetically at both relatively slow (10 /s) and fast (45 /s) velocities
(note: the angular velocities refer to the velocity of the ACE lever-
arm, not the anatomical levers);
5 (b) standing squats (knee extension) at the same velocities uised for
the bench press;
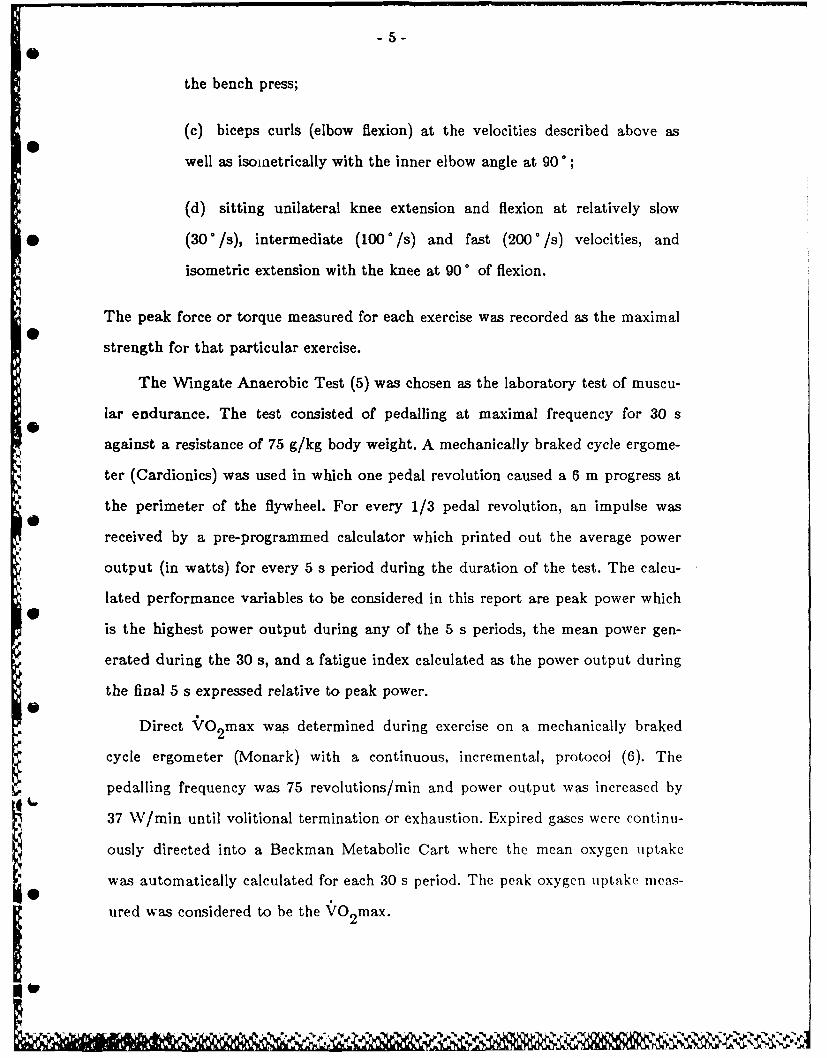
(c) biceps curls (elbow flexion) at the velocities described above as
well as isometrically with the inner elbow angle at 90 ;
(d) sitting unilateral knee extension and flexion at relatively slow
0 (30 0 /s), intermediate (100 * /s) and fast (200 /s) velocities, and
isometric extension with the knee at 90 0 of flexion.
The peak force or torque measured for each exercise was recorded as the maximal
strength for that particular exercise.
The Wingate Anaerobic Test (5) was chosen as the laboratory test of muscu-
lar endurance. The test consisted of pedalling at maximal frequency for 30 s
against a resistance of 75 g/kg body weight. A mechanically braked cycle ergome-
ter (Cardionics) was used in which one pedal revolution caused a 6 m progress at
the perimeter of the flywheel. For every 1/3 pedal revolution, an impulse was
received by a pre-programmed calculator which printed out the average power
output (in watts) for every 5 s period during the duration of the test. The calcu-
lated performance variables to be considered in this report are peak power which
is the highest power output during any of the 5 s periods, the mean power gen-
erated during the 30 s, and a fatigue index calculated as the power output during
the final 5 s expressed relative to peak power.
Direct VO2 max was determined during exercise on a mechanically braked
cycle ergometer (Monark) with a continuous, incremental, protocol (6). The
pedalling frequency was 75 revolutions/min and power output was increased by
37 W/min until volitional termination or exhaustion. Expired gases were continu-
ously directed into a Beckman Metabolic Cart where the mean oxygen uptake
was automatically calculated for each 30 s period. The peak oxygen uptake meas-
ured was considered to be theVO2 max.
-6-
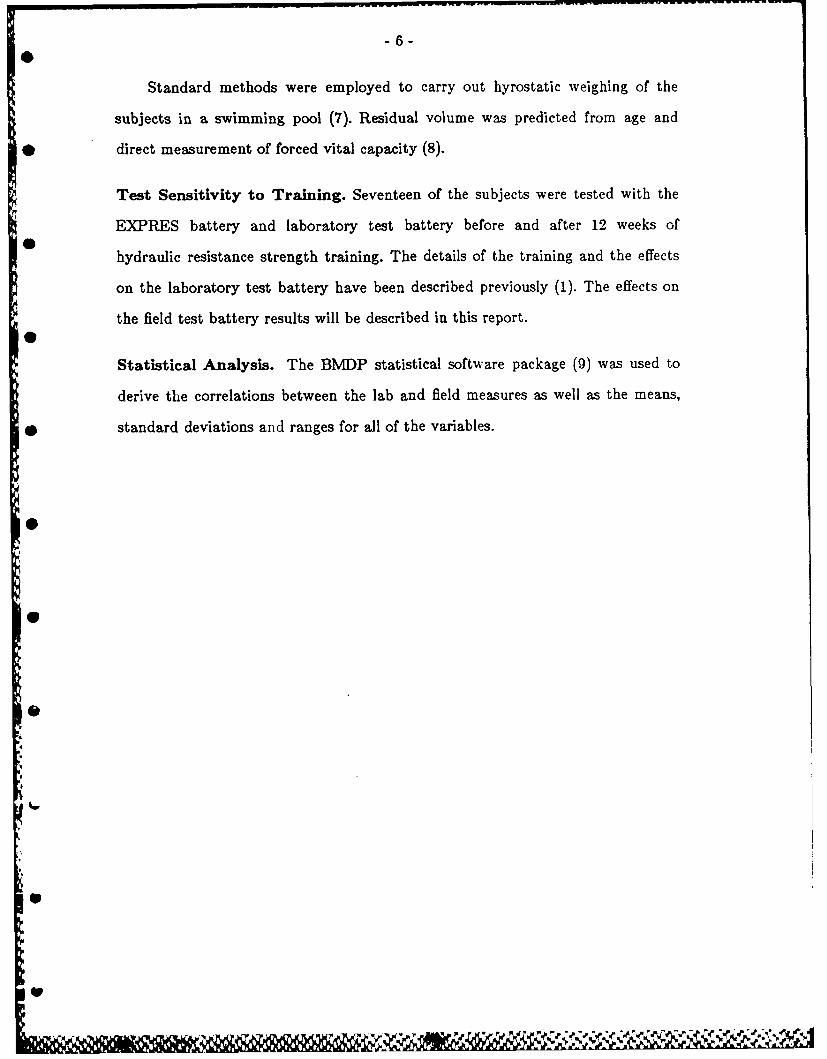
Standard methods were employed to carry out hyrostatic weighing of the
subjects in a swimming pool (7). Residual volume was predicted from age and
• direct measurement of forced vital capacity (8).
Test Sensitivity to Training. Seventeen of the subjects were tested with the
EXPRES battery and laboratory test battery before and after 12 weeks of
hydraulic resistance strength training. The details of the training and the effects
on the laboratory test battery have been described previously (1). The effects on
the field test battery results will be described in this report.
Statistical Analysis. The BMDP statistical software package (9) was used to
derive the correlations between the lab and field measures as well as the means,
• standard deviations and ranges for all of the variables.
S
S.
0-
S"
S

-7-
RESULTS AND DISCUSSION
Mean values, standard deviations and ranges for the field and laboratory testbatteries are listed in Tables 2 and 3, respectively. Table 4 lists the correlation
coefficients calculated between the laboratory and field tests of the same fitness
component. The pre and post training values for the laboratory and EXPRES
tests for seventeen of the subjects are shown in Table 5.
Strength. Based on the present EXPRES classification system the subjects
achieved only the minimum required for muscular strength for their age group.
The correlation between handgrip force and the various laboratory strength tests
were all statistically significant (p<0.01) and ranged from r=0.46 to r=0.65.
The highest correlations were observed for isokinetic elbow flexion at the rela-
tively rapid angular velocity, and for isokinetic knee extension at the relatively
slow velocity. Although the correlation coefficients between the laboratory and
field strength tests were statistically significant, Figures 1 and 2 show a large
scatter of the data about the regression line.
A test of dynamic strength would be more reflective of actual strength
0 demands than is the isometric handgrip test, but the desire for a field test that
can be executed simply, quickly, and inexpensively has led to the use of maximal
isometric handgrip strength. Tornvall (10) showed that static handgrip strength
0 was correlated (p<0.001) with upper body and lower body isometric strength in a
large military population. Bernauer and Bonanno (11) demonstrated a high corre-
lation (r=0.75) between handgrip and elbow flexion strength, but their subject
sample included both male and female subjects in contrast to the present study.
Other studies have reported correlations similar to those we report for isometric
handgrip strength vs. dynamic strength of other muscle groups (12-15). Dynamic
and static muscular strength measures of identical muscle groups can be expected
to be more highly correlated than when isometric strength of one muscle group is

-8-
compared to the dynamic strength of another muscle (14,15). This is supported
by the results of the present study where the correlations for maximal isometric
.and isokinetic strength of the elbow flexors ranged from 0.48 to 0.65. The
corresponding correlation coefficients ranged from 0.77 to 0.80 for the relationship
between isometric and isokinetic knee extension.
* The sum of the maximal forces and torques generated during the laboratory
tests was used as a global indicator of strength and was plotted against handgrip
force (Figure 3). The resulting correlation coefficient (r=0.69) was higher than
* when any individual laboratory strength test was plotted against handgrip force,
confirming Tornvall's report of an identical correlation coefficient between
handgrlp force and the sum of maximal isometric forces of twenty muscle groups
* (10). These results support the use of static handgrip strength as a gross indicator
of strength of larger muscle groups.
Strength training studies have demonstrated that handgrip strength is not
significantly changed in spite of marked increases in strength of larger muscle
groups (16,17). This finding was confirmed in the present study where there was
no significant change in handgrip force in spite of increased strength in several of
the laboratory strength tests (Table 5). In fact nine of the 17 subjects showed
decreased maximal handgrip force after the 12 week strength training program.
Thus, although the static handgrip test is useful for cross-sectional or inter-
CP subject comparisons, its use to evaluate the short-term effects of strength training
is questionable.
Muscular endurance. According to the EXPRES classification system, the
present subjects are classified as good or excellent according to their scores for
situps and pushups, respectively. The correlations between these field measures
and indices of the \Vingate Test were moderate, but statistically significant, raung-
ing from 0.49 to 0.58.
4P
%

-9-
The validity of the Wingate Anaerobic Test as a measure of anaerobic power
and muscular endurance is well established (18-21). The arm cranking version is
0 significantly correlated with sprint swimming performance times of competitive
swimmers (20). The leg version, used in the present study, correlates with sprint
running performance (21). Considering that different muscle groups are involved
_ in each exercise, the significant correlations between the Wingate Test values and
the pushups or situps were impressive. In terms of the sensitivity to strength
training, pushups, but not situps, were significantly increased after training
9 (Table 5). This is not surprising since no abdominal exercises were included in the
training program (1).
Endurance fitness. Although the aield and laboratory tests of VO2 max were
more highly correlated than field and laboratory tests of other fitness components
(Figure 4), only 42% of the variation in the direct measurement could be
*explained by the predictive method. Similar correlations between direct measure-
ments of rO 2max and the step-test predicted values have been reported previ-
ously (22-24). The mean predicted "VO 2max was significantly higher (p<0.001)
than the mean directly measured VO2 max by 6.2 ml/kg/min. In one case this
over-estimation amounted to 14 ml/kg/min which meant that some subjects were
categorized as being highly fit when they were actually below average according
to the present EXPRES classification system. A similar criticism of the use of this
step-test as a predictor of V O max was raised by Bonen et al. (25).2
It should be remembered that in both the present study and that of Bonen
et al. (25) the VO2 max was detetermined during cycle ergometry, which can yield
a 10 to 15% lower value than does treadmill ergometry (26). The difference
between a 'true' V O2 max and the value predicted by a step test may be
significantly smaller than that observed in the present study. When Bell and
Allen (22) compared predicted and directly measured treadmill VO.,nmax valites.
. , . - -.

- 10-
they found a mean difference of only 2 ml/kg/min for 97 subjects of varying ages
and a correlation coefficient of 0.67. Although the prediction of VO2 max by the
I step-test tends to consistently overestimate the maximal aerobic power of
younger individuals and underestimate fit older individuals (22), it generally can
be considered as being a valid and reliable means of evaluating the aerobic fitness
0 of large numbers of subjects. With regard to training sensitivity, the subject sub-
sample increased their predicted V O2 max significantly but the mean increase was
very small and within the methodological error of the technique used to predict
0 VrO 2 max (Table 5) (24).
SUMMARY
4P A. Statistically significant correlations were measured between each of the
EXPRES test components and an established laboratory test of the corresponding
physical fitness component. However, the statistical significance of the relation-
* ships does not preclude major errors in fitness evaluation with the field tests.
This point is aptly demonstrated in Figure 4, where the wide scatter of the data
about the regression of the indirectly measured V'O2 max on the directly measured
*O VO2 max was so great that one subject was evaluated as being fit when he was
very unfit.
B. The results suggest that the EXPRES test battery is not a sensitive tool to
evaluate longitudinal adaptations to a short-term physical training program such
as that prescribed for high performance aircraft personnel. In light of the con-
sideration being given to minimum fitness standards for the CF. these results
emphasize the necessity for the CF to have access to a laboratory test battery.
such as that described in this report, when accurate, reliable, and valid physical
fitness evaluations are required.
'9

-11-
REFERENCES
1. Jacobs, I., D.G. Bell, J. Pope, and S.W. Lee. Effect of 12 weeks of hydraulic
resistance circuit training on physical fitness components relevant to
+Gztolerance. DCIEM Report No. 85-R-38, 1985.
* 2. CF EXPRES. Operations Manual. Dept. of National Defence. Stock No.
03GS.1002W-1-D73. Serial No. 2G1-0245, adopted 14 Feb. 1983.
3. Minister of State, Fitness and Amateur Sport. Standard Test of Fitness:
Operations Manual. Health and Welfare, Canada, Fitness and Amateur Sport,
Ottawa, 1979.
* 4. Jacobs, I., and J. Pope. Measurement reproducibility and validity of a compu-
terized system for muscle strength evaluation. DCIEM Report No. 84-C-75, 1984.
5. Bouchard, C., A.W. Taylor, and S. Dulac. Testing maximal anaerobic power
and capacity. In: Physiological Testing of Elite Athletes. J.D. MacDougall, H.A.
Wenger, and H.J. Green, Eds., Canadian Association of Sports Sciences, 1982,
pp. 61-73.
6. Myles, W.S., and R.J. Toft. A cycle ergometer test of maximal aerobic power.
Eur. J. Appl. Physiol. 49:121-129, 1982.
7. Bell, D.G., and K.M. Cox. Measurement of body composition of Canadian
Forces personnel. DCIEM Report No. 84-C-17, 1984.
8. Wilmore, J.II. A simple method for determining residual lung volume. J. Appl.
Physiol. 27:96-100, 1969.
9. Dixon, W.J. (Ed.) 3MDP Statistical Software. Los Angeles: University of Cali-
iornia Press, 1.083.
iv[ * ''o 'AJAK.~A'L ~ * ~ ~
- 12-
10. Tornvall, G. Assessment of physical capacities with special reference to
evaluation of maximal voluntary isometric muscle strength and maximal working
0 capacity. Acta Physiol. Scand. 201: (Supplement) 1-102, 1963.
11. Bernauer, E.M., and J. Bonanno. Development of physical profiles for specific
jobs. J. Occup. Med. 17:27-33, 1975.
12. Robertson, D.W. Relationship of dynamic strength, static strength and body
weight to mental and muscular tasks. In: Proceedings of the Defence Research
* Group Seminar on the human as a limiting element in a military system.
Toronto: DCIEM, 1983.
13. Rasch, P.J., and I.D. Wilson. The correlation of selected laboratory tests of
physical fitness with military endurance. Mil. Med. 129:256-258, 1964.
14. Whitley, J.D., and L.G. Allan. Specificity vs. generality in static strength
• performance: review of the literature. Arch. Phys. Med. Rehab. 52:371-375, 1971.
15. Otis, J.C., R. Warren, and J. Deland. Relationship between isometric and
isokinetic muscle torque. Med. Sci. Sports Exercise 13:128, 1981.
16. Jette, M., K. Sidney, J. Barsalou, M. Regimbal, and W. Montelpare. Effects
*of heavy resistance weight training on measures of upper body strength and body
40 composition in young women. Can. J. Appl. Sport Sci. 10:15P, 1985.
17. Marcinik, E.J., J.A. Hodgdon, J.J. O'Brien, and K. Mittleman. Fitness
changes of naval women following aerobic based programs featuring calesthenics
or circuit weight training exercise. Eur. J. Appl. Physiol. 54:231-236, 1985.
18. Jacobs, ., 0. Bar-Or, .1. Karlsson, R. Dotan, P. Tesch, 1P. Kaiser, and 0.
hinhar. Changes in niiscle metabolites in males with 30 see exhaustive exercis,.
- 13-
Med. Sci. Sports Exercise 14:457-460, 1982.
19. Inbar, 0., R. Dotan, and 0. Bar-Or. Aerobic and anaerobic components of a
thirty second supramaximal cycling task. Med. Sci. Sports Exercise 8:51, 1976.
20. Bar-Or, 0. Le test anaerobie de Wingate: characteristiques et applications.
• Symbioses 13:157-172, 1981.
21. Inbar, 0., P. Kaiser, R. Dotan, 0. Bar-Or, R. Schele and J. Karlsson. Rela-
tionship between leg muscle fiber type distribution and leg exercise performance.
Int. J. Sports Med. 2:154-159,1981.
22. Bell, D.G., and C.L. Allen. An evaluation of the Standard Test of Fitness for
*CF male personnel. DCIEM Report No. 83-R-08, 1983.
23. Bailey, D.A., R.J. Shephard, and R.L. Mirwald. Validation of a self-
administered home test of cardio-respiratory fitness. Can. J. Appl. Sport Sci.
1:67-78, 1976.
24. Jette, M., J. Campbell, J. Mongeon, and R. Routhier. The CHFT as a pred-
* ictor of aerobik capacity. Can. Med. Assoc. J. 114:680-682, 1976.
25. Bonen, A., J. Gardener, J. Primrose, R. Quigley, and D. Smith. An evalua-
tion of the Canadian Home Fitness Test. Can. J. Appl. Sports Scd. 2:133-136,
1977.
26. McArdle, W., F. Katch, and G. Pechar. Comparison of continuous treadmill
and bicycle test for max V0 2. Med. Sci. Sports 5:156-160, 1973.
9

Figure 1. Thre relaitionishipj of peak torquie gener'atedI dIurinig imaximnal knjee ext er-
Sioni at a1 "low vrgr~r~eocity to the sumi of left -and right hiand maximal
* isometric hanrd-ri p force.
0) r=0.66Y =6.23 +0.14WxSyx=303
0CO
0- 27
* C0
Cx
* a)
Q)C
90 108 126 144
Handgrip Force (kg)

-15 -
Figure 2. '[he relationship of peak force gencrrnded d uinig (1 bow flexion at a fastangular velocity to thle sum of left and right hand maximal isometric handgrip
force.
Y- r= 0.6545- Y= 11-58+0-17(x)
0-1 Syx 3.76
0 39
LLC00
0t~0
Handgrip Force (kg)
I bjjjj W

Figure 3. The relationship of an indeIx 01 wvholc body streiigtli to the sum of left
and right hand maximal isometric handgrip force.
r =0-69y = 232.27+3-97(X)Sy~x =79-6
0 900-0)0
0 800-
* EU) 700
* ~0)
-600
500
81 99___117____ 135
Handgrip Force (kg)

-17 -
Figure 4. The relationship of directly measured \ O 2max during cycle ergomietry
to a predicted VfO 2max based on the heart rate response to step-test ergometry.
56-0
* CM
__ 48
00
E
r= =062Y=11-81+0.64WX
R 32- Syx=5-47
40 48 56 64
Predicted V02 max(mi.kg-1 min-')

Table 1.Physical characteristics of subjects (n=33 males).
Variable Mean SD Range
Height (cm) 179.9 7.0 167.0-195.5
Weight (kg) 82.9 15.8 59.8-129.7
Age (yrs) 30.5 6.6 22-45
Body Fat (%) 17.6 8.6 4.7-46.0
Table 2.
Field measures of Table 2. Field measures of strength (sum of left+right hand
* isometric handgrip force), muscular endurance (pushups and situps), and maximal
aerobic power (VrO 2 max estimated from heart rate response to CHFT step test).
Variable Mean SD Range
Handgrip force (kg) 104.4 18.8 72.0-148.0
Pushups (number) 39 16 12-90
Situps (number) 39 11 16-56
Predicted " O2 max (ml/kg/min) 49.0 6.8 38.6-61.9
0 v

Table 3.Laboratory measurements of muscle strength, muscular endurance as indicatedby Wingate Test indices, and maximal aerobic power.
Exercise Units Mean SD Range
• Strength
Bench press 10 */s kg 93.1 19.9 60-14345 /s kg 42.8 8.4 28-62
Squatting knee extensions 10 ° /s kg 183.7 35.3 116-26545 ° /s kg 91.7 19.8 62-156
Elbow flexion 100 /s kg 48.7 9.0 37-7245 0 /s kg 28.7 4.7 22-47
isometric kg 42.0 5.6 33-58
Sitting knee extensions 30 /s kgm 20.5 4.0 15-35100: js kgm 17.9 3.3 13-28200 /s kgm 15.4 2.4 12-23isometric kgm 26.6 6.8 15-43
Sitting knee flexions 300 /s kgm 12.7 2.7 7-21100 /s kgm 12.1 2.3 9-21200 ° /s kgm 11.1 2.3 8-21
Muscular Endurance
Wingate test peak power W/kg 10.4 1.3 7.9-12.2
• Wingate test mean power W/kg 7.7 1.1 5.4-9.4
Wingate test fatigue index % 52.0 9.2 23.3-71.8
Maximal Aerobic Power
VO2 max ml/kg/min 42.8 7.3 24.-56.2
2

Table 4.Pearson correlation coefficients between selected field and laboratory measures of strength, muscu-lar endurance and aerobic power.
Laboratory Test Field Test Correlation Coefficient
9trenath Measurements* Bench press (10 /s) Handgrip 0.62
Bench press (45 /s) Handgrip 0.62
Squat (10 /s) Handgrip 0.51Squat (45 /s) Handgrip 0.59
Elbow flexion (100*"/s) Handgrip 0.60Elbow flexion (45 /s) Handgrip 0.67
Elbow flexion (isometric) Handgrip 0.49
Knee extension (30 Is) Handgrip 0.66Knee extension (100 /s) Handgrip 0.62Knee extension (200 /s) Handgrip 0.53Knee extension (isometric) Handgrip 0.50
Knee flexion (30 /s) Handgrip 0.50Knee flexion (100 Is) Handgrip 0.46Knee flexion (200 /s) Handgrip 0.46
* 'Vuscular Endurance MeasuresWingate peak power Situps 0.54Wingate peak power Pushups 0.54
Wingate mean power Situps 0.58Wingate mean power Pushups 0.49
Wingate fatigue index Situps 0.25Wingate fatigue index Pushups 0.03
'Maximal Aerobic Power MeasuresDirect VfO 2 max Indirect VO 2 max 0.65
.4

Table 5.Laboratory and field test values for 17 of the subjects before and after 12 weeks of hydraulic resis-tance training.
Test Pre Post Mean Change Mean Relative Change (%)
* kaximal Aerobic Power
Indirectly measured VrO 2 max 47.4 48.6 1.2 +2.5ml/kg/min
Directly measured VO 2max 42.8 46.7 3.9 +9.1* ml/kg/min
uscl Strength
Handgrip force 101.6 100.2 -0.7 -1.4* kg
Squats.10 /s 171 200 29 +17.4kg
Bench press 45"/s 37.3 43.7 6.4 +17.2• kg
Muscular Endurance
Pushups 32.7 37.5 5.9 +14.7"*number
Situps 36.5 37.9 1.4 +3.8number
Wingate test mean power 7.6 7.8 0.2 +2.6*W/kg
Wingate test fatigue index 51 55 4 +7.8**%
Values are means.*** *
p<O.001, p<O.O1, p<O.05