of philadelphia...rebecca rhynhart 12th floor, municipal services bldg. city controller 1401 john f....
TRANSCRIPT

CITY OF PHILADELPHIA
OFFICE OF THE CITY CONTROLLER REBECCA RHYNHART
12th Floor , Municipal Services Bldg. City Controller
1401 John F. Kennedy Boulevard
Philadelphia, PA 19102 (215) 686-6680 FAX (215) 686-3832 Rebecca [email protected]
July 13,2018
Mr. Harvey M. Rice, Executive Director Pennsylvania Intergovernmental Cooperation Authority 1500 Walnut Street, Suite 1600 Philadelphia, PA 19102
Dear Mr. Rice:
Pursuant to its mandate as specified in Section 12720.209(f)(1) of the Pennsylvania Intergovernmental Cooperation Authority (PICA) Act , the Office of the Controller conducted its annual review of the Forecasted General Fund Statements of Operations for each of the fiscal years ending June 30, 2019 through June 30, 2023. The Statement of Operations, also known as the Five-Year Plan (Plan), was prepared by the City of Philadelphia's Office of the Director of Finance and submitted to PICA on June 26,2018. My staff conducted its review of the Plan in accordance with attestation standards set forth by the American Institute of Certified Public Accountants . Attached please find the independent accountant's report signed by my deputy who is a Certified Public Accountant.
I recommend that PICA approve the Plan; however, in reviewing the projected annual budgets, our office noted one particularly sensitive assumption and three additional causes for concern that PICA should take into consideration while evaluating the Plan.
Sensitive Assumption As noted in the accountant's report, the City set aside roughly $103M for future labor obligations. Such provisions should better anticipate future labor negotiations between the City and corresponding bargaining units that will occur once the existing contracts expire. It is our view that the budgetary allocations as specified in the Plan do not adequately account for the likely cost of such renegotiations.
Causes for Concern • The Budget Office's revenue projections for the Wage Tax are particularly optimistic in
the later years of the Plan, resulting in a significant difference from our office ' s estimates over the life of the Plan. Such optimism is concerning given recent economic uncertainty, e.g . sluggish growth in real wages, diminishing returns from the Tax Cuts and Jobs Act, and historically low unemployment. The City's reliance on the Wage Tax, a tax susceptible to wider economic trends, as its dominant revenue source compounds the risks associated with these forecasts .
• The City budgeted for $1.16B in its contributions to the School District over the lifetime of the Plan. The City's annual contribution will grow from $181 M in Fiscal Year (FY) 2019 to $262M in FY23. In the event of lower-than-expected revenue receipts, the City would likely have to compensate for such shortfall. It should be noted that the optimistic Wage Tax projections and significant budgeted contributions to the School District may place the City at risk. The commitment of funds to the School District, while not directly dependent upon the Wage Tax-eontributions will proceed from the General Fund-may impose a burden that compromises the City 's planned budget allocations in the future. In the event of economic downturn, significant adjustments will be required to meet these obligations.
• The Plan lacks a strategy to address the loss of Beverage Tax revenues in the event of state legislative action or a decisive ruling against the City from the Pennsylvania Supreme Court. If the Beverage Tax were eliminated or deemed unconstitutional, the General Fund would face a shortfall for funding planned obligations.
We recognize that as projections reach further out and the economic outlook grows more uncertain, discrepancies are likely to occur between forecasted and actual revenues. Moreover, unforeseen events and circumstances demanding further expenditure, including but not limited to extreme weather, poor returns on pension investments, and federal spending cuts, could have significant impacts on annual spending. Consequently, we bel ieve that the current economic climate warrants greater fiscal prudence in appropriating for the future.
In closing, my office expresses its gratitude to the management and staff of the Office of Budget and Program Evaluation for their cooperation and assistance during this review and looks forward to our continued relationship.
• Rebecca ynhart City Controller
cc: Chair and Board Members of the Pennsylvania Intergovernmental Cooperation Authority
James F. Kenney, Mayor Rob Dubow, Director of Finance Anna Adams, Budget Director

City Controller Rebecca Rhynhart
Credit: Photo by R. Kennedy for VISIT PHILADELPHIA®
CITY OF PHILADELPHIAFORECASTED GENERAL FUNDSTATEMENTS OF OPERATIONS
FISCAL YEARS 2019 - 2023

CONTENTS
Independent Accountant’s Report
Forecasted General Fund Statements of Operations –
Fiscal Years Ending June 30, 2019 through June 30, 2023 .................................................................. 1
Notes to Forecasted General Fund Statements of Operations –
Fiscal Years Ending June 30, 2019 through June 30, 2023
A. Nature of the Forecast ................................................................................................................ 2
B. Summary of Significant Accounting Policies ............................................................................ 2
C. Summary of Significant Forecast Assumptions ......................................................................... 2
1. Approach to Revenue Forecasting .................................................................................... 2
2. The National and Local Economic Context ...................................................................... 4
3. The City’s Major Taxes ..................................................................................................... 4
4. Locally Generated Non-Tax Revenues ............................................................................. 9
5. Revenue from Other Governments.................................................................................... 9
6. Obligation Estimates ......................................................................................................... 9

INDEPENDENT ACCOUNTANT’S REPORT
To the Chair and Board Members of the
Pennsylvania Intergovernmental Cooperation Authority
We have examined the accompanying forecast of the City of Philadelphia, Pennsylvania, which comprises the
forecasted general fund statements of operations and summaries of significant assumptions and accounting
policies for each of the five years ending through June 30, 2023, of the City of Philadelphia, Pennsylvania, based
on the guidelines for the presentation of a forecast established by the American Institute of Certified Public
Accountants (AICPA). City of Philadelphia’s Office of the Director of Finance management is responsible for
preparing and presenting the forecast in accordance with the guidelines for the presentation of a forecast
established by the AICPA. Our responsibility is to express an opinion on the forecast based on our examination.
Our examination was conducted in accordance with attestation standards established by the AICPA. Those
standards require that we plan and perform the examination to obtain reasonable assurance about whether the
forecast is presented in accordance with the guidelines for the presentation of a forecast established by the AICPA,
in all material respects. An examination involves performing procedures to obtain evidence about the forecast.
The nature, timing, and extent of the procedures selected depend on our judgment, including an assessment of the
risks of material misstatement of the forecast, whether due to fraud or error. We believe that the evidence we
obtained is sufficient and appropriate to provide a reasonable basis for our opinion.
In our opinion, the accompanying forecast is presented, in all material respects, in accordance with the guidelines
for the presentation of a forecast established by the AICPA, and the underlying assumptions are suitably supported
and provide a reasonable basis for management’s forecast.
There will usually be differences between forecasted and actual results because events and circumstances
frequently do not occur as expected, and those differences may be material. We have no responsibility to update
this report for events and circumstances occurring after the date of this report.
The accompanying forecast includes assumptions that are particularly sensitive as indicated in Note C.6.a. The
assumptions pertaining to labor agreement costs are particularly sensitive due to the uncertainty in the outcome
of expected future negotiations with the four major municipal unions whose contracts are set to expire in 2020.
CHRISTY BRADY, CPA
Deputy City Controller
Philadelphia, Pennsylvania
July 13, 2018

Forecasted General Fund Statements of Operations
Fiscal Years Ending June 30, 2019 through June 30, 2023
Prepared by:
Office of Budget and Program Evaluation
Office of the Director of Finance

FY 2019 FY 2020 FY 2021 FY 2022 FY 2023
NO. ITEM Adopted Estimate Estimate Estimate Estimate (1) (2) (3) (4) (5) (6) (7)
OPERATIONS OF FISCAL YEAR
REVENUES
1 Taxes 3,445,678 3,597,063 3,709,257 3,823,820 3,938,669
2 Locally Generated Non-Tax Revenues 291,684 315,338 290,147 292,916 293,616
3 Revenue from Other Governments 806,439 830,823 860,279 880,244 914,578
4 Sub-Total (1 thru 3) 4,543,801 4,743,224 4,859,683 4,996,980 5,146,863
5 Revenue from Other Funds of City 73,108 64,555 65,086 65,644 66,230
6 Total Revenue and Other Sources (4)+(5) 4,616,909 4,807,779 4,924,769 5,062,624 5,213,093
OBLIGATIONS/APPROPRIATIONS
7 Personal Services 1,738,441 1,780,718 1,782,030 1,782,564 1,783,221
8 Personal Services-Pensions 719,758 752,816 764,790 776,353 791,085
9 Personal Services-Other Employee Benefits 640,480 660,364 687,584 716,582 747,465
10 Sub-Total Employee Compensation (7 thru 9) 3,098,679 3,193,898 3,234,404 3,275,499 3,321,771
11 Purchase of Services 951,665 973,922 990,693 1,016,588 1,031,754
12 Materials, Supplies and Equipment 114,356 117,821 115,420 112,678 112,091
13 Contributions, Indemnities, and Taxes 282,185 309,963 338,190 352,734 357,939
14 Debt Service 169,496 178,903 190,109 214,712 227,770
15 Advances & Misc. Pmts. / Labor Obligations 16,447 20,000 20,000 20,648 25,648
16 Advances & Misc. Pmts. / Federal Grants 54,573 55,108 56,705 58,356 58,356
17 Sub-Total (10 thru 16) 4,687,401 4,849,615 4,945,521 5,051,215 5,135,329
18 Payments to Other Funds 38,096 33,909 35,193 36,545 37,746
19 Total - Obligations (17)+(18) 4,725,497 4,883,524 4,980,714 5,087,760 5,173,075
20 Oper.Surplus (Deficit) for Fiscal Year (6)-(19) (108,588) (75,745) (55,945) (25,136) 40,018
21 Prior Year Adjustments:
22 Other Adjustments 19,500 19,500 19,500 19,500 19,500
23 Total Prior Year Adjustments 19,500 19,500 19,500 19,500 19,500
24 Adjusted Oper. Surplus/ (Deficit) (20)+(23) (89,088) (56,245) (36,445) (5,636) 59,518
OPERATIONS IN RESPECT TO
PRIOR FISCAL YEARS
Fund Balance Available for Appropriation
25 June 30 of Prior Fiscal Year 228,545 139,457 83,212 46,767 41,130
Fund Balance Available for Appropriation26 June 30 (24)+(25) 139,457 83,212 46,767 41,130 100,648
See accompanying summaries of significant accounting policies and assumptions and accountant's report.
City of Philadelphia - Office of the Director of FinanceForecasted General Fund Statements of Operations
Fiscal Years Ending June 30, 2019 through June 30, 2023(Amounts in thousands)
1

City of Philadelphia – Office of the Director of Finance
Notes to Forecasted General Fund Statements of Operations
Fiscal Years Ending June 30, 2019 through June 30, 2023
2
A. Nature of the Forecast
The City of Philadelphia Office of Budget and Program Evaluation (OBPE) is responsible for providing
revenue and obligation estimates to the Director of Finance and the Mayor for discussion and inclusion in
the FY2019 budget and the FY2019-2023 Five Year Financial Plan (FYP) submitted by the Mayor to the
Pennsylvania Intergovernmental Cooperation Authority (PICA) on June 26, 2018. These financial forecasts
present, to the best of management's knowledge and belief, the City of Philadelphia’s (City) expected results
of operations for the forecast periods. Accordingly, the forecasts reflect the City’s judgment as of June 26,
2018, the date of these forecasts, of the expected conditions and its expected course of action. The
assumptions disclosed herein are those that management believes are significant to the forecasts. There will
usually be differences between the forecasted and actual results because events and circumstances
frequently do not occur as forecasted or expected and those differences may be material.
B. Summary of Significant Accounting Policies
The Forecasted General Fund Statements of Operations are presented on the budgetary basis of accounting.
The budgetary basis of accounting differs from the modified accrual (Generally Accepted Accounting
Principles) basis used in the preparation of the City’s governmental fund financial statements in that both
expenditures and encumbrances are applied against the current budget, adjustments affecting activity
budgeted in prior years are accounted for through fund balance or as a reduction of expenditures and certain
interfund transfers and reimbursements are budgeted as revenues and expenditures.
C. Summary of Significant Forecast Assumptions
1. Approach to Revenue Forecasting
The City’s estimated general fund revenues for FY19 total $4.617 billion. Approximately 74.6% of
the City’s revenue comes from local taxes, and 17.5% comes from other governments. Locally
generated non-tax revenues, which include fees, fines and permits, account for 6.3% of revenues.
OBPE provides forecasts for the seven major taxes, totaling over $3.419 billion in the adopted FY19
budget, as well as $291.7 million of Locally Generated Non-Tax revenues, and $806.4 million in
Revenue from Other Governments. These three sources comprise 98.4% of the revenues anticipated for
the FY19 budget.
OBPE employs several approaches to developing its forecasts of local revenues. These include:
City of Philadelphia – Office of the Director of Finance
Notes to Forecasted General Fund Statements of Operations
Fiscal Years Ending June 30, 2019 through June 30, 2023
3
a. Forecasts of economic activity provided by several sources including the Congressional Budget
Office;
b. Continuous evaluation of national and local economic data on employment, inflation, interest rates,
and economic growth;
c. Ongoing examination of the City’s current tax receipts;
d. Economic forecasting of tax revenues provided by a revenue forecasting consultant;
e. Analysis and tax history provided by experienced staff within the Philadelphia Department of
Revenue;
f. Discussions with economists at a meeting at the Federal Reserve Bank of Philadelphia; and
g. The extensive experience of its staff.
OBPE’s tax forecasts for the FYP were developed in conjunction with a revenue forecasting consultant,
IHS Markit, Ltd. (IHS). IHS created econometric models which included variables such as wage and
salary disbursements in the metropolitan statistical area (MSA) and the county, personal income in the
county, the unemployment rate, home prices in the county, real estate transaction growth, and national
corporate profits. These models, together with their forecast of the Philadelphia economy, were used
by IHS to forecast tax revenues for the City. IHS focused on the following taxes – Wage and Earnings
Tax, Net Profits Tax, Business Income and Receipts Tax, Real Estate Transfer Tax, Parking Tax and
Sales Tax. These forecasts were refined by OBPE after discussions with economists at a meeting at
the Federal Reserve Bank of Philadelphia, as well as with experienced staff within the Department of
Revenue. Forecasts for the remaining major taxes – Real Estate and Philadelphia Beverage – were
developed using the internal expertise of employees within the City. The Real Estate Tax estimates
were forecasted by OBPE with data and input from the Office of Property Assessment and the
Department of Revenue. The Philadelphia Beverage Tax estimates were based upon the first twelve
months of collections of this new tax, along with an assumption of a 1% decline in consumption
assumed based upon national trends of reduced sugar-sweetened beverage consumption, in consultation
with the Department of Revenue.

City of Philadelphia – Office of the Director of Finance
Notes to Forecasted General Fund Statements of Operations
Fiscal Years Ending June 30, 2019 through June 30, 2023
4
2. The National and Local Economic Context
The strength of the economy is a key determinant of the fiscal health of the City since tax revenues,
which are directly tied to the economy’s strength, account for almost 75% of the City’s General Fund
revenue. The Congressional Budget Office (CBO) forecast for U.S. Real Gross Domestic Product
shows projected growth of 3.0% for 2018, up from 2.3% growth in 2017. Growth is expected to
continue in 2019 at 2.9%. The CBO forecast projects corporate profits to grow by 5.9% in 2019
continuing the trend of robust growth seen 2017 and 2018.1
Wages and salaries are projected to grow at 5.3% in 2018 and accelerate to 5.8% in 2019, exceeding
the previous growth experienced in 2017. Unemployment is expected to decline from 4.4% in 2017 to
3.8% in 2018 and then to 3.3% in 2019.2
According to IHS Markit, the medium-term economic outlook for the city of Philadelphia remains
moderately optimistic. The Center City area is doing well, and other neighborhoods are experiencing
increased interest, especially in housing markets. Continued expansion of the city and regional
economy will require ongoing gains in the labor force at all skill levels through education, access to
transportation, affordable housing, and other means. IHS Markit expects total payrolls in the city to
expand 0.3% per year on average from 2018 to 2023. Real gross county product looks poised to grow
1.6% on average, while increasing rates of gain in wage rates will improve the outlook for total incomes.
Philadelphia’s unemployment rate dipped below 6% in recent months, and is expected to move into the
low-5% range by late 2018 and beyond.
3. The City’s Major Taxes
The City receives revenue to fund its services and programs from seven major taxes which are budgeted
to contribute almost 75% of the expected General Fund revenue in FY19. These include:
1. Wage and Earnings and Net Profit Tax (Wage),
2. Real Property Tax,
3. Business Income and Receipts Tax (BIRT),
1 Congressional Budget Office, The Budget and Economic Outlook: 2018 to 2028 (April 2018 Report), Page 140. 2 Congressional Budget Office, The Budget and Economic Outlook: 2018 to 2028 (April 2018 Report), Page 140.

City of Philadelphia – Office of the Director of Finance
Notes to Forecasted General Fund Statements of Operations
Fiscal Years Ending June 30, 2019 through June 30, 2023
5
4. Real Estate Transfer Tax (RTT),
5. Sales Tax,
6. Parking Tax, and
7. Philadelphia Beverage Tax.
The remaining taxes, including the amusement tax, are budgeted to provide less than 1% of General
Fund revenue. Philadelphia’s reliance on the Wage Tax (45.3% of the General Fund, including
PICA portion), the BIRT (9.2%) and the Sales Tax (4.7%) places the City at risk from economic
trends and employment fluctuations of the local economy. Other cities and counties that rely more
heavily on property tax revenues are more susceptible to dramatic shifts in the housing market.
a. Wage Tax
The largest tax revenue source (comprising 47% of tax revenues, excluding the PICA portion) is
the Wage Tax, which encompasses the wage, earnings, and net profits taxes. The Wage Tax is
collected from all employees working within city limits, and all Philadelphia residents regardless
of work location. In FY19, the Wage Tax rate has been reduced from 3.8907% to 3.8809% for
residents and from 3.4654% to 3.4567% for non-residents. The resident rate includes 1.5% that is
reserved for the PICA. PICA has overseen the City’s finances since 1992. The PICA statute permits
the Authority a “first dollar” claim on its portion of Wage Tax proceeds, which is used to pay debt
service on bonds issued by PICA for the benefit of the City. Excluding the PICA portion, the Wage
Tax and Net Profits Tax is projected to bring in $1.620 billion in FY19. This projection includes a
3.79% growth rate for the Wage and Earnings component and 4.49% growth rate for the Net Profit
component of the tax.3
The City resumed cuts to the Wage Tax in FY14, after those cuts had been suspended during the
fiscal crisis, and plans to continue Wage Tax cuts in each year of the FYP if the City’s fund balances
remains consistent with or higher than those in the FYP. The level of cuts to the Wage Tax rates
increase over the course of the plan as the economy is projected to grow. By FY23, the Wage Tax
rates in the FYP are 3.8423% for residents and 3.4233% for non-residents. The City has slowed
down the rate of reduction in the Wage Tax that had been planned in the FY18-22 FYP, with the
3 Growth rates referenced throughout these notes are applied to the current portion of the tax base.

City of Philadelphia – Office of the Director of Finance
Notes to Forecasted General Fund Statements of Operations
Fiscal Years Ending June 30, 2019 through June 30, 2023
6
savings from the slowdown used for the City to increase the contribution to the School District of
Philadelphia.
b. Real Property Tax
The Real Property Tax (Property) is the City’s second largest source of tax revenue (19.4%),
estimated to contribute $669.1 million of the FY19 tax revenues. This tax is levied on the assessed
value of residential and commercial property in the City. The Adopted FY19 Budget has a
combined City/School District property tax rate for FY19 of 1.3998%, unchanged from FY17. The
City portion of the tax is 0.6317% and the School District portion is 0.7681%. The property tax
projection includes an expansion of the homestead exemption from $30,000 of assessed value to
$40,000 of assessed value for eligible property owners and the Longtime Owner Occupants
Program (LOOP) capped at $20 million of waived revenue for the City and School District
combined and additional relief programs. The FYP assumes taxable assessed values grow each
year of the plan, based upon regular reassessments provided by the City’s Office of Property
Assessment. The projection also uses a collection rate of 95.5%, which is based upon the FY17
actual collection rate.
c. Business Income and Receipts Tax
The Business Income and Receipts Tax (BIRT) is projected to produce $425.2 million in FY19,
12.3% of total tax revenue. Most the BIRT is derived from corporate profits which are volatile and
dependent on economic conditions within the City. In FY12, BIRT tax reform legislation was
enacted, which incorporated several changes intended to help small and medium size businesses
grow in Philadelphia. Under Bill 110548, business taxes for the first two years of operations for all
new businesses that employ at least three employees in their first year and six in the second would
be eliminated beginning in FY13. Bill 110554 provides for across the board exclusions on the gross
receipts portion for all businesses scaled in over a three-year period beginning in FY15 and
reductions in the net income portion of the BIRT. The first $100,000 of receipts have been excluded
since the exclusions were first fully applied in FY17. Lastly, the bill called for implementation of
single sales factor apportionment in FY16. This enables businesses to pay BIRT solely on sales,
not on property or payroll. By taxing property and payroll, the BIRT previously had provided
disincentives to firms to locate in the city.

City of Philadelphia – Office of the Director of Finance
Notes to Forecasted General Fund Statements of Operations
Fiscal Years Ending June 30, 2019 through June 30, 2023
7
d. Real Estate Transfer Tax
While economic conditions negatively affected the Real Estate Transfer Tax (RTT) after the
housing market decline began in 2007, the City is now seeing solid growth in this tax. The RTT is
projected to provide $310.5 million in FY19. After a particularly strong FY18 (with growth of
26.6% above FY17 actuals), the base growth of the RTT is projected to decline by -6.25% in FY19.
However, FY19 also includes a rate change from 3.1% to 3.278%, the revenue from which is to be
used to increase the City’s contribution to the School District, to compensate it for the loss of
revenue from increasing the homestead exemption from $30,000 of assessed value to $40,000. The
City currently imposes a 3.278% tax on real property sales and an additional 1% is charged by the
Commonwealth for a 4.278% total RTT.
e. Sales Tax
Sales Tax revenues are projected to generate $216.5 million for the City’s general fund in FY19,
based on a growth rate of 3.8%, and comprising 6.3% of tax revenues. As part of its response to
projected City budget deficits in 2009, the Commonwealth of Pennsylvania (the Commonwealth)
provided authorization and the City passed legislation to temporarily increase the Sales Tax rate
from 1% to 2% through the end of FY14. This raised the total Sales Tax rate to 8%, with 6% going
to the Commonwealth and 2% to the City. The tax was made permanent starting in FY15 with 1%
of the local Sales Tax being for the benefit of the School District of Philadelphia and the City’s
pension fund whereby $120 million of the sales tax goes directly to the School District and
remaining amounts flow through the City’s General Fund to pay for debt service on a borrowing
on behalf of the School District and for additional contributions to the Pension Fund. In FY19, the
debt service on the borrowing is complete, and therefore all of the proceeds above the $120 million
in Sales Tax receipts from the second 1% is going to the City’s Pension Fund (projected to be $48.3
million). From FY19 through FY23, the City’s pension fund is projected to receive $297.5 million
from the proceeds of the Sales Tax.
f. Parking Tax
The Parking Tax is levied on the gross receipts from all parking transactions. Parking Tax revenue
is projected to generate $100.7 million in FY19, based on prior year revenue history and local
economic trends.

City of Philadelphia – Office of the Director of Finance
Notes to Forecasted General Fund Statements of Operations
Fiscal Years Ending June 30, 2019 through June 30, 2023
8
g. Philadelphia Beverage Tax
The Philadelphia Beverage Tax is a relatively new revenue source, applied to non-retail
distributions of both sugar-sweetened and diet beverages, at a rate of one and one-half cents per
fluid ounce of sweetened beverages. Original tax estimates were developed by the City’s
Department of Revenue, and utilized local consumption data provided by the University of
Connecticut’s Rudd Center for Food Policy and Obesity, along with a -1-elasticity rate. The
projections in the FYP were based upon the first twelve months of receipts, reduced by 1%
annually, in line with national trends on consumption. The tax was effective January 1, 2017 and
is projected to impact revenues and expenditures in the following ways:
• An estimated $382.5 million will be collected in gross revenue from FY19-FY23, before
additional costs for collection, advertising and auditing.
• Revenues from the Philadelphia Beverage Tax is funding expenditures for three major
initiatives: expanded Pre-K, community schools, and debt service for the Rebuilding
Community Infrastructure program when those programs are fully implemented.
City of Philadelphia – Office of the Director of Finance
Notes to Forecasted General Fund Statements of Operations
Fiscal Years Ending June 30, 2019 through June 30, 2023
9
4. Locally Generated Non-Tax Revenues
Locally Generated Non-Tax Revenues are forecasted based on historical trends, rate changes, and
current collection patterns. Certain revenues such as interest earnings, licenses and permits and
recording fees are subject to economic conditions and are estimated accordingly.
5. Revenue from Other Governments
Revenue from Other Governments is forecasted based on historical trends and state and federal budget
information. The PICA City account, which represents 58% of Revenue from Other Governments, is
forecasted using Wage Tax variables.
6. Obligation Estimates
OBPE provided obligation estimates to the Director of Finance and the Mayor for discussion and
inclusion in the revised annual FY2019 budget and FY2019-2023 FYP submitted by the Mayor to the
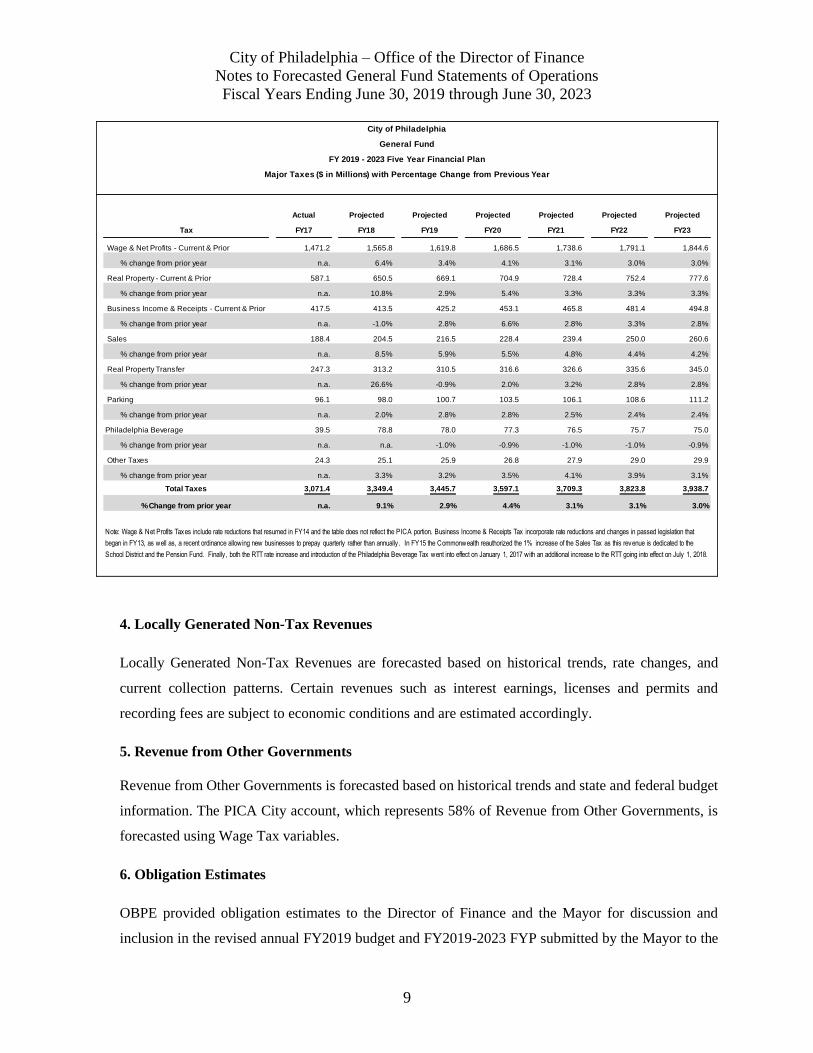
Actual Projected Projected Projected Projected Projected Projected
Tax FY17 FY18 FY19 FY20 FY21 FY22 FY23
Wage & Net Profits - Current & Prior 1,471.2 1,565.8 1,619.8 1,686.5 1,738.6 1,791.1 1,844.6
% change from prior year n.a. 6.4% 3.4% 4.1% 3.1% 3.0% 3.0%
Real Property - Current & Prior 587.1 650.5 669.1 704.9 728.4 752.4 777.6
% change from prior year n.a. 10.8% 2.9% 5.4% 3.3% 3.3% 3.3%
Business Income & Receipts - Current & Prior 417.5 413.5 425.2 453.1 465.8 481.4 494.8
% change from prior year n.a. -1.0% 2.8% 6.6% 2.8% 3.3% 2.8%
Sales 188.4 204.5 216.5 228.4 239.4 250.0 260.6
% change from prior year n.a. 8.5% 5.9% 5.5% 4.8% 4.4% 4.2%
Real Property Transfer 247.3 313.2 310.5 316.6 326.6 335.6 345.0
% change from prior year n.a. 26.6% -0.9% 2.0% 3.2% 2.8% 2.8%
Parking 96.1 98.0 100.7 103.5 106.1 108.6 111.2
% change from prior year n.a. 2.0% 2.8% 2.8% 2.5% 2.4% 2.4%
Philadelphia Beverage 39.5 78.8 78.0 77.3 76.5 75.7 75.0
% change from prior year n.a. n.a. -1.0% -0.9% -1.0% -1.0% -0.9%
Other Taxes 24.3 25.1 25.9 26.8 27.9 29.0 29.9
% change from prior year n.a. 3.3% 3.2% 3.5% 4.1% 3.9% 3.1%
Total Taxes 3,071.4 3,349.4 3,445.7 3,597.1 3,709.3 3,823.8 3,938.7
% Change from prior year n.a. 9.1% 2.9% 4.4% 3.1% 3.1% 3.0%
Note: Wage & Net Profits Taxes include rate reductions that resumed in FY14 and the table does not reflect the PICA portion. Business Income & Receipts Tax incorporate rate reductions and changes in passed legislation that
began in FY13, as well as, a recent ordinance allowing new businesses to prepay quarterly rather than annually . In FY15 the Commonwealth reauthorized the 1% increase of the Sales Tax as this revenue is dedicated to the
School District and the Pension Fund. Finally , both the RTT rate increase and introduction of the Philadelphia Beverage Tax went into effect on January 1, 2017 with an additional increase to the RTT going into effect on July 1, 2018.
City of Philadelphia
General Fund
FY 2019 - 2023 Five Year Financial Plan
Major Taxes ($ in Millions) with Percentage Change from Previous Year

City of Philadelphia – Office of the Director of Finance
Notes to Forecasted General Fund Statements of Operations
Fiscal Years Ending June 30, 2019 through June 30, 2023
10
PICA on June 26, 2018. OBPE provides forecasts of all major expenditure categories. Obligations total
$4.725 billion, an increase of $267 million over the FY18 estimate. The largest increase in expenditures
is the $78.6 million increase in the City’s contribution to the School District. That increase accounts
for nearly a third of the projected general fund increase in spending. Projected tax revenues generated
by changes to the transfer tax and by the slowdown of previously planned wage tax reductions account
for $38.2 million of the District funding package, with the other half provided from existing General
Fund resources. The increase in the reserves for federal funding reductions and future labor costs
account for another fifth of the increase in spending. The combination of the reserve lines and the
increased School District contribution account for over half of the projected increase in spending. The
reserve for federal funding reductions provides a funding source to compensate for potential federal
(and state) reductions in grant funds that could have negative impacts upon City services.
a. Labor Agreements
The forecasted statements include:
• The contract pay raise for AFSCME DC33 of 2.5% in FY19 and 3% in FY20. Per the
agreement, members received a $500 bonus within 30 days after the passing of the
ordinance implementing pension changes requiring additional employee contributions.
• Per the FY18 to FY20 arbitration award for the Fraternal Order of Police (FOP), a 3.5%
pay increase in FY19 and 3.75% in FY20. Members received a lump-sum cash payment of
$1,300 for the purpose of resolving all issues related to court notices and to compensate for
any costs incurred with receipt of the notices.
• Per the FY18 to FY20 arbitration award for the International Association of Fire Fighters
(IAFF), a 3.5% increase in FY19 and 3.75% in FY20. Members will receive a bonus in
FY19 equivalent to and covered by forgoing the reimbursement of one month of health
fund expenses paid by the City. Fire fighters also received two increases to premium pay
rates of 0.5 hours per week in FY19 and an additional 0.2 hours per week in FY20.
• Per the FY18 to FY20 arbitration award for Deputy Sheriffs and Register of Wills
employees, a 3.25% pay increase in FY19 and 3.25% in FY20 for Deputy Sheriffs. Register
of Wills employees received wage increases and bonuses in line with District Council 33:
2.5% in FY19 and 3% in FY20. Both groups received a $500 bonus after the passage of
pension ordinance reforms.

City of Philadelphia – Office of the Director of Finance
Notes to Forecasted General Fund Statements of Operations
Fiscal Years Ending June 30, 2019 through June 30, 2023
11
• Per the FY18 to FY20 arbitration award for the Correctional Officers, Local 159 of
AFSCME DC33, a 3.25% increase in FY19 and 3.25% in FY20.
The City has set aside $102.7 million from FY19 to FY23 in a labor reserve, to cover the costs associated
with the FY18 to FY20 agreement with AFSCME District Council 47, as well as future labor costs with
other employees. The DC47 agreement includes a pay increase of 3% in FY18, 2.5% in FY19, and 3% in
FY20, consistent with the DC33 agreement. Members receive a $500 bonus after the passage of pension
ordinance reforms. Members also receive a $300 bonus in exchange for the withdraw of a longstanding
unfair labor practice.
b. Health / Medical
The Administration implemented a self-insured group health plan in 2010 for medical benefits for
non-union employees. The City also increased employee copays and instituted a disease
management and wellness program with financial incentives for completing wellness activities. In
FY15, the City added a tobacco user surcharge. The City has assumed a 5% annual growth in costs
for the City Administered Plan.
DC47, the IAFF, and the FOP have also implemented self-insured group health plans. For the FOP,
because the City has no control over the design of the its health plan, an increase of 7.5% per year
based on medical cost trends has been included. For DC47, an increase of 5.0% per year based on
medical cost trends has been included, and the recent agreement also included lump sum payments
to their fund of $1.5 million in FY18 and FY19 and $1 million in FY20.
AFSCME District Council 33 (DC33) projections are based on prior year expenditures. Under the
new contract, a $10 million lump sum payment was made within 30 days of contract ratification
and another $10 million lump sum payment was paid on July 1st, 2017. There will be a reopener
for determining the City’s contribution to the health fund for fiscal years 2019 and 2020.
c. Pensions
As part of the effort to control major cost drivers and to improve the health of the pension fund,
several changes have been made over the past few years. The City continues to seek ways to
improve the long-term health of the fund.

City of Philadelphia – Office of the Director of Finance
Notes to Forecasted General Fund Statements of Operations
Fiscal Years Ending June 30, 2019 through June 30, 2023
12
The City’s Act 111 interest arbitration awards with the FOP, Lodge No. 5 and IAFF, Local 22 both
require most current members to make additional contributions to the pension fund of 0.92%
starting in FY18 and an additional 0.92% in FY19, for a combined 1.84% additional contribution.
New hires are required to make an additional 2.5% contribution above rates in effect prior to the
arbitration award.
Significant pensions changes were also included in the DC47 collective bargaining agreement,
closely mirroring the earlier reforms agreed to with DC33. Effective in January 2019, current
employees will participate in a tiered contribution system where those with higher annual salaries
will pay higher contribution rates. New employees will go into a stacked hybrid plan under which
employees will receive a traditional defined benefit pension on their first $65,000 of salary and a
defined contribution pension for salary above $65,000. These reforms will be applied to employees
who are not represented by a union, which means that all City employees will be participating in
strengthening the pension fund.
In addition to the abovementioned changes in pension benefits, the City’s pension fund has also
undergone the following changes:
• The City continues to make at least its full minimum municipal obligation (MMO) each year
and has dedicated a portion of additional revenues to the fund. Under 2014 state legislation, the
additional 1% local sales tax provides funding for the School District of Philadelphia (first
$120 million), debt service on a four-year borrowing for the District (next $15 million through
FY18), and any remaining funds are dedicated to the pension fund. From FY18 through FY23,
the City’s pension fund is projected to receive $324.7 million from the proceeds of the Sales
Tax. The Sales Tax revenues will supplement the City’s MMO payment rather than supplanting
a portion of it.
• The City also created the Revenue Recognition Policy under which the Sales Tax revenue and
additional employee contributions achieved through collective bargaining and interest
arbitration are to be paid above the City’s annual required contribution to the pension fund.
This means that the City will pay more than what is legally required each year to improve the
funding status of the plan more quickly.
• Over the past ten years, reduced the pension fund’s earnings assumption from 8.75% to 7.65%,
with an additional reduction to 7.6% scheduled for July 1, 2019. Lower earnings assumptions
allow funds to moderate the risk of their investments, which can also reduce the likelihood of

City of Philadelphia – Office of the Director of Finance
Notes to Forecasted General Fund Statements of Operations
Fiscal Years Ending June 30, 2019 through June 30, 2023
13
losses. In addition, lower earnings assumptions increase the amount the City is required to
contribute to the pension fund, which improves the fund’s health.
The net impact of these changes to the City’s pension benefits and fund is to moderate what would
have been devastating increases in pension costs and to increase the City’s ability to fund existing
liabilities in the long term. The specific changes to the pension fund assumptions have been tested
by the City’s actuary and have been determined to be actuarially sound. The pension amounts
included in the FYP are provided by the City’s actuary and are higher than the amounts required to
be paid under state law.