of predicting maximum - bjsm.bmj.com · extrapolation, vo2max was predicted using the linear...
TRANSCRIPT
RU T T E R W O R T H Br. J. Sports Med., Vol. 29, No. 3, pp. 147-152, 1995E I N E M A N N Copyright K 1995 Elsevier Science Ltd
Printed in Great Britain. All rights reserved0306-3674/95 $10.00+00
Editorial AnnouncementWe learnt with great regret of the death of Dr John GP Williams after a long illness.An obituary and appreciation of his major contributions to British and internationalsports medicine will appear in the December issue of the journal.From January 1996 the British Journal of Sports Medicine will be published and co-owned by the BMJ Publishing Group. A new editor is being appointed and Dr PeterSperryn has by agreement between the BASM Executive and the BMJ PublishingGroup stepped down as editor. An appreciation of Dr Peter Sperryn's work for thejournal will appear in the New Year, by which time a new editor will be in post.
A comparison of methods of predicting maximumoxygen uptakeS Grant, K Corbett, AM Amjadt, J Wilson*t and T AitchisontDepartment of Physical Education and Sports Science, tDepartment of Statistics, and *Institute of Physiology,University of Glasgow, Scotland, UK
The aim of this study was to compare the results from aCooper walk run test, a multistage shuttle run test, and asubmaximal cycle test with the direct measurement ofmaximum oxygen uptake on a treadmill. Three predictivetests of maximum oxygen uptake-linear extrapolation ofheart rate of VO2 collected from a submaximal cycleergometer test (predictedL,), the Cooper 12 min walk, runtest, and a multi-stage progressive shuttle run test (MST)-were performed by 22 young healthy males (mean(s.d.)age 22.1(2.4) years; body mass 72.4(8.9 kg)) and thevalues compared to those obtained by direct measurementon a maximal treadmill test. All of the subjects were regularexercisers. The mean(s.d.) from the various tests inml *kg- *min1 were as follows: treadmill 60.1(8.0),Cooper 60.6(10.3), MST 55.6(8.0), and predictedLE52.0(8.4).The Cooper test had a correlation with the treadmill test
of 0.92, while the MST and the predictedLa had correlationsof 0.86 and 0.76 respectively. Both the MST and pre-dictedLE showed systematic underprediction of the tread-mill value. On average, the MST was 4.5 ml kg-' min-(s.e. 0.9) lower than the treadmill VO2,x, while thepredictedLE was 7.8 ml * kg-' * min- (s.e. 1.4) lower thanthe treadmill V02max'
Address for correspondence: Dr Stanley Grant, Department ofPhysical Education and Sports Science, University of Glasgow, 77Oakfield Avenue, Glasgow G12 8LT, Scotland, UK.
These findings indicate that, for the population assessed,the Cooper walk run test is the best predictor of V02,among the three tests.(Br J Sports Med 1995; 29: 147-152)
Keywords: maximum oxygen uptake; prediction of maxi-mum oxygen uptake; field tests
Aerobic power or maximum oxygen uptake (VO2.)'the maximum rate at which oxygen can be consumed, isa commonly used measure of cardiorespiratory (oraerobic) fitness. Direct measurement of V02 ffm isexpensive both in terms of time and cost of precise gasanalysis. Thus, various predictive tests have beendevised to evaluate aerobic fitness. These indudeperformance related measures, for example walking orrunning for a given time,' performing a multistageprogressive shuttle test (MST) with increases in speedevery minute2 or the measurement of heart rate duringgiven workloads and extrapolating to a predictedmaximum heart rate to determine an estimate ofV02ma The Cooper and MST can cater for largenumbers of subjects simultaneously but have the
147
on January 1, 2020 by guest. Protected by copyright.
http://bjsm.bm
j.com/
Br J S
ports Med: first published as 10.1136/bjsm
.29.3.147 on 1 Septem
ber 1995. Dow
nloaded from
Prediction of maximum oxygen uptake: S Grant et al.
disadvantage that they are maximal and thus create apotential health risk. In addition, these tests require ahigh degree of motivation to elicit a truly representativemaximal effort. A submaximal test on a cycle ergometerdoes not rely on subject motivation but is timeconsuming.
The validity of the Cooper, MST, and linear extra-polation methods has been assessed separately but nostudy has compared all three tests within the samepopulation. A limitation of some of the previous studiesis that only the correlation between the predicted scoreand direct measurement has been given. Correlations donot provide the whole picture. At the time of writingthis paper, the Physiology Section of the BritishAssociation of Sport and Exercise Sciences is compilinga guide for field testing. The results from this study cancontribute to the current body of knowledge relating tofield testing. A study which compared the Cooper,MST, and linear extrapolation methods in a wideranging young male population would provide in-formation on the applicability of these tests.
The present study was designed to compare threepredictive tests commonly used in the Department ofPhysical Education and Sports Science at the Universityof Glasgow-Cooper walk/run test, multistage shuttlerun test (MST), and linear extrapolation with the directmeasurement of maximum oxygen uptake on a tread-mill.
MethodsSubjectsTwenty-two healthy males from the university com-munity volunteered to participate in the study. Allsubjects gave informed consent and the study wasapproved by the local ethics committee. The subjectswere involved in a variety of sports, mostly of anendurance nature, but at differing levels of ability andtraining status.
DesignThe subjects performed four tests on three separatedays. On day one subjects performed a submaximalcycle ergometer test followed 30 min later by a directmeasurement on a treadmill. These tests were carriedout first as they were laboratory based. Thus, it waspossible to monitor the ECG of each subject before heunderwent the other maximum tests. The Cooper testand the MST were carried out on separate days with theorder of testing randomized. An interval of at least twodays was allowed between test days.
Submaximal cycle ergometer testThis predicted,, protocol was a modification of theYMCAs of American protocols.4 The initial workloadselected was based on the responses to the warm-up,body mass and training status of the athlete, to elicit asteady state heart rate around 100 beats min'. Theother two workloads were selected to elicit steady state
heart rates between 120-140 beats * min' and 150-170beats * min-.
After a 3 min warm-up the test consisted of threecontinuous submaximal exercise bouts of 5 min durationon a Monark cycle ergometer (818 Monark Crescent,Varberg, Sweden). Cycling was performed at 60 revsper minute. Heart rates were measured during the fourthand fifth minute of each stage using a three lead ECGS & W Medical cardio aid (type CB600M) to measureheart rate. Expired air was collected in the final minuteof each stage. Subjects were connected to a Douglas bagby a rubber mouthpiece, Hans Rudolph 2700 valve, andstandard tubing. Gases were analysed using a PKMorgan CO2 analyser, type 801A, and a TaylorServomex 02 analyser, type 570A. Volume was meas-ured using a Parkinson Cowan volume meter.
All analysers were calibrated before each test withknown gas concentrations.To allow for comparison of various methods of
extrapolation, VO2max was predicted using the linearextrapolation method as follows: (a) the measuredsubmaximal V02 and heart rate were extrapolated tothe measured maximum heart rate; (b) the measuredsubmaximal VO2 and heart rate were extrapolated tothe predicted maximum heart rate (220 minus age); and(c) the estimated VO25 and measured heart rate wereextrapolated to the predicted maximum heart rate (220minus age).
Maximal treadmill testThirty minutes elapsed between the submaximal testand the maximal treadmill test. During this time thesubjects were given a warm-up on the treadmill andfamiliarization with the treadmill, nose clip, and mouth-piece was provided. The maximal treadmill test protocolwas based upon that recommended by the BritishAssociation of Sports Science.6 Heart rate and oxygenconsumption were measured as for the submaximalcycle ergometer test.
Multistage progressive shuttle run test (MST)This test was performed on a hard synthetic surfacelocated in an indoor sports arena. Subjects ran betweentwo lines 20 m apart in time with a sound signal whichwas emitted from an audio cassette. The frequency ofthe sound signals increased every minute. The test wasterminated when the subject was no longer able tofollow the set pace and did not reach the targeted lineon three consecutive occasions. The level attained andthe number of shuttles at that level allowed a predictionof VO2ma, to be made according to Ramsbottom et al.2When possible, subjects ran in pairs in order to providea source of motivation.
Cooper 12 min walk/run testThis test was also performed in the indoor arena, on a234 m jogging track. The warm-up included bothaerobic activities and flexibility exercises. The subjectsran in pairs in order to provide a source of motivation.A prediction of VO2maxfrom the distance covered at theend of the 12 min period was obtained using the table
148 Br J Sports Med 1995; 29(3)
on January 1, 2020 by guest. Protected by copyright.
http://bjsm.bm
j.com/
Br J S
ports Med: first published as 10.1136/bjsm
.29.3.147 on 1 Septem
ber 1995. Dow
nloaded from

Prediction of maximum oxygen uptake: S Grant et al.
Table 1. Summary statistics of VO2max scores derived from various tests (mean(s.d.))
Treadmill (O°2max) Cooper (VO2max) MST (V2ma,) Predicted6.8)l*g*mn6.1.m*k1 * min-P5edm*gedUE (VO2max)
60.1(8.0) ml kg-1 min-' 60.6(10.3) ml - kg-' min-' 56.6(8.0) ml kg-' min-' 52.0(8.4) ml - kg-1 min-'
provided by Cooper.' The subjects who ran more than2 miles had VO,2n predicted by applying the distancerun to the Cooper regression equation.
Statistical analysisThe basis of the statistical analyses were regressions ofeach test (that is, Cooper, MST and predictedLE)separately on the treadmill value (that is, the predictivetest was the response variable and the treadmill valuethe explanatory variable). Separate standard f test of theslopes being equal to I and the intercepts being equal to0 (that is, no bias) were carried out for each of theseregressions.
In the illustrations of the effect of calibration, ameasurement value of 60 ml -kg-' -min' was selectedfor each test separately to 'predict' the correspondingtreadmill value. The simple approximate formula for the95 % confidence interval was used:
60-A 2SB -B
Where A, B and S are the estimated intercept, slope ands.d. of the regression of the test on the treadmill value.
ResultsThe mean (s.d.) age of the subjects was 22.1(2.4) (19-29years) and the means(s.d.) body mass was 72.4(8.0) kg(56.4-92.6 kg).The mean(s.d.) from the various tests in
mrl kg-' min- are given in Table 1. The linear extra-polation method used the measured maximum heartrate.
Scattergrams of the relationships between the directmeasurement of Va2, on the treadmill and the scoresobtained on the Cooper, MST, and predicteduE re-spectively are given in Figures 1-3 and show that thereis an almost constant underestimation of V02nforboth the MST and predictedu values.As none of the slopes of the regression of each of the
various predicted values on measured treadmill VO2q.was significantly different from 1, then any bias on thepredicted values can be assumed constant across therange of measured treadmill VO2, measured (that is,45-75 ml-l' kg-'l min'). Accordingly, estimates ofsuch systematic biases, as well as correlation coefficients,for each predicted value are given in Table 2. The bias isthe respective test VO2,, minus the treadmill VO2a,and both the MST and predicted, tests showed asignificant systemic underestimation. In addition, all ofthe predicted values correlated reasonably well with thetreadmill VO2ma and of these, the Cooper test gave thehighest correlation.
I-
WIE
4)0
-
Uco.>CL0o
xx
- Best fitting line---Line of equality
50 60 70Treadmill VO2 max (ml-kg'.min')
80
Figure 1. The relation between the Cooper and treadmilltests
901-
Ca 80E_
'r 70> g4).=- 60
( E 50
S 40
30
-
,~~~~~~~~~~~~~~~~~~~~~~~~~~. Ax0
.--'Lieo eult
1 I40 50 60 70 80
Treadmill VO2 max (ml .kgl.min'1)
Figure 2. The relation between the MST and treadmilltests
X-IcEto
Ex
CU00>
U311
-
._
CL6
x x
- Best fitting lineLine of equality
50 60 70Treadmill VO max (ml kg -mind)
80
Figure 3. The relation between the predicted,, and treadmilltests
A substantial correlation and no systematic bias arerequired if a good prediction of VO,. is to be made(that is > 0.8). The information in Table 2 shows thatnot only are the results from the Cooper test unbiased,but that the Cooper test has the best correlation.
Br J Sports Med 1995; 29(3) 149
I-
IF
on January 1, 2020 by guest. Protected by copyright.
http://bjsm.bm
j.com/
Br J S
ports Med: first published as 10.1136/bjsm
.29.3.147 on 1 Septem
ber 1995. Dow
nloaded from
Prediction of maximum oxygen uptake: S Grant et al.
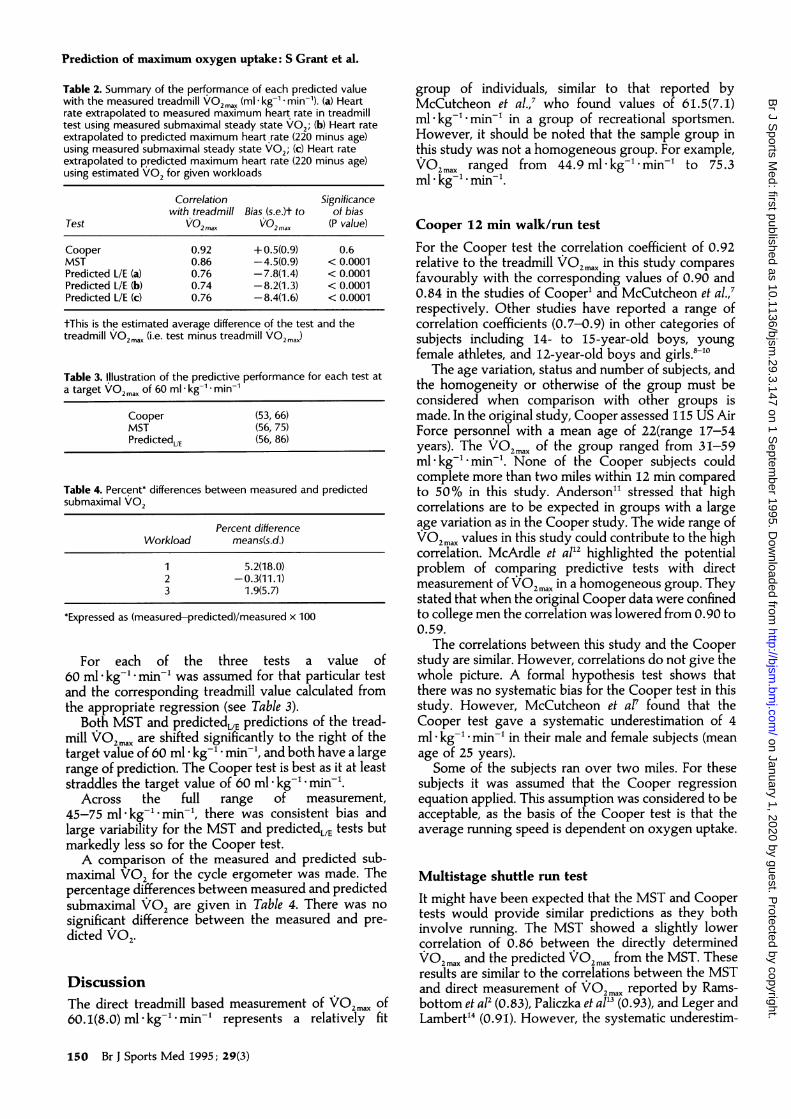
Table 2. Summary of the performance of each predicted valuewith the measured treadmill VO2 max (ml -kg-' -min-). (a) Heartrate extrapolated to measured maximum heart rate in treadmilltest using measured submaximal steady state V02; (b) Heart rateextrapolated to predicted maximum heart rate (220 minus age)using measured submaximal steady state V02; (c) Heart rateextrapolated to predicted maximum heart rate (220 minus age)using estimated V02 for given workloads
Correlation Significancewith treadmill Bias (s.e.)t to of bias
Test VO2max VO2max (P value)
Cooper 0.92 + 0.5(0.9) 0.6MST 0.86 -4.5(0.9) < 0.0001Predicted L/E (a) 0.76 -7.8(1.4) < 0.0001Predicted L/E (b) 0.74 -8.2(1.3) < 0.0001Predicted L/E (c) 0.76 -8.4(1.6) < 0.0001
tThis is the estimated average difference of the test and thetreadmill VO2max (i.e. test minus treadmill VO2ma,)
Table 3. Illustration of the predictive performance for each test ata target VO2max of 60 ml * kg-' * min-'
Cooper (53, 66)MST (56, 75)PredictedUE (56, 86)
Table 4. Percent* differences between measured and predictedsubmaximal V02
Percent differenceWorkload means(s.d.)
1 5.2(18.0)2 -0.3(11.1)3 1.9(5.7)
*Expressed as (measured-predicted)/measured x 100
For each of the three tests a value of60 ml kg-' -min' was assumed for that particular testand the corresponding treadmill value calculated fromthe appropriate regression (see Table 3).
Both MST and predictedLE predictions of the tread-mill V02 mx are shifted significantly to the right of thetarget value of 60 ml * kg-' * min-', and both have a largerange of prediction. The Cooper test is best as it at leaststraddles the target value of 60 ml -kg-' - min'.
Across the full range of measurement,45-75 ml -kg-' min-, there was consistent bias andlarge variability for the MST and predictedLE tests butmarkedly less so for the Cooper test.A comparison of the measured and predicted sub-
maximal V02 for the cycle ergometer was made. Thepercentage differences between measured and predictedsubmaximal V02 are given in Table 4. There was nosignificant difference between the measured and pre-dicted V02.
DiscussionThe direct treadmill based measurement of VO2max of60.1(8.0) ml- kg-' minm represents a relatively fit
group of individuals, similar to that reported byMcCutcheon et al.,7 who found values of 61.5(7.1)ml kg-l minm' in a group of recreational sportsmen.However, it should be noted that the sample group inthis study was not a homogeneous group. For example,VO2max ranged from 44.9 ml-kg-' min-' to 75.3ml * kg-' * min-'.
Cooper 12 min walk/run testFor the Cooper test the correlation coefficient of 0.92relative to the treadmill VO2max in this study comparesfavourably with the corresponding values of 0.90 and0.84 in the studies of Cooper' and McCutcheon et al.,7respectively. Other studies have reported a range ofcorrelation coefficients (0.7-0.9) in other categories ofsubjects including 14- to 15-year-old boys, youngfemale athletes, and 12-year-old boys and girls.8'-0
The age variation, status and number of subjects, andthe homogeneity or otherwise of the group must beconsidered when comparison with other groups ismade. In the original study, Cooper assessed 115 US AirForce personnel with a mean age of 22(range 17-54years). The VO2max of the group ranged from 31-59ml- kg-"l minm. None of the Cooper subjects couldcomplete more than two miles within 12 min comparedto 50% in this study. Anderson" stressed that highcorrelations are to be expected in groups with a largeage variation as in the Cooper study. The wide range ofVO2maxvalues in this study could contribute to the highcorrelation. McArdle et al'2 highlighted the potentialproblem of comparing predictive tests with directmeasurement of VO2max in a homogeneous group. Theystated that when the original Cooper data were confinedto college men the correlation was lowered from 0.90 to0.59.
The correlations between this study and the Cooperstudy are similar. However, correlations do not give thewhole picture. A formal hypothesis test shows thatthere was no systematic bias for the Cooper test in thisstudy. However, McCutcheon et al7 found that theCooper test gave a systematic underestimation of 4ml- kg-"' minm' in their male and female subjects (meanage of 25 years).Some of the subjects ran over two miles. For these
subjects it was assumed that the Cooper regressionequation applied. This assumption was considered to beacceptable, as the basis of the Cooper test is that theaverage running speed is dependent on oxygen uptake.
Multistage shuttle run testIt might have been expected that the MST and Coopertests would provide similar predictions as they bothinvolve running. The MST showed a slightly lowercorrelation of 0.86 between the directly determinedVO2max and the predicted VO2ma. from the MST. Theseresults are similar to the correlations between the MSTand direct measurement of V02 max reported by Rams-bottom et a12 (0.83), Paliczka et al'3 (0.93), and Leger andLambert'4 (0.91). However, the systematic underestim-
150 Br J Sports Med 1995; 29(3)
on January 1, 2020 by guest. Protected by copyright.
http://bjsm.bm
j.com/
Br J S
ports Med: first published as 10.1136/bjsm
.29.3.147 on 1 Septem
ber 1995. Dow
nloaded from

Prediction of maximum oxygen uptake: S Grant et al.
ation of VO2m, of 4.5 ml kg-' min' has not pre-viously been reported.
There are several possible reasons for the results inthis study. During the MST it was observed that somesubjects turned more economically than others. Thisfactor was particularly noticeable at higher speeds whenturning technique is important. Anaerobic power mayhave a role to play in MST scores. After turning at theend of each shuttle the subject must accelerate to obtainthe desired speed.
The 'drive' phase during each acceleration increasesthe likelihood of an anaerobic contribution to energyexpenditure and as the speed increases the more thisanaerobic component will be needed. Furthermore,during the latter stages of the MST the anaerobicmetabolism component will be increased as the indi-vidual's aerobic system becomes fully taxed. Thus, anindividual with a low anaerobic power may under-perform in the MST relative to his aerobic power.
Comparison of the Cooper and MST tests
Both the Cooper and MST tests involve running.Therefore, it is somewhat surprising that the MSTshowed a systematic underprediction while the Cooperdid not.
The less accurate prediction of VO2m, using the MSTcompared with the Cooper test suggests that theCooper test should be used in preference to the MST infield testing. However, while the MST has been shownto give a systematic underestimate of VO2m,,, it maystill be sensitive to changes in training status. Inaddition, the MST may be more relevant to gamesplayers, for example hockey or soccer (where turning isa feature of the game).As the derivations of both the MST and Cooper
estimation of VO2ma are from regression analysis withthe direct measurement, the anaerobic component inboth tests is embedded in the predictive equation. It canbe assumed that the anaerobic component will have abearing on the distance travelled. If low anaerobicpower is a possible explanation for the underpredictionin the MST it is unclear why there was not a similarunderprediction with the Cooper test.No physiological variable was monitored to gain an
impression of the degree of effort in the MST andCooper tests. However, subjects were highly motivatedand they ran in pairs to provide a source of motivation.At the end of the tests most subjects displayed signs ofsevere distress suggesting that maximum effort hadbeen given.
Linear extrapolationWhile lack of motivation may be a reason for differencesbetween predicted and measured VO2, values in theMST and Cooper tests, this cannot be the explanationfor the systemic underestimate of 7.8 ml -kg-' min'using the predicted,,L method.
There are three assumptions in a linear extrapolationprediction: (a) similar maximum heart rates for allsubjects of the same age; (b) the heart rate/oxygen
consumption relationship is linear; and (c) the mech-anical efficiency of all subjects is the same.
The heart rates from the three submaximal pointswere extrapolated to the measured maximum heart ratein the treadmill test. There was no significant differenceon average between the measured maximum heart rateand predicted maximum heart rate (220 minus age).Thus it is not surprising that extrapolation to the agepredicted heart rate (220 minus age) does not make anymeaningful difference to the prediction (a correlation of0. 76 based on the measured maximum heart rate against0.74 based on predicted maximum heart rate and thebias remains similar).
Individual subject correlations between heart rateand Vo2 on the three submaximal workloads werecalculated and had a median value of 0.99, with a rangeof 0.91-1.00. When such correlations were calculatedon the bias of the three submaximal and the maximumvalues, the median correlation was again 0.99, with arange of 0.93-1.00, and indicated a very strong linearrelationship across all workloads for heart rate of V02.
There was no evidence of any significant differencebetween the predicted and measured VO2 at the threesubmaximal workloads. There was a strong indication,particularly at the first and second workloads, of a widerange in oxygen cost.
Further, the correlations based on the measured andpredicted submaximal Va2 respectively with the directmeasurement of V02O were very similar (0.74 and0.76 respectively). Overall, therefore, there was noindication that the measurement of submaximal VO2, orindeed maximum heart rate, made any significantcontribution to VO2. prediction.
The underprediction found in this study has beenrecorded by other researchers who have estimatedV02max from an extrapolation to maximum heart rateusing measured VO2 and heart rate.'5'7 Zwiren et a08and Louhevaara et a!'9 both reported an overestimateusing heart rate/workload points from two and threesubmaximal loads respectively to predicted maximumheart rates.
It is plausible that the reason for the low predictivecapacity of the predictedLE method can be partlyexplained by the fact that a running VO' , is known tobe higher than a VO2, measurement using cycling(except if cyclists are used). A cycling VO2ma is around10% lower than a running VO2.212 Thus, it wouldbe expected that the treadmill VOa, value of60 ml - kg-'l min' would be around 54 ml - kg-' *min'on a cycle. This value of 54 ml -kg-' * min' is close tothe predicted, value of 52.0 ml kg-' -min'. It shouldbe pointed out that other studies have reported anunderprediction of VO2, using a cycle test forprediction and direct measurement of VO2 15-172324Studies which have used a cycle test for prediction anda treadmill test for direct measurement have also foundan underprediction of VO2max 625
SummaryThe predictive tests used in this study yielded differentVO2max scores. Thus it is inappropriate to compare
Br J Sports Med 1995; 29(3) 151
on January 1, 2020 by guest. Protected by copyright.
http://bjsm.bm
j.com/
Br J S
ports Med: first published as 10.1136/bjsm
.29.3.147 on 1 Septem
ber 1995. Dow
nloaded from

Prediction of maximum oxygen uptake: S Grant et al.
VO2max scores obtained from different predictive tests.The findings from this study indicate that, among thethree tests for the population assessed, the Cooperwalk/run test is the best predictor ofVO2 .. Predictionsfrom the MST and the submaximal ergometer testprovided a less accurate measure of maximum oxygenuptake compared to the Cooper walk/run test and gavea systematic underestimate of VO2max'
References1 Cooper KH. A means of assessing maximum oxygen intake.
JAMVA 1968; 203: 135-38.2 Ramsbottom R, Brewer J, Williams C. A progressive shuttle run
test to estimate maximal oxygen uptake. Br 1 Sports Med 1988;22: 141-44.
3 Maritz JS, Morrison JF, Peter J, Strydom HB, Wyndham CH. Apractical method of estimating an individual's maximal oxygenintake. Ergonomics 1961; 4: 97-122.
4 Pollock ML, Wilmore JH, Fox SM. Exercise in health and disease.New York: W B Saunders Company, 1984.
5 American College of Sports Medicine. Guidelines for exercisetesting and prescription. Philadelphia: Lea and Febiger, 1986.
6 British Association of Sports Science. (Sports Physiology Section)Position Statement on the Physiological Assessment of the EliteCompetitor, Second Edition, 1988.
7 McCutcheon MC, Sticha SA, Giese MD, Nagal FJ. A furtheranalysis of the twelve minute run prediction of maximal aerobicpower. Res Q 1990; 61: 280-83.
8 Doolittle TL, Bigbee R. The twelve minute run/walk; a test ofcardiorespiratory fitness of adolescent boys. Res Q 1968; 39:491-95.
9 Maksud MG. Energy expenditure and VO2,,., of female athletesduring treadmill exercise. Res Q 1976; 47: 692-97.
10 Jackson AS, Coleman AE. Validation of distance run tests forelementary school children. Res Q 1976; 47: 86-94.
11 Anderson GS. A comparison of predictive tests of aerobiccapacity. Can J Sports Sci 1992; 17: 304-8.
12 McArdle WD, Katch FI, Katch VL. Exercise physiology, energy,nutrition and human performance. Second edition. Philadelphia:Lea and Febiger, 1986.
13 Paliczka VJ, Nichols AK, Boreham CAG. A multistage shuttle runas a predictor of running performance in maximal oxygen uptakein adults. Br J Sports Med 1987; 21: 163-65.
14 Leger L, Lambert J. A maximal multistage 20 m shuttle run test topredict VO2mnu. Eur J Appl Physiol 1982; 49: 1-12.
15 Davies CTM. Limitation to the prediction of maximum oxygenintake from cardiac frequency measurements. J Appl Physiol 1968;24: 700-6.
16 Fitchett M. Predictability of VO,, from submaximal cycleergometer and bench stepping test. Br J Sports Med 1985; 19:85-8.
17 Wilmore JH, Rogby FB, Stanforth PR, Buono MJ, Constable SH,Tsas Y, et al. Ratings of perceived exertion, heart rate, and poweroutput in predicting maximal oxygen uptake during submaximalcycle ergometry. Physician Sports Med 1986; 14: 133-43.
18 Zwiren LD, Freedson PS, Ward A, Wilke S. Rippe JM. Estimationof VO2,,n.=: A comparative analysis of five exercise tests. Res Q1991; 62: 73-8.
19 Louhevaara V, Ilmarimen J, Oga P. Comparison of the AstrandNomogram and the WHO extrapolation methods for estimatingmaximal oxygen uptake. Scand J Sports Sci 1980; 2: 21-25.
20 Miles DS, Critz JB, Knowlton RG. Cardiovascular, metabolic, andventilatory responses of women to equivalent cycle ergometerand treadmill exercise. Med Sci Sports Exerc 1980; 12: 14-19.
21 Faulkner JA, Roberts DE, Elk RL, Conway J. Cardiovascularresponses to submaximal and maximum effort cycling andrunning. J Appl Physiol 1971; 30: 357-461.
22 Miyamura M, Honda Y. Oxygen intake and cardiac output duringmaximal treadmill and bicycle exercise. J Appl Physiol 1972; 32:185-88.
23 Kasch FW. The validity of the Astrand and Sjostrand submaximaltests. Physician Sports Med 1984; 12: 47-52.
24 Cink RE, Thomas TR. Validity of the Astrand-Rhyming nomo-gram for predicting maximal oxygen intake. BrJ Sports Med 1981;15: 182-85.
25 Krock LP, Hartung GH, Bisson RU, Crandall CG, Myhre LG.Predicting VO2max from a submaximal test in aerobically trainedand untrained men. Physiologist 1992; 35: 184.
152 Br J Sports Med 1995; 29(3)
on January 1, 2020 by guest. Protected by copyright.
http://bjsm.bm
j.com/
Br J S
ports Med: first published as 10.1136/bjsm
.29.3.147 on 1 Septem
ber 1995. Dow
nloaded from