of seismicity arid related effects at nj'sa ames-dryden
TRANSCRIPT

NASA Contractor Report 170415
IV"."),, c f~ - flU 1--1-1,:) )
NASA-CR-170415 19860005236
Inve:~tigation of Seismicity arid Related Effects at NJ'SA Ames-Dryden Flight Research Facility, Computelr Center, Edwards, California Robert D. C:ousineau, Richard Crook, ,Jr., and David J. Leeds
Grant NCA2·0R283·304 November 1985
N~;I\ National Aeronautics and Space Administration
1/11/1111111111111111111111111111111111111111 NF02568
\fINIDWA 'NOldIllJV: j
VSlfN 'AI:l\/~Oll
~31N3J HJ~J"nS;\1 J TOO" i'/1
gsm 9 i :)30
AdfJ3 A~VHrjJ J

All Blank Pages
Intentionally Left Blank
To Keep Document Continuity

NASA Contractor Heport 170415
----,------------------------,----------------------------------------
Invelstigation of Seismicity and Related Effects at NASA Ames-Dry~len Flight Research Facility, Com~puter Center, Edwards, California ---------_._----,---------------,-----------------------------------------Robert D. Cousineau, Richard Crook, Jr., and David J. Leeds Soils International, San Gabriel, California
Prepared for Ames Research CEmter Dryden Flight Research Facility Edwards, California in consortium with Harvey Mudd Collelge Pomona, California under Grant NCA2·0R283·304
1985
N"S/\ National Aeronautics and Space AdministraUon Ames Research Center
Dryden Flight Research Facility Edwards, California 93523


FOR.EWORD
This report was prepared under the general supervision of Mr. Karl F. Anderson
of NASA Ames Research Center, Dryden Flight Research Facility, Edwards, Cali
fornia and Dr. B. Samuel Tanenbaum, Dean of Faculty, Harvey Mudd College,
Claremont, California, Collaborators in the investigation. The investigation
was sponsored by and technical direction and review was provided by Dr.
Kajal K. Gupta of NASA Ames Research Center, Dryden Flight Research Facility,
Edwards, California.
Principal investigators were Robert D. Cousineau, Civil Engineer and Principal
of Soils International of San Gabriel, California, Richard Crook, Jr.,
Geologist, and David J. Leeds, Engineering Seismologist.
The findings, conclusions and recommendations represent the professional
opinions of the principal investigators as indicated by their signatures
below.
The investigation was conducted in accordance with generally accepted engi
neering and geologic procedures and, inthe opinion of the undersigned, the
accompanying report has been substantiated by mathematical data in confor
mity with generally accepted principles of engineering and geological
professions and presents fairly the information set forth in the Interchange
for Joint Research, as modified by agreements between the coordinators and
the principal investigators.
Principal Investigators:
r( u1f~ ~D-04, r' Richard Crook, Jr. Engineering Geologist, EG 924
iii
David J. Leeds Engineering Geologist, EG 373 Geophysicist GP 17


1. INTRODUCTION/GENERAL
1,.1 Scope
1 .. 2 Location
2. GEOLOGY
2 .. 1 Regional Geology
CONTENTS
2 .. 2 Local and Site Geology
2.3 Regional Tectonics
2.4 Significant Faults
2.5 Fault Classification
2.6 Fault Rupture
2.7 Potential for Site Ground Failure
3. S[ISHOLOGY
3.,1 General
4.
5.
6.
3.2 Historical Seismicity
3.3 Significant Earthquakes
3.,4 Recurrence
SEISMIC CRITERIA
4.,1 ~1ethodology
4.2 Seismic Source Areas
4.3 Attenuation
4.4 Ground ~1o t ion
DESIGN ACCELEROGRAMS
RECOMMENDAT IONS FOR ~;EISMIC DESIGN
7 • RECOMMENDATIONS FOR FUTURE STUDIES
v
CRITERIA
3
3
8
12
13
23
25
25
27
27
29
35
37
39
39
39
40
40
45
49
50

8. REFERENCES
8.1 General Geology
8.2 General Seismology
APPENDICES
CONTENTS
(Contd.)
A. Plot Plan and Boring Logs
B. Seismic Scales
C. Accelerograms, Spectra, and Site Geology
vi
51
51
55
59
68
72

PLATES
1.1 Site Location Map
2.1 Regional Geologic Map
2.2 Geologic Map of a Portion of Edwards Air Force Base
2.3 Location of Major Faults in Southern California and Epicenters of Earthquakes, Magnitude 6.0 or Greater
2.4 Maximum Credible Rock Acceleration from Earthquakes
2.5 Earthquake Magnitude vs. Fault Rupture Length
2.6 Historic Fault Breaks
3.1 Earthquake Epicenters near Edwards AFB Magnitude 4.0, Greater
3.2 Earthquake Epicenters near Edwards AFB Magnitude 3.0, Greater
3.3 Earthquake Epicenters near Edwards AFB, All Events, 1932-83
4.1 Intensity vs. Magnitude and Epicentral Distance
4.2 Acceleration vs. MM Intensity, Near Field - Hard Site
4.3 Acceleration vs. MM Intensity, Far Field - Hard Site
TABLES
2.1 Selected Active and Potentially Active Faults
2.2 Fault Activity
3.1 Potential Ground Motion from Significant Faults
3.2 Earthquakes of Southern California - Historic
3.3 Earthquakes of Southern California - 1912-1984
4.1 Representative Ground Motions at NASA Edwards Facility
5.1 Accelerogram Data
vii


1. INTRODUCTION/GENERAL
This report provides criteria for seismic evaluation at con
struction sites at the NASA Ames-Dryden Flight Research Facility
located at Edwards Air Force Base, Mojave Desert Area, Califor
nia.
1.1 ~~ope
This geological and seismological investigation is based upon a
modest amount of field geological surveys, reviews of published
literature, earthquake catalogs and reports, and interviews
with professionals familiar with the area. Site soils and
foundation data are further supported by previous investigations
by others.· The results of the investigation are presented as
seismic design criteria, with design values of the pertinent
ground motion parameters, probability of recurrence, and recom
mended analogous time-history accelerograms with their corres
ponding spectra. The recommendations apply specifically to the
computer center site and should not be extrapolated to other
sites with varying foundation/geologic conditions or different
seismic environments.
1.2. Location
The project site lies in the west-central portion of the Mojave
Desert Province, California, approximately 17 miles southeast
of the town of Mojave (Plate 1.1). The NASA Dryden Facility and
Computer Center is on the west edge of Rogers Lake at the north
edge of the Air Force facilities on Edwards Air Force Base.
1

SITE LOCATION MAP Plate 1.1
2

2. GEOLOGY
2.1 ~_onal Geology
The Mojave Desert Province (see Regional Geologic Map, Plate 2.1,
is a triangular-shaped block of regionally distinct geology
and geomorphology that, in the vicinity of the site, is bounded
on the north by the northeast-trending Garlock fault and on the
south by the southeast-trending San Andreas fault (Hewett, 1954).
In this region (Plate 2.1) the block is a plain that slopes gently
eastward to the town of Barstow. This plain is dotted with
numerOUEi isolated hills and scattered ridges and local mountain
masses all consisting of crystalline basement rock.
Parts of this plain are smooth rock surfaces with a sparse cover
of debris (pediments), but large parts are underlain by deep
fault-bounded subsurface valleys or basins filled with alluvium
and lake deposits (D. J. Ponti, oral communication, 1983). The
entire Mojave Desert Province is characterized by internal
drainage, hence several of the valleys and basins in this area
contain dry lakes or playas at their surface. Among the larger
of these are the nearby Rogers and Rosamond Lakes.
Rocks of the western Mojave Desert can be divided into three
main divisions: (1) crystalline rock of pre-Tertiary age;
(2) sedimentary and volcanic rocks of Tertiary age; and
(3) sediments of Quaternary age.
The crystalline rocks are largely plutonic and consist primar
ily of quartz monzonite with a few large granite bodies and
small localized inclusions of hornblende diorite (Dibblee, 1967).
Near the regional, boundaries of the block, adjacent to the
San Andreas and Garlock faults, the plutonic rocks contain
small to large pendants (inclusions) of older metamorphic rocks.
3

,.,

EXPLA.NA.TION
J';"'''''''~QI""mo:'.' ··,huh,o; I.'· ."du .. '~:£.' -L..oo.II; ,.'_pyrool .. li"ro,k.
m C~r:~~~l\~:~~~~':~b~I~;I"; 0Tu'''.'I'K .... '",i~'''"k.
M;:::t~:r~~,~:II:!~': ::;'.~;~:::j~~~~~~ ." ..... n."t •• "d~M"u
Q ~~~":"I~.:.:~:':~p:~loa" .. J c::I p~o:,i. .. '.O.OLlS m ... ~Olo.nl.
m P',:,~~"'-"" mot_dlm.Qlul' B P~;f~';~i:~,:',~~~!· on~
r::::=J p(\:"':~:~:::~'·C'~CIo ... it. ~ I'ool." •• io m.u~uJ •• nI' .",,11.
CJ I'M'II.I~.~ " .. b"nll .. ~'" ml,l... ['-::::J ,'"1"'''''010,,," ,,,., •• ul,·.,,I. r~.ko
0pon",,1.0nlonmOriOO
• Mloo,oolwlonmor!oo
m!ITl u~~~:~~;~::o oehll' 51l U~~!;I,~~d.t.,:omb"U
L'!::l t.:~:: !::;:;;\:I~ :=~,:"M.'7 B 1'""..,,,1.<,.,, ""u.<h ... ,"
G t~;:.,~ 1"r ... ,u~'lOA 1nO .. ,,".'~hl •
.. U ......... " ............. ·I.' .. ".".'n"' .. '.I.H~' ........ "_' .... I .... .
~ ..... ~~. ~·_· .... --'--"'- .......... A ••• A ••
Thrust fault (BaTbs on UppeT plate; da..'1hed,where
approximately located, dotted where concealed)
REGIONAL GEOLOGIC MAP
Taken from Bakersfield, Los Angeles, San Bernardino 8 Trona
California Division Mines and Geology Map Sheets. CONTOUR INTERVAL 200 FEET
WITH SUPPLEMENTARY CONTOURS AT 100 FOOT INTERVALS
Plate 2.1
5

1
1
1
1
1
1
1
1
1
1
1
1
1
1
1
1
1
1
1
1
1
1
1
1
1
1
1
1
1
1
1
1
1
1
1
1
1
1
1
1
1
1
1

The sedimentary and volcanic rocks of Tertiary age include
conglomerates, sandstones, shales, chemical sediments, tuffs,
breccias and lava flows and plugs ranging in composition from
rhyolite to basalt. These rocks rest upon a deeply eroded
surface of the crystalline rock. With the exception of a
marine and brackish-water formation at the west end of the
region, all sedimentary units in this portion of the Mojave
Desert are non-marine, as· are the lava flows.
The Quaternary age sediments are mainly alluvial deposits that
fill the major depressions of this region. They range from
coarse fanglomerate to sand, silt and locally to fine clay.
In most places these sediments rest unconform~bly on rocks of
pre-Tertiary age. Locally these sediments are covered with a
thin veneer of wind blown sand. In the areas along the east
and south edges of Rogers and Rosamond Lakes this sand has been
deposited as dunes by the prevailing westerly winds.
Prior to and contemporaneous with the deposition of the Tertiary
age sediments the Mojave block was broken into a series of east
trending basins and elevated blocks by faulting. On-going
deformation tilted, folded and faulted the Tertiary sediments~
The Quaternary deposits that cover the basins and lap onto the
eroded surface of Tertiary and pre-Tertiary rocks, in the ele
vated areas, are themselves locally deformed in the same manner,
mostly near faults, but to a much lesser degree. This indicates
that tectonic deformation of the Mojave block has more or less
been continuous since the Mesozoic and has continued to the
present.
7

Most of this deformat~on has been caused by and is localized
along the major bounding faults and along the numerous north
west-trending faults within the block. The types of faults
include a complete range: strike-slip (both right and left
lateral); reverse or thrust; normal; and combined strike-slip/
reverse or strike-slip/normal.
2.2 Local and Site Geology
The NASA Dryden test facility is situated on a gently sloping
pediment that rises in a westerly direction for a distance of
approximately 6000 feet to a low north-trending ridge of
crystalline rock (Plate 2.2). The site is bounded on the east
by the Rogers Lake playa.
The pediment is developed on crystalline plutonic rock consis
ting of quartz monzonite with local inclusions of hornblende
diorite, as exposed in the footing excavations for the NASA Data
Analysis Facility. Foundation investigations and previous
mapping (Dutcher, Bader and Hiltgen, 1962, and Appendix A) on
the site indicate that crystalline rock is within 0 to 7 feet
of the ground surface under some of the NASA installation.
However, logs of water wells both north and south of the site
(Dutcher, Bader and Hiltgen, 1962) i~dicate that the rock
surface slopes away from the site. Two and a half miles north
of the site the rock surface is at a depth gre<;lter than 200 feet,
and one and a half miles south of the site it is at a depth
of 90 to 125 feet. The configuration of this_surface is not
known in detail, therefore it may be deeper than 7 feet under
uninvestigated portions of the site.
8

I 30
EXPLANATION
Oya Younger alluvium
Oyf Younger fanglomerate
Ols Lake shore deposits
Op Playa deposits
6 Od Ods Dune sand I
000 Older alluvium
Oof Older fanglomerate
OOS Older dune sand
pT lJ undifferentiated basement complex 18 15 14 primarily quartz monzonite
------ geologic contact, approximate +
./Ittst ." ------'"0
fault, dotted where concealed --.. 20 21 22
...--23 arrows indicate relative horizontal
• displacement
i / ! ~ I ,
I 0 0.5 2 I :3
29 21 /26 '"""' ---I !
I
~ SCALE IN MILES
I
I Contour Interval 25 feet
'<ct: +
~ I GEOLOGIC MAP 32 33+ ,34
I 35 OF
PORTION OF
EDWARDS AIR FORCE BASE
PLATE 2.2
9


Foundation investigation reports (see References) prepared for
projects on the site indicate that the crystalline rock is
highly weathered to depths of 5 to 15 feet. See Appendix A for
typical borings. However,. high density values obtained for
this rock indicate that it is sufficiently coherent and com
petent for structural foundations and should transmit seismic
energy without altering its "rock characteristics."
The surficial deposits overlying the crystalline rock on the
site have been mapped as alluvium (Dutcher, Bader and Hiltgen,
1962). Foundation investigation reports indicate that these
materials are predominantly moderately firm to firm, dense,
medium to fine-grained, silty sand with localized lenses of
clayey silt and gravel.
The rock surface drops eastward from the site beneath the
surface of Rogers Lake. Here the rock is overlain by playa
deposits consisting predominantly of clay, silt and fine sand.
There is no subsurface information as to the thickness of
these materials in the area of the site.
Although groundwater exists in the area, it generally is
found in the loose younger Quaternary deposits (Dutcher, Bader
and Hiltgen, 1962). Crystalline rock normally does not contain
much groundwater and none was encountered in any of the explora
tory borings on the site (Appendix A).
Owing to the shallow surface gradient and small drainage area
the site should not experience runoff in quantities large
enough to cause flooding problems.
11

2.3 Regional Tectonics
The Mojave block is both bounded by and internally cut by faults
that have been active through the Pleistocene and into the
Holocene or last13,000 years (Sieh, 1978; Burke, 1978, 1979, and
1979a; California Division of Mines and Geology, 1963, 1965,
1969 and 1969a; Jennings, 1975; Ponti and Burke, 1980; Ponti,
Burke and Hede1, 1981; Clark, 1973; Ross, 1969; Dibblee,1961, 1967;
and Guptil and others, 1979). Analysis of the geometric con
figuration, type and sense of displacements on these faults
indicate that the Mojaye block and adjacent regions have been
subjected to north-south compression and east-west extension
during this time. Additionally, seismic characteristics of
recorded earthquakes in the region suggest that these regional
stresses are still present.
This regional stress system has resulted in a consistent pattern
of right-lateral displacements on northwest-trending faults and
left-lateral displacements on northeast-trending faults. North
or east-trending faults in this system generally display normal
or reverse dip-slip displacements.
Whereas the two major bounding faults of the Mojave block, the
San Andreas and the Garlock, are characterized primarily by
strike-slip (horizontal) ~ovement, most of the -faults within
the block appear to accommodate regional stresses with a com
bination of strike-slip and dip-slip movement (Jennings, 1975;
Cummings, 1981; Hill and others, 1980; Hill and Beeby, 1977).
This is characteristic of most of the smaller faults in the
vicinity of the site.
12

The regional stress pattern described above is the resultant
stress field derived from the relative movement of the Pacific
Plate (northwest relative motion) with regard to the North
American Plate (southeast relative motion). The boundary
between these plates is the San Andreas fault. The Garlock
is a primary conjugate fault to this system whereas the north
west-trending interior faults are secondary conjugates of this
system.
Detailed mapping and trenching projects on the San Andreas
(Sieh, 1978) and Garlock (Burke, 1978) faults indicate that
the San Andreas has been nearly 10 times as active as the
Garlock during the last 14,000 years. Although similar
studies have not been carried out on the interior faults,
it is likely that activity on anyone fault of this group
is less than that of the Garlock by at least a similar amount
because the relief of stress in the Mojave block is most
likely distributed over many faults in this region (Cummings,
1981; Cummings and Leeds, 1977).
2.4 Significant Faults
The general pattern of faults in Southern California is well
illustrated in the figures presented in this section.
Plates 2.3 and 2.4 show the locations of the better known
faults and give an estimate of their maximum credible magni
tude seismic events. These faults are detailed in Table 2.1
with the basis of classification indicated in the footnotes.
The actual basis for assignment of magnitude is based on
Bonilla's (1970) data: the relationship between fault length
(length of surface rupture) and earthquake magnitude is
depicted in Plate 2.5.
13


o '927 (7.5)
--~~~-::;::--"-
1812 (7.0!)0
LEGEND
O 1925 (6.3)
$ 1971 (6.4)
NOTE'
Fault along which historic Ilast 200 years) displacement has occurred.
Quoternary fault displacement (during past 2 million years), w',thout historic (approximately 200 years) record.
Epicenter, date and magnitude of pre -1933 earthquakes.
Epicenter, date and magnitude of post 1933 earthquakes.
2. Foult troces ore queried where continuation or ~xistence is uncertain.
3. Pre· auaternary faults (older than 2 million years) not shown.
4. Epicenter ~otion and mognitude of pre- 1933 earthquakes were estimated from historical records ond damage reports assIgned on IntenSity VII (Modified Mercoli scole) or greater.
. , \ \
, '-
\ ,
-~-
REFERENCES + I. Fault Map of California, California Geologic Data Map Series- Map No.1,
California Division of Mines and Geology, 1975.
2. Hileman, J. A., and others, 1973, Seismicity of Southern California Region, January I, 1932 to December 31, 1972, Seismological Laboratory, California .Institute of Technology, Contribution No. 2385.
3. Map of Major Earthquakes and Recently Active Faults ',n the Sauthern California Regian compiled by Richard J. Proctor, GEOLOGY, SEISMICITY, and ENVIRONMENTAL IMPACT, SpeCial Publication, Association of Engineering Geologists, October, 1973.
120'
::~ '~--- ~ -- ... _-------...
,~
\ , ,
117'
", \
+
117°
1947 (6.2i $
SAN DIEGO
LOCATION OF MAJOR FAULTS IN SOUTHt:.RN CALIFORNIA
AND EPICENTERS OF EARTHQUAKES OF
MAGNITUDE 6.0 OR GREATER
10 0 ewews
COUNTY
SCALE IN MILES 10 20
~ I
RIVERSIDE
30 40 50
COUNTY
-9-006 (6.5)
~o
PLATE 2.3 115°
15


LEGEND
POTENTIALLY ACTIVE FAULTS _---r--- .---? ? -'~E (c.:t:=- t ~
Approximately located
Number in porenthe'ses is the maximum expected earthquake magnitude tor the faull,
Lines ClOd arrows divide the Son Andreas fault into four tectonic sections.
Queries at the ends of a fault indicate lock of strong evidence for its activity,
20 I
40 60 80 " .... I I I
Unlll or. doclmal fraction. of thl accII.ratlon of gravity, from .2; 10.110
MAXIMUM CREDIBLE ROCK ACCELERATION FROM EARTHQUAKES Ref: Greensfe1der, CDMG MS 23, 1974 PLATE 2.4
17

Fault Maximum credible
earthquake magnitude
Owens Valley························· 8.25 Furnace Creek························ 8.25 San Andreas: "creep" section ......... 7 Rinconada ............•............... 7.5 Death Valley ......................... 7 Death Valley zone .................... 7 Panamint Valley ...................... 7.25 Kern Front ......................... ·· 6.25 Garlock .............................. 7.75 Whi te Wolf ........................... 7.75 Pleito ............................. - . 7 Bi g Pine ............................. 7.5 Santa Ynez ........................... 7.5 More Ranch ........................... 7·5 Oakridge ' ............................. 7.5 San Cayetano ............ ~ ............ 6.75 Simi ................................. 6.5 Northridge Hills ..................... 6.5 Santa Susana ......................... 6.5 San Fernando ......................... 6.5 Si erra Madre ......................•.. 6.5 Malibu-Santa llinica-Raymond Hill ..... 7.5 Cucamonga ............................ 6.5 San Andreas: central section ........ 8.25 Pinto Mount~n .................... , .. 7.5 Helendale ............................ 7.5 Lockhart ............................. 7.5 Lenwood .............................. 7.25 Old Woman Springs .................... 7 Johnson Valley ....................... 7 Camp Rock-Emerson ........... '.' ....... 7 Harper ............................... 7 Blackwater .............. .- ............ 7 Cali co-Newberry ...................... 7.25 Pisgah-Bullion .... ·.·.· ... ····· .. ····7.25 Manix ................................ 6.25 Ludlow ............................... 7.25 Other Mojave Desert faults, not
named on accompanying map .......... 6.25-7 Newport-Inglewood .......... ··········7 v.'hittier-Elsinore ........ ,' ............ 7.5 San Jacinto zone.···················· 7.5 Laguna Salada ......................... 7.25 Superstition Hills ................. ·.7 Imperial ........... , ................. 7 San Andreas: southern section ....... 7.5 Sand Hills··························· 7.5
L-___ ~_~,,_,~_,~.~~,~~.,._ •.• ~ .. « ..... ""_ •• ,.''' .... ___ • __ -
Fault activjty rating
1 ....... .
References I
1 ........ Brogan, -1971; Hooke, 1972 1, 2, 3·· Allen, 1968 4 ...... " Hart ~ 1969 4 ...... " Brogan, 1971 4 ........ Hooke, 1972 4 ........ Proctor, 1973 4 ......... Proctor, 1973 3, 4.:... Cl ark, 1972; Hileman et aZ., 1973 1,3····· California Division of Mines, 1955 4 ........ Crowell, 1968 l?, 5, 6 . .. Carman, 1964 5, 6····· Dibblee, 1966 2?, 4 ..... Sylvester, 1972 5, 6 .... . 5, 6 .. · .. 4 ........ Wentworth et aZ. , 1973 4 ........ Wentworth et al. 4 ........ Saul, 1971; Wentworth et aZ., 1973 1········ Kahle et al. , 1971; U.S.G.S., 1971 4 ........ Streitz, 1972; Proctor, 1973 4 ........ Went worth et aZ" 1973 4 ........ Morlan and Yerkes, 1974 ~ ........ Allen, 1968 4 ........ Proctor, 1973 4 ........ Proctor, 19:-3 4 ........ Proctor, 1973 4 ........ Proctor, 1973 4 ........ Proctor, 1973 4 ........ Proctor, 1973 4 ...... " Proctor, 1973 4 ........ Proctor, 1973 4 ........ Proctor, 1973 4 ........ Proctor, 1973 4 .. ···· .. Proctor, 1973 1 ...... " Allen, 1965 4 ........ Proctor, 1973
4 ........ Proctor, 1973 3,4,7·· Richter, 1958 4.· ... ··· Lamar, 1972; Mann, 1955 1,2,3" Hileman et aZ., 1971
1, 2···· . . Hileman et al. , 1971 1, 2, 3· . Hileman et al. , 1971 1······· . Hileman et aZ. , 1971 6······· .
tGeneral reference: Jennings. 1970 ~Fault names in quotes are not named in the literature but are assigned here as a matter of convenience.
31;;;: Surface rupture during a historic earthquake. '2 ~ Presently occurring creep. 3~ Alignment of earlhquake epicenters, 4;;;: Latc Oua\crnar) or Holocene displacement.
S = Quaternary displacement. . . 6= Representative fault in a seismicall) active tectoniC province.
7:;;; Possible source of a major historic earthquake.
SELECTED ACTIVE AND POTENTIALLY ACTIVE FAULTS
Ref: Greensfe1der, CDMG MS 23, 1974
18
TABLE 2.1

-- en ~
E "'0 QJO'l +-'c c· ....
0 0 J-I()
~-:::I+-' O+-'
~ ~ v/" u· .... 1114-.....
~ "'0 Q)
0 • 1\ > > ~\ \ III S-... +-':::1 ~ C U - ..... c \
\ \ oc .-\\
0..,... ~ u \ @ c· ~ "0
\ ~ \ .-.... c 0 \ "" \
..J ::::> ~ lL.
0 0 C\I Z
~
0 ~ 0 -u \ \ \
~ \ , \ 0
\ \: \ r--I.D
1\ f\ f\
Ir.:"', \ \ \
w a:: ::::>
0 l-I()
a.. 1=
~ .\~ .\ ::::> a::
\ \ \
1\, !\ \ \
\ \
\. \ \ \
w 0 u C\I
~ lL. a::
1\ II 1\ 1\ 0 ::::> , \. \
\ \ \ Cf)
\ \ ,
\ \ \ '-' \ \ ~ v
1\ r\ 1\ \ \ \\ \
\\ \ \\ 1\
lL. 0
10
::r: l-(!)
Z W
\
\ \
\ \ \ \
t:~ \ \
..J
~
EARTHQUAKE MAGNITUDE
EARTHQUAKE MAGNITUDE VERSUS FAULT RUPTURE LENGTH
Ref:: Greensfelder, CDMG MS 23, 1974 (after Bonilla, 1970) PLATE 2.5
19

Guidance for our own selection of faults and fault character
istics significant to the project was from sources such as
Greensfelder (1974), the various County and City Seismic
Safety Elements, project reports, Federal and State Geological
Surveys, and university publications plus other published and
unpublished technical material. An effort was made to be
consistent, weighing the recency of the source and the degree
of penetration of each study, utilizing personal knowledge,
but avoiding personal bias. Where documentation was deemed
necessary, reference is made in the text.
There are approximately 75 known historically active, active
or potentially active faults within 100 miles of Edwards Air
Force Base. Most of these lose significance with regard to
the site by being overshadowed by closer, longer or more
active faults. The faults that aTe considered to pose the
greatest threat to the site have been grouped as follows:
distant faults capable of generating large earthquakes; and
nearby faults capable of generating moderate size earthquakes.
These faults are discussed in the following sections.
2.4.1 Distant Faults
The major faults in the region that are of significance with
regard to shaking at the site are: the San Andreas; the Garlock;
the Sierra Nevada; the San Jacinto; the White Wolf; and the
San Gabriel. These faults range from 21 to 48 miles in distance
from the site. Although there are other major faults in the
sauthern California area they are not considered here because
they are either at greater distances from the site or considered
to be capable of generating only smaller events than the above
listed faults.
20

As can be seen, the San Andreas fault poses the greatest hazard
to the site from the standpoint of accelerations or shaking
intensity. This is probably the most documented, instrumented,
and studied fault in the world (Allen and others, 1965;
Wallace, 1983; Sieh, 1978; Kerr, 1984; and Ross, 1969).
Detailed geologic studies of the fault along with historical
records of the 1857 earthquake indicate that this fault is
likely to generate the largest earthquake of any fault in
southern California and that such an event is imminent and will
very likely occur during the life of the va~ious structures
at the site.
The Ga~lock fault is somewhat closer to the site than the San
Andreas and is also considered to be a major fault. However,
it is considered to be less of a hazard owing to the presumption
that it will generate lower magnitude earthquakes (Greensfelder,
1974), and that its recurrence rate is less than that of the
San Andreas by approximately a magnitude (Burke, 1979). It
'has not be~n active historically but abundant geomorphic and
geologic evidence indicate that it is active.
The Sierra Nevada fault is a major fault system at the base of
the Sierra Nevada range in Owens Valley. One of the largest
historic earthquakes in California occurred on it in 1872.
This system has also been active in this century north of the
1872 break. The southern portion, nearest to the site, has
not been historically active. On the theory that the Whole
system is equally active and that the southern portion is
presently a seismic gap, the next earthquake on this system
may occur on this segment (Wallace, 1983).
21

The San Jacinto fault is presently the most active fault in
southern California. It is a major strike-slip fault sub-
parallel to the San Andreas system. It has experienced seven
or eight earthquakes since 1890, the last being in 1968.
None of these events were greater than M=7. This, along with
the fact that the San Jacinto is 45 miles from the site
relegates it to a much lower hazard classification than the
three faults discussed above.
The White Wolf fault is a major reverse type fault 45 miles west
of the site. This fault experienced an M=7.2 earthquake in
1952.resulting in Modified Mercalli intensities at the site
of at least VI. The epicenter for this event was over 50 miles
from the site. A repeat of this event with a closer epicenter
could result in intensities at the site of VII. Hence this
fault is considered to present nearly as great a hazard to the
site as the San Andreas.
The San Gabriel fault is a large strike-slip fault that diverges
from the San Andreas system. This fault is 48 miles from the
site. This along with the fact that the maximum probable earth
quake on this fault is M=5.5 relegate it to minor significance
with regard to the site.
2.4.2 Local Faults
As discussed previously, and shown on Figures 2.1 and 2,.3, the
Mojave block is cut by numerous northwest-trending faults.
Whereas these faults are considerably shorter than the previ
ously discussed group, and hence not capable of generating as
large earthquakes, they are much closer to the site (3 to 12
miles). There is a paucity of data on this group of faults
although most seem to have some evidence of late-Pleistocene
22

movement putting them into the potentially active to active
category. There have been three earthquakes on faults in
this system in the last 40 years that have caused surface
displacements (Richter, 1958; Keaton and Keaton, 1977; Fuis,
1976; and Hill and others, 1980). These three faults are
over 50 miles from the site, hence are not significant to it,
but the Willow Springs-Rosamond fault has yielded fault gouge
dated at no older than 5,000 years (D. J. Ponti, oral
communication, 1983). This data on a fault only 12 miles
from the site (Plate 2.1) suggests that all of these faults
should probably be considered to be active unless a detailed
examination proves otherwise.
The suite of" faults of this grouping that we consider signi
ficant to the site are: the Lockhart-Lenwood; the Mirage Valley;
the Blake Ranch; the Spring; the Willow Springs-Rosamond; and
the Muroc.
2.5 Fault Classification
No universally accepted system exists for the classification
of the activity of faults. The present report uses the follow
ing classification, which is consistent with others as noted:
23

HA Historically Active
A Active
PA Potentially Active
I Inactive
Reasonably located and known to have produced earthquakes, or known to be undergoing creep, within the past 200 years. Consistent with AEG*, CDMG, WES, LNG.
Evidence of displacement in the Holocene (13,000 years), earthquake epicenters in proximity, strong topographic expression. Consistent with CDMG, LNG.
Active in Quaternary (2,000,000 years), Quaternary materials offset, groundwater barriers, small earthquake epicenters in proximity, geomorphic expression. Consistent with CDMG, LNG. Equivalent to "Capable" classification of NRC and WES.
No evidence of movement in Quaternary, or no recognizable offset of Cenozoic materials. Consistent with AEG, CDMG, LNG. WES uses term "Dead" and further states "not seismically active."
*See References (Section 8)
TABLE 2.2
FAUL T ACTIVITY
24

2.6 fault Rupture
Fault rupture poses a threat to structures that cross active
faults. History of actual fault breaks at the ground surface
in southern California shows only eleven such breaks (Fig. 2.6).
In general, the locations of the surface breaks themselves
are largely unpredictable except for those along the largest
faults.
In summary, there are considerably more active and potentially
active faults than historic fault ruptures~ The latter occur
rence is rare but merits consideration, particularly if
there are possibly serious consequences of the· break.
The likelihood of surface fault ~upture at the Edwards Air
Force Base NASA Dryden site is considered to be very remote.
However, it cannot be dismissed completely because it is not
presently known if any buried faults underlie the site which
may belong to the group of Mojave block faults. Another,
albeit low, risk is the possibility of sympathetic movement,
including fault rupture extending to the ground surface, of
these possible underlying faults in response to large motions
from a great earthquake on the San Andreas fault.
2.7 Potential for Site Ground Rupture
Because of the minimal amount of alluvium (2 to 7 feet) over
lying the crystalline rock beneath the Computer Center site,
and the absence of groundwater, the likelihood of liquefaction
or lurching occurring in these materials is considered to be
remote.
Although no faults are known or shown on reviewed maps to cross
the site, the possibility exists, as suggested by seismic
activity, that certain of the small nearby faults may continue
subsurface toward the site.
25

19S0 Mammoth earthquake
Bokersfieldo County earthquake
121 0
r--"'-IS-5-7-F-or-t--1Teion earthquake ~~: ~~:""'d I '" _ _ _ Valley earthquake
,~O'bO'O ----= ' (~ / oLosAngeles
~~ ~ 11971 Son Fernando
N
r 119 0
0",="",,"-==--==_==--==100 Miles
0;.... __ -===~/O;.:;0;... __ ===~200 Kms
-- Fault break
HISTORIC
,
1956 San
FAULT BREAKS Allen et 01, 1955
Updated 1984
(SOUTHERN CALIFORNIA REGION)
PLATE 2.6
26

3. SEISMOLOGY
3.1 General
The seismicity of the southern California region is illustrated
in the tabulations and plots of several researchers, varying in
both time span and lower level of sensitivity. It is considered
necessary to examine the region through these different windows
to observe the sources of the larger events and local activity
of the smaller events.
Plate 2.3 shows the location of major faults and epicenters of
earthquakes of magnitude 6.0 or greater for the past two centur
ies. The locations of the larger events can be seen to be
associated with the major faults of the region.
Bedrock acceleration associated with major faults is indicated
in Plate 2.4. A listing of these selected active and poten
tially active faults is shown in Table 2.1.
Earthquake magnitude versus fault rupture length is depicted in
Plate 2.5.
The potential for ground motion at the site from earthquakes
generated on the various faults is given in Table 3.1.
The seismic parameters of magnitude and intensity (MM 31) are
defined in Appendix B.
27

POTENTIAL GROUND MOTION FROM SIGNIFICANT FAULTS
Dist. Activ Max.Credible Earthquake Max.Probable Earthquake
Fault to ity At EpieenteI At Site At Epieent e'" At Site Site Rate (mi) Mag- Int Int Aeeel Mag- Int Int Aceel
tni tude MMJl MMJl g * ri tudE MMJl MMJl g*
~·1AJOR REGIONA FAUI TS San Andreas 29 HA 8.5 XII XI 0.40 8.25 XII IX 0040
Garlock 21 A 7.75 X IX 0.40 7.0 VIII VI. 0.25
Sierra N eVrl.da 25 A 8.5 XII IX 0.40 7.5 IX VII 0,25 (south end)
San Jacinto 45 HA 7.75 X VII O.JO 6.5 IX IV 0015'
White Wolf 45 HA 7.75 X VII o.JO 7.25 IX VII OoJO
San Gabriel 48 PA 6.5 IX IV 0.15 5.5 VI III 0.10
MOJAVE BLOCK -FAUL S
Lockhart-Lenwood 20 A 7.5 X VII] 0.40 6.5 IX V 0.20
Mirage valley 9 A 6.5 IX VII O.JO 5.5 VI V 0.20
Blake Ranch 12 A 6.75 IX VI 0.25 5.5 VI V 0.20
Spring 12 A 6.75 IX VI 0.25 5.5 VI V 0.20
Willow Spring- VI 0.25 V 0.20 Rosamond 12 A 6.5 IX 5·5 VI
Muroe J.5 A 6.5 IX IX 0.40 5.5 VI VI 0.25
Note: Maximum Credible Earthquake (MCE) and Maximum Probable Earthquake (MPE) parameters are selected on the basis of pertinent published and unpublished literature, thoroughness of study of the source area, historical activity, fault length/magnitude relationships, fault mechanics, site geometry, and bias of our staff seismologists/ geologists. In simple terms, the MPE event is postulated to occur durin.g the project lifetime and should be considered an "operational" event. The MCE is potentially possible but unlikely during the project lifetime.
HA = Historically active fault; A = Active fault; PA = Potentially active fault.
*Acceleration at base rock. Values are average of J largest peaks.
TABLE 3.1
28

3.2 Historical Seismicitl
Earthquakes have been chronicled in California since the arrival
of the first Spaniards. Mission records have been used for the
early period; and systematic instrumental recorded dates from the
early days of the University of California in Berkeley (1888).
A continuous instrumental California record has been maintained
since that time. Southern California was a bit slower--begin-
ning its instrumental record in 1932 with Carnegie funding and,
more recently, with support of the U. S. Geological Survey.
This activity is centered at the California. Institute of Tech
nology in Pasadena. Summary publication of coherent data has
been the contribution of the State (California Division of Mines
and Geology) and the Federal government (currently the U. S.
Geological Survey). Tables 3.2 and 3.3 summarize the larger
seismic events of interest, both historical and instrumental.
A piot of earthquake epicenters near the NASA Dryden facility
(Plate 3.1) shows all events of magnitude 4.0 and greater for
the period 1900 through 1983. Although published with data
through 1974, it has been updated through July 1983 with USGS
da ta.
Another pair of plots, Plate 3.2, shows this area with events
of magnitude 3.0 and above (1932 through 1983), and a plot of
the smaller western Mojave block area with all events for the
same time span regardless of magnitude. Note that Plate 3.1
(magnitude 4.0 and above) shows a blank for the area; Plate 3.2
shows some events with magnitudes of 3.0 or greater and ~~
events when the smallest instrumentally recorded activity is
plotted.
A plot of all events is also shown, Plate 3.3, enlarged to match
the scale of Plate 2.3. Thus, an overlay of Plate 3.3 on
Plate 2.3 indicates a low level of seismicity at the site,
associated with the named and unnamed faults.
29

EARTHQUAKES OF SOUTHERN CALIFORNIA - HISTORIC
DATE "INTENSITY MAGNITUDE LOCATION
1769 Jul 28 VIII-X 7.5 Olive
1852 Oct 26 8.0 North Los Angeles County
1852 Nov 9 IX Imperial Valley
1852 Nov 27-30 8.0 North Los Angeles County
1857 Jan 9 XI 7.7 Fort Tejon
1872 Mar 26 7.7 Owens Valley
1906 Apr 18 IX Imperial Valley'
EARTHQUAKES OF SOUTHERN CALIFORNIA - HISTORIC
TABLE 3.2
30

EARTHQUAKES OF SOUTHERN CALIFORNIA - lm--l~
MAGNITUDES 6.0 AND GREATER
TIME FELT DATE (PST) LAT. LONG. MAG. INT. AREA LOCATION
1915 ~run 22 19:59 32.8 J.1:;.5 6.25 VIII 50,000- Imperial Valley 100,000
1915 Sun 22 20:56 32.8 llS.5 6.25 VIII 50,000- Imperial Valley 100,000
1915 Nov 20 16:14 32 US 7.1 VII 120,000 Colorado Delta 1916 Oct 22' 18:44 34.9 UEI.9 6 VII 25,000- Tejon Pass
50,000 1918 Apr 21 14: 32 33.7 117 6.8 IX 130,000 San Jacinto 1923 Jul 22 23:30 34 117.2 6.25 VII 70,000 San Bernardino 1925 Jun 29 06:42 34.3 119.8 6.3 VIII-· Santa Barbara
IX 1927 Sep 17 18: 07 37.5 1.18.7 6 VII 75,000 Bishop 1933 Mar 10 17:54 33.6 118.0 6.3 IX 100,000 Long Beach 1934 Clec 30 05:52 32.2 115.5 6.5 IX 60,000 Colorado Delta 1934 Clec 31 10: 45 32 114.7 7.1* X 80,000 Colorado Delta 1935 reb 24 32.0 115.2 6.0 Colorado Delta 1937 Har 25 08:49 33.5 116.6 6.0 VII 30,000 Terwilliger Valley 1940 ~jay 18 20: 36 32.7 115.5 7.1" X 60,000+ Imperial Valley 1940 Dec 8 31. 7 115.1 6.0 Colorado Delta 1941 J'un 30 23:51 34.4 119.6 6.0 VIII 20,000 Santa Barbara 1942 Oct 21 08:22 33.0 116. a 6.5 VII. 35,000 Borrego Valley 1946 Mar 15 05:49 35.7 118.1 6.3 VIII 65,000 Walker Pass 1947 A.pr 10 07:58 35.0 116.6 6.2" VII 75,000 Manix 1943 Dec 4 15: 4 3 39.9 116.4 6.5 VII 65,000 Desert Hot Springs 1952 Jul 21 03:52 35.0 119.0 7.7* XI 160,000 Kern County 1952 Jul 22 23:53 35.0 118.8 6.4 VII Kern County 1952 Jul 23 05:17 35.2 118_ 8 6.1 VII Kern County 1952 Jul 28 23:03 35.4 118.9 6.1 VII Kern County 1954 Mar 19 01:54 33.3 116.2 6.2 VI 40,000 Santa Rosa Mountains 1954 Oct 24 31. 5 116.0 6.0 Agua Blanca 1954 Nov 12 04:26 31. 5 116 6.3 v+ Agua Blanca 1956 Feb 9 06:32 31. 8 115.9 6.8 VI+ 30,000+ San Miguel 1956 Feb 9 31. 7 115.9 6.1 San Miguel 1956 Feb 14 10:33 31. 5 115.9 6.3 V+ San Miguel 1956 Feb 14 17:20 31.5 115.9 6.4 V+ San Miguel 1966 Aug 7 09:36 31. 8 114.5 6.3 VI Gulf, California 1968 Apr 8 18:29 33.1 116.1 6.5* Borrego Mountains 1971 Feb 9 06:01 34.4 118.4 6.6* XI 80,000 San Fernando 1979 Oct 15 16: 27 32.6 115.3 6.6* X 60,000+ Imperial County 1980 Ma.y 25-27 37.6 118.8 6. J* VIII 100,000 Mammoth Lakes 1980 Jun 8 20:28 32.27 114.95 ~3 Weste= Arizona 198) lo'..<LY 2 16:42 36.22 120,,32 ~3* VIII Coa.1..1.nga
* Surfac:e faulting.
EARTHQUAKES OF SOUTHERN CALIFORNIA - 1912-1984
'fABLE 3.3
31

EARTHQUAKES EPICENTERS-NEAR EDWARDS AFB Magnitude 4.0 and Greater. 1900 through July 1983
Ref: CDMG. MS39, Updated. PLATE 3.1
32

() <:) . (~ ,-I ,-I
119
x
x
lIE
-A'
1<r
~~
\", '"
l 11B 117
ML < 3. 0 3. 0 < ML < 4. 0 4.0 < ML < 5. 0 S. 0 < ML < 6. 0 -ML > 6. 0 -
34
33
_ ... -- ... ----
-~ "'-.,
~~ 32
"
116 119 --
0 -, 0 -
~ , '"
liB
- -100
, , ,
~ ( I"~"~"~"~"~"~ '" o '\ '
c; _~
---
-.~
~.,
117 116
100 Miles
200 Kms
EARTHQUAKE EPICENTERS NEAR EDWARDS AFB Magnitude 3.0 & Greater, and All Events. 1932 through 1983
Ref: CIT 1984 PLATE 3.2
33

10 0 epMWS
SCALE IN MILES 10 20
~ I
50
EARTHQUAKE EPICENTERS NEAR EDWARDS AFB All Events, 1932 through 1983
Ref: CIT 1984
34
PLATE 3.3

3.3 Significant Earthquakes
An epicenter count of earthquakes within a 25 mile, 50 mile, and
100 mile radius of the NASA Dryden facility for the periods
indicated yields the following results:
Radius - miles Period of Magnitude 25 50 100 Observation
Less than 3.0 -l(- 1974-1983
3.0 to 3.9 0 1932-1983
4.0 to 4.9 a 120 510 1900-1983
5.0 to 5.9 0 12 80 1900-1983
6.0 to 6.9 0 2 15 1900-1983
7.0 or greater 0 0 1 1769-1983
The wider, 100 mile sweep includes the epicenter of the 1952
magnitude 7.2 Kern County earthquake. The two 6+ magnitude
events, each about 45 miles from the site, are the 1971 San
Fernando earthquake and an aftershock of the Kern County
1952 sequence.
Note that the 50 and 100 mile totals include events within the
smaller circles and the areas are each four times the size of
the next smaller circle. Thus, if seismicity were uniform,
the 50 miles radius column should list four times as many
events ~s the 25 miles column, and the 100 mile column 16 times
as many.
The lack of reported macroseismic activity near the site is
apparent from these numbers. It is even further highlighted
by examinati6n of activity within the entire western Mojave
block (Plate 3.1). For this purpose, the block is defined as
the region between the San Andreas and the Garlock faults west
*Slightly less than one shock per year with magnitude less than 3.0.
However, some of these may be quarry or mining blasts.
35

of about 50 miles east of the NASA Dryden facility. There are
limitations on the data. It is believed to be complete for
magnitude 4 events since the turn of the century, magnitude 3
since 1932, and magnitude 2.4 since 1974. Many smaller magni
tude events are contained in the data and are included in our
examination. Some may be spurious, and some are quarry or
mining blasts that have not been edited out of the data.
The single magnitude 4.4 shock within the block was recorded
October 11, 1966 at 35.106 o N, 117.346 oW, 37 miles east-northeast
of the site. This is the only magnitude 4.0 or larger event
within the block for the period 1900-1983. It is the only event
within the range 3.0 or larger recorded for the period 1932-1983.
However, small events with magnitudes less than 3.0 have been
recorded,at a rate of approximately four per year in this same
period (1932-1983). As indicated, some of these may be spurious
or quarry blasts. This phase of the investigation bears further
study. One of these small events occurred practically on site
October 14, 1942 with a magnitude of 2.5 at 35.0 o N, 118.0o W.
The quality of the determination was not good, fixed at ±15 km
of the location noted.
The larger events are distant from the site and along koown faults,
such as the 1952 Kern County earthquake to the northwest 2nd 1971
San Fernando earthquake to the southwest, and their associated
aftershocks. These are the largest events within the past
century to affect the site; statistically, their many after
shocks account for a large portion of the seismic activity.
The 1852 and 1857 earthquakes, although outside the time span
considered, were undoubtedly more significant to the site.
36

It should be borne in mind that epicentral determinations are
imprecism, particularly on the smaller and older events. The
circle of error probability is seldom noted but can vary from
a few kilometers for the well located events to as much as
0.5 0 for the older, noninstrumentally recorded events. The
quality of epicentral determination has increased dramatically
over the past years, especially in this area, with the support
of the U. S. Geological Survey. The definition of epicenter
should also be remembered, i.e., that point on the surface
of the earth that lies above the hypocenter (first starting
break along the fault plane surface, at depth). The epicenter
is not the center of energy release; the hypocenter is merely
the starting point of the fault rupture on its plane.
3.5 Recurrence
Recurrence of seismic activity along the several capable nearby
faults has been studied, and a range of recurrence rates pub
lished. There is an overwhelming opinion among seismologists
and geologists that have studied the area that a very large
magnitude earthquake on the San Andreas fault is imminent.
That could mean one week, one month, or 10 years, but certainly
in the foreseeable future. Specific return periods along ~he
San Andreas vary from 80 to 160 years. Since there has not
been a major San Andreas event in Southern California in over
a century, the consensus is that the fault is ready to "let go."
The "favored" section for a San Andreas break is the reach between
San Bernardino to the west of Taft. Since the break will probably
be at least 250 miles long, this places the nearest San Andreas
energy source 29 miles southwest of the site, with a recurrence
period that is moot. The event is so long overdue, and indi
cations so ominous, that consideration of a recurrence period
37

is an unnecessary exercise. The event must be considered short
term. The only question at the moment is when. The magnitude
should be the same as other great San Andreas events, 8+.
A 50 percent probability within 5 years has been stated.
Recurrence of the 1952 Kern County event is difficult to assess.
That event was large, magnitude 7.2, and the location unexpected.
There is some indication that its recurrence rate is 150 years
or more. An epicenter on the White Wolf fault at about 45 miles
lessens the impact upon the site.
The unusual lack of events that might have an effect on the site
makes any averaging of activity meaningless. The nearby segment
of the San Andreas has been inactive for more than a century;
the nearby segment of the Garlock has had no events as large as
magnitude 4.0; events within the Mojave block are alISO miles
or more east of the site; the western Mojave block is almost
aseismic. These factors control the selection of design events
but preclude meaningful statistical seismicity.
In summary, a great San Andreas magnitude 8+ event is imminent;
local nearby events would be unexpected but could be magni
tude 4.5 to 5.5.
38

4. SEISMIC CRITERIA
4.1 Methodology
Seismic criteria for the NASA Dryden facility site at Edwards
Air Force Base have been developed by using a multistep method,
as follows:
1. Definition of seismic zones, faults, or source areas
2. Development or selection of site or region specific
attenuation characteristics.
3. Calculation of site ground motions (acceleration,
velocity, displacement, and duration)
4. Selection of analogous time-histories and response
spectra, along with their scale factors.
4.2 Seismic Source Areas
The site is exposed to seismic ground motion from earthquakes
originating in three principal source areas:
Source I
Source II
Source III
San Andreas Fault Zone - A source of great
historical seismic activity. The recurrence
of magnitude 8+ event along this fault at its
nearest approach to the site (29 miles) is
postulated as a design event.
Mojave Block Fault Group - The occurrence of
a moderate magnitude event nearby is a remote
possibility despite the historic absence of
events larger than magnitude 4.4.
The effect of the more distant or less active
faults is enveloped in the two above design
events, or source areas.
39

4.3 Attenuation
Site ground motion can be determined by attenuating maximum
epicentral source region ground motion to the appropriate
distance. A number of attenuation curves have been developed
from worldwide and regional studies of isoseismal maps. Data
from western United States earthquakes have been plotted by
Krinitzsky and Chang, 1975 (Plate 4.1) relating intensity to
distance for a range of earthquake magnitudes. Note the very
wide scatter of the data. Acceleration is related to distance
in an unpublished study by Krinitzsky and Marcuson, 1982 (Plates
4.2 and 4.3). Note that the data for these studies are for hard
sites only, with ground conditions similar to those found at the
NASA Dryden site. These studies and isoseismal maps for the larger
regional earthquakes of southern and central California
provide an excellent data set for determining attenuation
characteristics in the Mojave area.
4.4 Ground Motion
Site ground motion is calculated from the attenuation charac
teristics given above. Extrapolation to the larger San Andreas
event has been calculated. Representative ground motions that
may be experienced at the NASA Dryden site are indicated in
Table 4.1.
40

500
400
100
w~ <.9
"" <{ ::; <{
~~ 0
~ ~ z
:~ ~ ~I
-II.. ....... IfI:l ....... .........
300
200
::t 80 ~ " '"
¥u ~ .........
'" , ........... .. w U 60 ~
50 t-(J)
0 ..J 40 « f!: z 30 w U 0.. W
20
.... " In "- ""- ~
" "-.n; ;D ~ "" "-:" 'J ~ ~ ~
.........
" ~"/ \ ~ ~a. ~~ c
0"", '" '<, r-...
~' ~'\ r'"
" ~~ ~ ~ ~ ".> '0
1\ 1\" "" ~: "", . "-~
LEGEND
~~ GENERAL .?YMBOL MAGNITUDE ~~ 0 7.5
II 7.0 ~ ~, ,,,
~ "-0 6.5 -\:v <0 -...;fJ' " i".. V 6.0 '0'
-~ "- ~ ,
• 5.5 '\
10
8
... 5.0 \ ~ " -- • 4.5
I\" "- " I I ~ ~\ '\. ,
4 II: m :llll IX
MM INTENSITY
INTENSITY VERSUS f'.'IAGNITUDE AND EPICENTRAL DISTANCE
Ref: Krinitzsky and Chang, 1975 PLATE 4.1
41

C1
Z
1.3
1.2
1.1
1.0
0.9
0.8
o 0.7 t:: ct a: w. irl 0.6 o o ct
0.5
0.4
0.3
0.2.
0.1
o
NUMBER OF HOR. I (2) (n) DATA UNITS PACOIMA .~
••••••• LIMIT OF DATA -- MEAN + a -0 MEAN
I-- NEAR FIELD HARD SITE . .
I
! . . (4) i
.. I . . .. . • . .
(23) ... . I • I • . • I . . . / . ' . . 4r' (24) .... .
." MELENDY t I-" RANCH I
I , J .,' / / ~, ()
I I ,~ " 1-- I
-:/ ( V<> ,
MM INTENSITY
ACCELERATION VERSUS MM INTENSITY NEAR FIELO--HARD BITE
{ (2) ,
~. PACOIMA
l i I
I ! i
, / J
7 1
V·
x
Ref: Krinitzsky & Marcuson, Nov. 1982 PLATE 4.2
42

0.6 ,...-------------,-----y----,----r---. (n) NUMBER OF HOR.
DATA UNITS _ ... LIMIT OF DATA
0.5 -- MEAN +a -0 MEAN
CT _ 0.4- - FAR FIELD ~ HARD SITE (38)
~
W~ 0.3' ~-+---r_I-----l--.-.:'·· +----f------lr----+---l
-- (42! •••• •• /~ ~ O~2 ~_+__-(:......,3~6)---.a:-)+'-·-..lfI4.'zA~~-·/-_+_--+_-__+____i ...... ~/~
(6) 10·· ~'-... , ....... _,,.."..J. 0.1
o ~~----~---~---~---~--~--~~
MM INTENSITY
ACCELERATION VERSUS MM INTENSITY FAR FIELD .. -HARD SITE
Ref: Krinitzsky & Marcuson. Nov. 1982
43
x
PLATE 4.3

TABLE 4.1
REPRESENTATIVE GROUND MOTIONS AT NASA EDWARDS FACILITY
Bracketed Predomi-Distance Duration nant
Int to Site I Accel, Veloc, Disp, at 0.05g Period, Source Mag 10 (mi.) site g cm/sec cm sec.
I: San Andreas 8+ XII 29 IX 0.40 50 25 40
II: Mojave Block 4.5 VI 3.5 VI 0.20 20 10 6
The basis for selection of the representative ground motion at
the site is as much intuitive, or art, as science. The Maximum
Probable Earthquake is one that has a high likelihood of taking
sec.
0.5
0.20
place during the lifetime of the project. It is usually at least
a repeat of the largest historical event and is tempered by the
evaluation of the Maximum Credible Earthquake the system will
support. In nuclear facility terms, it is the Operating Basis
Event--and is designed to provide design level adequate to
ensure life safety. In very seismically active areas of Cali
fornia, the MPE may approach the MCE. That is, an event larger
than 8+ on the San Andreas is remote, the effects of which would
only lengthen the disturbed area but not increase radiation
normal to the fault. Certain of the faults appear more active
along midsections than at their terminals. Other faults appear
to have all the potential for movement but do not have a demon
strated historic activity. Consideration is principally given
to historic activity and fault length. The work of other re
searchers and design values for similar projects are also
factors, as is the magnitude-intensity-acceleration relationship.
44

Thus, the selection process takes these and many other factors
into consideration. The figures given in Table 4.1 are meant
to be reasonable, biased toward the MCE, but with an admitted
moderate degree of the expectation of exceedance. Also, they
are meant to represent several repeated excursions at periods
of interest and not a single high frequency spike.
The data summaries of Krinitzsky, Chang, and Marcuson have
provided much guidance for the ground motions selected. The
values are for firm soil or southern California rock, such as
exists at the site.
5. DESIGN ACCELEROGRAMS
Selection of analogous accelerograms for the design earthquake
is usually an unsatisfying process. Accelerograms selected
should be analogous for the design earthquake with respect to
magnitude, depth of focus, earthquake mechanism, intervening
structural geology, lithology of path, and site characteristics.
In addition, there should be several records. Most of the
models fail to meet these criteria in most categories.
No good time-history accelerogram exists for a great earthquake
at moderate distance. The best available is the N21E component
of the Taft record of the 1952 Kern County earthquake. Its
7.2 magnitude is the largest event in the 51 year old inventory.
Unfortunately, it fails because of its location on a deep
alluvial column. (See Appendix C for site data, accelerogram,
and response spectra). However, it does offer guidance with
respect to spectral shape and duration. The Taft site is
27 miles from the epicenter of the 1952 earthquake and slightly
closer to the trace of the White Wolf Fault. Consideration must
be given in its use to the slightly longer periods present.
45

A scale factor of 2.62 would be required to bring the N21E trace
up to the recommended design acceleration; therefore, there is
a deficiency in amplitude as well as spectral content. Spectral
content should also be modified by tightening the time base by
about 20%, thus raising the spectral response at shorter periods.
The select~on of analogous accelerograms for this design earth
quake has been simplified for the nearby event because of the
simplicity of the site itself. There is but a very thin (7 to
10 feet) cover of soil or disintegrated granite. It is known
that the foundations of the structure penetrate the surficial
material and that the structure is founded on crystalline rock.
Hence, it is a true "hard" site, a situation not usual for
southern California.
"Hard" site accelerograms have traditionally been limited to
records written at Helena, Montana and at Golden Gate Park,
San Francisco. Moreover, there are but two useful accelerograms
from those stations, written in 1935 and 1957, respectively.
In addition, several of the sites to the north of the 1971 San
Fernando epicenter are considered to be on rock. Also, the
recent expansion of the network of instruments developed in the
northern Sierra by the California Division of Mines and Geology
has produced a number or records of ground motion on rock.
The magnitude 6.0 Helena, Montana 1935 accelerogram was recorded
on an instrument founded on Precambrian limestone located at
Carroll College, an epicentral distance of 4 miles. The station
has since been moved to another location. The peak acceleration
was measured as 0.146g on the N-S component and 0.145 on the E-W
component. Peak vertical acceleration was 0.089 g. Appendix C
shows station location, geology, acceleration, and response
spectra.
46

The magnitude 5.3 San Francisco 1957 earthquake developed only
0.102 g at the Golden Gate Park site, located on weathered
Franciscan radiolarian chert and interbedded shale. The station
is about 5 miles from the San Andreas, along which the earth-
quake was located. The record was examined but not used in
this investigation because of its small amplitude.
The inventory of accelerograms written near NASA Dryden site
was also considered. There are 32 accelerograph stations in o 0 0 the region bounded by 34.5 Nand 117.0 to 118.5 W. However,
many of these stations have been recently.installed, so only
five of the stations have produced usable records with acceler
rations of O.lOg or greater. All five of these records, with
maximum accelerations from 0.13 to 0.19g, were of the 1971
San Fernando earthquake:
Station No. Name Peak g Si te Conditions
121 Fairmont Reservoir 0.17 17'± sand & gravel, over granite
125 Lake Hughes No. 1 0.17 80-+-' alluvial over granite
126 Lake Hughes No. 4 0.19 15' decomposed gr2-'1i te, over bedrock
262 Palmdale Fire Station 0.13
585 Pearblossom Pumping Plant 0.15
Station location, geology, accelerograms, and spectra are shown
in Appendix C for the Fairmont Reservoir, Lake Hughes No.1,
and Lake Hughes No.4 sites.
Recent "rock" records are available from the Mammoth Lakes earth
quakes of May 1980 written on a central recording system at a
tunnel location in Long Valley Dam. The geology is described
as layered blocky rhyolite with flows 2 to 15 feet thick. The
47

tunnel is within the flows. The surface has 3 feet of soil and
10 feet of weathered rhyolite. The records fail as analogies.
Three sets of data yield as many different responses. In
addition, site geometry and earthquake mechanism do not corre
spond to the Edwards site.
A summary of aceelerograph data is given in Table 5.1.
TABLE .5.1
ACCELEROGRAM DATA
Dist to Peak Shown
Fault, Accel, Site in Location Date mi Mag g Conditions Appendix
Taft 19.52 27 7.7 0.18 Deep alluvium Yes
Helena 193.5 4 6.0 0.146 Pre-C limestone Yes
Golden Gate Park 19.57 .5 .5.3 0.102 Franciscan No
Fairmont Reservoir 1971 21.6 6.4 0.17 1.5 ' to granite Yes
Lake Hughes No.1 1971 19 • .5 6.4 0,17 80' to granite Yes
Lake Hughes No.4 1971 18 6.4 0.19 1.5' to granite Yes
Long Valley .5-27 Dam Tunnel 1980 14.1 6.3 0.24 Rhyoli te flows No
48

6. RECOMMENDATIONS FOR SEISMIC DESIGN CRITERIA
On the basis of the study, it is recommended that the NASA Edwards
Air Force Base Facility be evaluated for its resistance to
the two earthquakes postulated in this report:
1. A magnitude 8.5 event on the nearest approach
of the San Andreas Fault, 29.miles, would
impose an acceleration of 0.40g on the .site
with a bracketed duration of 40 seconds. It
is suggested that a scaled trace of the N21E
component of the Taft accelerogram of the
1952 Kern County earthquake is an adequate
model.
2. A near-field magnitude 4.5 event from a Mojave
block fault would impose an acceleration of
0.20g at the site with a short bracketed duration
of 6 seconds. It is suggested that the unscaled
trace of the Lake Hughes No.4 S69E component
from the San Fernando Valley earthquake of
1971 be used as an appropriate model.
49

7. RECOMMENDATIONS FOR FUTURE STUDIES
A comparison of the micro seismic activity of the western portion
of the Mojave block with the known faults in this area suggests
a casual relationship between some of the faul,ts and some of the
seismicity. However, seismicity near the project site suggests
the possibility that additional faults, not presently known,
exist beneath or near the NASA Dryden Facility. The existence
of such a fault wduld not be expected to significantly alter the
seismic characteristics recommended in this repdrt for nearby
earthquakes. What would be affected is the possibility of sur
fac8 rupture occurring somewhere on the site other than at the
Data Center site.
Therefore, it is recommended that to determine the safety of
other sites on the facility from such an occurrence, the follow
ing work be carried out:
1. Review and interpretation of aerial photographs of the
area in possession of the Air Force and other govern
mental agencies.
2. Obtaining, review and interpretation of EROS remote
sensing data and aerial photographs of the area.
3. Review in detail all seismic records of the area and
plot at sufficient scale to compare with fault maps.
4. Surface mapping to determine details of local geology
and faults found on above imagery and fault maps.
5. Possible trenching of nearby faults determined to be
significant in the preceding steps.
6. Possible installation of seismometer and recording of
local microseismicity to better define location of
local seismic events and source areas.
50

8.0 REFERENCES
8.1 General Geology
Algermissen, S.T., and Perkins, D. M., 1976, A probabilistic estimate of maximum acceleration in rock in the contiguous United States: U. S. Geological Survey Open-File Report 76-416, 45 p.
Allen, C.R., St. Amand, Pierre, Richter, D.F., and Nordquist, J.M., 1965, Relationship between seismicity and geologic structure in the southern California region: Ssismological Society of America Bulletin, v. 55, No.4, p. 753-798.
Association of Engineering Geologists, 1973, Planners guide to the seismic safety element: University Publishers, Los Angeles, California, 446 p.
Bull, W.B., and McFadden, L.D., 1977, Tectonic'geomorphology north and south of the Garlock fault, California in Geomorphology in Arid Regions, D. O. Doehring ed., Eight Annual Geomorphology Symposium Proceedings, Binghampton, Np.w York, p. 115-138.
Burke, D.B., 1978, Active faults and regional deformation in the western Mohave Desert, California: in Summaries of Technical Reports, June, Volume VI; U.S. Geological Survey, Menlo Park, California, p.9.
~~ _______ ~ __ ~, 1979, Quaternary deposits and tectonics of the Antelope Valley-western Mohave Desert region, California: in Summaries of Technical Reports, Volume IX, December: U.S. Geological Survey Open-File Report 80-6, Menlo Park, California, p.3.
~~ ____________ , 1979a, Quaternary deposits and tectonics of the Antelope Valley-western Mojave region, California: in Summaries of Technical Reports, Volumn VIII, June: U.S. Geological Survey, Menlo Park, California, p. 12-13.
California Division of Mines and Geology, 1963, Trona Sheet: Geologic map of California, Scale 1:250,000.
, 1965, Bakersfield Sheet: ~~---~------~~77~--~--~-~--~~= Geologic map of California, Scale 1:250,000.
~~ ___ ~ ______ ~~~ ____ ~ ____ ~ __ ~~ __ , 1969, Los Angeles Sheet: Geologic map of California, Scale 1:250,000.
, 1969a, San Bernardino Sheet: ~~---~------~~~~--~--=-~--~~=-Geologic map of California, Scale 1:250,000.
51

Carter, B.A., 1981, Quaternary displacement on the Garlock fault, California - in Geology and Mineral Wealth of the Mojave Desert Area, California: South Coast Geological Society Special Publication, p. 457-466.
Church, J.P., Castle, R. 0., Clark, M. M., and Morton, D. M., 1974, Continuing crustal deformation in the western Mohave Desert, California: Geological Society of America Abstracts with Programs v.6, No.7, p. 687.
Clark, M.M., 1973, Map showing recently active breaks along the Garlock and associated faults, California: U.S. Geological Survey Misc. Geological Investigations, Map 1-74, 3 sheets, 1:24,000 scale.
Crandall, LeRoy, and Associates, 1962, Report of foundation investigation, Proposed Building Addition, Flight Research Center, Edwards Air Force Base, Edwards, California: LeRoy Crandall and Associates, Los Angeles, California, 13 p.
, 1981, Report of Foundation Investi---~----~----~~~--~~-----; gation, Proposed Data Analyses Facility Building 4838, Hugh L. Dryden Flight Research Center, Edwards, California: LeRoy Crandall and Associates, Los Angeles, California, 24 p.
Cummings, David, 1981, Mechanics of fault deformation and seismotectonic zoning, Mojave Desert, California - in Geology and Mineral Wealth of the Mojave Desert Area, California: South Coast Geological Society Special Publication, p. 101-120.
~ ____ ~ __ ~ __ ~,. and Leeds, D. J., 1977, Seismotectonic zoning using theoretical mechanics: VI World Conference Earthquake Engineering, New Delhi, India.
Dibblee, T.W., Jr., 1961, Evidence of strike-slip movement on northwesttrending faults in Mojave Desert, California: U.S. Geological Survey Professional Paper 424-B, p. B197-B199.
, 1967, Areal geology of the western Mojave Desert, ~~~--~--~~~ California: U.S. Geological Survey Professional Paper 522, 152p.
Dutcher, L.C., Bader, J.S., and Hiltgen, W.J., 1962, Data on wells in the Edwards Air Force Base area, California: California Department of Water Resources Bulletin, No. 91-6, 209 p., plus maps.
Evernden, J.F., Kohler, W.M., and Clow, G.D., 1981, Seismic intensities of earthquakes of conterminous United States - their prediction and interpretation: U.S. Geological Survey Professional Paper 1223, 56 p., 5 plates.
52

Fuis, G.S., 1976, Ground breakage and aftershocks of M=5.2 Galway Lake earthquake, June 1975, Mojave Desert, California: Journal of Geophysical Research, v. 57, No. 12, p. 954.
Guptil, P., Collins, D., Sugiura, R., and Birkhahn, P., 1979, Quaternary deformation along the Llano Fault, southern Antelope Valley, California: Geological Society of America Abstracts with Programs, Cordilleran Section.
Hays,W.W., 1980, Procedures for estimating earthquake ground motions: U.S. Geologi6al Survey Professional Paper 1114, 77 p.
Hewett, D.F., 1954, General geology of the Mojave Desert region, California: California Division of Mines and Geology Bulletin 170, ChptlI, p.5-20.
Hileman, J.A., Allen, C.R. and Nordquist, J.M., 1973, Seismicity of the southern California region, 1 January 1932 to 31 December 1972: California Institute of Technology Seismological Laboratory, Pasadena, Californiz, 404 p.
Hill, R.L., and Beeby, D.J., 1977, Surface faulting associated with the 5.2 magnitude Galway Lake earthquake of May 31, 1975, Mojave Desert, San Bernardino County, California: Geological Society of America Bulletin, v. 88, p. 1378-1384.
, Treiman, J.A., Given, J.W., Pechmann, J.C., McMillan, J.R., and Ebel, J.E., 1980, Geologic study of the Homestead Valley earthquake swarm of March 15, 1979: California Geology, v. 33, No.3, p. 60-67.
Jennings, C.W., 1975, Fault map of California: California Division of Mines and Geology, Geologic Data Map No.1, Scale 1:750,000.
Keaton, J.R., and Keaton~ R.T., 1977, Manix fault zone San Bernardino County, California: California Geology, v. 30, No.8, p. 177-186.
Kerr, R.A. 1984, Stalking the next Parkfield earthquake: Science, v. 223, No. 4631, p. 36-38.
LaViolette, J.W., Christenson, G.E., and Stepp, J.C., 1981, Quaternary displacement on the western Garlock fault, southern California - in Geology and Mineral Wealth of the Mojave Desert Area, California; South Coast Geological Society Special Publication, p. 449-456.
O'Brien, Ken, and Associates, 1973, Foundation investigation and engineering report, Aircraft Servicing Dock Building No. 4823 NASA Flight Research Center Edwards, California: Ken O'Brien and Associates Consulting Engineers, 31 p.
53

Ponti, D.J., and Burke, D.B., 1980, Quaternary geology of the eastern portion of Antelope Valley, California: U.S. Geological Survey OpenFile Map 80-1064.
, and Hedel, C.W., 1981, Quaternary geology ~~~----~~----~----~~: of the central portion of Antelope Valley, California: U.S. Geological Survey Open-File Map 81-737.
Richter, C.F., 1958, Elementary Seismology: New York, Freeman, 768 p.
Ross, D.C., 1969, Map showing recently active breaks along the San Andreas fault between Tejon Pass and Cajon Pass, southern California: U.S. Geological Survey Misc., Geol. Invest. Map 1-553, 1:24,000 scale.
Sieh, K.E., 1978, Prehistoric large earthquakes produced by slip on the San Andreas fault at Pallett Creek, California: Journal of Geophysical Research, v. 83, p. 3907-3939.
Stein, R.S., and Lisowski, Michael, 1983, The 1979 Homestead Valley earthquake sequence, California: control of aftershocks and postseismic deformation: Journal of Geophysical Research, v. 88, p. 6477-6490.
Wallace, R.E., 1983 Tectonic analysis of active faults: in Summaries of Technical Reports, Volume 15: U.S. Geological Survey Open-File Report 83-90, p. 170-172.
Wiese, J.H., and Fine, S.F., 1950, Structural features of western Antelope Valley, California: American Association of Petroleum Geolgists Bulletin v. 34, No.8, p. 1647-1658.
Wood, H.O., Heck, N.H., and Eppley, R.A., 1966, Earthquake history of the United States, Part II - Stronger earthquakes of California and western Nevada: U.S. Department of Commerce, Coast and Geodetic Survey publication No. 41-1, U.S. Govt. Printing Office.
54

8.2 General Seismic
Astiz, Luciana and Allen, Clarence R., 1983, Seismicity of the Garlock Fault, California: Bulletin of the Seismological Society of America, v. 73, No.6, Part A, p. 1721-1734.
Algermissen, 1973, The problem of seismic zoning - in Building Practice for Disaster Mitigation: National Bureau ofStandards, Building Science Series 46.
California Institute of Technology, 1971-1974, Strong motion accelerograms, and analyses of storing motion accelerograms: Earthquake Engineering Research Laboratory, California Institute of Technology, 80 volumes.
California Institute of Technology, 1979-1984, Southern California array for research on local earthquakes and Teleseisms (SCARLET), preliminary determination throug"h July 1983: Calif ornia Institute of Technology Seismological Laboratory.
Coffman, J.L., and Von Hake, C.A., 1973, Earthquake history of the United States (revised through 1970): National Oceanic and Atmospheric Administration.
Donovan, N.C., 1973, Earthquake hazards for buildings - in Building Practices for Disaster Mitigation: National Bureau of Standards, Building Science Series 46.
Duke, C.M., and Leeds, D.J., 1971, Site characteristics of southern California strong motion earthquake stations: California Division of Mines and Geology Special Publication 38.
Eguchi, R.T., Campbell, K.W. and Wiggins, J.H., 1979, A survey of expert opinion on active and potentially active faults in California, Nevada, Arizona and northern Baja California: J.H. Wiggins Company Technical Report 79-1328-2 to U.S. Geological Survey.
Friedman, M., 1976, Seismicity of the southern California region, 1 January 1972 to 31 December 1974: California Institute of Technology Seismological Laboratory.
55

Fuis, C.S., Friedman, M.E., and Hileman, J.A., 1976, Preliminary catalog of earthquakes in southern California, July 1974-September 1976; U.S. Geological Survey Open-File Report 77-181, 107 p.
Greensfelder, R.W., 1974, Map of maximum bedrock acceleration from earthquakes in California: California Division of Mines and Geology Map Sheet 23, Scale 1:2,500,000.
Hart, E.W., 1977, Fault hazard zones in California: California Division of Mines and. Geology Special Publication 42.
Hileman, J.A., Allen, C.R., and Nordquist, J,M., 1973, Seismicity of the southern California region, 1 January 1932 to' 31 December 1972: California Institute of Technology Publication, 404 p.
Krinitzsky, E.L., and Chang, F.K., 1975, Earthquake intensity and the section of ground motions for seismic design - in state of the Art for Assessing Earthquake Hazards in the United States: Corps of Engineers Waterways Experiment Station, Misc. Paper 5-73-1.
Krinitzsky, E.L., and Marcuson, III, W.F., 1982, Principles for selecting earthquake motions in engineering design: U.S. Army Engineers, Waterway~ Experimental Station, Vicksburg.
Lamar, D.L., Merifield, P., and Proctor, R. J., 1973, Earthquake recurrence intervals on major faults in southern California - in Geology, Seismology and Environmental Impact: Association of Engineering Geologists, Los Angeles, p. 265-276.
National Oceanic and Atmospheric Administration, 1928 - present, United States earthquakes: U.S. Coast and Geodetic Survey, National Oceanic and Atmospheric Administration and U.S. Geological Survey annual publications.
National Oceanic and Atmospheric Administration, 1973, A study of earthquake losses in the Los Angeles area: National Oceanic and Atmospheric Administration, 329 p.
Olson, R.A., and Thiel, Jr., C.C., editors, 1983, Earthquake damage mitigation for computer systems - Workshop Proceedings, Finance, Insurance and Monetary Services Committee: Earthquake Engineering Research Institute, Berkeley •.
56

Shannon and Wilson, Inc., and Agbabian Associates, 1978, Verification of subsurface conditions at selected "rock" accelerograph stations in California: U.S. Nuclear Regulatory Commission, NUREG CR/0055, Vol. 1.
, 1978, Geotechnical ~------~~--~--~ and strong motion earthquake data from U. S. accelerograph stations:
U.S. Nuclear Regulatory Commission, NUREG - 0029, Vol. 2.
, 1980, Geotechnical =---and strong motion earthquake data from accelerograph stations: U.S.
Nuclear Regulatory Commission, NUREC/CR-0985, Vol. 3.
, 1980, Verification .~-~~~--~---~ of subsurface conditions at selected "rock" accelerograph stations in
California: U.S. Nuclear Regulatory Commission, NUREG/CR-0055, Vol. 2.
Toppozada, T.R., Parke, D.L., and Higgins, C.T., 1978 Seismicity of California: 1900-1931: California Division of Mines and Geology Special Report SR 135.
Turpen, C. D., 1980, Strong motion records from the Mammoth Lakes earthquakes of May 1980: California Division of Mines and Geology Preliminary Report 27.
57

APPENDICES
A. PLOT PLAN AND BORING LOGS
B. SEISMIC SCALES
1. Intensity
2. Magnitude
C. ACCELEROGRAMS, SPECTRA, AND SITE GEOLOGY
Taft, 1952
Helena, Montana, 1935
Fairmont Reservoir, 1971
Lake Hughes No.1, 1971
Lake Hughes No.4, 1971
Long Valley Dam, 1980
58

APPENDIX A
PLOT PLAN AND BORING LOGS
59

~--------~--------------~/
EXIST. BLOGS.
(
~~-------------------------------------------~L~A~K~E~SH~OR~E~ ______ -=DR~/~V~E~ __________________________ ---------
'\ f
!I.IIl..FOR BOA. EI..EVS.]
SUAv [YOAS SPII(£ I'" .tlSPHAt.TIC P "VI N&,£L..Z28t.'5+.
BOR.2 '
• BOR.S
• BOR. 7
BOR.6 •
PROPOSED DATA ANALYSIS
FACILITY (BLDG. 4838)
EXIST. BLDG.
PLOT SCALE
o I
PLAN

7.1 131 23
7.7 114 26
5 ~.--~----~----+----+--+r
227S1 I I ! I I
I I r 10 ~----!-...--+--+---i---++ I 'I 2.3 120 59
22701
6.2 128
5.8 137
41
57
BORING I DATE DRILL E D: September 2, 1981
24"-Diameter Bucket:
2281.5*
SILTY SAND - fine, lenses of Clayey Silt, light brown to grey
GRANITE - weathered, decomposed, light grey to grey
Light grey and white
LJ._-L3=-:.:....::6--.L=-14..:...-0~-=-54~--"'L_--'-----.) NOTE: Water not encountered. No caving.
* Elevations refer to datum of reference drawing; see Plate 1 for location and elevation of bench mark.
PLATE A-2
61

2280
11.8 107 13
2275 6.6 141 49
2270 NOTE:
BORING 2
DATE DRILLED: September 2, 1981 24"-Diameter Bucket
2281. 5
1~" Asphaltic Paving -FILL - SILTY SAND - fine, some gravel,
light brown SILTY SAND - fine, light brown GRANITE - weathered, decomposed, light
grey and grey
(BORING TERMINATED DUE TO DIFFICULT DRILLING IN GRANITE)
Water not encountered. No caving.
PLATE A-3
62

3.2 118 13
4.3 106 56
227. 5+----~~-+----~--+--.h 4.5 79
1.1 97
I
227, 10 +---+---+-----+---1---1
226i 15 __ ......L..----L--~_..J
BORING3 DATE DRILLED:
EQUIPMENT USED:
September 2, 1981 24"-Diameter Bucket
ELEVATION: 2279.7
; SM SILTY SAND - fine, few gravel, light grey and light brown
GRANITE - highly weathered, decomposed, light grey to grey
(BORING TERMINATED DUE TO DIFFICULT DRILLING IN GRANITE)
NOTE: Water not encountered. No caving.
PLATE A-4
63

12.9 107
275 7.3 122 5
2.6 133
5.3 142
270 10
2.9 128
2265
16
25
34
41
66
BORING 4
DATE DRILLED: September 2, 1981
24"-Diameter Bucket
2279.2
t 2" Asphaltic Paving SM -FILL - SAND and SILT - some gravel, broW!
~~+-~ SILTY SAND - fine, light brown GRANITE, - weathered, decomposed, light
grey and grey
White
(BORING TERMINATED DUE TO DIFFICULT DRILLING IN GRANITE)
NOTE: Water not encountered. No caving.
PLATE A-5
64

5.6 116 23
227Q
lOr---~---+----r---~·
226
BORING 5
DATE DRILLED: September 2. 1981 EQUIPMENT USED: 24 "-Diameter Bucket
SH
2278.9
2" Asphaltic Paving SILTY SAND - fine. light brown
GRANITE - weathered, decomposed, light grey to grey
(BORING TERMINATED DUE TO DIFFICULT DRILLING IN GRANITE)
NOTE: Water not encountered. No caving.
PLATE A-6
65

4.3 118 55
1. 3 l35 148
2275
10+---~--~---+---+-4 2270
BORING 6
DATE DRILL ED: September 2, 1981
USED; 24"-Diameter Bucket
2280.6
SM SILTY SAND - fine, light brown
GRANITE - weathered, decomposed, light grey to grey
NOTE: Water not encountered. No caving.
PLATE A-7
66

3.3 122 25
2.6 l31 72 5
275
10
BORING 7
DATE DRILLED: September 2, 1981
EQUIPMENT USED: 24 "-Diameter Bucket
2282,Q SH SILTY SAND - fine, brown
NOTE:
GP~ITE - weathered, decomposed, light grey and grey
Water not encountered. No caving.
PLATE A-8
67

APPENDIX B
SEIS~lIC SCALES
1. INTENSITY 2. MAGNITUDE
68

MODIFIED MERCALLI INTENSITY (DAMAGE) SCALE O~ 1931 (Abridged)
I. Not felt except by a very few under especially favorable circumstances. (I Rossi-fore 1 Scale.)
II. Fe It only by a fe.w persons at rest, especially on upper floors of buildings. Delicately suspended objects may swing. (I to II Rossi-Forel Scale.)
III. Felt quite noticeably indoors, especially on upper floors of buildings, but m1lny people do not recognize it as an earthquake. Standing motorcars may rock slightly. Vibration like passing of truck. Duration estimated. (III Rossi-~ore 1 Scale.)
IV. During the day fE! It indoors by many, outdoors by few. At night sorre awakened. Dishes, windows, doors disturbed; walls make creaking sound. Sensation like heavy truck striking building. Standing motorcars rocked noticeably. (IV to V Rossi-Forel Scale.)
V. Felt by nearly everyone, many awakened. Some dishes, windows, etc., broken; a few instances of cracked plaster; unstable objects overturned. Disturbances of trees, poles, and other tall objects sorretirres noticed. Pendulum clocks may stop. (V to VI Rossi-Fore 1 Scale.)
VI. Felt by all, many frightened and run outdoors. Some heavy furniture moved; a few instances of fallen plaster or damaged chimneys. Damage slight. (VI to VII Rossi-Forel Scale.)
VII. Everybody runs outdoors. Damage negligible in buildings of good design and construction; slight to moderate in well-built ordinary structures; considerable in poorly built or badly designed structures; some chimneys broken. Noticed by persons driving motorcars. (VIII Rossi-Forel Scale.)
VIII. Damage slight in specially designed structures; considerable in ordinary substantial buildings with partial collapse; great in poorly built structures. Panel walls thrown out of frarre structures. Fall of chimneys, factory stacks, columns, monurrents. walls. Heavy furniture overturned. Sand and mud ejected in small amounts. Changes in well water. Persons driving motorcars disturbed. (VIII+ to'lXRossi-Forel Scale.)
IX. Damage considerable in specially designed structures; well-designed frame structures thrown out of plumb; great in substantial buildings, with partial collapse. Buildings shifted off foundations. Ground cracked conspicuously. Underground pipes broken. (IX+ Rossi-Forel Scale.)
X. Some well-built wooden structures destroyed; most masonry and frame structures destroyed with foundati.ons; ground badly cracked. Rails bent. Landslides considerable from river banks and steep slopes. Shifted sand and mud. Water splashed (slopped) over banks. (X RossiFore I Scale.)
XI. Few, if any, (masonry) structures remain standing. Bridges destroyed. Broad fissures in ground. Underground pipelines completely out of service. Earth slumps and land slips in soft ground. Rails bent greatly.
XII. Damage total. Waves seen on ground surface. Lines of sight and level distorted. Objects thrown upward into the air.
PLATE B··1
69

AMPLITUDE
1IIIIIIilllll"~111I1
-------S-P=24 sec
50
40 6
30 ~ ____ -------5J-------------r
20
0-5
DISTANCE km
20
/0 8 6
4
2
4
3
2
/0
5
2 /
0.5
0.2
0./
S-P o
MAGNITUDE AMPLITUDE sec mm
TO DETERMINE THE MAGNITUDE OF AN EARTHQUAKE WE CONNECT ON THE CHART
A. THE MAXIMUM AMPLITUDE RECORDED BY A STANDARD SEISMOMETER, AND B. THE DIS'l'ANCE OF THA'r SEISMOMETER FROM THE EPICl!:NTEH OF THE EARTHQUAKE (OR THE DIFFERENCE IN THE TIMES OF ARRIVAL OF THE P AND S WAVES)
BY A STRAIGHT LINE, WHICH CROSSES THE CENTER SCALE AT THE MAGNITUDE.
RICHTER MAGNITUDE SCALE NOMOGRAPH
PLATE B-2
70

Ref;
The Magnitude Scale is a means of indicating the size on an earthquake on the basis of instrumental records.
Dr. C. F. Richter, Seismological Laboratory, California Institute of Technology, developed a magnitude scale which is based on the maximum recorded amplitude of a standard seismograph located at a distance of lOO km from the source of a shallow earthquake. The magnitude is defined by the relationship
M = log A - log Ao
In this relationship, A is the recorded trace amplitude for a given earthquake at a given distance written by a standard instrument, and Ao is the trace amplitude for a particular earthquake selected as a standard. The zero of the scale is arbitrarily fixed to fit the smallest recorded earthquakes. The largest known earthquake magnitudes are on the order of 8 3/4. This magnitude is the re suIt of observations and not an arbitrary scaling. The upper magnitude limit is not known, but is estimated to be about 9.
Empirical relationships between earthquake magnitude and energy release have been developed by several investigators. There i.s no exact relationship between earthquake magnitude and energy for large earthquakes, and these empirical relationships should be cons ide red no more than approximations.
RICHTER EARTHQUAKE MAGNITUDE SCALE
Richter, Elementary Seismol~, 1958
PLATE 8-·3
71

APPENDIX C
ACCELEROGRAMS, SPECTRA,AND SITE GEOLOGY Taft, 1952 Helena, Montana, 1935 Fairmont Reservoir, 1971 Lake Hughes No.1, 1971 Lake Hughes No.4, 1971 Long Valley Dam, 1980
72

Toft; Lincoln School
USG S Tc)pogrophic Ouadrangle:
Taft I Colifornia
Coord inates: 35 0 OS' 52" N 119 0 27' 22"W
Location: Sixth and Warren Streets.
O~-==IOO~O~~2~OcO=O======~O Scale in feet
Structure: Two- story I reinforced concrete
Note: Coordinates scaled from USGS topographic quadrangle
STATION LOCATION PL.AN LINCOLN SCHOOL
LOCATION, TAFT ACCELEROGRAPH TAFT
N
1
Ref: NURJD3/0029, Vo1.2 PLATE C-I _______ , __________________________ ~~~~~~ __________________ _J
PLATE C-1
73

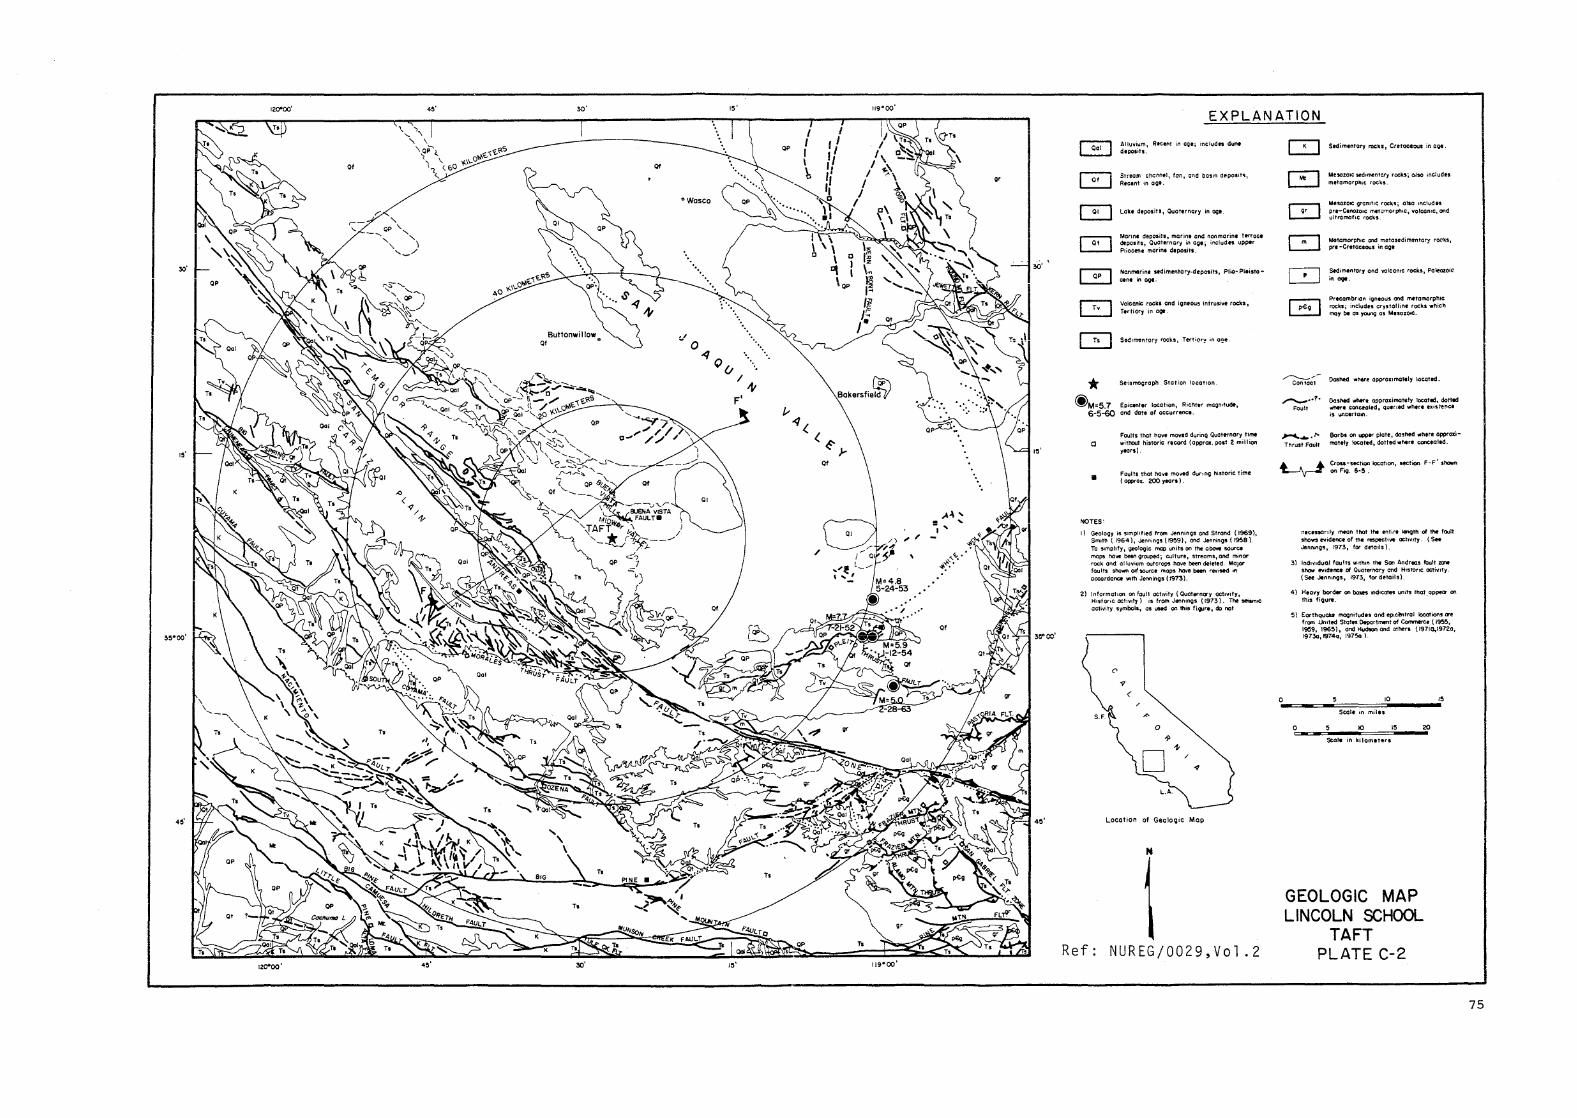
30'
120"00'
:/ o -<10 ' ... ".
v/
'" F'
gr
BOkersfie~
QP T,
EXPLANATION
*
Allulilum, Recent in Qq.; mCh.ldH dune d.g,osits.
Stream cheonel, fan, Clnd bOSln aeposif1, Reeln' In C1Q'.
Loke aepo.iU I Quaternary in 00'.
MOrLn, deposit., marH'lt and nonmarine terrace dfpo.tt" Quot.rnor), in COlj includes upper Pliocene marine deposit •.
Nonmarine sedimentary·deposit" Plio·PI.istoctnt in 0Qt.
Volcanic rock. and igneous intrusive rock. 1
rertiory in oOt.
SeIsmograph StatIon locatIon
@M=5.7 Epicenter location, Richter I'nognltudt:,
6-5-60 and date of occurrence.
Faults that have moved during Quaternary time
C Without historic record (OWrox. post 2: million years).
• Faults thot hove mo.".d durlOQ historic time (OQp!'or;. 200 years) .
NOTES:
I) Geology is $lmpl,fied from Jennings ond Strand (1969), SmIth ( 1964), Jennings ( 1959), ortd Jenninos ( 1958 ). To 5Imphfy, QeOlogic mop units on the abcNe source maps haw been grOJPedi culture, streoms, and minor rock and olluvium outcrops hove been deleted. MoJO'" fou Its shown ad source mops have been relllY<i 1ft
occordance WIth Jennings (1973),
2} Inform~tlon on fOlJU achvity (Ouoterna-y Oefl'llty, Hlstonc octl'1lfy) JS from Jennings (1913). The sesnllC aetly,t)' symbol" ~ used on this fillJre, do not
Location of GeoloQic Mop
N
Ref NUREG/0029,Vol.2
~/ -Contact
",-......,. •• ? Fault
............... /"0
Thrust Fault
~
Sedimentary rocks I Cretaceous in oot·
MesozoIc sedimentary rocks; oJso Includes metamorphic rocks.
MesozOtC QrGntfU: rocks; also Includes pr,-Cenozolc tnetcmorptuc, lIolcanlc, and ultramafiC rocks
MetamorphiC end meto,edirMntory r!X'.k" pre ·Cr.toceous in OQI
Sedimentary and volcaniC rock', Paleozoic in 091.
Prtcombflon Igneous and metamorphiC rock,; includes crystallin. rocks which may be OS young os MuozQ4C.
Doshed where opptoxlmotely located.
Dashed llbere approximate!y Iocat.:!, dotted whtfe conceoled, Quened where eXIste!'1c' IS uncertalft.
Barbs on UC)pIr plate, dashed ",here opproxi-motely located, dotted wl'\t:rt concealed.
CrOU-se(;flon Iocatlon, sectton F-F' shown on Fio. 6-5.
neeeHOflly mean tnot ttw entire I8'\QtI'I of the fault shows eYldence of the respect • ..,. oct.ytfy. (SM Jennings, !973, for details).
o
3) Indl'/lduol faults WIthin the Sen Andreas fault zcr,e shOw evidence of Quoternory and HIstone octi"'lfy. (Sft Jen",~$, 1973, forde-tails).
4) Heavy border on boxes tndle~ unln thot appeQ" on thiS figure. .
5) EorthquQU magnitudes and e-plc~trQI locotions a-e fram -UnIted Stotts Department of Commerce ( 1955, 1959, 196~), ond Humon and others t1971a.19720, 19730, 1974Q~ 19750)
10
o iO 15 20
$Cale in kilometer.
GEOLOGIC MAP LINCOLN SCHOOL
TAFT PLATE C-2
15
75


:;0 (]) t-h
Z -...J c:
:;0 -...J
t<:l Q
........... 0 0 tv \0
<: 0 i-'
N
F San Andreas Fault
,, ___ : __ n._,\ "''''''''V r'UIiI
5000-
o
5000
Temblor Raiiye
"
him
--, "
Taft
Qf ,:::----~ ..... -----, \ \
,
\.--, , -- ..... ,. \ '-- ""' ....... Qp
, ,
\ '---................... --.. -- PSJ~ \ ........... ----\ ',........... --\ ,,'-----" Mr ....... " ... , ................ ---" ..... _------
Pe
----
Son Joaquin Volley
Qf
--
F'
-5000
o
5000 ---- ...... ---- -- ------
Mr
10OOO-L---------------------L------------------------~~----------------------------~M~Od~if~ie~d-a7.ft~er~:-I~)~D~ib7b~I •• -(~19~6~2~)-IOOOO
G'> rn o 5
rG> z(") 8(")
-tr~ l>Z(J) ~(J)(J)
(")1 :J:(J) orn 0(") r-t
o Z
" I
"
Explanation
I Qal I Alluvium, Holocene in oge
rQfl ~lIuviol fan deposits, Holocene ~ In age
IQP1 Non-marine sedimentary deposits, ~ Plio- Pleistocene in age
rp.:1 ~orales Formation, Pliocene ( Pleistocene?) ~ In age
~ Quatal Formation, Pliocene in age
I Psj I Son JoaQuinFormation, upper Pliocene in Glle
!pbl Bitterwater Creek formation, middle and/or ~ lower Pliocene in aoe
rp:i Etchegoin 'ormation, middle and/or lower ~ Pliocene in age
~ Coliente ~rmation, upper Miocene in age
~ Basalt flows, upper Miocene in age
2) Haote, Bear, 8 Kleinpell (1954)
f"Msl Santa Margarita Formation, upper Miocene ~ in age
~ Reef Ridge Formation, upper Miocene in age
I Mml Monterey Formation, upper and middle Miocene in age
fM0 Temblor and/or Vaqueros Formation, middle ~ Miocene in age
--- Contact between geologic units ---- Fault Scale in miles
o 5 10
* Accelerograph station, projected Note: See Fig. 6-4 for locat'ion of cross-section.

50
100
I-I.L.
I-u :I: 500 ..., .., I-0 0.. a: ..., 0.. Q
(/)
U
t; a: ..., I-u
'" 1000 a:
'" :I: U
..., I-iii ..., ~ 5000
'" ~ a :I: I-a:
'" ...,
10,000
o
... ~
STATION VELOCITY, FPS
5000 10,000
I
I I I
II I, II
I ; : ! t
I I
~I 0:1
I
SITE CHARACTERISTICS, TAFT
Ref: Duke & Leeds, 1962
78
TAFT No. 55
Woter Cantont Density
r. pd W L Ele. 900'
1.5 65 · . Silty anel sanely 30 140 • 0 :
loon" sand, and · . " , (shol") glo".1. • o· -". "
'. ':' ; • 0 , .
• 0, · " • 0 ••
Tular. fm. (U. Pliocene)
-
--
144 --
-
--
- - San Joaquin fm. -148 (Pliocene) - Reef Ridge fm.
-. (Miocene)
- Antelope f,n. (Miocene)
-r/'!l 'II,; Santa Malgarita
170 - I;;' schi st II? -"'I. ,I I!,.
- I'lf ~ill
- II;
I I~;;; III
I '///
PLATE C-4

-....J \0
-...J f-' I
U1 o
KERN COUNTY. CRLIFORNIR ERRTHQURKE JULY 21. 1952 - 0453 POT IIR004 52.002.0 TRFT LINCOLN SCHOOL TUNNEL COMP N21E
C) PERK VRLUES: RCCEL = 152.7 CM/SEc/SEC VELOC I TY = -15.7 CM/SEC DISPL = -6.7 CM -250
i-3 H ~ t:tj I
::r: H Ul 1-3 0 :;0 to< ,
1-3 ~ I'%j 1-3
Z N f-' t:tj
o .......... m''''JlJ ::0 n nn
3:fTl ;)j. fTlfTl
250 ~I ______ ~ ______ ~ ______ ~L_ _______ ~ ______ ~ ______ ~ ______ ~ ______ ~ ______ ~ ________ L_~ ~--~ ~---i
-20 n 0 Z
-8
o ~---+~~------~~-------T------
81 L ____ ~~ ___ L ____ L_ ___ _L __
o 10 20 .. ___ L-_____ L_ .. __ ..
30 TIME - SECONDS
--'-_______ .J.
40
~--n-•

ro 0
() H 1-3
~ -250 t:r:1 ::0 t"'
-.J I-' I 0 Ul o
1-3 250 H 8: -20 t:r:1 I
n:: H (f)
1-3 0 ::0 0 K!
~ I'1j 1-3 20 (/) 0'1 -10 ~ M
KERN COUNTY, CRLIFORNIR EARTHQURKE JULY 21. 1952 - 0453 PDT IIR004 52.002.0 TRF T LI NCOLN SCHO.oL TUN~~EL COMP S69E
C) PERK VRLUES: RCCEL = 175.9 CM/SEc/SEC VELOC I TY = -17.7 CM/SEC OISPL = -9.2 CM
---; ---.l __ ----L_ --< ---.J
o ~~--~--~----~------+--------~ ----t~ ---r-"------------',-+----\------/---\------i---------+----7"---
10 L-______ ~ ______ ~ ______ ~ ______ ~
o 10 20
o (J)
---u .-n:D 3:(}
-~L------3LO----~-----4~0-------L------5~0---~~-~ Z
TIME - SECONDS ---;

co ...
KERN COUNTY, CRLIFORNIR ERRTHQURKE JULY 21, 1952 - 0453 POT IIR004 52.002.0 TRFT LINCOLN SCHOOL TUNNEL COMP VERT
C) PERK VRLUES: RCCEL = 102.9 CM/SEc/SEC VELOC I TY = 6.7 CM/SEC D I SPL = -5.0 eM -250
0
250
-8
0
-6
n ::s:: "-Ul rn n "-Ul rn n
n ::s:: "-
-Ul rn n
-
n n n fTl I fTl ::0 n -;
0 :z
< fTl I 0 n -; --<
o Ul --u I
~~-~----~~-------~------~----~--~--~---~ ~
61 L ______ -L ______ -L ______ -L ______ -L ______ -L ______ -L ______ -L ______ -L ______ -L ______ -L ______ ~
o 10 20 30 40 50 TIME - SECONDS
Ref: CIT/EERL 71-50 TIME-HISTORY, TAFT Vertical
fTl 3: fTl :z -;

KERN C~UNTY, CALIF~RNIA EARTHQURKE JULY 21,1952 - 0453 POT
u Q)
< c:
>- 6 I-U 4 0 ...J W >
2
IIIAOOij 52.002.0 TAFT LINCOLN SCHOOL TUNNEL COMP N21E
DAMPING VALUES ARE 0, 2. 5. 10 AND 20 PERCENT OF CRITICAL
PERIOD (sees)
RESPONSE SPECTRUM, TAFT N21E
200
-4--*-~ 100
--+---#-¥--¥-~ 80
',~d--r:---+o.L-l 60
20
10
8
6
4
2
~~-+-...,jL:-..A I
~f.'--' .8
.6
.4
Ref: CIT/EERL 72-80 PLATE C-8
82

KERN C~UNTY. CALIFORNIA EARTHQUAKE JULY 21. 1952 - 0453 PDT
t) Q)
~ c
>-I-U 0 -.J W >
IIIAOOij 52.002.0 TAFT LINC~LN SCH~OL TUNNEL COMP S69E
DAMPING VALUES ARE O. 2. 5. 10 AND 20 PERCENT OF CRITICAL
6
:2
I t---''VI'---'''<-lf<--::¥#-f-
.13 1-f--j-->~tM~+-:-~¥--l;.L-
PERIOD (sees)
RESPONSE SPECTRUM, TAFT N69E
200
~--,.f--¥-l 100
-+--cJ'--'l('---¥---/ 80
.~~-r----P'<:1"--1 60
20
10
8
6
4
Ref: CIT/EERL 72-80 PLATE C-9
83

KERN C~UNTY, CALIFORNIA EARTHQUAKE JULY 21. 1952 - 0453 POT
u Q)
< c
>-I-U 0 -.J W >
2
IIIAOOij 52.002.0 TAFT LINCOLN SCHOOL TUNNEL COMP VERT
DAMPING VALUES ARE O. 2. 5. 10 AND 20 PERCENT OF CRITICAL
200
~~~IOO
-+--#-¥-....j,.L----I 80
_~...,4_-+-~'__l 60
20
10
8
6
4
2
~~_,L_..,jL:>..A 1 1 1--'>..I<--''-<---lr.4-l1,lL-l,1-
.8~~~~~~~~~~~~~~~~~~~~~~~~~ £..-4-'<---1 .8
.6
PERIOD (sees)
RESPONSE SPEC'I'RUM, TAFT Vertical
Ref: CIT/EERL 72-80 PLATE C-lO
84

CMONTANA
• ~'_~_'F_O'_" ______ ~ PAL
T,
Qat (
\
* @:lZ: 6-1-';5 Epicent.r location, jnfen'it)'-MOdi'led·~K'b~ _____ ~~L_._2.=1!Y.~==:::I::;:j=::_.:s~C!~..f~L_L __ "':~':...LLJ.!J-!..."':::.1~~~~J
Mercolli and dot. of occurrence, ~
~(~ Doshed where opprollimalely located
~ ••• Dashed where approximate,y loeafed, Fault dotted where concea led
Not,,:
I) Geoloo)' " simplified from Ro .. ,.t 01 (1955). To simplify, geologic mop unit, on the obove loorc. mop hovt betn groupedj culture, ,'reoml, and mi~'or rock and ollu vlum outcrops havt betn deleted.
2) eron-Itetion M-t .... 'e ~hown on FlO. 13-!5.
3' EarlhqlJokt magnltudn and eplc.nlral locations or. 'rc'm U.S. GeoloQicol Survey filn (unpublilhld I.
4) Additi(lrlOl eplc,M.r. are listed in Tobl' 13A-1 and appeor on the G'OloQlc Mop for Moniano Stat, lJnivenlfy, Bozeman, Montano, FiO. 10-4, (Section 10 0' th I, Volume I.
EXPLANATION
B :~:=~=::!~:JKlI'~~:'::= ~ rOCln. QO' and SO"" okler alluvIum of PliO--cent 00"
MeSOloic vol conic rockl; inch,teU"', tome Tar"ory voiconio rock •.
GEOLOGIC MAP Giociol drift, Quot.fnorv mOOt. a Metalolc Hdim,ntoryrockl
SCIENCE AND LIBRARY BUILDING Volcanic rock" Tertiary in oQ"
·Stdlm.ntar), rock-,. rlttlor)' in oOt.
Coar" grained Intru.lv. roeh, "'rflary in ~ ••
rri("b1 Boulder batholith and broadly r,lot,d L...:..::'-I ,tach, T.rliory-Cretoc'oul in 091
M"OIOic intru,lv. rock'
Poleoloic: rock., undiffertntiot,d
precambrian rock., undlfftrenflott!
Ref: N U REG / C R·O 98 5, VoL 3
85
CARROLL COLLEGE HELENA, MONTANA
PLATE C-11

OJ 0\
M
Southwest
Ti
Carrol I College
Accelerograph Station
(1.5 Mi les Southeast)
M'
Northeast
~------------------------------------------------------------------------------~------~'-----------------------La ::0 (!) t-h
Z C ::0 tr:l 0 "-n ::0 I 0 \0 00 Ul
<: 0 f-'
W
EXPLANATION
~Alluvium, Pleistocene and Recent in age (Qal)
~ Tertiary deposits, undifferentiated (Ts)
~ Intrusive rocks, Tertiary-Cretaceous in age (TKb)
~ Volcanic rocks, Tertiary -Cretaceous in age (Tv.)
~ Sedimentary rocks, Jurassic-Cretaceous in age (PAL)
~ Sedimentary rocks, Devoni~n-Cambrian in age (PAL)
~ Sedimentary rocks, Cambrian in age (PAL)
I p€u I Sedimentary rocks, Precambrian in age; Belt Series ( p€)
Contact between geologic units, dashed
where approximate or inferred
Fault, dashed where approximate or inferred
Modified after Pardee and Schrader (1933)
o 4 6
Scale in mile~
Notes: I) For cross-section location see Fig. 13-4.
2) Abbreviations in parentheses refer to geologic symbols shown on Fig. 13-4.

::0 CD Hl .. \.) HELENR. MONTRNR ERRTHQURKE OCT 31. 1935 - 1138 MST H 1-3 I I8025 35.001.0 HELENR. MONTRNR CRRROLL COLLEGE COMP NOOE "-txj
(!) PERK VRLUES : RCCEL = 143.5 CM/SEC/SEC VELOCITY = 7.3 CM/SEC DISPL = 1.4 eM txj ::0 -250 t"I
.....:J :0 IV nn I 3: n Ul ....... rn 0 (fl'
0 fTlrn n:JJ Ztl:o fTl-i no-<
0
1-3 z H 3: 250 I txj I
-8 ~ ::c H
(Xl (fJ -..J 1-3
0 ::0 < ><: n r11 , 3:' ....... o-tt:
(fl n p.; ...... txj -i t"I -< txj Z ~
Z 0
-2 0 txj
0
(j)
-U , 0 n:O
3:n rn
'U 3: t"I rn ?
21 ~
z 1-3 -1
txj
\.) I 0 10 20 30 40 50 i-'
TIME - SECONDS w

::u CD HELENR, MONTRNR ERRTHQURKE OCT 31, 1935 - 1138 MST t-h ..
IIB025 35.001.0 HELENR. M~NTRNR CRRR~LL C~LLEGE C~MP N90E ()
(!) PERK VRLUES : RCCEL = 1 L12 .5 CM/SEC/SEC VEL~CITY = -13.3 CM/SEC OISPL - -3.7 eM H -1-3 -250 "-tr::I tr::I :n ::u
~~ t"'
.....:J IV 0 I n :::0
U1 ~:n 0 rn'-;
n~
250 1-3 -20 ' H :s:
R tr::I I !-::r:
n~ 00 H 00 (j)
.A 1-3 0 :r .
0 r---', wrv
'V ~~ :;0 ~~ 0-<: ,
!- 4
::r: tr::I 20 ! t"' tr::I z -4 ::t:>
z \0
0
0 (f)
tr::I -p t-
O ~~ ~ ~ y
'"d t"' 4 ::t:> 1-3 0 10 20 30 40 50 tr::I TIME - SEC~NOS () I
...... 01::>

:;0 (!) I-il
HELENR. MONTRNR ERRTHQURKE OCT 31. 1935 - 1138 MST (J II8025 35.001.0 HELENR. MONTRNR CRRROLL COLLEGE COMP Up H f-3 (!) PER~~ VRLUES : nr"r-rl n..., r ............... ..- ........................ VELOCITY = -9.5 CMISEC DISPL - 2.8 eM -....... HLLC.L = Ol.:l LM/Jl:L/Jl:L -
tr:l -90 tr:l :;0
:0 t"i n -...J
~~ tv I 0 Ul
~~ 0
~ t-c3 H
90 :s: i:J:j ! -10 :r:
H (/)
t-c3 00 0 -< 1.0 :;0
~~ K; , 0 :r: a tr:l t"
lJ' tr:l s; <: (!) -li '1 rt 1-" ()
0
OJ Ul f--' -u
r 0 n:o
::;:: n' m ~
"Cl ~ t"i
-i
~ lil t-c3
tr:l 0 10 20 30 liD 50 (J TIME - SECONDS I f--' Ul

200
100
80
60
40
20
(j Q) U)
'-.... 10 c .- 8
>- 6 r-U 4 0 -l W >
2
HELENR. M~NTRNR ERRTHQURKE ~CT 31. 1935 - 1138 MST
1119025 35.001.0 HELENA. MONTANA CARROLL COLLEGE COMP NOOE
DAMPING VALUES ARE 0, 2. 5. 10 AND 20 PERCENT OF CRITICAL
200
100
80
60
40
20
10
8
6
4
2
L..-.t?"---'I . 8
.6
.2
.04 .0608 1 .4 .6.8 1
PERIOD (sees)
RESPONSE SPECTRUM, HELENA NOOE
Ref: CIT/EERL 73-80 PLATE C-16
90

u Q)
< C
>-r-0 0 ...J W >
HELENA, M~NTANA EARTHQUAKE ~CT 31, 1935 - 1138 MST
J IJ6025 35.001.0 HELENA. MONTANA CARROLL COLLEGE COMP N90E
DAMPING VALUES AAE 0, 2, S, 10 AND 20 PERCENT OF CRITICAL
200 200
100 i--''l<f-~*," -&---,f--""X'-I I 0 0
80 F-'--+->' ___ t<'-'~-t- -+-~~----IrL-....-i 80
60 i-----k-:.,£---h-----h:-:"*:
20
10 8
6
4
2
I f---"vHjl+-fj'HF---Y---t
.8~-~~~~-+-~~-+'---*
PERIOD (sees)
~d---/-------I'if--l 60
20
10
8
6
4
2
"---t~-i . 8
.6
.4
RESPONSE SPECTRUM, HELENA N90E
Ref: CIT/EERL 73-80 PLATE C-17
91

u (l) (/)
.......... c::
>-r-U 0 ..-.J W >
200
HELENR, M~NTRNR ERRTHQURKE ~CT 31, 1935 - 1138 MST
1[[8025 35.001.0 HELENA. MONTANA CARROLL COLLEGE COMP lJp
DAMP[NG VALUES ARE 0, 2, S. 10 AND 20 PERCENT OF CR[TICAL
200
1 00 I---'>..f-"<-"""'" -d'--n'----'X"-l 100
so F-+-"'<-'b<'-'''l7:-+- -+~--*--y"---l SO
60 1--+--,,L-h-4c--A<6 ,~--r'----r'---f>-d-----4 60
20
10
S
6
4
2
~~~~~~~~~~,,~~~IO
~~~~~~~~~L-~~~~~~~~~~~~~~~~+-~~~~S
"=--'~l\---I'<-7"--1~--k--c~-r---7"-~7"--i6
II---'>~~~~~ ~.~~~,L-~~~~~~~r-¥-~~~~~~ ~~-7~~~ I .8 .S
.6
4
. 1 L.lcilillJ..L..C.L.u..iliLu...L.LLLJ...Lll.L1...i.'..LLLi.W.ilii.LJ.L.LL.J...J.1..u..LL.LLLLLLlJ..LL.L.LLLL.l.li":-w.J.L.J...::-U-"':':"'"7.w....L...L.U...I;:;:--'-'-'-' . I .04 .06 .OS .1 .2 .4
PERIOD (sees)
RESPONSE SPECTRUM, HELENA Vertical
Ref: CIT/EERL 73-S0 PLATE C-lS
92

;;0 (])
-I,
::z c ;;0
rrI G)
'-n ;;0
I a ~ a :: Ui .S U1
c: .2
<: '; .. 0 w
I-'
\0 W
." l> ::.0 s: 0 -a " r 1> Z
)::> --I ::.0 -I
rrI s:: ::.0 0 ", n Z en
I-' --I ",
'" ::.0 < 0 ::.0
K
North
5000-
4000-
Qao
: .. 0 .. > 0
<> ::E
Tfv QOQ Qal
.~ .. ::: a: c: o E ;; "-
Accelerograph Station ~(80rlno 8-3 and 8-3A
II Qal QaO
.. co
" 0:
~ 0 N
" 0 "-~
0
e " c: <I
c: 0 C/l
·tt~~sS~~D ... C .. ·ti'8';=··~··'~-~~I_ \/ /, ,/ I
2000
1000
G) rT'1 1-' 0 5 G) ()
() :::0 0 en en
I en ", ()
--I 0 Z
~ I ~
\/ /\
(Jl ~ <1l 0 ct> Ii :1-1
c;:to (l) Q o Pl l-lri-o ...,-
Otl 0 !-'-::s ()
0 ~H:I III "dO ~ Ii
0 t:-I(Jl
~~ (l) (f.l
::r:~ ~ri-
CO ...,-!:JO <D (Jl
::s
Z~ 0 ~ . I-'
./ \ \ / "-
\\. .... l I "I \\\ /' qm
/" \ \/ /\
I - --\
EXPLANATION
Recent [Oail Alluvial grovel, sand,and silt, includes some playa '---' clay in the Son Andreas fault zone (001) 2
Pleistocene I Qoal Older alluvial granitic sand and grovel (OP)
Pliocene I Tasl Anaverde Formation; arkosic sandstone with some shale and conglomerate. Occurs in San Andreas fault zone.( Ts)
{a Fiss Fanglomerate; CObble-boulder fanglomerate (Ts)
Miocene (?)
I TOhl Gem Hill Formation; pyroclastic rocks including lithic tuff and tuff breccia (Tv)
Mesozoic 6 Dominantly quartz monzonite ranging in composition to granOdiorite (gr)
0 Complex of gneiss and granitic rocks with overage Precambrian (?) composition of granodiorite (p-€g)
Notes:
v· " f' .. co 5 a:
:: South
.. > .. c: ~ I- -5000
-4000
~ 3000 5!.
.S
" 0
2000 0 > .. w
1000
MSL
I) See Fig.2-19 for plan view of geologic cross-section K -K I
2) Abbreviations in parentheses refer to geologic symbols used on Fig 2-19
3) See Fig. 2-29 for log of baring B-3 and B-3A
o Horizontal scale in miles
Vertical exaggeration 2 X
2

;;0 SAN FERNANDO EARTHQUAKE FEB 9, 1971 - 0600 PST CD I I (J207 71 .175.0 RESERV(JIR. FRIRM(JNT RESERV(JIR, CAL. C(JMP N56E -n
(!) PEAK VALUES: ACCEL = -6~.7 CM/SEC/SEC VEL(JCITY = 3.8 CM/SEC DISPL = -1.2 CM ("") -65 ....... -I -I D '" ....... ,,8 IT! 3: IT! IT! 3rn ;;0 I ;:J;. r :c 0 (T1 rn
....... C) :J)
-....J U'l ......::n
..j:::. -I g:{-I 10
0 ....... 0
01 7-J :z 01 -<
-n 65 )::0 .......
-4 ;:0 3: 0 Z
1.0 -I < *" orn :;0
IT! 0 3' ...... 0-
U'l (J) n ["Il (T1 .......
:;0 0-1
< ~
0 ....... :;0
4 z
-2 U1 Q)
["Il 0
U) \J • ""'Cl 0 o::n • 3: n-
)::0 rn -I ~
IT! rn :z
("") -I
I N 2 0 0 10 20 30 ~O 50 60
TIME - SECONDS

I
~ ACCELERATION ~ VELCICITY DISPLACEMENT
CM/SEC/SEC CM/SEC CM
~c ! l ~ ~f5 u
r-~ ...
3: ;:j' (Y) _J Z 0_
I- (n (f")CLeJ
--1 --1 /I --1~ o....~ u
0 0 u (D Li.J
- (j) o ..J ~:::: a: _ ... u u
(n .--i • •
r-- ~ 0:> mOil
~ --1 --1 ! I --1~ .--i > a: >_ W f--
m (f") >-... Wu a:D
o:::l _J (f")
W I- LJJ 0 l.L z '> z o ~ 0
~ u a: W ....... (f")
W a: t...l ~ l..L t~ 0 1
cr .~:J ::J a: Li.J
(Y)W ~ o ..... tr) .......
I 0 :i: l-I- > t...l a: a: cr~ w W r-
a:cn 0 I 0 Z 0 II
-l --1 J> --1 I~ --1~ cr-Z l.() _.J
a: r- t~ w'-;u l.L _ CI:
r-Z cr (f") r- (l)
o LLJ ~ ::J ....... _.J ..... CI:
~ ~ b ~ ~ -is :> ~c cr: LLJ CL E:)
0
0 0 o 0 0 o N 0 N 0 o - ..... I - ..... I
I
TIME.HISTORY, FAIRMONT RESERVOIR, N34 W PLATE C"21 Ref: CIT/EERL 74-55
95

;::0 CD SRN FERNRNDO ERRTHQURKE FEB 9, 1971 - 0600 PST -n
IICl207 71 .175.0 RESERVClIR, FRIRMCINT RESERVClIR. CRl. CCIMP UP () C9 PERK VRLUES : RCCEL = -32.9 CM/SEC/SEC VELCICITY = 3.4 CM/SEC DISPl = -1.7 eM 1--1 -35 -l-l -..... 1--1
f'T13:: n f'T1 f'T1 on ;::0 1 3: n r ::c ....... fTI
...... Ull -....,J Vl 0 fTlfTI
0:0 +=>-l ....... n 10 Ul---i
(J1 ;::0 "Tl .......
(J1 -< '0 :z:
""T1 35 )::> 1--1
;::0 -4 3:: 0
\0 Z 0'\ -l <
;::0 ofTI 3: 1
f'T1 ....... 0 Vl 0 Ul n f'T1 fTl ....... ;::0 0---i
< -< 0 1--1
;::0
4 < CD -2 "")
c-t-...... CJ (') Q) (f)
--' -u r
0 on n fTI 3: fTI Z
\J ---i r )::>
-l 2 f'T1 0 10 20 30 40 50 60
() TIME - SECCINDS I
N N

0 Q)
< c:
>-r-U 0 --.J W >
200
SAN FERNAND~ EARTHQUAKE FEB 9. 1971 - 0600 PST
1110207 71.175.0 RESERVOIR. FAIRMONT RESERVOIR. CAL. COHP N56E
DAMPING VALUES fiRE D. 2. 5. 10 AND 20 PERCENT OF CRITICAL
200
I 00 I----->,rf---".--!"oo~ ~O flO F-+->o.--!J,<"-"'tr,-+-
-&,-...,.f--Y-I 100
~~--~~~~~-~~~--~~~r/~~~~~-¥~80
60 t---h:7''--f'o<:--t-V''l'<.,'¢ -+-+<-"''--__I~__f>.c_-.p.,~+__r_~'--__I~__!>'''' u,-+I<~ ______ ---;>O">"__l 60
;w 20
10 10
8 8
6 6
4 4
2 2
1~~~~~,.M~~~-~~~~~-~~~~~~~~~~~rr~~1 .8 .8
("\---4-+..-l .6
PERIOD (sees)
RESPONSE SPECTRUM, FAIRMONT RESERVOIR, N56E
Ref: CIT/EERL 74-84 PLATE C-23
97
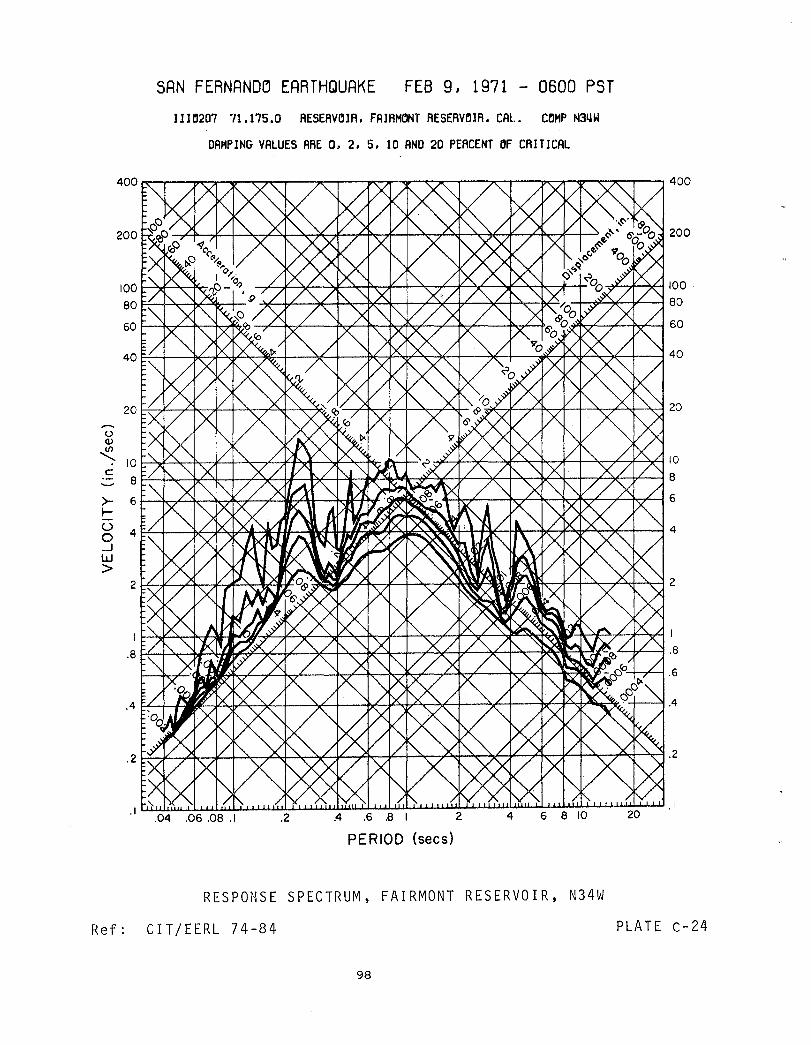
u Q)
< c
>-r-U 0 ..J W >
6
4
2
SAN FERNAND~ EARTHQUAKE FEB 9, 1971 - 0600 PST 1110207 71.175.0 RESERVOIR. FAIRMONT RESERVOIR. CAL. COHP N3ijW
DAMPING VALUES ARE O. 2. 5. 10 AND 20 PERCENT OF CRITICAL
200
*--*-"-¥-I 100
-I-~¥---i.o'---I 80
,~...,L--+-~L...j 60
20
10
8
6
4
2
I~~~~~~W~~~~~~~~~~~~~~~~~~'~~~~~I .8 .8
.6
.4
PERIOD (sees)
RESPONSE SPECTRUM, FAIRMONT RESERVOIR, N34W
Ref: CIT/EERL 74-84 PLATE C-24
98

Ref:
u <l>
.z c:
>-I-U 0 ....J W >
SAN FERNANDO EARTHQUAKE FEB g, 1971 - 0600 PST llHJ207 71.175.0 RESERVOIR. FAIRMONT RESERVOIR. CAL. COMP LP
DAMPING VALUES ARE 0, 2, 5, 10 AND 20 PERCENT OF CRITICAL
20
I 0 f--"wf'-'~r.--,.
8 F-'--+-".....--'ht"-'''i'r-+-
~-,f-~ 10
~~~-~~~~~~+-·~~~~~~~~~~~,~~~8
6 ~-k-...£.....-..l'-<--~"". ~~~---~~+r-~~~~~~--~~~ ·~~~~~~6
2 2
I
.S
.6
.4
.2
.1 .1
.OS .08
.06 .06
.()4 .04
.02
.01 .01 .06.08.1
PERIOD (sees)
RESPONSE SPECTRUM, FAIRMONT RESERVOIR, Vertical
CIT/EERL 74-84 PLATE C-25
99


15 I~' IIIroo'
Bokersfiel
15'
·o.oOArvin
g.,1 ... ... ~~ ". '" · .. ~/ .... .. ...
Qf
35-00'
o J 4
D I.. I..
~r s
45
001
°Loncaster
I~' 45' 30' 15'
Ref
EXPLANATION
~ Alluvium, Recent in 00'; inc Iud" dun. d.~t •.
~ Stream channel, fan, and boIin do~'it;. RICent in 00"
~ Loke deposits, OI..at.rnOfY in 0Qe.
~ Marine deposits, marine ond nonmarine terroct deposit., Quottfnory in 091; include. upper Pliocene marine dePOSits.
I QP I Nonmarine stdimtntory depotit., Plio·Pleisto'" c;ene in ooe.
~ VoIcCJ"lc rodr.s and ign.ous intrusive rocks, Tertiary in 001·
I T. I Sidim .... tV;)i ;V;:;;., iil~;u;J' iii u\ji.
* Sej,mOQrOph St'ltion locotion.
~=5.7 Epicenter location, Richt ... moonitude, 6-5-60 and date of occurr~.
Foults that hovt moYtd dlM'inQ Quaternary time C withOut historic record (awaa. post 2 million
y.:lrs)
• Foult. that havt moved d .... ina historic time (approx. 200 year.) .
NOTES:
I) GeoIocn' is sim"lifitd from Jennings and StNl"ld (1969). Smith (1964), ROQtrS (1967), and Jennings, Burn.tt and Troxel (1962). To slm"hfy, geologtC map units cr'I:
th~ above source maps hove been grO~i culture, 5treom~, and minor rock and alluvium outcrops hOve been deleted. Mojor fault. shown on source mo", hovt been revised 11"1 Qccordonee with JenninQl (19731.
2) Information on fault aetivity (Quaternary activity, Historicaetivity) is from Jennings (1973). The seismic activity sYl'!'lbols, os used on this figure, do not
Location of GeoIOQ'" Map
N
Q:] Sedimentary rocks, Cr.toe.OUI in GOt.
~ MQtoloic ttdirnentory roctts; also includes metamorpltic rocks.
[Z] M.sozoic granitic rockSj olso lneludH pre-Cenozoic: ~omorphie, lIolconic, and ultramafic: rock •.
c:J Metamorphic: and. metasedimentary rock., pre -Cr.toc:~a 1ft 09fi.
I • I s.dimentory and volcanic ro<:kl, Paleozoic in ogt.
~ PrtcQmbrion igneous and metamorphic rocksi inelude. crystalline rocks w!'lie'" may be os young 01 Mesozoic.
~/-Dashed where approxi mottl,. loeatld. Contact
_ .. r· Dashed where ot:\ptOximot.ly Iocotid, dotted
Fault where conceal.d, queried where .xist.ne, is unCirtain.
.............. ,.. Barbs on upper plott, dashed where oPCW"QI:i-
TO ...... Fault motety !oeattd, dotted where concealed.
~ Cross-section location. Section. H-H',I-t', J-J', I(-K', L-L', and M-M' ore thown respectively on FiO_ 2-20 through F;;. 2-~.
neeessarily mean that the entire ItnQth of tht foult shows ~idenee of tha ~espectivt' octivity. (SH JenninGS, 1973, for detail.).
3) Individual faults within tna San Al'I(jrtolo fouIt 20nt show evidence of Quaternary and Historic actiVity (See J.nninQS, 1973, for detoils).
4) Heavy border on boxes indieates units thot aQpIOl" on this figtJre.
5} Plan .. ~ of cros.-sec:hon H-tt IS also shown a"I Fig. 2-1.
6) Earthquake rnoQni tude and ~tral Ioeohan are fram Huds(Wuial (J974a).
o~-= __ c=~~======~~ ________ ..;~
Seal. in millS
o ~ 15 20
Scale In kIlometers
GEOLOGIC MAP NORTHERN MOUNTAINS DISTRICT
SOUTHERN CALIFORNIA LAKE HUGHES NO. 1
PLATE C-26
NUREG/CR-0055, Vol. 1 FIG. 2-19
101


;:0 CD -n
z L c: . -
;:0 rTl North CIl
0
~ ., .. ......... Q:
n C ;:0 I 5000-
0
.~ 0
0 CIl "-0 rTl (}1 0 40QO-(}1 r
0 • Qol
CIl :!. Coo
<: ...... .£
0 n " .£
Vl ~ 2000
. ~ .. " .'."
,/ /,
rTl . I-' n ... I qm
-l 0 ....... 1000 W 0
I ,/ - --I "
\ Z ,/
MSL
r r )::> 0 A (f) G) jTj
l> IT! :r: Z r 0 c: G) » r CIl IT! /\:0 :r: r IT!G)
Recent
Pleistocene
rTl r IT! I(") c..n » (f) C(")
z A (") G):::o 0 IT! 0 IO
I .." 1TI(j)
I-' C - (j)(f)
::0 »1 G) !TI ::o(f) I :::0 IT! ITI ~ »(") (f)
""0 ~ -<----i
r 0
Pliocene
Mesozoic
Precambnan (7 )
)::> 0 ZZ -i Z 9 rTl r
Z I n 9 r_ I
N ai '-l
Qal
? .\ t \
'/,,\~ \
'- I ?
.. " II
.::: Lake Hughes Arroy No. I
~ occelerogroph .totion
,/ 1"-
qm
and Berino B- 4
I Qol
,~
/, c· I Tas-ta J-~~ rf~ qm
\./ \ /'
\./ I qm / \ r ,/ ~./ / /"
/"
EXPLANATION
Alluvial gravel, sand, and silt, include s some playa cloy in the San Andreas fault zone (001) 2
Older alluvial granitic sand and gravel (OP)
Anaverde Formation j arkosic sandstone with some shale and conglomerate. Occurs in San Andreas fault zone.( Ts)
Dominantly quartz monzonite ranging in composition to granodiorite (gr)
Complex of gneiss and granitic rocks with average composition of oranodiorite (p£g)
" .. '" a Q:
Notes:
L' South
-5000
-4000 ~ ..
2000
1000
I) See FiQ.2-19 for plan view of QeoloQic cross-section L -L' .
2) Abbreviations in parentheses refer to geoiooic symbols used on FiQ. 2-19.
3) See Fig. 2-30 for 10Q of berinQ 8-4.
0=====-____ ==========2-HOrilontal scale in miles
VerticO! exo;oeration 2X ,"
:! .: " .£
~ • III

:;;0
ro --t, SRN FERNRNDO ERRTHQURKE FEB 9, 1971 0600 PST -
IIJ141 71.152.0 LRKE HUGHES. RRRRY STRTION 1. CRL. COMP N21E ()
~ (!) PERK VRLUES : RCCEL = -145.5 CM/SEc/SEC VELOCITY = 18.0 CM/SEC DISPL 3.4 CM ---I -250 "-£"T1 £"T1 :::D
n :;;0 nn r 3 m ;:;;, fT1 m
'-I -I 0 n:JJ ~ ....... ":::D I 3: ~-I
U1 £"T1 n ....... N I 0
:z ::I: ....... Vl -1250 0
-" ~ -20
0
"" r ;x::. < A n[T1 £"T1 3'
0 ,,0 ::I: Ul n-
fT1 ....... c: n-l G) --< ::I: £"T1 Vl
z 20 0
-4 I-'
Z 0
N (f) I-' --u £"T1
, 0 n :::D
3 n m 3:
\J m r :z ;x::. -I -I £"T1
4 40 50 60 () 0 10 20 30
I N OJ
TI ME - SECONDS

o 01
;;0
ro --n
n ....... --I -rr1 rr1 --I r
-.....J ~ I
U1 N
\J r > --I rr1
n I
N
'"
-250
--I ...... 3: rr1
I :r:
0
SAN FERNANDO EARTHQUAKE FEB 9, 1971 - 0600 PST IIJ141 71.152.0 LRKE HUGHES, RRRAY STATI~N 1. CRL. C~MP S59E
(!) PERK VRLUES: RCCEL = 108.9 CM/SEC/SEC VEUJC ITY = -lli.li CM/SEC D I SPL = -2.9 CM
:n nn 3: n ,fTl (J)' ITI rn n::D ':n ~--l n ........
o Z
~2cn LI ____ ~ ______ ~ ____ ~ ______ ~ ____ _L ______ L_ ____ ~ ____ ~ ______ ~ ____ _L ______ L_ ____ _L ____ _
--I ...JU
~-20 r ~ 0 r·....A~ ! A! ~. ~ A A.AJVi'<'IA '" """'" -~ ~ - ~ ~ -<
nrn 3:' -..... GL (J) n ITI ........ n--l
-<
I ~"I~''I)1f''iiVV'" V' "'i'W V"V v-~ '=7
20L L ____ -L ____ ~ ______ L_ ____ ~ ____ ~ ____ _L ____ ~ ______ L_ ____ ~ ____ ~ ____ _L ____ ~ ____ _
:z: 0
-4 -" CJ (/)
Ul 0"> IJ
'" r rr1 0 n :n
3:n rn 3: rn z
lil
--l
20 30 0 10 liD 50 50 TIME - SECONDS

Al CD -t, SRN FERNRND~ ERRTHQURKE FEB 9. 1971 - 0600 PST
I IJ141 71.152.0 LAKE HUGHES, ARRAY STATI~N 1, CAL. C~MP D~WN ()
(!) PEAK VALUES : ACCEL = -93.0 CM/SEC/SEC ....... VEL~CITY = -11.7 CM/SEC OISPL = -2.9 CM -l -95 ........ rr1 rr1 D Al nr> I zr>
,fT1 ~ -l U)I
I"TI fTI +:> ....... 0 n:o I 3: ':n
U1 rr1 ~-i N I n ......
::r:: 0 ....... z (/)
-l 95 0
.... Al
:< -20 0 0'1 I
::t::> < A nfTI rr1 z' 0 ,0
::r:: r> c I"TI ..... GJ n-i ::r:: -< rr1 (/)
z 20 0
~ -4
0 <: CD (f)
-s \) , ri- nD -0 ...... 0 zr>
I () fTI ::t::> OJ ~ -l fTI rr1 Z
-i ()
I 4 w 0 0 10 20 30 40 50 60
T I ME - SECDNOS

u Q)
Z c
>-f-U 0 ....J W >
SAN FERNANDO EARTHQUAKE FEB 9. 1971 - 0600 PST
200
IIIJ1UI 71.152.0 LAKE HUGHES. RRRAY STATION I. CAL. COMP N21E
DAMPING VALUES ARE O. 2. 5. 10 AND 20 PERCENT Of CRITICAL
I 00 ~I!f-"~'r.
400
200
-&--,.f--"*-I 100
80 F--t->-o:--1bf->'tr:-+- -+-~-¥--Ir'---t 80
60 I--~"--f~~~. ,~~-+--f>.o~ 60
20 20
10 10
E! 8
Ei 6
4 4
'. t. 2
'W-~;-r-+-'V'-t I
.EI Ff-~~~""'h~'Jf--V--~.f-h~~Hh·~Hr'-~:-t~-t><~rl-~ ",,"~"--I7"'---l .8
.6
.4
PERIOD (sees)
RES PO N S ESP E C T R U r1, LA K E HUG H E S NO.1, N 2 1 E
Ref: CIT/EERL 74-82 PLATE C -31
107

u Q)
Z c
>-I-U 0 .-J W >
10
8
6
4
2
SAN FERNANDO EARTHQUAKE FEB 9, 1971 - 0600 PST
IIIJ1~1 71.152.0 LAKE HUGHES. ARRAY STATION 1. CAL. COMP S69E
DAMPING VALUES ARE O. 2. 5. 10 AND 20 PERCENT OF CRITICAL
200
~-,.f--¥--l 100
--+-~¥--V-~ 80
,~+-ryL----I'o-L-l 60
20
10
8
6
4
2
I~~~~~~ ~~~~~~~~~~~~~~~~~~~~~~~~I .8 .8
.6
.4
PERIOD (sees)
RESPONSE SPECTRUM, LAKE HUGHES NO.1, S69E
Ref: CIT/EERL 74-82 PLATE C-32
108

u Q)
--( c
>-I-U 0 .-l W >
200
SAN FERNANOO EARTHQUAKE FEB 9. 1971 - 0600 PST
IIIJ1~1 71.152.0 LA~E HUGHES. ARRAY STATI~N 1. CAL. COMP DOWN
DAMPING VALUES ARE O. 2. 5. 10 AND 20 PERCENT ~F CRITICAL
200
1 00 f---->.wf-'~...,.
80 F-'-.......,.,~~~-
~-,.f-->x<--l 100
-+-4-¥--¥---j 80
60 f---+<-->~....-~~. ,~7"'--+-~L.-j 6 0
20 20
10 10
8 8
6 6
4 4
2 2
'-+-~L,.L--,lL-~ 1 1 1--->~~fI:--Jl--I
.8~~~~~~~~~~~~~~~~~~~~~~~~cTr L.-J"'<-'~ . 8
.6
.4
PERIOD (sees)
RESPONSE SPECTRUM, LAKE HUGHES NO.1, Vertical
Ref: CITjEERL 74-82 PLATE C-33
109


35·00'
45'
Qf
..... ... ....
I~'
... ...
•.. ...
45' ,>, , .. , Of
... c··-o ~-.--.p. ..
0 J 4
\I £ Oaf
0 P
I. , " It
Y
s Oaf
• Lancaster
001
..
EXPLANATION
* ~'7.7 7-~2
o
•
Alluvium, HoIOCeM in 000. iM:ludn ctuN dtpQIit •.
StrtOm channel, fon, and ba.m depo.its, HoI~ift ....
Morin, deposits, mari,. and nonmariM t«rOOt dlpoItt., Quottrnal') in GOt; ir'ICludH upper Pfioeen, marine deposit •.
Nonmarine HdimtntOf'1 cttPOIi .. , Ptio-PteiltoceM in 0fI.
VolCanic rocks and iO_ous intrusi'll rDCkl, Tertiary in 0Qt.
AceelerOQrQl:lh Station to'c:otion
Epictnf.r location, Richter magnitdde. and dot, of occurrence.
FOUIh: tbot have moved ciur'in~ Ouoten\ary t .. witncl.lt historic record (apptClt. post 2 million yeo,.) .
FOults that ha .... moved during hi,toric time (approx.. 200 ,.ar. ) .
NOTES: I) GeoloQy IS simplified from Smith (1964), JenninQ't Burnett. and Troxel (19s2). JeMin;s CI'Id Strand (1969), Jonn;ng.(1962). Rogon(1961), and Rogers (1965). To simplify, QIOIogtc mop ~its on the abotte ICUtce maos hewe bten 9fCUPed; culture, .treOlM. and m.nor roct and alluvium outcrops hOve been deloted. Major foutts shown on source mcJ;le have been reviled in accordance with ....... (1975).
2) Information en foult octivity (Qua'ernory octivit.y, historic activity) i. from ~nni. {J975,. ".. Mtsmic aetivi ty ''1n1M1., 01 UMd on thO fi;unt, do ftIOt
Location 0/ Geologic Map
CROSS-SECTIO>I a FIG. NO.
Santa Felieta Dam F-F' !H4
Old Ridge Ro>ito G·G' ~.~
...--........../Contoet
~ •• 1·. Fault
SecSIMent.ary rocke, Cr.toc:.toJl, in GOt.
MelOzoic ttdimentary rocQ,.ollo inch .. l'Retomorpl\ic rock •.
Mesozoic granitic rOCk.; au .nclud. ",. .. -Cenozoic mttGmorptlic, .,otcaniC, end ultramafl~ rocks
Metcmorphic and ..... tosedi,..,.tory rOCk., pre-Crttaceous in 001.
gedilllentor'1 a,~ wotconie racks, Polecaic
" .... ~brian jqneous and lIIItamorphtc !'tICks; includes tr:,s,alline tQC.ks wtMc:~ lID)' De aa )'OdnQ as Mesozoic.
00 ..... Vfhere approxitRcltely toc:at.C, .... ...... CClnctcUf'd, queritd wtIt ... ex .. ..".. i • ...,toin .
Barbs on ~·ptote,.dosIWd ...... awoaimoleW ~ted, donN where concealed.
Location oppraxilnHe.
I'ICCtUGrily IRtOn that ". enti,. ...,., of tht fault _ .. _ of ""_; .. action,. (900
~ ,I97S, for 4Itoils) .
3) tndividual f'o.Jlt. _thin. tt. 9cwt ....... fault .zIIN sholl' .,.... tsf QuQ'terRor,. _ htdaric octlrit.s, (Set Jlnniftg., 197'!5,. '. *toILt).
4) Heavy border ..... indical.a .... lIMIt· ..... an thiI figure.
5l Ea,,..,.. ...... itudft.and ~I I8ot..,... ... frcn Hl.:deon,"'al.tf8S9-m7&lJ .. :tI)._ Hi~1 of 01. (1913),
o 10 15
Scale In kilOfMter.
SoblPlOrnw contour Inter.ol 1500 fWf
N
Lake Hu;"- Arrey StattOn 12- >rH'
laM Hu9hH Array 9tatlQtl4 I-I'
5·16
5-17 GEOLOGlC MAP
LAKE HUGHES REGION CALIFORNIA
Ref
LAKE HUGHES NO.4 PLATE C-34
NUREGjCR-0055 Vol. 2 FIG. 5-13
I
1
111


I
:; {l. 2 ":; i g 0
4OlXJ' .::
2OfX)' - . - . - P~ • ..
Sea Lw~!
5 r en l> w ;:a " ro » rn -t,
Z :I: r- (j) ::D rr1 C
Z 7' r G) C -0 rr1 rr1 :I: ;:a r rr1 rr1 ):::> :r: en en (i) -I C - rr1 (i) (')
l> () :r: 0 ;0 () rr1 C ::u I I Vl Z ::u
0 w -i l> 0 Ul z :< -< Ul 0 Ul
(') en .j::> l> -i
< r l> 0 -i
." 0 0 :::0 2:
N Z - ~ 1>
G) IT1 0 r 0 G)
(')
(') ::u 0 CJ) CJ)
I CJ)
IT1 (') -i 0 Z
H I
H
I' lake Huohes Array No.4
Accelerooraph Station ~ o
N -~ ~ ." c <
qm c
~ ,,, I
, I " ' " I ". ,. ',' qii, ,- QoI , qm' , I.. 'qm , " l' 1·, I ",.' , , , , ' . \ . . " 'f4000
gn.\".' t, ,', ,-Iii,', 2000 ., ' • 1 ~ ) ... 1 ' 1 ' .. l '. \', \ ., '\" .' \, ,. \. \ ,I"" ........
1-) .. 11,1, l,i.t,\",\ \/\'\. •. ' 't_.-\ ,_ .'~ ,,' Sea
I( (\..~( ... <.0 c: 0 G> ._ ()-20 ~E
o .. _c:
EXPLANATION
~ Alluvium; gravel, sand, and silt{Qal)
Vasquez Formation; non-marine sandstone, siltstone, and shale (Ts)
~ g IEPl Marine sandstone and shale (Ts) .... L::...J go WCl.
1f ~ Quartz monzonite; ranges in compoSition to oranodiorite(gr)
;; f"Qnl Gneiss and granitic rocks with an average composition of I ~ granodiorite (p€g)
('-. I
.gl Il ~ Pol""" Soh;" ("'OJ
Modified from Dibble. ( 1961 )
Nates:
I) Abbreviations in parentheses refer to geologic symbols used on Fig. 5-13.
21 For plan view of crass-section see Fig. 5-13.
Scale In mileos

-" -" ~
CJ ........ -250 -l -....... ["Tl
["Tl
:;;0 r
-...J 0 """ltMI i -"'" -l I ........
U"1 3: N ["Tl
I
:c
SRN FERNRNOO ERRTHQURKE FEB 9. 1971 - 0600 PST IIJ142 71.065.0 LRKE HUGHES. RRRRY STRTION 4. CRL. COMP S69E
(!) PERK VRLUES: RCCEL = 168.2 CM/SEc/SEC VELOCITY = 5.3 CM/SEC OISPL = 1.2 CM
:0 n nn
:Xrn 'r ffirn n:::D ':0 lJ')-t !TI_ na
Z
~250L----------L----------~---------L----------~---------L----------~--------~--------~ -l o -6 :;;0
-<
r ::t::-7' ["Tl 0 :c c G)
:c ["Tl
Vl 6
z 0 -2
-"'" u
Vl 0'1 1.0 ["Tl 0
-0 r ::t::-
2 -t ["Tl
CJ I
W 0'1
< nrn :X' ,a lJ') n !TI ...... n-t ~
0 5 10 15 20 25 30 35 40 TIME - SECONDS

lJ'1
;;0 CD -t,
CJ >-i
-I -250 ........ rn rn ;;0 r
-....,J
+:> 0 I -I
U1 >-i
N3: rn I
:r:
~250 -I 0-10 ;;0
-<
r >-A
0 fT1
:r: c
J ~ :r: rn V'l
::z: 0 -2
+:>
V'l N
SRN FERNRNDO ERRTHQURKE FEB 9, 1971 - 0600 PST IIJ142 71.065.0 LRKE HUGHES, RRRRY STRTION 4. CRL. COMP S21W
C) PERK VRLUES: RCCEL = -143.5 CM/SEc/SEC VELOCITY = -8.6 CM/SEC D I SPL = 1.7 CM
:D nn 3;n '- rn Ull rnrn nJJ '- :n ~ -I no
Z
o (J) -u I ......
~ 0 ~~ __ ~~ __ ~~ ____ ~~ __ ~ ____ ~ __ -.~~ __ ~ ____ ~~ ____ ~ __ ~ ____ ~~ __ ~~ __ ~ __ n D " :3:n
-u r >-
21 -I rn
CJ 0 5 10 I
W -....,J
15 20 25 TIME - SECONDS
30 35
rn ~ rn z -I
40

;0 ro -I>
SRN FERNRNDO ERRTHQURKE FEB 9, 1971 - 0600 PST CJ IIJ142 71.065.0 LRKE HUGHES. RRRRY STRTI~N 4. CRL. C~MP O~WN .......
(!) PERK VRLUES : RCCEL = 150.8 CM/SEc/SEC VEL~C I T Y = -6.8 CM/SEC OISPL = 1.6 CM -l -rr1 -250
rr1 :D ;0
nn , :r;n ,CTI
-....,J (J)I -+:> fTI CTI
0 n:D I -l ':D U1 ....... (J)-t
N 3: fTI ...... rr1 no I Z :c .......
~250 0 ;0 -8 .... -< ....
Q) , < )::> nCTI
A 3:' rr1 ,0
0 (J) ('") fTI ...... :c n-t c
-< GJ :c rr1 (j')
:z: 8 0
-2 -+:>
0
<: (J) .."
ro I ., n:D c-+ 0 3:('")
CTI ..... ~ () rn
'"OAl Z , ....... -t )::>
-l rr1 2 CJ 0 5 10 15 20 25 30 35 40 I T I t1E - SEC~NDS w
co

u Q)
~ c
>-r-U 0 ...J W >
SAN FERNANDO EARTHQUAKE FEB 9. 1971 - 0600 PST II IJlij2 71.065.0 L.AKE HUGHES. ARRAY STATIGN ij. CAL. CGMP S69E
DAMPING VALUES ARE O. 2. 5. 10 AND 20 PERCENT GF CRITICAL
200 200
I 00 ~,.f-->~"'"
EIO 1=-'--+--"~!o.L-'>4r-+-
~~--*-~"-l 100
-+~~~-+L--l 80
,-A.d-~L-4>..."L----l 6 0
2:0
10
8
6
4
2
I f--''vI'ft'k-w-.llII'¥-+
.. 8 f+--f-f<--Il
PERIOD (sees)
RESPONSE SPECTRUM, LAKE HUGHES NO.4, S69E
20
10
8
6
4
2
.L-.f.,L---1 .8
.6
.4
Ref: CITjEERL 74-82 PLATE C-39
117

u <l>
~ c
>-I-U 0 ....J W >
10
8
6
4
2
SAN FERNANDO EARTHQUAKE FEB 9, 1971 - 0600 PST
IIIJJl.I2 71.065.0 LAKE tiUGHES. RRRAY STATIflN 1,1. CAL. CflMP S21W
DRMPING VRLUES RRE D. 2. 5. 10 AND 20 PERCENT Of CRITICRL
200
~-*-¥-IIOO
-I-#-¥--J,L..-I 80
,~~+-~C--I 60
20
10
8
6
4
2
I 1---"~1r-4~F'-+ -I-~-+-...,jL-~ I
.8 r:;..L..!p...-I.g:.>{-+""'P~-!,.L---"l'{-~4~Hh~~~~4~~~rl-; ,--+.,<---1 .8
.6
PERIOD (secs)
RESPONSE SPECTRUM, LAKE HUGHES NO.4, S21W
Ref: CIT/EERL 74-82 PLATE C-40
118

(..l Q)
~ C
>-I-U 0 -1 W >
SAN FERNAND~ ERRTHQUAKE FEB 9, 1971 - 0600 PST IIIJlij2 71.065.0 L.AKE HUGHES. ARRAY STATION ij. CAL. COMP DOWN
DAMP I NG VALUES FIRE O. 2. 5. 1 0 AND 20 PERCENT OF CR IT I CAL
200 200
I()O~~~;"'" ~-,f--"><"-4 100
-+-~¥---\.L---I 80 130 F-'--+-"..--IIl'-'>q<,-+-
20
10
8
6
4
2
PERIOD (sees)
,~+--r-~L-1 60
20
10
8
6
4
2
'+-:""--+-~'-<A I
L..-t,£----l .8
.6
.4
RESPONSE SPECTRUM, LAKE HUGES NO. 4, Vertic~l
Ref: CIT/EERL 74-82 PLATE C-41
119

1. Report No. I 2. Government Accession No. 3. Recipient's Catalog No.
NASA CR-170415
4. Title and Subtitle 5. Report Date
Investigation of Seismicity and Related Effects November 1985 at NASA Ames-Dryden Flight Research Facility, 6. Performing Organization Code Computer Center, Edwards, California
7. Author(s) 8. Performing Organization Report No. Robert D. Cousineau, Richard Crook, Jr. , and L-1615-F David J. Leeds
10. Work Unit No.
9. Performing Organization Name and Address Soils International San Gabriel, California 11. Contract or Grant No.
NCA2-0R283-304
13. Type of Report and Period Covered
12. Sponsoring Agency Name and Address Contractor Report - Final
National Aeronautics and Space Administration 14. Sponsoring Agency Code Washington, D.C. 20546
15. Supplementary Notes
NASA Technical Monitor: Karl F. Anderson, NASA Ames Research Center, Dryden Flight Research Facility, Edwards, California 93523-5000
16. Abstract
This report discusses a geological and seismological investigation of the NASA Ames-Dryden Flight Research Facility site at Edwards, California. Results are presented as seismic design criteria, with design values of the per-tinent ground motion parameters, probability of recurrence, and recommended analogous time-history accelerograms with their corresponding spectra. The recommendations apply spe-cifically to the Dryden site and should not be extrapolated to other sites with varying foundation and geologic con-ditions or different seismic environments.
17. Key Words (Suggested by Author(s)) 18. Distribution Statement
Earth-motion modeling Unclassified - Unlimited Earthquake Seismicity Wave propagation in soil
STAR category 42
19. Security Classif. (of this report) 20. Security Classif. (of t~is page) 21. No. of Pages 22. Price'
Unclassified Unclassified 130 A07
*For sale by the National Technical Information Service, Springfield, Virginia 22161.

End of: Document