of the neutrino telescope - brookhaven national...
TRANSCRIPT

1
of the
neutrino telescope
S. Loucatos, IRFU, CEA-Saclay
France
BNL,
11 June
09
Status
and first results

2
Outline
•
Neutrino astronomy–
The potential sources•
The ANTARES detector–
Construction milestones•
Detector operation–
The data taking campaign•
The first physics analyses–
Atmospheric muons–
Atmospheric neutrinos–
Search for cosmic neutrino sources
–
Indirect dark matter detection•
R&D•
The future

3
Neutrino Astronomy

4
Neutrino astronomy
p
νγ
Galaxy
Local galaxy
group
↓νμ
μ
p/A + p/γ → π±
+ π0
+
...↓γ γ
↓νμ νe e
•
γ: interact with CMB and matter•
Protons: deflection by magnetic fields•
ν: weakly interacting–
huge target needed (100Mton -
Gton)
< 2 109
l.y. at
1 TeV< 30 106
l.y. at 100 TeV →
local cluster< 30 000 l.y. at 1 PeV → Galaxyγ

5
5
Pulsars
Restes de Supernova
e
Noyaux actifs de galaxie
Microquasars
Sursauts gamma
Galactique Extra-galactique

6
6
H.E.S.S.
Pulsars
Restes de Supernova
e
Noyaux actifs de galaxie
Microquasars
Sursauts gamma
Galactique Extra-galactique

7
7
FERMI-LAT
Pulsars
Restes de Supernova
e
Noyaux actifs de galaxie
Microquasars
Sursauts gamma
Galactique Extra-galactique

8
Potential sources
GALACTIC
Supernova remnants
Pulsars
Microquasars
EXTRAGALACTIC
GRBs
AGNs
Indirect dark matter signal

9
9
Atmospheric
µ’s107 /year
Atmosphericν’s
3000 / year Cosmic
ray
Number
of events
expected
in full detector in one year

10
High energy
selection
10
Log(E)
Log(
dN/d
E)
E-3.7
E-2ν
atm
cut
E3
x dn/dEatm

11
Detection principle
μ
43°
interaction
Sea floor
Cherenkov light from μ
3D PMT
array
νμ
Main detection channel: charged νμ
interaction giving an ultrarelativistic
μ
Energy threshold: 10 GeV
ANTARES 12 lines MC

12
The ANTARES detector

13
The collaboration
13
•
Since
1996•
7 countries
•
22 laboratories•
~150 engineers
and
scientists
•
Since
1996•
7 countries
•
22 laboratories•
~150 engineers
and
scientists

14
The ANTARES site
•
42°50’ latitude North•
6°10’ longitude East
•
Galactic Center–
visible 75% of the day
Galactic coordinates

15
Toulon
La Seyne
Submarine cable (~40km)
Shore Station
The ANTARES site

16
The ANTARES detector
~60 m
100 m
350 m
14.5 m
Link cable
JunctionBox
Cable toshore
2500m depth

17
Storey
45°

18
Hydrophone
17’’ glass sphere10’’ PMT
A detector storey
DAQ
Slow
Control
Titanium frame
LED Beacon
~10 cm resolution
~0.6 ns resolution

19
2005 –
2008: detector deployment
The detector is fully operational since the 30th
May 2008

20
2006 –
2008: deployments of the detector lines
•
Line 1: 03 / 2006
•
Line 2, 3, 4, 5: 01 / 2007
•
Line 6, 7, 8, 9, 10: 12 / 2007
•
Line 11, 12: 05 / 2008
~60 m

21
Detector layout
Acoustic storey
… and several instruments for environment studies with the ANTARES infrastructure

22
Detector operation

23
Signals and backgrounds•
Muon (Cherenkov)–
2 µs crossing
time
•
40K decay–
Continuous
background ∼
30 kHz *
•
Bioluminescence–
Continuous
background ∼
30 kHz *–
Occasional
bursts
~MHz
Simulation
2 min
* 10’’
PMT, 0.3 p.e. threshold
792 days

24
The on-shore filter
•
All data to shore, no off-shore hardware trigger
•
Front end chip digitizes charge and time of a light signal
•
All data transmitted through multiplexed Gigabit links–
the whole data flow can not be written to disk
•
Computer farm running a software trigger:–
look in all directions for light signalscompatible with
a muon track–
when found, write a Physics Event
•
Other triggers exist: cluster of storeys, GRBs, Galactic Center, …
μ

25
Track reconstruction
Θ=35o

26
Number of triggers
10 or more lines (2008)5 lines (2007)
Data taking ongoing……accumulating neutrinos

27
Atmospheric muons and neutrino-induced muons
Example of a reconstructed down-going muon, detected in
all 12 detector lines
Example of a reconstructed up-going muon
(i.e. a neutrino candidate) detected in 5/12
detector lines

28
28
z (m)
r (m)
z (m)
t (ns)

29
Time-Height
representationIntersection cone
-
plane = hyperbola
Form
depends
on zenith
angle and point of closest
approach between
line and track
Down-goingUp-going

30
e.m. showers from HE µ’s
30

31
Multi-muons
31

32
Expected performances
•
Instrumented volume : 20 Mton
(1/50 km3
)•
Muon
effective area ≈ 20000 m2
(E > 1 TeV)
32
ν
μ
truerec μμ −νμ −
rec
Measured :• Δt < 1 ns• Δr ~ 10 cm… as expected

33
The first physics analyses

34
atmospheric
μ
atmospheric
ν
Atmosphere
Sea
Earth
cosmic
ν

35
Muon
flux at the detector
Atmosphere
Earth
Sea
107
atmospheric μ per year*103
atmospheric ν
per year*
cosmic
ν
Line 1: 03 / 2006
Line 2, 3, 4, 5: 01 / 2007
Line 6, 7, 8, 9, 10: 12 / 2007
Line 11, 12: 05 / 2008
Performance paper submitted
First physics analyses completed
Ongoing analysis
Data taking
* Reconstructed tracks in 12 line detector

36
µ flux study
36
data
CORSIKA QGSJET +NSU
CORSIKA QGSJET+Horandel
MUPAGE
•
Systematic uncertainty ±
30%•
Main contributions–
optical module response–
absorption length of the light in water
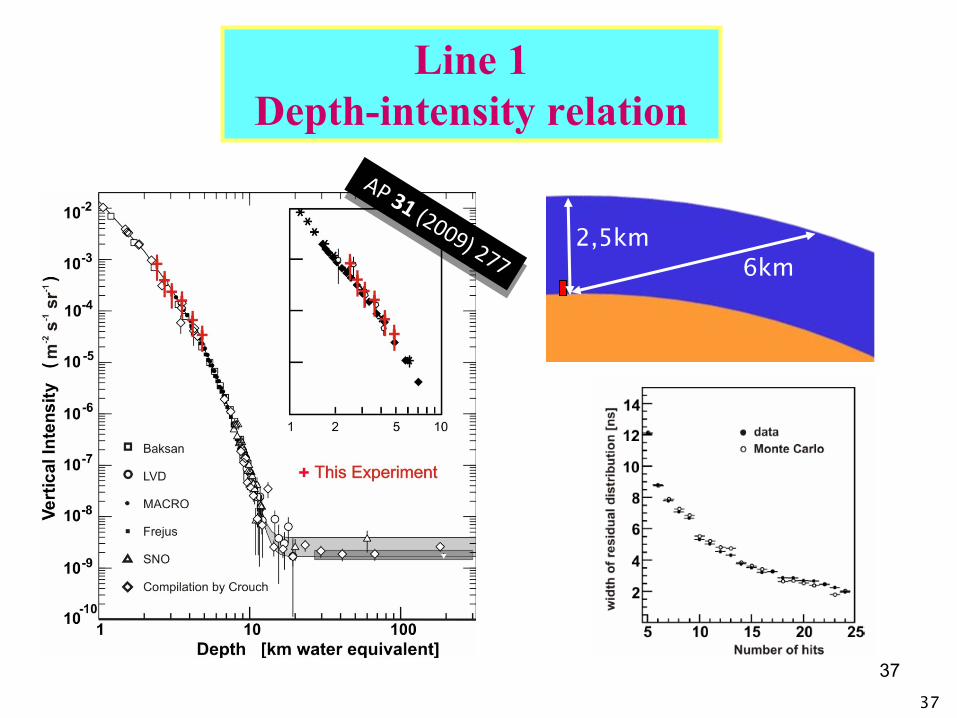
37
Line 1 Depth-intensity relation
37
2,5km6km
AP 31 (2009) 277
AP 31 (2009) 277

38
Simple depth-intensity relation
•
No reconstruction
•
Coïncidences between
consecutive
storeys
38
Preliminary
Preliminary
Preliminary
Preliminary

39
Attenuation (absorption ⊗
diffusion)
39
~70 m
~150 m

40
40
Atmospheric ν’s
Depth : 2400 m
E > 1 TeV
Depth : 2400 m
E > 1 TeV
θz

41
41
A neutrino event on 12 lines

42
42
Zenith < 90 deg+ track quality cut
Atmospheric neutrinos with 5 lines detector
Feb -
Dec 2007140 active days
Data: 168MC: 161±32(theor)±20(syst)
θ
elevation

43
Selection of neutrino events
Upgoing
events dominated by the tail of badly reconstructed atmospheric muons
Upgoing Downgoing
Λ: maximum likelihood of the track fit
MC

44
2 independent analyses
•
Observed
: 168•
MC : 164–
±3 (stat)–
± 33(théor)–
±16 (syst)
•
Observed
: 185 •
MC : 218–
± 4 (stat) –
±41(théor)–
+3
-42
(syst)
44

45
•
Definition of a potential source list
•
Analysis optimization by MC, for E-2 flux2 methods: -
unbinned
EM [1] (main result)BIC[2]
-
binned, MRF [3] (as a check)
•
No discovery 90% CL flux limit
1.
Dempster
et al, Maximul
Likelihood for incomplete data via the EM algorithm, J.R.Stat
Soc Series B,38 (1977) 1.
Aguilar, Hernandez-Rey,
The EM algorithm applied to the search of point sources, Astrop. Phys. 29 2 (2008), 117
2.
Haughton, On the choice of a model to fit from an exponential family, Ann Stat 16 (1988), 342
3.
Hill, Rawlins, Astrop
Phys 19 3 (2003)
First search for point-like ν
sources

46
Unbinned: EM algorithm
EM: a general approach to maximum likelihood estimation for finite mixture models.Mixture models: different groups of data are described by different density components.
g = number of mixture models
πi
= mixture proportions, where ∑=
=g
jj
11π
),( }{ raiii δα=xx ),,( }{ ra
iiiiy zy δα=
The vector zi
is a class indicator that indicates if the event i belongs to the background or the source.
First step: change from incomplete to complete data set.
Expectation step–Start with a set of initial parameters Ψ(m)
= {π1
,π2
,µ,Σ}–Expectation of the complete data log-likelihood, conditional on the observed data {x}
)]};({|))};({[log(E),(Q )()( mm pg ΨxΨyΨΨ =
Maximization step
–Find Ψ
= Ψ(m
+ 1) that maximizes Q(Ψ, Ψ(m))

47
Signal & background
A simple pre-clustering selects a set of candidates by using a cone of 1.25º around each event of the sample.
Background Signal
Background like Signal like
)log(),ˆ|(log2BIC nvMDp kkkk −Ψ=
position of event: position of event: x = (x = (ααRARA
, , δδ))
),;()()( Σμxx SSBGBG PPp πδπ +=
signal : signal : ααRARA
, , δδbgbg: only : only δδ
The Bayesian Information Criterion (BIC) is chosen as the test statistic of the method.
Signal
model 2D-Gaussian
Backgroundfrom real RA-
scrambled dataSample
104
samples
Samples simulation:104 samples simulated.Each sample corresponds to the lifetime of 2007 data period.

48
Optimum radius (deg)
declination (deg)
Binned: Cone methodCone size optimization
MRF =
δ = ‐15°rbest
~ 2.5°
δ = ‐30°rbest
~ 3°
MRF
cone radius (deg)
)n()!(n)(n),n(nμ)(nμ bobs
nb
nbobsb
obs
obs
−= ∑∞
exp9090
Upper
limit Poisson weight
Model Rejection Factor used for
fixed-source
search
Optimum radius (deg)
declination (deg)
Model Discovery Factor used for all-sky
search
MDF
cone radius (deg)

49
Point source search
(2007)
•
Blind analysis–
Strict cuts–
Study
on scrambled
data–
Final result
on real data•
94 candidate events•
Research
applied
to 25 sources
49
Distribution of time residualsαRAδ

50
Flux limits
50
Distribution of time residuals
Spectre en E-2

51
Potential sources
Supernova remnants
Pulsars
Microquasars
GRBs
AGNs
Indirect dark matter signal
The Bullet ClusterSmoking gun proof of DM
Relic WIMPs
captured in celestial bodiesχχ
self-annihilations
into c,b,t
quarks, τ
leptons or W,Z,H bosons(prompt)
→
significant high-energy ν
fluxPotential χχ→ν
sources :
Sun, Earth, Galactic Centre

52
Minimal Supergravity:5 free parameters. mSUGRA
is a GUT including gravity, parameters defined at the GUT scale (1016
eV). All couplings converge at this scale, free parameters:
-
common masses for scalars (m0
) and gauginos
(m1/2
)-
common trilinear
coupling constant A0-
ratio of vev’s
of the 2 Higgs fields tan(β) = Vtop /Vbottom .
-
Higgsino
mixing parameter μ is fixed except for its sign (5th parameter).
From these parameters at the GUT scale, masses and couplings at the EW scale can be calculated using renormalization group equations (RGE), with ISASUGRA or SuSpect
[2].. Depending on the parameters chosen, the LSP, stable from R-parity conservation, (-1 for superpartners
and 1 for standard particles), could be the lightest of four neutralinos
mSUGRA

53
Random walk scan within mSUGRA
parameter space :
0 < m1/2
< 2000 GeV
0 < m0
< 8000 GeV
0 < tanβ
< 60
-3 m0
< A0
< 3 m0
Calculated with DarkSUSY
and ISASUGRA (RGE code) with mtop
= 172.5 GeV
Includes ν
oscillation effects
inside and outside the Sun
Neutralino
annihilations in the Sun in mSUGRA
Integrated
neutrino flux for Eν
> 10 GeV
Study
of neutralino
Dark
Matter
sensitivity
within
SUSY mSUGRA
framework

54
ANTARES Low-Energy Effective AreaAssume 60 kHz of optical background mean rate
Low-energy performance
Trigger : Events with
hits on at
least 5 storeys
in whole
detector
Detection
: Selected
after
3D reconstruction with
quality
cuts
55
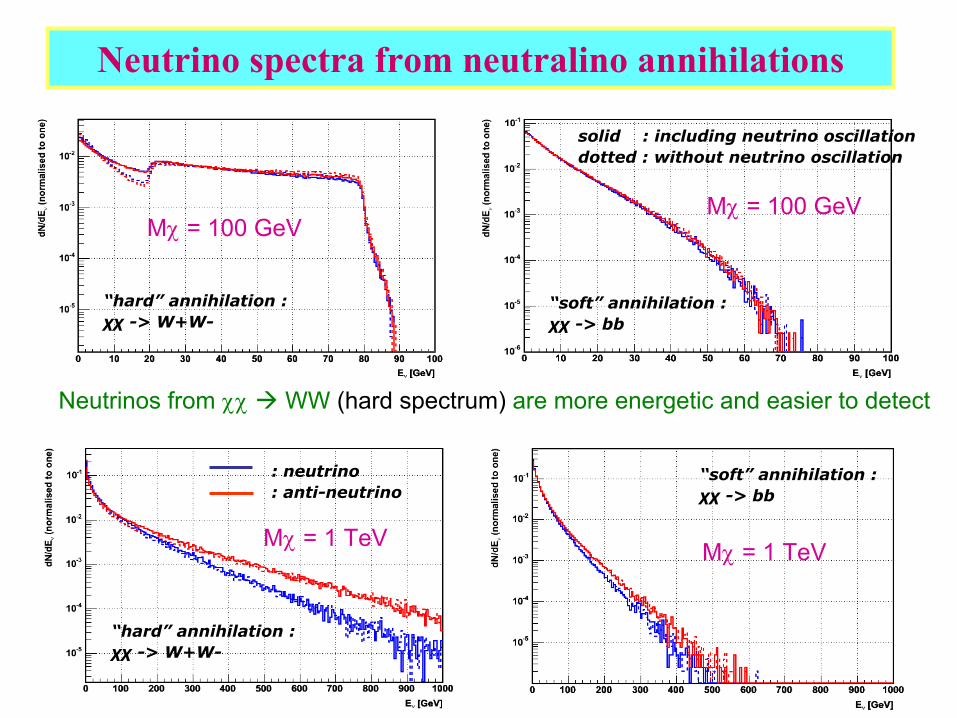
Neutrino spectra
from
neutralino
annihilations
“hard” annihilation : χχ
-> W+W-
Mχ
= 100 GeV
“soft” annihilation : χχ
-> bb
solid : including neutrino oscillationdotted : without neutrino oscillation
Mχ
= 100 GeV
“soft” annihilation : χχ
-> bb
Mχ
= 1 TeV
“hard” annihilation : χχ
-> W+W-
: neutrino: anti-neutrino
Mχ
= 1 TeV
Neutrinos from
χχ WW (hard spectrum) are more energetic and easier to detect

56
Sensitivity calculated for
3 years of data
taking
Background from atmospheric neutrinos and misreconstructed
atmospheric muons
within 3° radius search cone around the Sun
Detection
rate with
ANTARES
and KM3NeT
detectors
Neutralino
annihilations in the Sun in mSUGRA
KM3NeT detector

57
mSugra
Parameter SpaceFocus Point Region
Neutralino
annihilations in the Sun in mSUGRA
High tanβ
regime
Medium tanβ
regime

58Excludable in 3 years at 90% CL:
all
some
none (A0
varied between -3m0
and +3m0
and tan(β) within indicated slice)
Exclusion capabilities of ANTARES for the mSUGRA
parameter space

59Excludable in 3 years at 90% CL:
all
some
none (A0
varied between -3m0
and +3m0
and tan(β) within indicated slice)
Exclusion capabilities of km3 for the mSUGRA parameter space

60
Used for comparison to other neutrino experiments
Site dependent quantity
(ν
propagation through Earth, target density at detector…)
Derived from neutrino flux through ν μ conversion rate extracted from DarkSUSY for different mχ
Muon flux from
neutralino
annihilations in the Sun
Muon flux from
the Sun in mSUGRA

61
Comparison to direct detection experiments sensitive to spin independent WIMP-nucleon cross section
Spin dependent scattering limits (direct search) not yet low enough to put constraints on mSUGRA
Dark Matter
CDMS: arXiv:0802.3530
XENON: arXiv:0706.0039
Comparison
to Direct Detection
sensitivity

62
Search
for neutrino events
coming
from
the Sun
Expected
sensitivity
and background in a cone
around
the Sun
for the ANTARES 5-line upgoing
neutrino sample
Good agreement for background estimation from
MC and full sky
data set
Size of search
cone
optimized
on MC as a function
of Mχ
and hard/soft spectrum

63
First ANTARES limit
on ν/µ
flux from
the Sun
Promising
limit
based
on
data with
~ ½ of ANTARES detector in 6 months
Limit
with
b-quark (soft) or W-boson (hard) annihilation channel

64
Other sciences
–
Sismology–
Acoustic
detection
at
VHE–
Oceanography
–
Climatology
64
IL 07
ADCPCamera
OM
hydrophones CT
ADCPCamera
OM
hydrophones
hydrophones C-Star
O2
C-StarCTSV
hydrophone
SeismometerRxTx
14.5m
80m
14.5m
14.5m
80m
98m

65
65
2007‐12‐10 floor5

66
Acoustic detection R&D
66

67

68

69

70

71
Acoustic signal and “noise”

72
Acoustic detection R&D
Detection of cetaceans

73
Towards
a km3detector in the Méditerranean
Antares (1/50 km3)Toulon, France -2500m @ 40 km
NestorPylos, Grèce
-3000m @ 13 km
-4550m @ 26 km-5200m @ 48 km
NemoCapo Passero, Italie
-3500m @ 100 km

74
Since
1990R&D
NestorPylos, Grèce
-3000m @ 13 km
-4550m @ 26 km-5200m @ 48 km
Antares (1/50 km3)Toulon, France
-2500m @ 40 km
Since
1996Neutrinos Since
2000R&DNemo
Capo Passero, Italy-3500m @ 100 km

75
KM3NeT consortium
•
Cyprus: Univ. Cyprus, Nikosia
•
France–
CEA Saclay–
CNRS/IN2P3 •
APC, CPPM, IPHC–
GRPHE/Univ. Mulhouse–
Ifremer
•
Germany–
Univ. Erlangen–
MPIK-Heidelberg–
Univ. Kiel–
Univ. Tuebingen
•
Greece–
HCMR–
Hellenic
Open Univ.–
NCSR Democritos–
NOA/Nestor–
Univ. Athens
•
Ireland : –
Institute for advanced
studies, Dublin
•
Italy–
CNR/ISMAR–
INFN (Univ. Bari, Bologna, Catania, Genova, Pisa, Roma-1, LNS Catania, Frascati)
–
INGV–
Tecnomare
SpA
•
The Netherlands–
NIKHEF/FOM–
Univ. Amsterdam–
Univ. Utrecht–
KVI / Univ. Groningen–
NIOZ
•
Romania : ISS Bucharest
•
Spain–
IFIC/CSIC Valencia–
Univ. Valencia–
UP Valencia
•
UK–
Univ. Aberdeen–
Univ. Leeds–
Univ. Liverpool–
Univ. Sheffield
• 10 countries, ~ 40 laboratories, ~ 200 scientists
Pas dans Antares

76
76
KM3NeT (artist’s
view)
~ 100-200 “lines”Height
: ~ 500 mDistance ~ 150 m~ 20 stories at
25 m~ 5000-10000 PM
∼
200 m Environmental
sciences network
Instrumented
volume
~ 1 km3
(or more)

77
77
Timeline towards construction
Note: “Construction” includes the final prototyping stage
Feb 2
006
Mar 20
08Oct
2009
Mar 20
11
Construction phase
Data taking
CDR TDRFinal
prototyping
Design Study
Preparatory phase

78
Summary
•
ANTARES today–
Successful end of construction phase•
Technology proven•
Data taking ongoing
–
First physics outputs•
Atmospheric μ
and ν, cosmic neutrino sources, dark matter•
Neutrino oscillations, magnetic monopoles, VHE neutrino interactions, …
•
On the road for the next step–
KM3Net…

79
Present and future
KM3
Data 2007+2008
313 days1111 ν313 days1111 ν

80
Vue de la salle de contrôle d’ANTARESA view from ANTARES control room