of the target 2021 program of implementation · based on having high numbers of answers changed...
TRANSCRIPT
EvaluationoftheTarget2021ProgramAfterThreeSemestersofImplementation
By Tim R. Sass, Ph.D.
November 15, 2017

1
ExecutiveSummary
In an effort to improve outcomes for students potentially impacted by test manipulation on the
2009 CRCT exams, the Atlanta Public Schools created the “Target 2021” initiative. The program’s goals
included improving four outcomes: attendance, course failure, reading achievement, and graduation.
Among students enrolled in APS in 2014/15, students were initially identified as eligible for the program
based on having high numbers of answers changed from wrong to right on their 2009 CRCT exams. In fall
2015, families of eligible students were invited to participate, and over 99 percent agreed to do so. A total
of 3,075 were on the initial list to be offered services and were still enrolled in APS on the first day of the
spring 2016 semester. By January 2016 individual support plans were created for each participating
student and services began to be provided soon thereafter. These services included academic monitoring,
individual counseling, attendance incentives, ACT/SAT prep, tutoring, behavioral interventions,
college/career fairs and parent workshops. The available information is not sufficient to determine
exactly why students received different services, the precise nature of services each student received and
how the intensity of those services differed across students. Therefore, the analysis is based on the
average effect of the program over all participants during the first three semesters of implementation
from spring 2016 to spring 2017.
To analyze the impact of the Target 2021 program, outcomes for Target 2021 participants who
were enrolled in both fall and spring of the 2015/16 and 2016/17 school years were compared to the
outcomes for students who had been in classrooms flagged for high levels of wrong‐to‐right erasures in
spring 2009, but which individually had few erasures and were thus not offered Target 2021 services. The
analysis utilized two different statistical techniques, a “difference‐in‐differences” approach, which
compares the change over time in outcomes for Target 2021 students with the change over time in
outcomes for the comparison group, and a “regression discontinuity” approach which compares
outcomes for Target 2021 students who had just enough wrong‐to‐right erasures on their 2009 exam to
be designated as having their test scores manipulated (and thus eligible for services) with students in the
comparison group who had slightly less than the requisite number of wrong‐to‐right erasures to be
classified as having their scores manipulated (and thus were not offered Target 2021 services).
Over the first three semesters of implementation the results indicate:
Small positive impact on course grades.
No effect on number of courses passed.
Either a small reduction or no impact on attendance, depending on the analytical technique.
Either a modest reduction or no impact on 9th Grade Literature scores, depending on the analytical
technique.
Substantial, but not statistically significant positive impact on the likelihood of graduation.

2
Background
Allegations of widespread manipulation of student test scores by Atlanta Public Schools (APS)
teachers and school administrators first became public in 2009. It was alleged that scores on the Spring
2009 administration of Criterion‐Referenced Competency Test (CRCT), given to students in grades 1‐8,
had been falsified by changing wrong answers to right answers after the exam was given. In early 2010
the Governor’s Office of Student Achievement (GOSA) conducted a statewide analysis of erasures on the
CRCT. Classes were “flagged” based on high numbers of wrong‐to‐right (WTR) erasures and schools were
categorized based on the proportion of flagged classrooms in the school.1 Nearly 60 percent of
elementary and middle schools in APS were identified as having 20 percent or more of their classrooms
flagged. Results of the erasure analysis were used by the Georgia Bureau of Investigation (GBI) to select
schools for detailed investigation, which included interviews with school personnel. In over half of these
schools, educators confessed to manipulating test scores. Investigators concluded that systemic
misconduct occurred in over three‐fourths of the schools that were investigated in detail. The
investigation also revealed that test manipulation had been going on for some time, perhaps as far back
as 2001 in some schools (Office of the Governor, 2011).
In May 2015 researchers from Georgia State University presented a report to APS (Sass, Apperson
and Bueno, 2015) that analyzed the impacts of test manipulation on subsequent outcomes for students.
Based on the number of WTR erasures on individual exams, relative to the average in a typical year when
manipulation did not occur, the report found that approximately 60 percent of students in flagged
classrooms in 2008/09 likely had their test answers manipulated in one or more subjects on the spring
2009 CRCT exam. Controlling for observable student characteristics, the study compared outcomes for
students whose scores were likely manipulated in flagged classrooms to outcomes for other students in
flagged classrooms who do not appear to have their answers changed ex‐post. The report concluded that
manipulation of students’ test answers had negative consequences for later student performance in
reading and English Language Arts (ELA), but not in math. The losses were in the range of 0.06 to 0.14
standard deviations of student achievement or roughly equivalent to one‐fourth to one‐half of typical
annual learning gains for students. Additional analyses did not uncover any appreciable effects on either
student attendance or the number of student disciplinary incidents.
Following the presentation of the Georgia State research report, APS began to formulate a plan
for assisting students who may have been negatively affected by test score manipulation in 2009 and prior
years. The resulting program was dubbed “Target 2021.” As stated on the APS web site, “The purpose of
the CRCT Remediation and Enrichment Academic Program (Target 2021) is to provide the students who
were impacted by the CRCT score anomalies targeted supports delivered via the development and
1 Classrooms were flagged when the number of WTR erasures was greater than three standard deviations above the state mean. An adjustment was made for class size by dividing the standard deviation by the square root of the class size. The state investigation refers to “flagged classrooms,” though they were in fact groups of students who were administered a given test by a single proctor. The test score administrator was not necessarily the classroom teacher for the tested subject.
3
implementation of individual learning plans designed to position them towards proficiency for graduation
and equip them with post‐secondary options.”
The Target 2021 program focuses on four student outcomes: attendance, grades, reading
achievement and ultimately graduation. Corresponding to these areas, the program has four specific
goals:
The overall attendance rate for students served in Target 2021 will increase when compared to the
attendance rate of the same students one year prior.
The percentage of students failing one or more courses will decrease when compared to the year
prior.
The reading levels of students will increase at a rate that makes up for the negative effect identified
in the original study.
The graduation rate of the Target 2021 students eligible to graduate in 2016 will be greater than that
of their academically similar peers.
Based on prior enrollment in a flagged classroom in 2009 and individual WTR erasure counts on
the 2009 CRCT exams, APS created an initial list of students potentially affected by test manipulation and
enrolled in APS during the 2014/15 school year.2 Of these students, 3,075 were enrolled in APS as of the
first day of the spring 2016 semester (January 6, 2016). Over 99 percent of all students who were offered
Target 2021 services participated in the program; only about 30 students and their families opted out of
the program.
In consultation with parents, the district created individual support plans and established goals
for each participant by January 2016. A variety of services and incentives were subsequently provided to
participants during the spring 2016 semester. These services included academic monitoring, individual
counseling, attendance incentives, ACT/SAT prep, tutoring, behavioral interventions, college/career fairs
and parent workshops. It is not possible to determine exactly which services each student received and
the intensity and timing of those services. Therefore, the following analysis can only gauge the average
effect of the program on participants.
2 APS used a threshold of five or more WTR erasures on either the math, reading or ELA 2009 CRCT exams to determine eligibility for the Target 2021 program. This is a slightly more lenient threshold than that used to determine “cheated” students in Sass, Apperson and Bueno (2015). In the Sass, Apperson and Bueno analysis a student was designated as having been cheated in 2009 if the number of WTR erasures on a given exam exceeded the number of WTR erasures corresponding to the 95th percentile of the WTR erasure distribution in 2013 (when by all accounts no test manipulation occurred). The corresponding thresholds were five or more WTR erasures in reading, five or more WTR erasures in ELA and six or more WTR erasures in math.
4
SampleandMethodology
In order to evaluate the impact of the Target 2021 program on student outcomes, it is important
to compare outcomes for Target 2021 participants to our best estimate of how they would have
performed had they not participated in the program.3 Schools that received detailed investigations from
the GBI (due to having significant proportions of their classes being flagged for high WTR erasure counts)
tended to be schools that served large proportions of disadvantaged students and that showed low levels
of overall student achievement. Consequently, the analysis is limited to students who were enrolled in
flagged classrooms within investigated schools in 2009. Given the Target 2021 program did not begin
until spring 2016, it is necessary to further limit the sample to students who were enrolled in APS in both
the fall and spring semesters of the 2015/2016 school year. Since we want to measure the full impact of
three semesters of the intervention (except for graduation), the sample is further constrained to students
who were also enrolled in an APS school in 2016/17. This results in an analysis sample of 3,489 students.
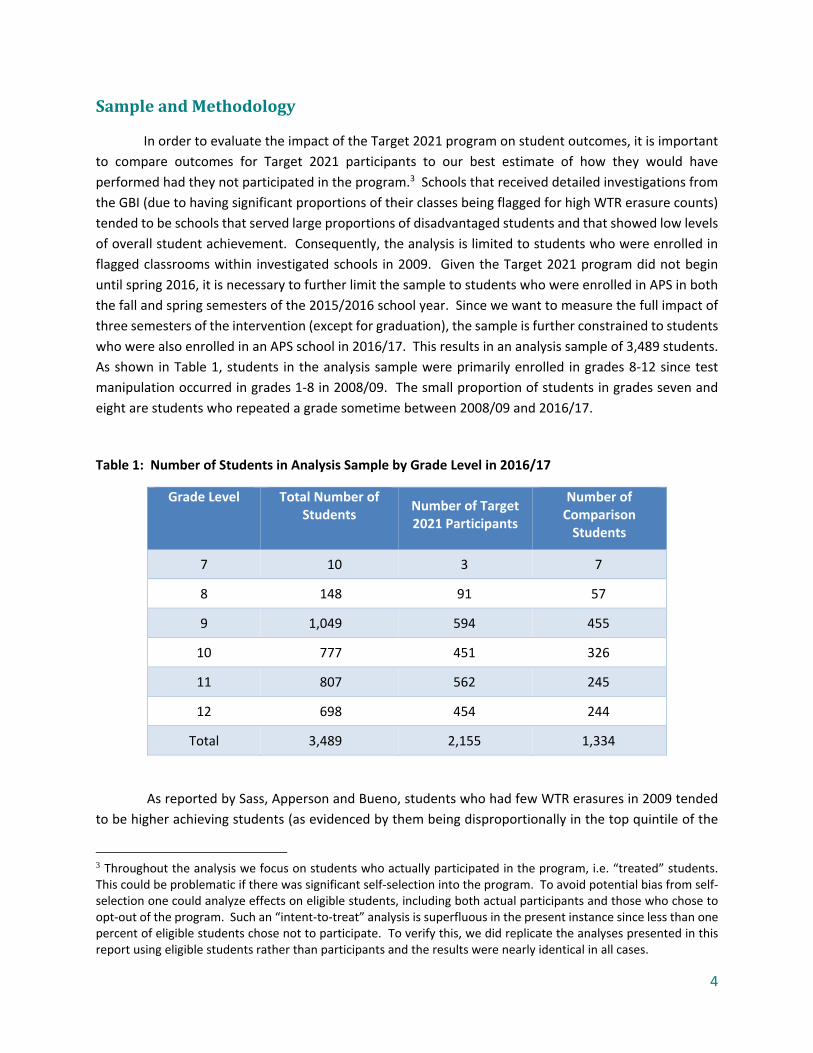
As shown in Table 1, students in the analysis sample were primarily enrolled in grades 8‐12 since test
manipulation occurred in grades 1‐8 in 2008/09. The small proportion of students in grades seven and
eight are students who repeated a grade sometime between 2008/09 and 2016/17.
Table 1: Number of Students in Analysis Sample by Grade Level in 2016/17
Grade Level Total Number of Students
Number of Target 2021 Participants
Number of Comparison Students
7 10 3 7
8 148 91 57
9 1,049 594 455
10 777 451 326
11 807 562 245
12 698 454 244
Total 3,489 2,155 1,334
As reported by Sass, Apperson and Bueno, students who had few WTR erasures in 2009 tended
to be higher achieving students (as evidenced by them being disproportionally in the top quintile of the
3 Throughout the analysis we focus on students who actually participated in the program, i.e. “treated” students. This could be problematic if there was significant self‐selection into the program. To avoid potential bias from self‐selection one could analyze effects on eligible students, including both actual participants and those who chose to opt‐out of the program. Such an “intent‐to‐treat” analysis is superfluous in the present instance since less than one percent of eligible students chose not to participate. To verify this, we did replicate the analyses presented in this report using eligible students rather than participants and the results were nearly identical in all cases.
5
achievement distribution the following year). Consequently, a simple comparison of outcomes for
students receiving Target 2021 services to outcomes for students in flagged classrooms not receiving
Target 2021 services may not provide an accurate measure of the program’s effectiveness. We therefore
rely on two strategies that allow us to more meaningfully measure the program’s impact: difference‐in‐
differences and regression discontinuity.
Difference‐in‐Differences
A simple approach to analyzing the program’s impact would be to compare the change or
“difference” in outcomes for participants before and after receiving Target 2021 services. For example,
consider the potential impact of Target 2021 services on student attendance. One could compare
attendance rates for participants in fall 2015 (before receiving any services) to attendance rates for the
same students in spring 2017 (when they had been receiving intervention services for three semesters).
The advantage of this approach is that one is comparing the outcomes for the same students at different
points in time, thereby avoiding potential bias from making comparisons to other students who may differ
from the treated students in ways that are not observable. The problem with a simple comparison of
outcomes over time is that other things may have been occurring in the district in spring 2016 that could
have boosted attendance for all students, whether or not they participated in Target 2021.
To avoid falsely attributing changes in attendance to participation in Target 2021, we compare
the difference in attendance between fall 2015 and spring 2017 for Target 2021 participants to the same
difference in attendance over the same time period for students in the comparison group. This sort of
comparison is known as a “difference‐in‐differences” approach. If changes in attendance were due to
factors unrelated to Target 2021 participation (e.g. students show up less often when the weather is nice),
then attendance would fall in the spring semester for all students, but the difference in Fall‐2015‐to‐
Spring‐2017 changes in attendance between participants and non‐participants would be zero.
While the difference‐in‐differences approach mitigates potential bias by analyzing changes over
time in student outcomes (rather than levels) across treated and comparison students, estimates of the
impact of Target 2021 could still be biased if the characteristics of participants are associated with changes
over time in outcomes. For example, suppose that students from low‐income households tend to have
bigger drop‐offs in attendance during spring than do students from more affluent families. Further,
suppose that Target 2021 participants are more likely to be from low‐income households than comparison
students. Under this scenario, the true impact of Target 2021 would be understated in the difference‐in‐
differences analysis.
One important characteristic that affects attendance is the grade a student is enrolled in. For
example, absenteeism tends to be higher in middle school than in elementary school, and high school
freshmen tend to have higher absenteeism than students in grades 10‐12. To account for differences in
typical attendance rates across grade levels, we estimate models that include controls for the grade in
which a student is enrolled. An additional concern is that seniors in their last semester of high school will
not be as responsive to any sort of educational intervention as would students who are not so near high

6
school completion. To allow for this possibility, we also estimate the difference‐in‐differences model with
demographic controls over the subsample of students who have not yet reached grade 12.
To minimize potential bias resulting from student/family characteristics that are associated both
with Target 2021 participation and with changes over time in student outcomes, we also estimate two
variants of the difference‐in‐differences model. The first version statistically controls for observable
student characteristics by estimating a difference‐in‐differences model that includes student
characteristics (gender, race/ethnicity, free/reduced‐price lunch status, Limited English Proficiency status
and disability status) as independent variables in a multivariate regression. The second version includes
so‐called “student fixed effects” in the difference‐in‐differences model. The student fixed effect approach
essentially compares a student’s performance to their long‐run average. That is, a student’s performance
during the implementation period (spring 2016, fall 2016 and spring 2017) is compared to their typical
performance up until the implementation period, thereby controlling for any time‐invariant student
characteristics. Sticking with the absences from the example above, let’s say that the typical Target 2021
student missed 5 days in each implementation semester and the typical comparison student missed 4
days per semester. If we look at their absences in prior years and see that the Target 2021 students
typically miss 8 days per semester and the comparison students typically miss six days, the difference‐in‐
difference model with student fixed effects model would suggest that Target 2021 program lowered
absences by [(4‐6) ‐ (5‐8)] or 1 day.
RegressionDiscontinuity
Often students are assigned to educational programs based on how they score on some particular
metric. Some states, for instance, base eligibility for gifted education on IQ scores. Similarly, a student’s
grade point average or performance on a standardized exam may provide a basis for summer school
offerings. The regression discontinuity technique exploits the fact that students who fall just below the
cutoff for program eligibility are going to be nearly identical to those who just exceed the threshold for
participation. For example, if program participation is based on a test score, then, for students near the
test score threshold, participation may depend simply on whether a student happened to guess correctly
on a couple of questions on an exam. If guessing right is purely by chance, the assignment of students
near the cutoff to treatment and control groups would be equivalent to a randomized experiment.
In the present context, the offer of Target 2021 services depended on the number of WTR
erasures on a student’s 2009 CRCT exams. If a student was in a flagged classroom and had five or more
WTR erasures in any of three subject area exams, math, reading and language arts, they were deemed
eligible to receive Target 2021 services.4 The actual number of WTR erasures on a student’s exam
depended on many factors, including the student’s ability and prior education (which determine how
many questions they initially answered correctly), the choice of a student to change an answer on their
4 The list of Target 2021 students in the analysis sample was compared to WTR erasure data used in Sass, Apperson and Bueno (2015). All 2,819 Target 2021 participants had five or more WTR erasures on one or more of the 2009 CRCT exams according to the data used by Sass, Apperson and Bueno. However, approximately eight percent of the comparison group (who did not receive Target 2021 services) had five or more WTR erasures on one or more of the 2009 CRCT exams. We therefore employ a “fuzzy” regression discontinuity design.

7
own, the likelihood an educator would select their exam for manipulation ex‐post and the questions the
educator chose to correct. While a student with 15 WTR erasures on an exam would likely have had worse
outcomes in the absence of test manipulation than a student with zero or one WTR, a student who had
five WTR erasures in reading and four WTR erasures in math and ELA would likely be no different, on
average, than a student who had four WTR erasures in each of the three subject areas.
Rather than a simple comparison of means for students above and below the cutoff value of WTR
erasures for Target 2021 eligibility, the regression discontinuity approach allows for trends in the outcome
as one moves away from the threshold. Given the relatively few possible WTR values, we simply allow for
a linear trend in the outcome with respect to the number of WTR erasures. We also incorporate
demographic controls in the analysis to further ensure the comparability of students just above and just
below the eligibility cutoff.
The advantage of the regression discontinuity approach, relative to difference‐in‐differences, is a
smaller chance the results will be biased. By comparing students that are very near a cutoff, the regression
discontinuity approach is more like a true experiment where individuals are randomly assigned to the
treatment and control groups and thus no different on average. This potential gain comes at a cost,
however. Since the regression continuity approach only compares students near the WTR threshold for
receipt of Target 2021 services, it effectively employs a smaller sample and yields estimates that are less
precise. Put differently, under the regression discontinuity approach it is more likely that one would fail
to reject the null hypothesis that the Target 2021 program had no effect.
Results
DescriptiveStatistics
Table 2 presents summary statistics on the characteristics of students in the Target 2021 and
comparison groups. The observable characteristics of the students in the two groups appear to be quite
similar. The only noticeable difference is a somewhat larger proportion of special education students in
the comparison group. The fact that the demographic characteristics of the two groups are similar is not
surprising, given that students in both groups were enrolled in schools investigated for test manipulation
in 2009.

8
Table 2. Percentages of Student Characteristics for Target 2021 and Comparison Groups
Description Target 2021 Students
Comparison Students
Female 51.5 51.3
Black 97.1 96.1
Hispanic 2.6 2.9
Other Races 0.3 0.7
Free/Reduced‐Price Lunch 99.2 98.7
Limited English Proficiency 0.0 0.0
Special Education 10.7 14.4
Attendance
Figure 1 illustrates the attendance rates by semester for students participating in Target 2021 and
the comparison group of students. Attendance drops off for both groups in spring 2017, the third
semester following implementation of Target 2021 services. The average reduction in the attendance
rate is slightly larger for the Target 2021 recipients (‐0.74 percentage points), but the difference is not
statistically significant at a 90 percent confidence level.

9
Figure 1: Mean Attendance Percentage in Fall 2015 and Spring 2017 by Semester and Target 2021 Status
Figure 2 presents a visual representation of the regression discontinuity analysis of attendance
outcomes. The dark blue dots represent the average attendance percentage for students with a given
level of WTR erasures on their 2009 exam and the red bars represent a 95 percent confidence interval
around those sample means. The black lines are simply linear trends across WTR erasure levels above
and below the threshold for Target 2021 eligibility. From the figure, it is clear that students above and
below the threshold of five or more erasures (in either ELA, math or reading on the 2009 CRCT exam),
have similar attendance rates.
91.8
82.5
91.8
81.8
02
04
06
08
01
00P
erc
enta
ge o
f Da
ys A
ttend
ed
Not Target 2021 Target 2021
Attendance by Semester and Target 2021 Status
Fall 2015 Spring 2017

10
Figure 2: Regression Discontinuity Analysis of Attendance Rates in Spring 2017
We also estimated a version of the regression discontinuity model that controls for observable
student characteristics. These results are presented in Table 3, along with results from the various
alternative specifications of the difference‐in‐difference model (with and without controls, excluding
seniors, with student fixed effects). The estimated impacts range from ‐1.3 to 1.1, and in all but one case
we cannot reject the null hypothesis that the effect of Target 2021 participation on attendance is zero at
the 95 percent confidence level.
78
80
82
84
86
Pe
rcen
tage
of D
ays
Atte
nded
0 1 2 3 4 5 6 7 8 9 10Maximum WTR Erasures
Average at Each Erasure Level Line of Best Fit
RD Analysis of Attendance Spring 2017

11
Table 3. Estimated Effects of Target 2021 Participation on Attendance Percentage
Model Estimated Effect Different from Zero
at a 90%
Confidence Level?
Different from Zero
at a 95%
Confidence Level?
Difference‐in‐Differences without Controls
‐0.741 No No
Difference‐in‐Differences with only Grade‐Level Controls
‐0.951 Yes No
Difference‐in‐Differences with all Controls
‐0.921 Yes No
Difference‐in‐Differences with Controls, Excluding Seniors
‐1.030 Yes No
Difference‐in‐Differences with Student Fixed Effects
‐1.364 Yes Yes
Regression Discontinuity without Controls
1.103 No No
Regression Discontinuity with Controls
0.839 No No
NumberofCoursesFailed
The available data on course grades are limited to high school students. For this sub‐sample, a
student was deemed to have failed a course based on their 100‐point‐scale numeric semester grade. A
numeric grade below 70 is considered failing. Only “core” classes, those that are in the subject areas used
by the University System of Georgia to calculate high school grade point averages for college admission
purposes, were included in the analysis. This includes courses in math, ELA, science, social studies and
foreign languages.
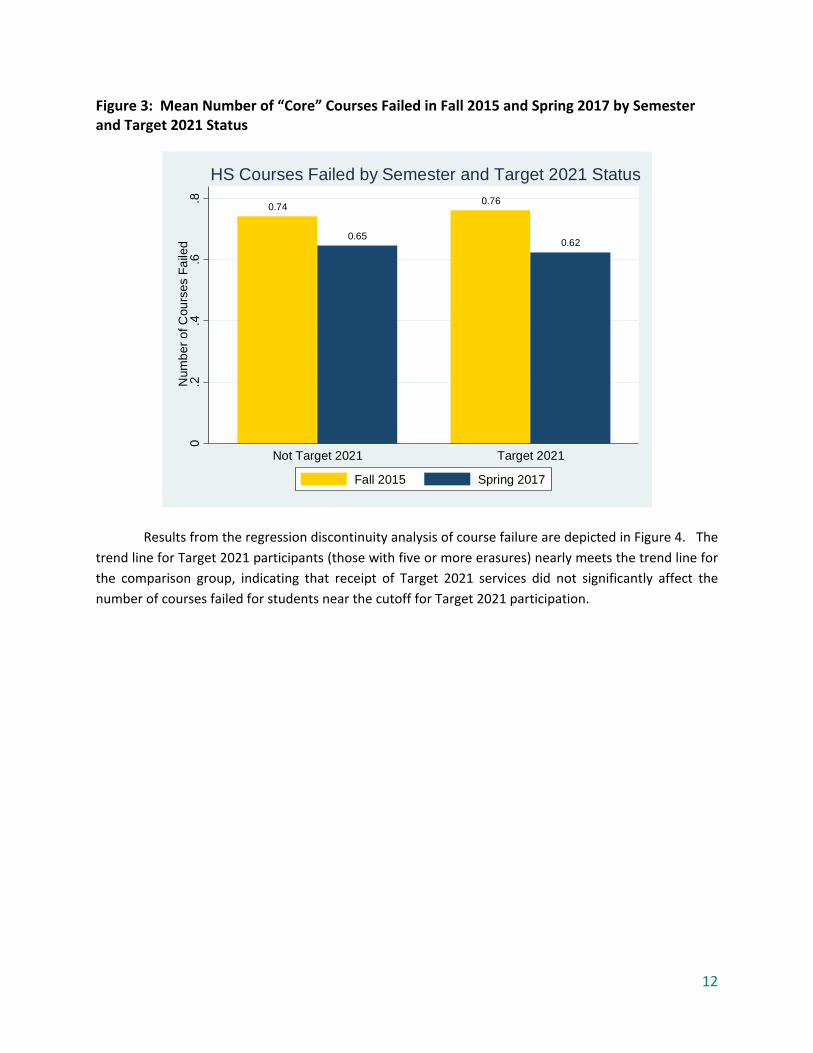
Figure 3 depicts the mean number of core courses failed in fall 2015 and spring 2017 for Target
2021 recipients and for the comparison group. The number of course failures for both groups are lower
after three semesters of Target 2021 implementation, but the reduction is larger for Target 2021 students.
The difference in the change over time in the number of course failures, 0.04, is not statistically different
from zero at the 95 percent confidence level, however.
12
Figure 3: Mean Number of “Core” Courses Failed in Fall 2015 and Spring 2017 by Semester and Target 2021 Status
Results from the regression discontinuity analysis of course failure are depicted in Figure 4. The
trend line for Target 2021 participants (those with five or more erasures) nearly meets the trend line for
the comparison group, indicating that receipt of Target 2021 services did not significantly affect the
number of courses failed for students near the cutoff for Target 2021 participation.
0.74
0.65
0.76
0.62
0.2
.4.6
.8N
umb
er o
f Cou
rses
Fa
iled
Not Target 2021 Target 2021
HS Courses Failed by Semester and Target 2021 Status
Fall 2015 Spring 2017

13
Figure 4: Regression Discontinuity Analysis of No. of “Core” Courses Failed in Spring 2017
Results from the difference‐in‐differences and the regression models of course failure, both those
with and without controls for student characteristics, are summarized in Table 4. In no case do the
estimates of the impact of Target 2021 participation differ from zero at a 90 percent confidence level,
indicating the Target 2021 did not have a significant impact on course failure in spring 2016.
.2.4
.6.8
1N
umb
er o
f Cou
rses
Fa
iled
0 1 2 3 4 5 6 7 8 9 10Maximum WTR Erasures
Average at Each Erasure Level Line of Best Fit
RD Analysis of HS Courses Failed Spring 2017

14
Table 4. Estimated Effects of Target 2021 Participation on Number of “Core” Courses Failed
Model Estimated Effect Different from Zero
at a 90% Confidence
Level?
Different from Zero
at a 95% Confidence
Level?
Difference‐in‐Differences without Controls
‐0.041 No No
Difference‐in‐Differences with only Grade‐Level Controls
‐0.061 No No
Difference‐in‐Differences with all Controls
‐0.061 No No
Difference‐in‐Differences with Controls, Excluding Seniors
‐0.007 No No
Difference‐in‐Differences with Student Fixed Effects
‐0.004 No No
Regression Discontinuity without Controls
‐0.045 No No
Regression Discontinuity with Controls ‐0.089 No No
GradePointAverage
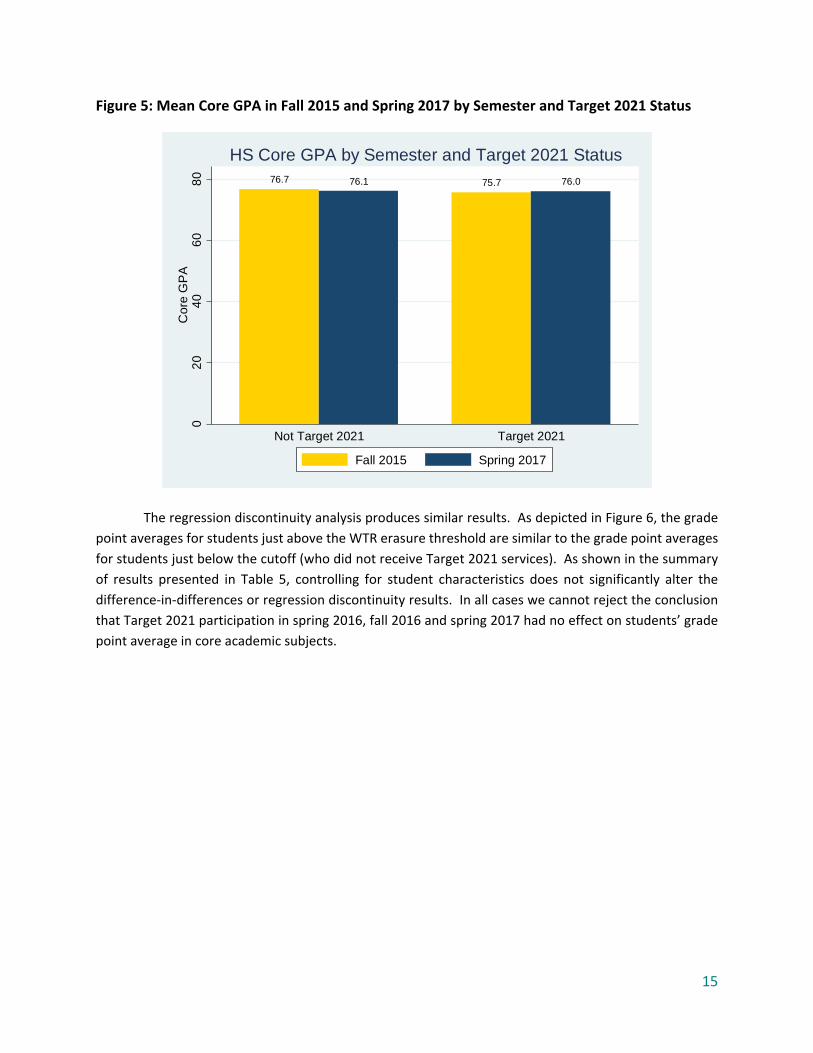
As illustrated in Figure 5, grade point averages for the high‐school level Target 2021 participants
increased slightly, while those of high school students in the comparison group fell from fall 2015 to spring
2017. The difference in GPA changes is statistically significant at a 90 percent confidence level.
15
Figure 5: Mean Core GPA in Fall 2015 and Spring 2017 by Semester and Target 2021 Status
The regression discontinuity analysis produces similar results. As depicted in Figure 6, the grade
point averages for students just above the WTR erasure threshold are similar to the grade point averages
for students just below the cutoff (who did not receive Target 2021 services). As shown in the summary
of results presented in Table 5, controlling for student characteristics does not significantly alter the
difference‐in‐differences or regression discontinuity results. In all cases we cannot reject the conclusion
that Target 2021 participation in spring 2016, fall 2016 and spring 2017 had no effect on students’ grade
point average in core academic subjects.
76.7 76.1 75.7 76.0
02
04
06
08
0C
ore
GP
A
Not Target 2021 Target 2021
HS Core GPA by Semester and Target 2021 Status
Fall 2015 Spring 2017

16
Figure 6: Regression Discontinuity Analysis of HS Core GPA in Spring 2017
Table 5. Estimated Effects of Target 2021 Participation on HS Core GPA
Model Point Estimate Different from Zero
at a 90% Confidence
Level
Different from Zero
at a 95% Confidence
Level
Difference‐in‐Differences 1.021 Yes No
Difference‐in‐Differences with only Grade‐Level Controls
0.982 Yes No
Difference‐in‐Differences with all Controls
1.035 Yes No
Difference‐in‐Differences with Controls, Excluding Seniors
1.035 No No
Difference‐in‐Differences with Student Fixed Effects
‐0.225 No No
Regression Discontinuity without Controls
0.911 No No
Regression Discontinuity with Controls 1.526 No No
72
74
76
78
80
Cor
e G
PA
0 1 2 3 4 5 6 7 8 9 10Maximum WTR Erasures
Average at Each Erasure Level Line of Best Fit
RD Analysis of HS Core GPA Spring 2017

17
ReadingAchievement
Since one of the Target 2021 goals was to improve reading achievement, measures of student
performance in reading were sought out. During the era of test manipulation, statewide achievement
exams (the Criterion Reference Competency Test or CRCT) covered fives subject areas, including reading.
When the state moved to the Milestones assessment in 2014/15, reading was no longer tested as a subject
area separate from English Language Arts. Thus, we cannot directly track the impact of Target 2021 on
reading achievement using statewide exams. As an alternative, we investigated the use of a district
administered computer adaptive assessment (CAAS) in reading (other subject areas are tested as well).
The CAAS has been administered by APS up to three times per year in grades K‐11. While the CAAS reading
exam was given in winter 2016 (just prior to the beginning of the Target 2021 program), it was
administered to relatively few students at the end of our analysis period, spring 2017. Among the nearly
3,500 students in our analysis sample, only 143 took both the winter 2016 and spring 2017 CAAS reading
exams. For this reason, there were too few observations to conduct an analysis. Consequently, our only
measure of reading achievement is an indirect measure: performance on the 9th grade literature end‐of‐
course exam.
End‐of‐Course9thGradeLiteratureScore
Given that most Target 2021 students are now in high school and end‐of‐grade assessments do
not go past 8th grade, the closest we can get to a measure of reading performance are scores on the
statewide end‐of‐course test (EOCT) for 9th‐grade Literature. Clearly, this is an imperfect measure at best,
since reading is not the focus of the literature course and test scores reflect competencies in areas other
than reading. Another limiting factor is that the tests are only given once (almost exclusively in 9th grade)
and therefore cover a small segment of the overall analysis sample. In addition, there is not a directly
comparable EOCT score prior to 9th grade. Therefore, it is necessary to use scores on the EOG in English
Language Arts exam as a baseline for the difference‐in‐differences analysis of 9th‐grade Literature exam
scores.
The difference‐in‐differences analysis results are depicted in Figure 7. Scores on the 9th grade
Literature exam (relative to statewide averages) fell between spring 2015 and spring 2017. The drop was
larger for the Target 2021 participants and is statistically significantly different from zero at a 90 percent
confidence level, but not significantly different from zero at a 95 percent confidence level.

18
Figure 7: Mean 9th Grade Literature Percentile Score in in Fall 2015 and Spring 2017 and Mean EOG ELA Percentile Score by Target 2021 Status
Results from the regression discontinuity analysis without controls, shown in Figure 8, do not
reveal any significant impact of Target 2021 participation on 9th grade Literature EOCT scores. Percentile
scores generally decrease with the number of WTR erasures, both below and above the WTR threshold
for Target 2021 eligibility. The trend lines are close to one another near the threshold, and the difference
is much smaller than the confidence bans for the groups just above and below the cutoff.
37.5136.58
30.33
27.41
01
02
03
04
0S
tate
Per
cent
ile
Not Target 2021 Target 2021
9th Grade Literature by Year and Target 2021 Status
2015 EOG 2017 EOCT

19
Figure 8: Regression Discontinuity Analysis of 9th Grade Literature EOCT Percentile
Results from all of the estimated models of 9th grade Literature EOCT scores are summarized in
Table 6. For each of the difference‐in‐differences specifications we find a larger drop in 9th‐grade
literature scores for Target 2021 participants compared to students not receiving services. This difference
is significant at the 90 percent confidence level but not at the 95 percent level. Neither of the regression
discontinuity specifications provide evidence that participation in Target 2021 during the three semesters
of Target 2021 implementation had a significant impact on student performance on the 9th grade
Literature exam.
20
30
40
50
60
Pe
rcen
tile
Sco
re
0 1 2 3 4 5 6 7 8 9 10Maximum WTR Erasures
Average at Each Erasure Level Line of Best Fit
RD Analysis of 9th Grade Lit. Score Spring 2017

20
Table 6. Estimated Effects of Target 2021 Participation on 9th Grade Literature Percentile
Model Estimated Effect Different from Zero
at a 90% Confidence
Level?
Different from Zero
at a 95% Confidence
Level?
Difference‐in‐Differences without Controls
‐1.990 Yes No
Difference‐in‐Differences with only Grade‐Level Controls
‐1.979 Yes No
Difference‐in‐Differences with all Controls
‐1.987 Yes No
Difference‐in‐Differences with Controls, Excluding Seniors
NA NA NA
Difference‐in‐Differences with Student Fixed Effects
NA NA NA
Regression Discontinuity without Controls
‐1.028 No No
Regression Discontinuity with Controls 0.935 No No
Graduation
The analysis of the impact of Target 2021 participation on the likelihood of graduation is limited
to students who would been on track for graduation at the end of spring 2017, i.e. students who were
enrolled in 11th grade in the 2015‐16 school year). As noted in Table 7, this includes 714 students who
were juniors in 2015/15 (456 Target 2021 students and 258 students from the comparison group). Since
there is only a single outcome (graduation by the end of the 2016‐17 school year), a difference‐in‐
differences analysis cannot be conducted; only the simple difference in graduation between Target 2021
students and the comparison group can be analyzed. Likewise, since a single outcome is observed over
time, it is not possible to estimate a model with student fixed effects. Instead past performance is taken
into account by including prior exam scores in the prediction of eventual graduation. Graduation was
defined as receipt of a regular high school diploma. Students receiving certificates of completion or
special education diplomas were treated as not graduating.
As shown in Figure 9, there was a fairly substantial difference of 2.58 percentage points in the
proportion of students graduating in the Target 2021 and the comparison group. The difference is not
statistically significant, however. It is important to note that the graduation rates are conditional on being
enrolled both semesters of 11th grade. They are not the typical four‐year cohort graduation rates of high
school freshman that are typically reported.

21
Table 7. Number of Students in Graduation Analysis Sample by Treatment Status
Total Number of
Students
Target 2021 Participants Comparison Students
714 456 258
Figure 9: Mean Percentage of 12th‐Grade Students Receiving a Regular High School Diploma by the end of the 2016‐17 School Year by Target 2021 Status
A graphical depiction of the regression discontinuity analysis of graduation is presented in Figure
10. For students adjacent to the cutoff for Target 2021 participation (four or five WTR erasures in 2009),
the average graduation percentage is virtually the same. While the below‐cutoff and above‐cutoff trends
diverge at the threshold for participation, the difference is not statistically significant.

22
Figure 10: Regression Discontinuity Analysis of High School Graduation
Table 8 summarizes the results from the various graduation models. In the simple‐difference
specifications the estimated impacts range from 1.0‐2.6 percentage points. However, the effects are not
statistically significant. In other words, we cannot with confidence rule out the possibility that
participation in Target 2021 had no impact on likelihood of graduation, relative to students in the
comparison group who were also enrolled in 11th grade in 2015/16. The regression discontinuity
estimates are much larger but are also very imprecisely estimated; none are statistically significant at even
a 90 percent confidence level.
60
70
80
90
100
Pe
rce
nt o
f Stu
dent
s G
radu
atin
g
0 1 2 3 4 5 6 7 8 9 10Maximum WTR Erasures
Average at Each Erasure Level Line of Best Fit
RD Analysis of Graduation by Spring 2017

23
Table 8. Estimated Effects of Target 2021 on Probability of Receipt of Standard HS Diploma (in Percentage Points)
Model Estimated Effect Different from Zero
at a 90% Confidence
Level?
Different from Zero
at a 95% Confidence
Level?
Simple Difference (Binary Probit) without Controls
2.58 No No
Simple Difference (Binary Probit) with Controls
1.03 No No
Regression Discontinuity without Controls
8.49 No No
Regression Discontinuity with Controls 10.73 No No
HeterogeneousEffects
To gauge whether the Target 2021 program had different effects for different students, we
divided the sample into students with above‐median GPAs in 9th grade and those with below‐median GPAs
in 9th grade. One might expect the impact of the intervention to be greater for those students who were
struggling academically. A summary of results broken down by 9th grade GPA is provided in Table 9. In
general, we fine the impacts fall more heavily on the group of students with below‐median GPAs.
Table 9. Estimated Effects of Target 2021 by Above/Below Median GPA in 9th Grade
Outcome
Below‐Median GPA Above‐Median GPA
Difference RD Difference RD
Graduation 4.404 7.227 2.619 8.342
(5.572) (16.100) (2.698) (6.354)
Attendance ‐0.259 1.563 ‐0.804 1.199
(0.913) (3.050) (0.506) (1.545)
Course Failure ‐0.0492 ‐0.053 ‐0.013 0.044
(0.134) (0.250) (0.050) (0.099)
GPA 1.959 * 1.391 0.147 ‐0.727
(1.066) (2.628) (0.590) (1.281)
9th Grade Literature
‐2.803 * ‐3.994 ‐0.410 ‐2.834
(1.603) (4.788) (1.800) (6.257)
* Statistically significant at 90 percent confidence level. Standard errors in parentheses.

24
SummaryandConclusions
The Target 2021 program provided individualized support programs for students who may have
been affected by test manipulation on the 2009 CRCT exams. A variety of services were provided from
February 2016 through May of 2017. This analysis compared outcomes for Target 2021 participants with
a comparison group of students who had been in schools investigated for test manipulation and in
classrooms with unusually high levels of WTR erasures, but who individually had relatively few WTR
erasures on their own 2009 CRCT exams.
Two primary methods were employed, a difference‐in‐differences approach that compared
changes in performance over time for Target 2021 participants with changes over time for students in the
comparison group, and a regression discontinuity approach in which outcomes for students just above
the WTR threshold for participation were compared to outcomes for students just below the WTR cutoff
for receiving Target 2021 services. Several variants of each general approach were estimated. In most
cases, there were no significant differences in outcomes between the two groups, indicating that
participation in the Target 2021 program during the spring 2021 semester had little significant impact on
measured student outcomes. The results were generally quite mixed. Small positive effects were found
on course grades, but zero or small‐to‐modest effects on courses passed, attendance and 9th‐grade
literature scores. A fairly substantial positive effect on the likelihood of graduation was found, but the
graduation estimates are not precise enough to rule out the possibility that the true effect of Target 2021
participation on graduation was zero.
When interpreting the findings, there are several important factors to consider. First, by now
nearly all the students who may have been affected by test score manipulation in 2009 are in high school,
where it is hard for even the best designed and implemented interventions to have substantial effects.
Second, some of the outcomes targeted by the initiative could not be measured well. In particular, while
raising reading achievement was a stated goal, reading‐specific exams are no longer administered
statewide in Georgia and district‐specific reading exams were not taken by most of the students in the
analysis sample. Third, the Target 2021 intervention may have produced benefits for students that we
cannot readily measure. For example, a number of the intervention activities were designed to promote
college readiness, but no data on college enrollment or persistent in college is available at this time.
25
References
Office of the Governor (2011). “Special Investigators’ Report to the Governor,” unpublished report.
Sass, Tim R. Jarod Apperson and Carycruz Bueno (2015). “The Long‐Run Effects of Teacher Cheating on Student Outcomes,” unpublished manuscript.