of tools - the dpsa 18.pdf · structure assessment questions ... the advantages and disadvantages...
TRANSCRIPT

SECT
ION
3: T
OOL
KIT
OF TOOLS
ORGANISATION
TRANSITION

CHAPTER
18 DESCRIBES TOOLS FOR USE
IN PHASE 3: DESIGN FUTURE
ORGANISATION
18

18-1
CHAPTER 18
18. TOOLS FOR PHASE 3: DESIGN ORGANISATIONAL STRUCTURE
18.1 TOOLS FOR STEP 8: DESIGN FUNCTIONAL AND OPERATIONAL STRUCTURE
Tools Highly recommended Recommended Nice to have
Structure gap map X
Structure selection matrix X
Governance structure requirements matrix X
Benchmarking X
Behaviour/structure analysis matrix (refer to
step 6 tools)
X
Culture Print X
Industry best practices X
Organisational charts X
Structure assessment questions (refer to
step 6 tools)
X
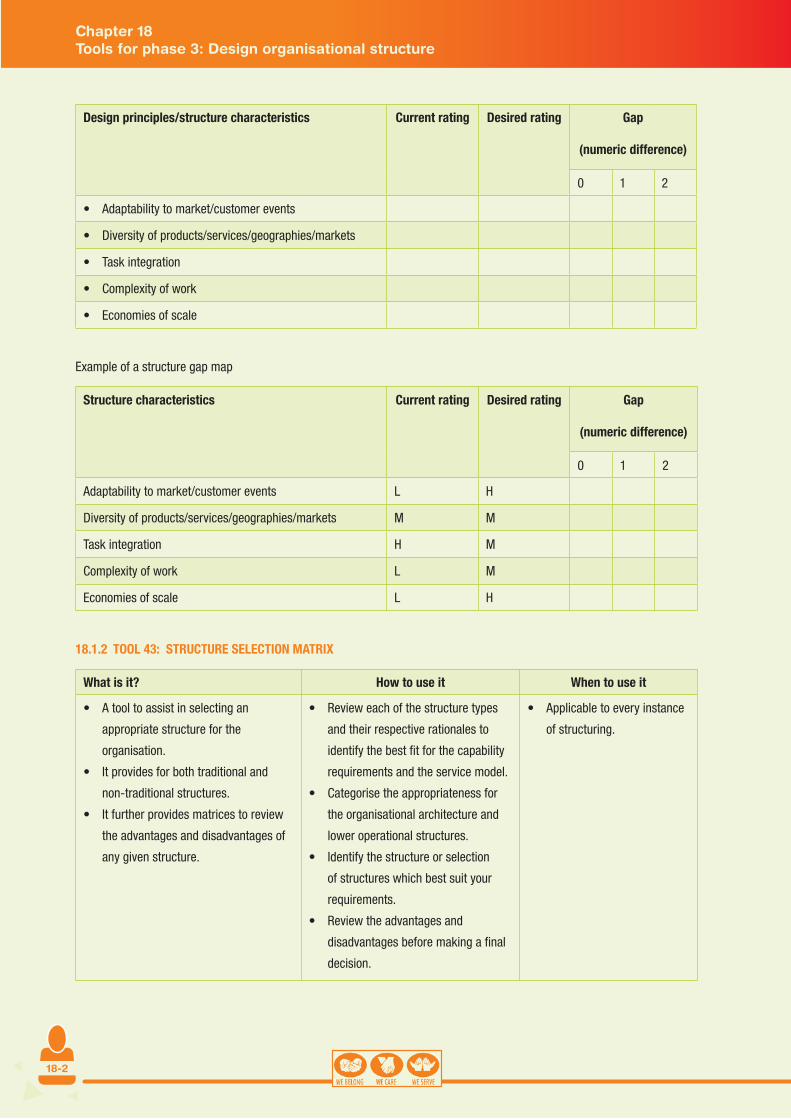
18.1.1 TOOL 42: STRUCTURE GAP MAP
What is it? How to use it When to use it
A tool to determine the
gap between the current
structure and design
principles identified in
step 6.
Transfer the ratings from both the current and
desired structure data collection tables to the first
and second columns.
Determine the gap between current and desired
structure states by converting low ratings to 1,
medium ratings to 2, and high ratings to 3.
Find the difference between the desired rating
number and the current rating number to deter-
mine the gap.
Indicate the gap by shading the box from left to
right to indicate the size of the gap:
Small o (difference of 0) = 1 box shaded
Medium o (difference of 1) = 2 boxes shaded
Large o (difference of 2) = 3 boxes shaded
Determine the effort (low, medium, or high) that it
will take to close the gap.
Should be considered to be a
standard tool.
Chapter 18Tools for phase 3: Design organisational structure
18-2
Chapter 18Tools for phase 3: Design organisational structure
Design principles/structure characteristics Current rating Desired rating Gap
(numeric difference)
0 1 2
Adaptability to market/customer events
Diversity of products/services/geographies/markets
Task integration
Complexity of work
Economies of scale
Example of a structure gap map
Structure characteristics Current rating Desired rating Gap
(numeric difference)
0 1 2
Adaptability to market/customer events L H
Diversity of products/services/geographies/markets M M
Task integration H M
Complexity of work L M
Economies of scale L H
18.1.2 TOOL 43: STRUCTURE SELECTION MATRIX
What is it? How to use it When to use it
A tool to assist in selecting an
appropriate structure for the
organisation.
It provides for both traditional and
non-traditional structures.
It further provides matrices to review
the advantages and disadvantages of
any given structure.
Review each of the structure types
and their respective rationales to
identify the best fit for the capability
requirements and the service model.
Categorise the appropriateness for
the organisational architecture and
lower operational structures.
Identify the structure or selection
of structures which best suit your
requirements.
Review the advantages and
disadvantages before making a final
decision.
Applicable to every instance
of structuring.

18-3
Chapter 18Tools for phase 3: Design organisational structure
Example of a structure selection matrix
Structure type Rationale Appropriateness
for
organisational
architecture
Appropriateness
for lower
hierarchy
Functional
structure
Routine tasks with specialised resources.
Small to medium size in stable environment.
Focus on efficiency and technical quality within.
Divisional
structure
Technological interdependence across functions.
Product/service specialisation and innovation.
Process-
orientated
structure
Large size where contribution to value chain must be
clear.
Variation in tasks and changing environment.
Coordinating work flow that is highly interdependent.
Customer-focused.
Project-based
organisation
Adaptable to fast changing external environment.
Clear accountability for specific deliverables.
Geographical form Sensitivity to regional R&D demands.
Speed to market and access to citizens.
Matrix
organisation
structure
Multiple expertise focused on a problem (i.e. project
teams).
Dual focus on unique products/services and technical
specialisation (citizen, product, service line).
Processing large amount of complex information.
Pressure for shared resources and opportunities for
technical staff to generalise.
Hybrid structure Typically, there is no single structure that perfectly
achieves a Company’s business strategy. The
implementation of a hybrid structure allows an
organisation to tailor the design to best achieve its
business strategy by combining the strengths and
eliminating the weaknesses of various models.
The hybrid structure enables an organisation to reap
the benefits of a particular structure while also
mitigating its weaknesses by incorporating
characteristics of one or more structures.
By combining multiple structures, an organisation
may potentially achieve exponential benefits.

18-4
Simple structure
Structure Rationale Application
FarmSellers /Dealers
The organisation is small enough
for everybody to do more or less
everything.
In general applicable to smaller
organisations and seldom utilised in
larger organisations.
Advantages Disadvantages
Fewer handovers.
Quick response time.
Improves ownership.
Control risk.
Duplication.
Lack of standardisation.
Functional structure
Functional structure Rationale Application
Grouping of specialised resources.
Optimising allocation of scarce
resources.
Quality driven within a function (to
be the best HR specialists).
Separation of specialist areas, e.g.
HR, finance.
Stable environment with routine
technology.
Central decision making (strong
risk management).
Low need for collaboration across
functional units.
Best for single product line, single
market, single expertise tasks.
Advantages Disadvantages
Standards: Encourages consistent
standards and functional loyalty.
Risk management: Complements
centralised control and risk
management.
Economies of scale: Creates
efficiencies through economies of
scale.
Simplicity: Clarity of roles and
relationships, easier supervision
and easier to mobilise specialised
skill.
Slow decisions: Difficult to obtain
quick decisions or actions.
Inflexible: Lacks flexibility and
common problem solving or goal
focus.
Limited sharing of information:
Limits horizontal information flow.
Tends to produce bottlenecks as
work moves horizontally across
functions.
Limited customer focus: no
collective focus.
Chapter 18Tools for phase 3: Design organisational structure

18-5
Divisional (strategic business unit) structure
Divisional structure Rationale Application
Each unit is responsible for the
design, production, and sales of a
product or family of products.
All resources are directly available
to the unit.
Product development life cycle is
shorter.
Units within a product or service
line model are responsible for the
design, production, and sales of a
product or family of products.
Strongly product focused with
multiple products for different
citizens.
Advantages Disadvantages
Adaptable to changes in
customer needs as regards prod-
uct or service.
Product contribution/revenue/
profit easily calculated.
Accountability is clear.
Coordination across functions
within the division is easier.
Speed and quality of decision
making are enhanced.
High cost structure due to poor
economies of scale.
Duplication of efforts.
Reduced specialisation of skill.
Difficulty in coordination of
multiple products within a single
geographic area.
Potential conflicts between product
unit and business unit interests.
Chapter 18Tools for phase 3: Design organisational structure
18-6
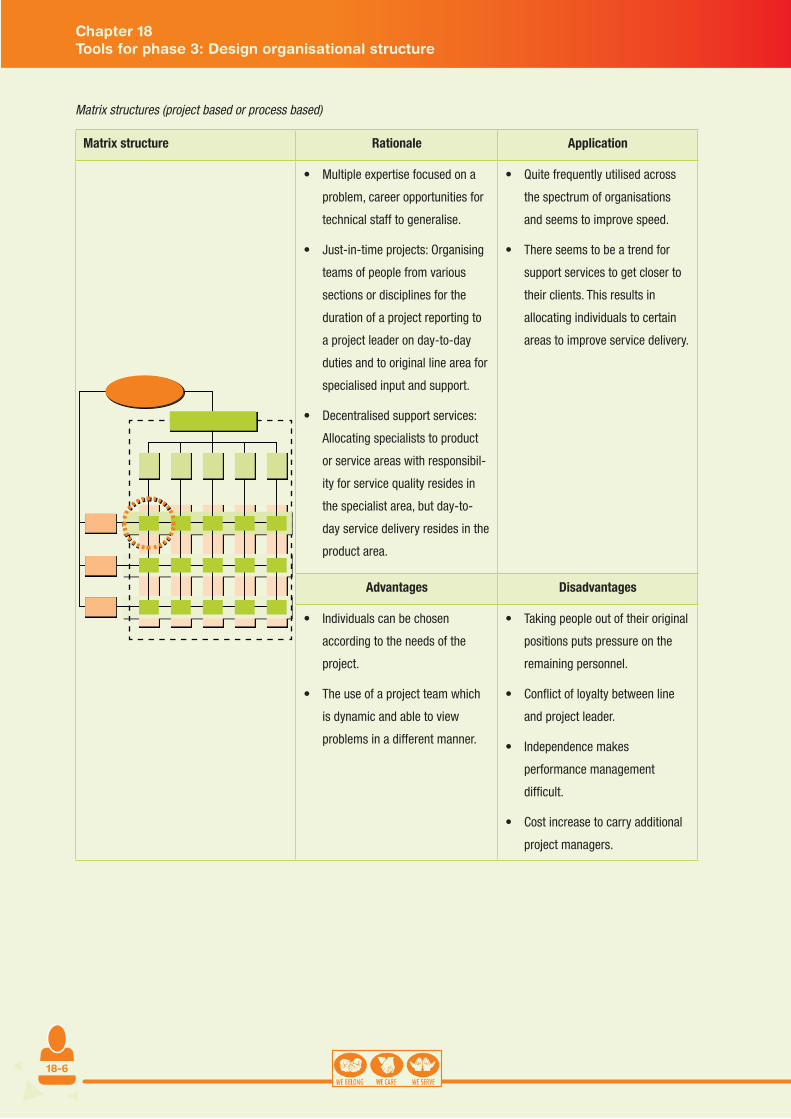
Matrix structures (project based or process based)
Matrix structure Rationale Application
Multiple expertise focused on a
problem, career opportunities for
technical staff to generalise.
Just-in-time projects: Organising
teams of people from various
sections or disciplines for the
duration of a project reporting to
a project leader on day-to-day
duties and to original line area for
specialised input and support.
Decentralised support services:
Allocating specialists to product
or service areas with responsibil-
ity for service quality resides in
the specialist area, but day-to-
day service delivery resides in the
product area.
Quite frequently utilised across
the spectrum of organisations
and seems to improve speed.
There seems to be a trend for
support services to get closer to
their clients. This results in
allocating individuals to certain
areas to improve service delivery.
Advantages Disadvantages
Individuals can be chosen
according to the needs of the
project.
The use of a project team which
is dynamic and able to view
problems in a different manner.
Taking people out of their original
positions puts pressure on the
remaining personnel.
Conflict of loyalty between line
and project leader.
Independence makes
performance management
difficult.
Cost increase to carry additional
project managers.
Chapter 18Tools for phase 3: Design organisational structure

18-7
Process-oriented structures
Process structure Rationale Application
Many organisations choose to
be process-oriented, with the
basic objective of focusing on the
customer to prevent suboptimal
solutions and a lack of common
focus among business units.
Contribution to value chain clear.
Customer-focused.
Best seen as an alternative to the
functional structure.
Potential for new processes and
radical change to processes.
Reduced working capital.
Need for reducing process cycle
times.
Process ownership structure where
one individual or group of
individuals (multiprofessional or
single discipline) takes ownership
and responsibility for the
development and implementation
of a specific business process.
Integrated process team with all
the functions in the value chain
integrated into one team with a
manager or team leader taking
responsibility for coordination and
line responsibility. Examples are
found in the insurance and banking
industries where multiprofessional
teams execute end-to-end process.
Process-oriented matrix
organisation.
Advantages Disadvantages
Offers great flexibility.
Reinforces professional identity
and development.
Encourages interfacing of activities
across departments.
Uses staff resources efficiently
– scarce resources allocated
rationally.
Multiple expertise is brought to
bear on a problem.
Creates vertical and horizontal
information flow.
Conducive to innovation.
May result in higher overheads
because of doubling the number of
managers.
Increases potential conflict be-
tween functional and project team
managers (overlaps of authority
and responsibility).
Results in ambiguity for employees
in reporting relationships.
Difficult to measure costs.
Difficult to apply in practice.
Some managers cannot deal with
the ambiguity and behavioural
demands.
Chapter 18Tools for phase 3: Design organisational structure

18-8
Intermediary (hybrid) structures
Hybrid structure Rationale Application
Two or more traditional forms
of organisational design
combined.
Often found in large businesses
with diverse strategies,
markets, and products.
May be the result of mergers/
acquisitions or an intermediate
form of structure during a
gradual shift of emphasis.
Combination of two or more
organisational designs.
Large businesses with diverse
strategies, markets, and
products.
Result of mergers or acquisitions
or an intermediate form.
Effectively targets issues/
solutions.
Advantages Disadvantages
Ability to target issues/
solutions.
Ability to leverage strengths
and weaknesses of models
being combined.
Some duplication.
Managerial control and
coordination may be more
difficult.
Must be open to making
adjustments to the model as
some consequences may be
unpredictable due to uniqueness
of the model chosen.
Chapter 18Tools for phase 3: Design organisational structure
18-9
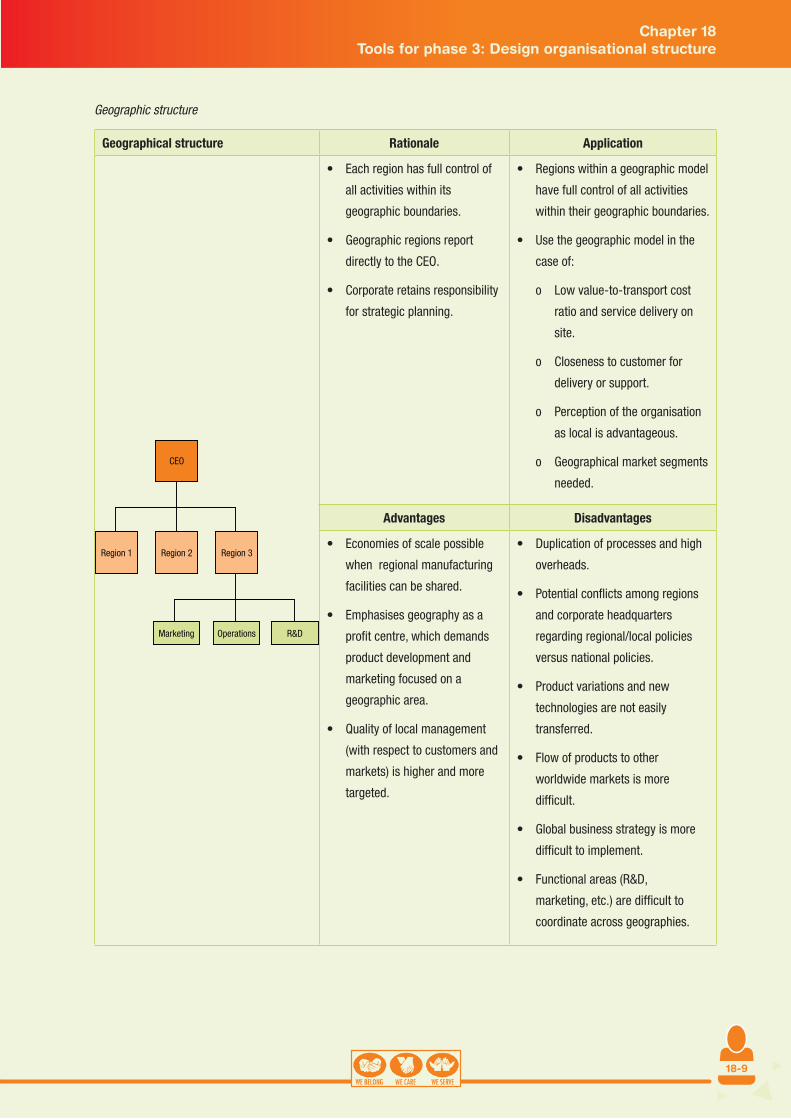
Geographic structure
Geographical structure Rationale Application
Each region has full control of
all activities within its
geographic boundaries.
Geographic regions report
directly to the CEO.
Corporate retains responsibility
for strategic planning.
Regions within a geographic model
have full control of all activities
within their geographic boundaries.
Use the geographic model in the
case of:
Low value-to-transport cost o
ratio and service delivery on
site.
Closeness to customer for o
delivery or support.
Perception of the organisation o
as local is advantageous.
Geographical market segments o
needed.
Advantages Disadvantages
Economies of scale possible
when regional manufacturing
facilities can be shared.
Emphasises geography as a
profit centre, which demands
product development and
marketing focused on a
geographic area.
Quality of local management
(with respect to customers and
markets) is higher and more
targeted.
Duplication of processes and high
overheads.
Potential conflicts among regions
and corporate headquarters
regarding regional/local policies
versus national policies.
Product variations and new
technologies are not easily
transferred.
Flow of products to other
worldwide markets is more
difficult.
Global business strategy is more
difficult to implement.
Functional areas (R&D,
marketing, etc.) are difficult to
coordinate across geographies.
Chapter 18Tools for phase 3: Design organisational structure
18-10
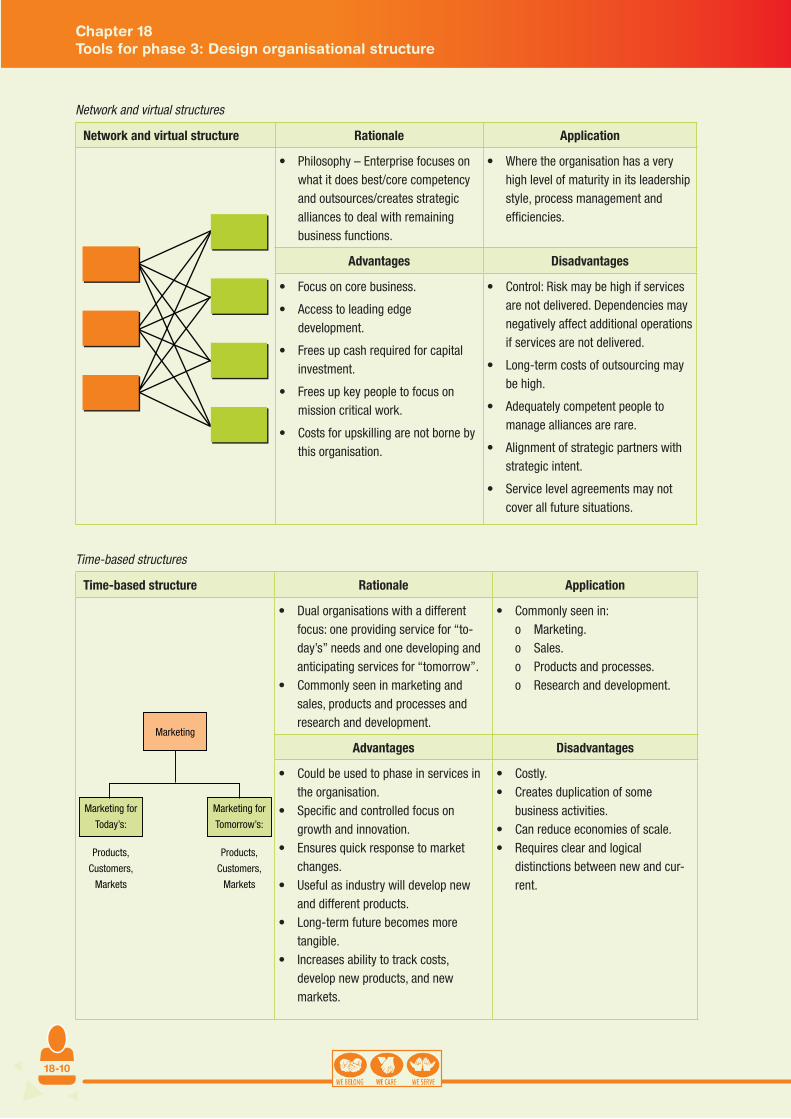
Network and virtual structures
Network and virtual structure Rationale Application
Philosophy – Enterprise focuses on what it does best/core competency and outsources/creates strategic alliances to deal with remaining business functions.
Where the organisation has a very high level of maturity in its leadership style, process management and efficiencies.
Advantages Disadvantages
Focus on core business.
Access to leading edge development.
Frees up cash required for capital investment.
Frees up key people to focus on mission critical work.
Costs for upskilling are not borne by this organisation.
Control: Risk may be high if services are not delivered. Dependencies may negatively affect additional operations if services are not delivered.
Long-term costs of outsourcing may be high.
Adequately competent people to manage alliances are rare.
Alignment of strategic partners with strategic intent.
Service level agreements may not cover all future situations.
Time-based structures
Time-based structure Rationale Application
Dual organisations with a different focus: one providing service for “to-day’s” needs and one developing and anticipating services for “tomorrow”.Commonly seen in marketing and sales, products and processes and research and development.
Commonly seen in: Marketing. oSales. oProducts and processes. oResearch and development. o
Advantages Disadvantages
Could be used to phase in services in the organisation.Specific and controlled focus on growth and innovation.Ensures quick response to market changes.Useful as industry will develop new and different products.Long-term future becomes more tangible.Increases ability to track costs, develop new products, and new markets.
Costly. Creates duplication of some business activities.Can reduce economies of scale.Requires clear and logical distinctions between new and cur-rent.
Chapter 18Tools for phase 3: Design organisational structure

18-11
18.1.3 TOOL 44: GOVERNANCE STRUCTURE REQUIREMENTS MATRIX
What is it? How to use it When to use it
A table indicating the different types
of governance structures and provid-
ing opportunity to consider the need
and the potential benefit of such a
governance structure.
Review each of the governance
structures and determine what needs
to be done (if anything) and how this
will improve the effectiveness of the
selected structure.
Clearly indicate the needs and the
benefit next to the selected gover-
nance structure.
This should be used as part
of any restructuring exercise.
An example of a typical governance structure requirement matrix:
Governance structure requirements What needs to be
done?
How will this improve
the functioning of the
organisation?
Policy or procedural adjustments (What adjustments to policies and
procedures need to be made to support the new structure?)
Decision making governance structures (Committees, forums,
devolution [delegation] of authority, coordinating bodies, service level
agreements and policies)
Service delivery monitoring structures (Customer satisfaction forums,
customer relations teams, performance review, business excellence
forum/team, communities of excellence)
Innovation management structures (Communities of excellence, idea
generation and portfolio management, multi-work-level meetings,
process office, reward and recognition, innovation management pro-
cess, regular benchmarking, multidisciplinary project team approach)
Risk management structures (Audit committee, financial committee,
budget committee, health and safety forum, security forum, ethical
committee, strategic planning team)
Process management structure (Process improvement groups, visual
management, daily meetings, process review meetings, end-to-end
process ownership, process measurement, balanced scorecard
metrics)
Organisational culture (Value champions, value teams, team charters,
team and organisational culture audits, labour forums, 360 degree
assessments, consequence management)
Chapter 18Tools for phase 3: Design organisational structure
18-12
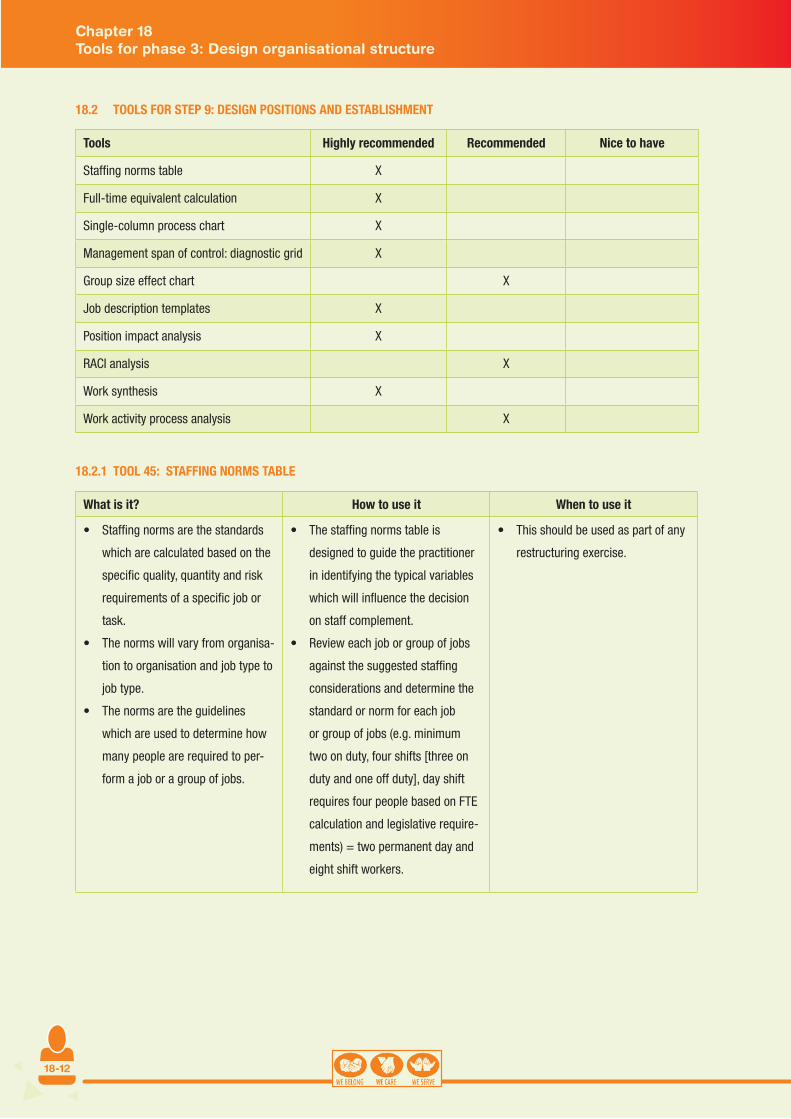
18.2 TOOLS FOR STEP 9: DESIGN POSITIONS AND ESTABLISHMENT
Tools Highly recommended Recommended Nice to have
Staffing norms table X
Full-time equivalent calculation X
Single-column process chart X
Management span of control: diagnostic grid X
Group size effect chart X
Job description templates X
Position impact analysis X
RACI analysis X
Work synthesis X
Work activity process analysis X
18.2.1 TOOL 45: STAFFING NORMS TABLE
What is it? How to use it When to use it
Staffing norms are the standards
which are calculated based on the
specific quality, quantity and risk
requirements of a specific job or
task.
The norms will vary from organisa-
tion to organisation and job type to
job type.
The norms are the guidelines
which are used to determine how
many people are required to per-
form a job or a group of jobs.
The staffing norms table is
designed to guide the practitioner
in identifying the typical variables
which will influence the decision
on staff complement.
Review each job or group of jobs
against the suggested staffing
considerations and determine the
standard or norm for each job
or group of jobs (e.g. minimum
two on duty, four shifts [three on
duty and one off duty], day shift
requires four people based on FTE
calculation and legislative require-
ments) = two permanent day and
eight shift workers.
This should be used as part of any
restructuring exercise.
Chapter 18Tools for phase 3: Design organisational structure
18-13
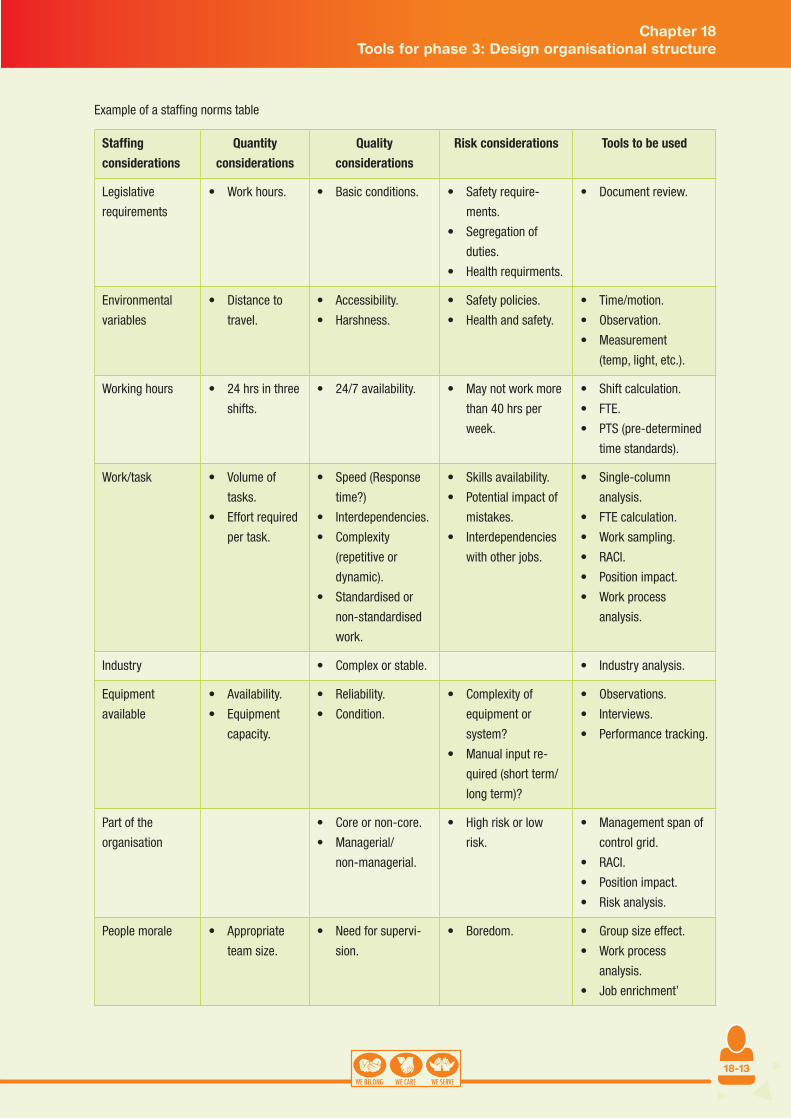
Example of a staffing norms table
Staffing
considerations
Quantity
considerations
Quality
considerations
Risk considerations Tools to be used
Legislative
requirements
Work hours. Basic conditions. Safety require-
ments.
Segregation of
duties.
Health requirments.
Document review.
Environmental
variables
Distance to
travel.
Accessibility.
Harshness.
Safety policies.
Health and safety.
Time/motion.
Observation.
Measurement
(temp, light, etc.).
Working hours 24 hrs in three
shifts.
24/7 availability. May not work more
than 40 hrs per
week.
Shift calculation.
FTE.
PTS (pre-determined
time standards).
Work/task Volume of
tasks.
Effort required
per task.
Speed (Response
time?)
Interdependencies.
Complexity
(repetitive or
dynamic).
Standardised or
non-standardised
work.
Skills availability.
Potential impact of
mistakes.
Interdependencies
with other jobs.
Single-column
analysis.
FTE calculation.
Work sampling.
RACI.
Position impact.
Work process
analysis.
Industry Complex or stable. Industry analysis.
Equipment
available
Availability.
Equipment
capacity.
Reliability.
Condition.
Complexity of
equipment or
system?
Manual input re-
quired (short term/
long term)?
Observations.
Interviews.
Performance tracking.
Part of the
organisation
Core or non-core.
Managerial/
non-managerial.
High risk or low
risk.
Management span of
control grid.
RACI.
Position impact.
Risk analysis.
People morale Appropriate
team size.
Need for supervi-
sion.
Boredom. Group size effect.
Work process
analysis.
Job enrichment’
Chapter 18Tools for phase 3: Design organisational structure

18-14
18.2.2 TOOL 46: FULL-TIME EQUIVALENT CALCULATION
What is it? How to use it When to use it
Full-time equivalent is the standard for the effort of one person for a year. The standards for full-time equiva-lents can be expressed in hours (1 800 per year), capacity (25 children per teacher), or volume (150 ap-plications per day).The FTE provides an indication of what an average, fully competent person will be able to achieve.
Map the process which needs to be executed to task level: Process, procedure, task, activity.Identify and list all the tasks.Determine the effort (total number of hours) required to execute the tasks over a calendar year. (make sure they are recurring and not one-off).Calculate the total number of hours required to execute the process.Determine the number of positions required by dividing the number of hours by the FTE standard, e.g. process requires 8 000 hrs per year, FTE = 1 800, therefore number of positions = 4+.
This should be used as part of any restructuring exercise.
Example calculation of FTE standard (hours)
Full-time equivalent variables Standard p.a. Standard per month
Total working days 261 working days 21 working days (average)
Public holidays 11 calendar days 1 (average)
Total leave (non-productive days) 22 working days 1,8 working days (average)
Total productive potential (total – holidays – leave) 228 days 19 days (average)
Total hours available (days x 8 hrs) 1 824 hrs 152 hrs
Productivity standard (based on environmental, safety, legislative, skills variables, what is the potential productivity of the average worker?)
75% 75%
Full-time equivalent (standard/norm)(total hours available x productivity standard for the average worker)
1 368 hrs 114 hrs (average)
Staff requirements (how many people are required to do the work based on the FTE norm?)
Procedure/task Effort required to complete the tasks/procedure (hours, not lapsed time)
Frequency(hourly, daily,
weekly, monthly, bimonthly, etc.)
Total hours p.a. Full-time equivalent(total hours/FTE
standard)
Procedure 1/task 1
Procedure 2/task 2
Procedure 3/task 3
Procedure 4/task 4
Chapter 18Tools for phase 3: Design organisational structure

18-15
18.2.3 TOOL 47: SINGLE-COLUMN PROCESS CHART
What is it? How to use it When to use it
A tool to review the types of activi-
ties executed by an individual in a
specific job.
The tool distinguishes between the
five types of activities: Operations,
transport, inspection, delay and
storage.
The tool assists in capturing
observations and identification of
improved methods of work.
Capture all work conducted.
Categorise the activity according to type.
Calculate the number of activities
conducted, distance travelled and time
spent on each of the activities.
Review the current method and group
tasks to ensure that all the inspection
tasks happen at the same time, and that
the transport activities are as economi-
cal as possible.
Use to evaluate repetitive
low-level work which is fairly
manual-intensive.
An example of the single-column process chart
Department Study No. Date
Division: Observed by:
Section: Chart starts with:
Present/proposed method Man/material chart Chart ends with:
Task description:
Abbreviations:
Step
No. Details of operation
Oper
atio
n
Insp
ectio
n
Dela
y
Tran
spor
t
Stor
age
Quan
tity
Dist
ance
Tim
eRemarks
O c D ‘ r
O c D ‘ r
O c D ‘ r
O c D ‘ r
O c D ‘ r
O c D ‘ r
O c D ‘ r
O c D ‘ r
O c D ‘ r
O c D ‘ r
O c D ‘ r
O c D ‘ r
O c D ‘ r
SUMMARY Total number
of steps
Operation Inspections Delays Transport Storage
No. Time No. Time No. Time No. Time No. Time
Old method
New method
Chapter 18Tools for phase 3: Design organisational structure

18-16
18.2.4 TOOL 48: MANAGEMENT SPAN OF CONTROL: DIAGNOSTIC GRID
What is it? How to use it
A tool to assist in determining the span of control for
managerial positions at all levels in the organisation.
The grid distinguishes between five dimensions
impacting on ability to manage and coordinate staff:
geographic variables, planning, technical work,
evaluation requirements, and change frequency.
Review the complexity of the environment and
calculate the total by adding the values of the various
blocks selected.
Determine the level of the managerial position and
compare the total obtained on the diagnostic grid with
the suggested span of control on the span of control
sheet.
Diagnostic grid
Time away from
work
Seldom
1
Occasionally
2
Regularly
4
Often
8
Very often
16
Planning
requirements
Minimal
1
Little complexity
2
Moderate
complexity
4
Complex
6
Highly dynamic
environment
8
Specialisation of
work
Routine work
2
Somewhat
specialised
5
Fairly specialised
8
Quite specialised
12
Highly
specialised
16
Evaluation to be
conducted
Spot checks
1
Basic analysis
2
Investigations
3
Special
investigations
4
Comprehensive
with audit trails
5
Change
requirements
Minor
improvements
5
Process
modifications
9
Process
improvements
11
Major initiatives
13
Transformation
14
Total
Chapter 18Tools for phase 3: Design organisational structure

18-17
Span
of c
ontro
l
SPAN
OF
CONT
ROL
SHEE
T
Diag
nost
ic
grid
sco
re48
4746
4544
4342
4140
3938
3736
3534
3332
3130
2928
2726
2524
2322
2120
1918
1716
1514
1312
1110
9
Suggested span of control
A4
45
56
78
910
1112
1314
1516
1718
1919
2020
2020
B4
45
56
67
88
910
1011
1212
1314
1415
1616
1718
1819
1919
2020
2020
2020
D4
44
55
66
77
88
99
1010
1111
1212
1313
1414
1515
1616
1717
1818
1919
20
D4
44
55
56
66
77
88
89
910
1010
1111
1212
1213
1314
1414
1515
16
E4
44
45
55
66
67
77
88
89
99
1010
1011
1111
1212
1213
13
Chapter 18Tools for phase 3: Design organisational structure
18-18
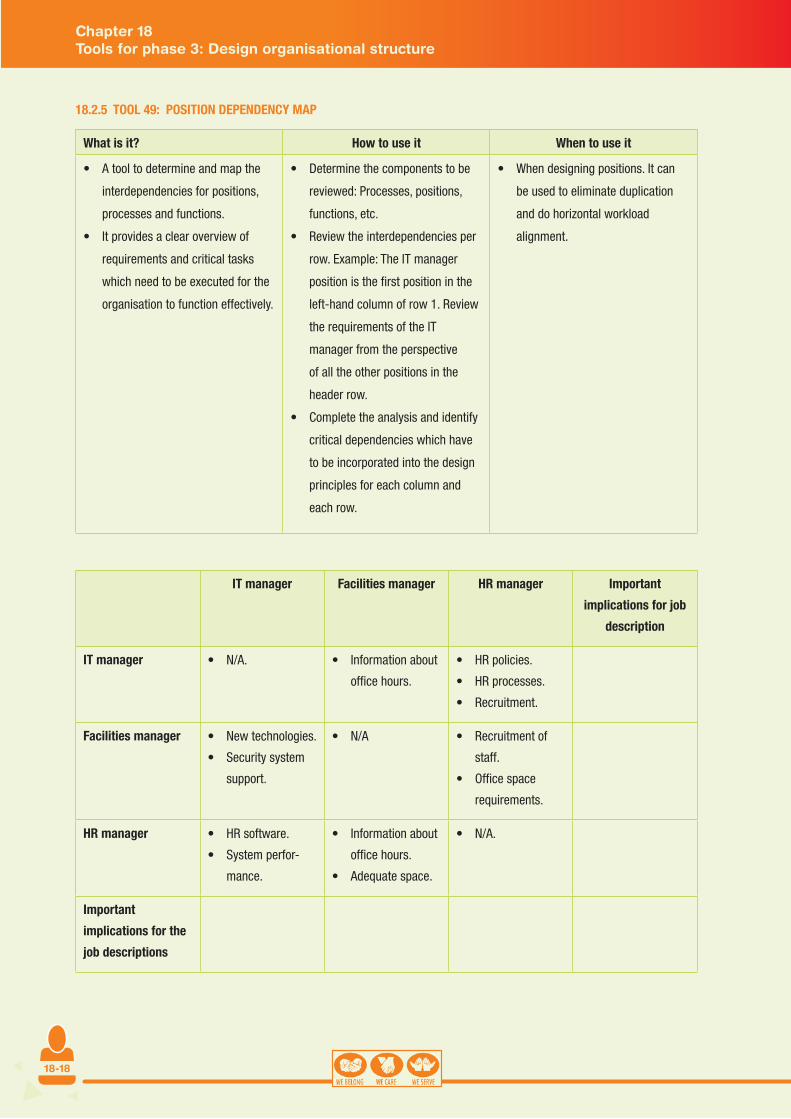
18.2.5 TOOL 49: POSITION DEPENDENCY MAP
What is it? How to use it When to use it
A tool to determine and map the
interdependencies for positions,
processes and functions.
It provides a clear overview of
requirements and critical tasks
which need to be executed for the
organisation to function effectively.
Determine the components to be
reviewed: Processes, positions,
functions, etc.
Review the interdependencies per
row. Example: The IT manager
position is the first position in the
left-hand column of row 1. Review
the requirements of the IT
manager from the perspective
of all the other positions in the
header row.
Complete the analysis and identify
critical dependencies which have
to be incorporated into the design
principles for each column and
each row.
When designing positions. It can
be used to eliminate duplication
and do horizontal workload
alignment.
IT manager Facilities manager HR manager Important
implications for job
description
IT manager N/A. Information about
office hours.
HR policies.
HR processes.
Recruitment.
Facilities manager New technologies.
Security system
support.
N/A Recruitment of
staff.
Office space
requirements.
HR manager HR software.
System perfor-
mance.
Information about
office hours.
Adequate space.
N/A.
Important
implications for the
job descriptions
Chapter 18Tools for phase 3: Design organisational structure

18-19
18.2.6 TOOL 50: RACI ANALYSIS/TASK ANALYSIS
What is it? How to use it When to use it
A task analysis based on the
RACI acronym which represents
R=responsible, A=accountable,
C=consulted and I=informed.
This is used to review responsibilities
which are then reflected in the job
descriptions.
It is also used to review horizontal
workload balance.
The task analysis uses the same
table, but expands the explanations
to include the following:
Capture. o
Evaluate. o
Execute. o
Input. o
Approve. o
Develop. o
Review/read etc.
The task analysis reviews the posi-
tion task link in more detail.
List the tasks to be performed as
part of a process (this suggests
a detailed process map: process,
procedure, task, activity).
Review the involvement of each
position with each of the tasks
by indicating either R, A, C, I or a
combination A/R.
Identify the tasks which do not
have responsibility or account-
ability OR where more than one
position has accountability and
responsibility.
Review the job descriptions based
on the information.
Standard tool for job design.
Example: RACI analysis (R=Responsible A=Accountable C=Consulted I=Informed)
Position 1 Position 2 Position 3 Position 4
Task 1 R C I A/R
Task 2 C
Task 3 I R A
Example: Task analysis
Position 1 Position 2 Position 3 Position 4
Task 1 Capture Read Approve Review
Task 2 Capture Develop Evaluate Input
Task 3 Review Approve Execute Execute
Chapter 18Tools for phase 3: Design organisational structure
18-20
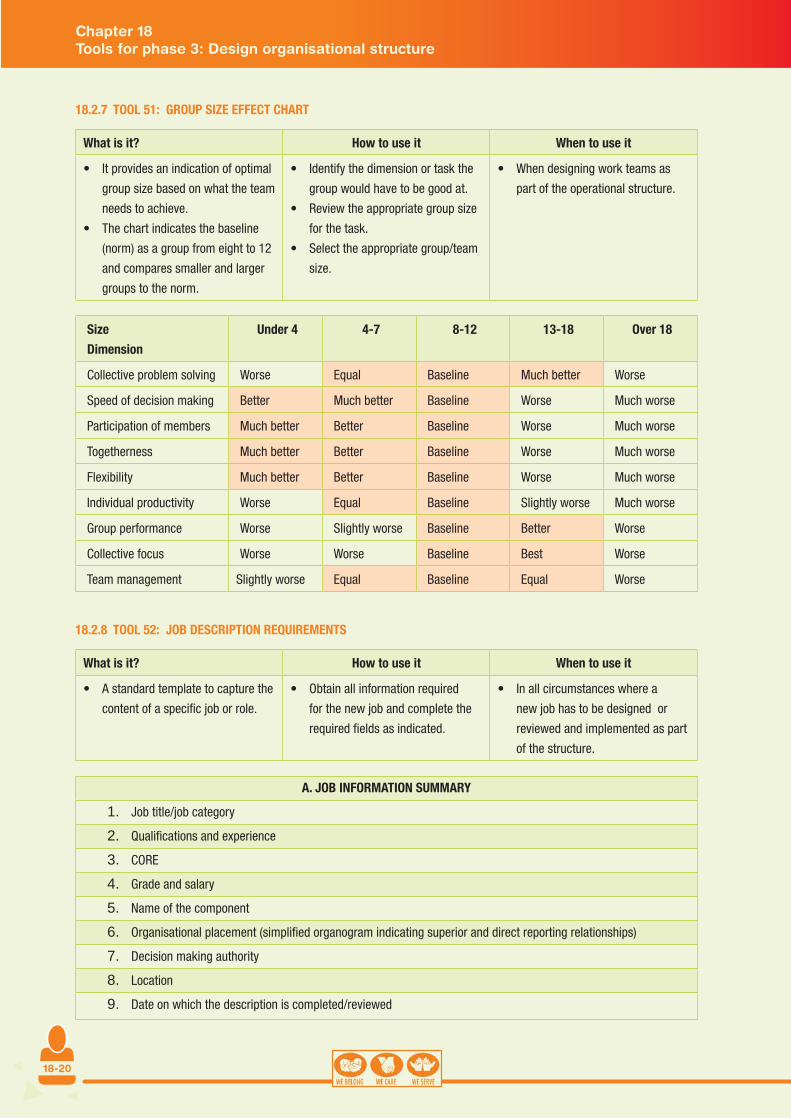
18.2.7 TOOL 51: GROUP SIZE EFFECT CHART
What is it? How to use it When to use it
It provides an indication of optimal
group size based on what the team
needs to achieve.
The chart indicates the baseline
(norm) as a group from eight to 12
and compares smaller and larger
groups to the norm.
Identify the dimension or task the
group would have to be good at.
Review the appropriate group size
for the task.
Select the appropriate group/team
size.
When designing work teams as
part of the operational structure.
Size
Dimension
Under 4 4-7 8-12 13-18 Over 18
Collective problem solving Worse Equal Baseline Much better Worse
Speed of decision making Better Much better Baseline Worse Much worse
Participation of members Much better Better Baseline Worse Much worse
Togetherness Much better Better Baseline Worse Much worse
Flexibility Much better Better Baseline Worse Much worse
Individual productivity Worse Equal Baseline Slightly worse Much worse
Group performance Worse Slightly worse Baseline Better Worse
Collective focus Worse Worse Baseline Best Worse
Team management Slightly worse Equal Baseline Equal Worse
18.2.8 TOOL 52: JOB DESCRIPTION REQUIREMENTS
What is it? How to use it When to use it
A standard template to capture the
content of a specific job or role.
Obtain all information required
for the new job and complete the
required fields as indicated.
In all circumstances where a
new job has to be designed or
reviewed and implemented as part
of the structure.
A. JOB INFORMATION SUMMARY
Job title/job category1.
Qualifications and experience 2.
CORE3.
Grade and salary4.
Name of the component5.
Organisational placement (simplified organogram indicating superior and direct reporting relationships)6.
Decision making authority7.
Location8.
Date on which the description is completed/reviewed9.
Chapter 18Tools for phase 3: Design organisational structure

18-21
B. PURPOSE OF THE JOB
The purpose is an accurate, short statement about the position’s/job’s overall purpose or reason for existence. It also serves to
give some indication about how a job can be linked to the organisation’s mission and objectives.
C. MAIN OBJECTIVES/KEY PERFORMANCE AREAS
Describe the objectives or key performance areas of the position and the associated success indicators for each objective
which must be achieved to fulfil the overall purpose of the position.
OBJECTIVE/KEY PERFORMANCE AREA TASKS (optional) PERFORMANCE INDICATORS
Example: Improved service user
satisfaction with response time and
quality of information.
% achieved on a service user
satisfaction index.
Average turnaround time on
requests.
Number of queries to manager as
a result of incorrect information.
Key performance area 1
Key performance area 2
Key performance area 3
Key performance area 4
E. INHERENT REQUIREMENTS
INHERENT REQUIREMENTS LEARNING AREAS AND INDICATORS
Technical skills: (Examples)Writing skills.Typing skills.Computer skills.Reading and language skills.Vocational skills (HR, finance, policing, firefighting, research, etc.)
Behavioural competencies: (Examples)Communication skills.Negotiation skills.Planning.Problem solving.
Knowledge areas:Any specific area of knowledge or awareness within a specific discipline.
Attributes: (Examples)Result-oriented.Patient.Service-oriented.Love for people.Detail-oriented.Quick decision making.Ability to work under pressure.
Chapter 18Tools for phase 3: Design organisational structure

18-22
F. CAREER PATH
Progression to the next higher post Progression to the next higher salary range
Name of post.
Nature of work.
Requirements.
Process to achieve the next higher position.
Next higher salary.
Requirements.
Process to achieve the next range.
18.2.9 TOOL 53: WORK SYNTHESIS
What is it? How to use it When to use it
To determine the variance between
the actual time and effort spent on
a task and the suggested time and
effort based on the job description
and responsibilities.
List all the tasks the individual
executes during a month.
List the detailed activities for each
task and determine the time spent
on the different activities per day,
which adds up to a time for the
task.
Determine the frequency of
activities per month and calculate
the effort per month on a specific
task (multiply hours by number of
days).
Determine the required effort
either by asking the person,
consulting the line manager or
content expert or a combination
of both.
Determine the variance (V) by
dividing the effort per month (E) by
the required effort (RE).
Alternative to the single-column
activity analysis. This tool may be
more appropriate for analysing
non-repetitive, high-level work.
Suggested table for this tool:
Key result
area
Tasks Detailed
activities,
volume and
frequency
of these
activities
Hours per
day
(H)
Days per
month
(D)
Effort per
month
(E)=(H)x(D)
Required
effort per
month
(RE)
Variance
V=(E)/(RE)
Chapter 18Tools for phase 3: Design organisational structure

18-23
Use
the
follo
win
g qu
estio
nnai
re to
com
plet
e th
e ab
ove
tabl
e:
PROC
ESS
EVAL
UATI
ON Q
UEST
IONN
AIRE
DA
TE:
/
/
PERS
ON(S
) INT
ERVI
EWED
: ……
……
……
……
……
……
……
……
……
……
……
……
……
……
……
……
……
……
……
……
……
……
……
……
CURR
ENT
SITU
ATIO
NSU
BSTA
NTIA
TION
ALTE
RNAT
IVE
TO-B
E
INPU
T CR
ITER
IA
Dete
rmin
e in
put/l
ink
[Doc
umen
t ref
.]
[Stru
ctur
e]
Wha
t is
need
ed?
Why
is th
is n
eede
d?W
hat e
lse
can
be p
rovi
ded/
who
els
e ca
n pr
ovid
e th
is?
Wha
t is
supp
osed
to b
e
prov
ided
/who
is s
uppo
sed
to
prov
ide
this
?
PURP
OSE
OF A
CTIV
ITY
Elim
inat
e un
nece
ssar
y ac
tivity
[Aut
horit
y/po
licy]
Wha
t is
done
?W
hy is
it d
one?
Wha
t els
e ca
n be
don
e?W
hat i
s su
ppos
ed to
be
done
?
PLAC
E OF
ACT
IVIT
Y
Com
bine
or c
hang
e pl
ace
[Geo
grap
hica
l loc
atio
n]
Whe
re is
this
don
e?W
hy is
it d
one
ther
e?W
here
els
e ca
n it
be d
one?
Whe
re is
it s
uppo
sed
to b
e
done
?
SEQU
ENCE
OF
ACTI
VITY
Com
bine
or c
hang
e tim
e or
seq
uenc
e
in p
roce
ss
[Sta
ndar
d op
erat
ing
proc
edur
e flo
w]
Whe
n is
it d
one?
Why
is it
don
e th
en?
Whe
n el
se c
an it
be
done
?W
hen
is it
sup
pose
d to
be
done
?
PERS
ON R
ESPO
NSIB
LE
Com
bine
or c
hang
e pe
rson
/uni
t
Who
is d
oing
it?
Why
is th
is u
nit d
oing
it?
Who
els
e ca
n do
it?
Who
is s
uppo
sed
to d
o it?
MET
HOD
OF W
ORK
Sim
plify
or i
mpr
ove
and
com
pute
rise
Stan
dard
ope
ratin
g pr
oced
ure
/
syst
em]
How
is th
is d
one?
Why
is it
don
e lik
e th
at?
How
els
e ca
n it
be d
one?
How
is it
sup
pose
d to
be
done
?
Chapter 18Tools for phase 3: Design organisational structure

18-24
18.2.10 TOOL 54: WORK/ACTIVITY PROCESS ANALYSIS
What is it? How to use it When to use it
A tool to review the current
practices within a specific
job or job family and identify
potential improvements.
List all the tasks the individual executes
during a specific period e.g. a day/
week/month.
Review the activities (by interviewing
subject experts) according to the review
criteria by first stating the current
situation, then understanding why
that is the situation, thirdly identifying
alternatives to the current situation and
fourthly formulating an ideal scenario
based on the alternatives.
Review criterion 1: Review the purpose
of each of the activities to determine
what is supposed to be done.
Review criterion 2: Review the
sequence of activities to determine the
best possible time and sequence to do
the job.
Review criterion 3: Review the method
utilised to identify the best way of doing
the job.
Review criterion 4: Review the actual
person or position responsible for
performing the activities.
Review criterion 5: Review the
geographic location where the work is
done to identify the best place for the
activities to take place.
Review criterion 6: Review all the input
requirements to perform the tasks to
ensure that all enablers are in place for
effective performance of the job.
When individual jobs are reviewed
with the objective of optimising
specific activities.
This tool can be used to further
review information collected
from work synthesis and process
engineering.
Chapter 18Tools for phase 3: Design organisational structure