of, va fia moderator: presenters - member | soa© oliver wyman 1313 structure of an fia with glwb an...
TRANSCRIPT

Session 126 OF, VA and FIA Hedging
Moderator:
Matthew Cheung, FSA, MAAA
Presenters: Matthew Cheung, FSA, MAAA
Bala Krishnaraj Bryan Christopher Lindsley, FSA, MAAA
SOA Antitrust Disclaimer SOA Presentation Disclaimer
© Oliver Wyman
FIA with GLWB Hedging – a Case Study
October 25, 2016
Bryan Lindsley, FSA, MAAA

11© Oliver Wyman
Agenda
1 Introductory Polling
2 FIA GLWB vs. VA GLWB Primer
3 Case Study: Hedging FIA GLWB

Introductory PollingSection 1

Do you work in your company’s hedging / capital markets or investments area?
07 November 2016
1 2 3
14%
78%
9%
1. Yes, hedging / capital markets
2. Yes, investments3. No

Are you familiar with your company’s hedging objectives and strategy?
07 November 2016
1 2
31%
69%1. Yes2. No

Please choose the option that best represents your company’s hedging strategies for guaranteed living withdrawal benefits (GLWB)
07 November 2016
1 2 3 4
27%29%
25%
20%
1. Hedge VA GLWB and FIA GLWB, both dynamically
2. Hedge VA GLWB dynamically only, hedge FIA GLWB through a non-dynamic strategy
3. Hedge VA GLWB dynamically only, do not hedge FIA GLWB
4. Other (e.g., do not offer or hedge GLWBs)

FIA GLWB vs. VA GLWB PrimerSection 2

7© Oliver Wyman 7
Risks captured in industry pricing frameworksFIA GLWB vs. VA GLWB Primer
Product Stochastic equity returns (RW)
Stochastic interest rates (RW)
RN cost of guarantees Behavioral cohorts Dynamic behavior
Base FIA FIA GLWB VA GMAB ? VA GLWB VA GMIB ?
FIA carriers typically use “stochastic real world” statutory cash flow-based value lenses, and a behavioral scenario framework similar to VA GLWBs.

Does your company perform risk neutral analysis for pricing FIA GLWBs?
07 November 2016
1 2 3 4
17%
35%33%
15%
1. Yes, we price FIAs on a market consistent basis
2. Yes, we perform this analysis to provide additional support for real world pricing
3. No4. Not certain / do not sell
FIA GLWBs

Case Study: Hedging FIA GLWBSection 3
10© Oliver Wyman 10
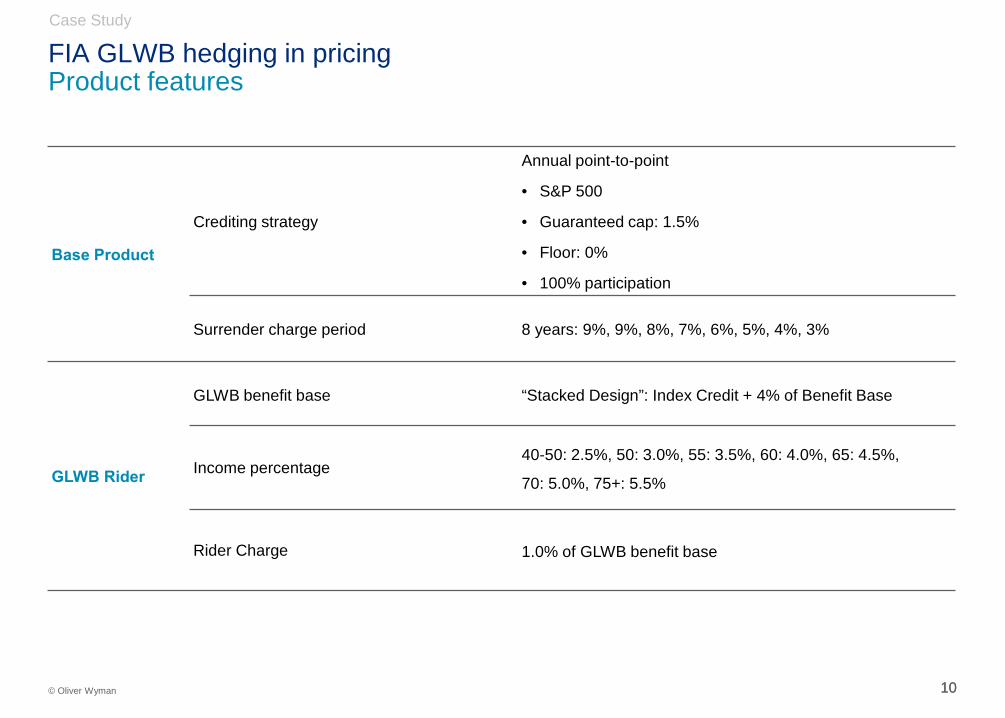
FIA GLWB hedging in pricingProduct features
Base Product
Crediting strategy
Annual point-to-point
• S&P 500
• Guaranteed cap: 1.5%
• Floor: 0%
• 100% participation
Surrender charge period 8 years: 9%, 9%, 8%, 7%, 6%, 5%, 4%, 3%
GLWB Rider
GLWB benefit base “Stacked Design”: Index Credit + 4% of Benefit Base
Income percentage40-50: 2.5%, 50: 3.0%, 55: 3.5%, 60: 4.0%, 65: 4.5%,
70: 5.0%, 75+: 5.5%
Rider Charge 1.0% of GLWB benefit base
Case Study

11© Oliver Wyman 11
FIA GLWB modelMethodology
Policyholder behaviorDynamic lapses are function of ITM of the GLWB and market interest rates
Cohort-based utilization assumption
Dynamic cap setting
Option budget based on asset net earned rate (fixed income assets only)
Cap dynamically managed to meet option budget
Indexed credit projected explicitly with emerging indexed returns
Economic assumptions
Projected level yield curve as of June 2016
1 year spot volatility:
• ATM call options: 16.5%
• OTM call options: 13.5% (10% OTM)
Index growth – 1%, 2%, and 3%
Assets and hedging
Blend of A / BBB / BB Bonds
Static call option spread to hedge the base account value (with ability to vary the portion of the
account value hedged)
Case Study

1212© Oliver Wyman
How much of the index performance should be hedged
Case Study

1313© Oliver Wyman
Structure of an FIA with GLWB An FIA with GLWB can be decomposed into a base FIA and a GLWB for persisting policyholders
Base FIA contract (surrenders or death) GLWB for persisting policyholders
OTM / ATM In-the-moneyness (“ITM”) ITM
Policyholder benefits
• Policyholder elects to surrender, or die before depleting the account value
• These benefits directly depend on index performance
• The GLWB guaranteed withdrawal grows with index credit before exercise (some dependency on index returns)
• However, after exercise the guaranteed lifetime benefit stream is certain and NOT index sensitive.
Profit sensitivity to hedge notional
• Surrender and death benefits are perfectly correlated with account value performance
• Hedging 100% of account value offsets the future benefits
• Hedging full index credit ignores that the lifetime income stream is independent of index credits after income start
• Expected profitability is greater due to risk premium in hedge, but more volatile
Case Study
Takeaway: There are basically two “cohorts” of policyholders with different hedging needs. One potential approach to deal with lesser hedging needs on the lifetime income stream is to reduced the proportion of account value hedged.

14© Oliver Wyman 14
Case study resultsThe investment income exhibits greater sensitivity than future policyholder benefits when 100% of the account value is hedged
Case Study
Equity Return NPV @ 3% ∆ in NPV Years 1-5 6-10 11-15 16-20 21-30 31+
1.0% 446.5 26.2 124.4 145.1 115.6 197.7 155.0
2.0% 483.8 37.4 26.7 136.9 159.5 122.3 213.8 169.5
3.0% 525.1 41.3 27.4 150.1 177.7 133.7 228.3 179.1
Policyholder Benefits*
Investment Income, Fixed Income and Option Gains (100% of index credit hedged)
1.0% 244.3 59.4 76.0 58.5 50.8 79.9 44.6
2.0% 312.8 68.5 80.2 104.3 77.6 62.3 88.5 48.5
3.0% 387.9 75.1 101.3 135.9 100.0 76.7 97.2 51.1
1.0% 260.1 65.2 82.7 63.1 53.3 80.5 44.6
2.0% 312.4 52.2 79.9 103.7 77.9 62.6 88.6 48.5
3.0% 369.2 56.8 94.8 127.4 95.1 73.8 96.3 51.1
*Results (thousands) produced using $500K of premium for a 57 year old modeling point with behavioral cohorts for withdrawal delay
Investment Income, Fixed Income and Option Gains (70% of index credit hedged)

15© Oliver Wyman 15
Case study results (continued)When pricing on a real world statutory distributable earnings basis hedging 100% of account value introduces volatility in the IRRs and produces a higher mean IRR
Case Study
Percent of index credit hedged
Equity Return 70% 100%
1.0% 7.3% 5.5%
2.0% 7.2% 7.3%
3.0% 7.1% 9.1%
Average 7.2% 7.3%
IRRs based on 60 year projection period

16© Oliver Wyman 16
What Next?The case study illustrated the impact of reducing the index hedge position through a simple approach, what other modeling decisions / risks should be considered
Case Study
Item Rationale / comments
Refine hedge notional target
• The case study used a simple approach of hedging 70% of the index credit, however more detailed analysis can lead to implementing a more exact hedging strategy
• Perform holistic analysis on cohorts of model points (percentage which die before account value depletion, lapse before account value depletion and enter claim status). This analysis can provide additional insight into setting hedge notional amount
• Explore dynamic formula for setting the hedge notional based on contract in-the-moneyness, time to AV depletion and age; test formula along stress scenarios and stochastic scenarios to measure performance
Consider interest rate sensitivity andintegration with broader ALM
• Does ALM strategy with bond assets sufficiently duration and convexity match the liability?
• Is the policyholder dynamic lapse assumption sufficiently sensitive to interest rates (both base contract and GLWB present value)
• Analyze tail scenarios to measure profitability impact due to varying interest rate scenarios and determine if initial action is needed

1717© Oliver Wyman
Takeaways
1 Hedging FIA GLWB vs. hedging VA GLWB
2 FIA GLWB hedging can be formulated in terms of the quantity of based contract hedging to implement
3 The FIA GLWB hedging strategy will impact pricing results and emerging profitability

Bala KrishnarajVA HedgingOct 25, 2016

VA Hedging
19

Align Enterprise level risk appetite to wider strategic goals of the firm
Risk appetite then drives how to identify & manage risks in every business unit including VA
Identification then defines how to measure and quantify risk tolerances
This then leads to defining the risk limits, the strategy, the hedging team & the system capabilities
Monitor, attribute and report various metrics & risk limits for the VA hedging program
VA Hedging Program:A Top Down Approach
20
Identify
Quantify
Mitigate
Monitor
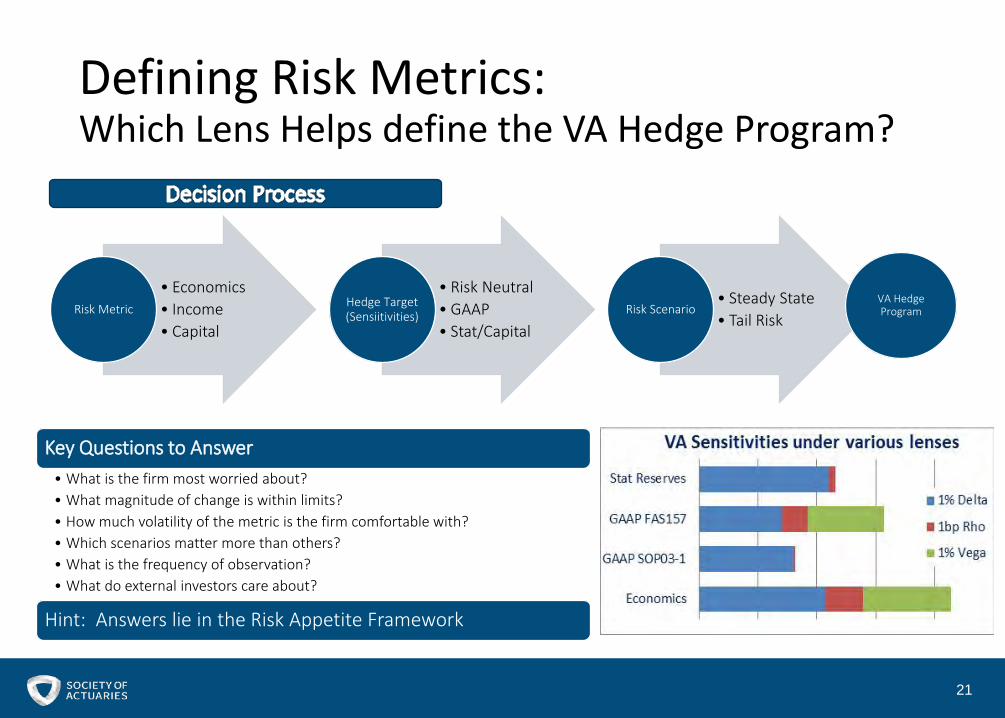
Defining Risk Metrics:Which Lens Helps define the VA Hedge Program?
21
• Economics• Income• Capital
Risk Metric
• Risk Neutral• GAAP• Stat/Capital
Hedge Target (Sensiitivities)
• Steady State• Tail Risk
Risk ScenarioVA Hedge Program
Key Questions to Answer• What is the firm most worried about?• What magnitude of change is within limits?• How much volatility of the metric is the firm comfortable with?• Which scenarios matter more than others?• What is the frequency of observation?• What do external investors care about?
Hint: Answers lie in the Risk Appetite Framework

VA Risk Identification
22
Typically Addressed1 Typically Un-Addressed1
TypicallyModeled
• Equity(level & vol)• Rates (level & vol2)
• Policyholder behavior (lapses/withdrawals/utilization)• Mortality• Correlation
TypicallyNot modeled
• FX (level) • Basis Risk (Tracking Error)• FX (volatility, carry)• Credit (SA Fixed, Balanced & VC)• Correlation changes & Cross Effects• Vol Controlled fund (gap risk & second gamma)Business Risks typical for all insurance products:• Operational risk• Adverse Selection• Market, Statutory, Accounting & Derivative Regime changes• Management actions/Reinsurance• Transaction, Margin costs etc
• Each modeling framework(pricing/hedging, statutory reserves/capital) has a different representation of the above risks
• Healthy feedback needs to happen between risk identification and modeling
1 Addressed can be read as priced/hedged, but wide variety of practice exists on what and how much of these risks are hedged2 Rate Volatility is generally modeled as stochastic interest rate scenarios and partially addressed if hedged using interest rate options

What is your firm’s primary hedge target for VA?
07 November 2016 1 2 3 4 5 6
40%
12% 12%14%
9%
14%
1. GAAP2. IFRS3. Economic claims4. Economic claims less
fees5. Statutory or Rating
Agency Capital6. Other

Does your firm hedge VA credit risk?
07 November 2016 1 2 3
17%
69%
14%
1. Yes2. No, but investigating3. No
(No immediate plans)

Credit Spread Risk
25
Characteristics of credit spreads• Has been relatively stable since financial crisis• Distribution has a very long tail • Correlated to equities during tail events in the past
Credit Risk sources in VA products• General Account: • Generally a smaller contributor• Addressed via C1 capital factors in capital
• Separate Account:• Fixed income funds• Balanced funds• Volatility control funds (if the low vol asset is a bond fund)• EM funds (Sovereign credit)
Interaction of credit risk with VA• Credit spread is not typically modeled in risk neutral valuations or capital unless sophisticated integrated credit spread
scenarios are used• Harder to attribute during “normal” times when spread don’t contribute much to VA metric changes• Relative size of credit spread risk is smaller compared to pure interest rate risk during normal times• Credit Spread widening is explicitly defined in Fed Stress Test Scenarios & can cause huge capital requirements during stress

Credit Spread Hedging ConsiderationsSizing
• Requires sophisticated modeling • Integrated credit scenarios, rate-equity-credit correlation, with emphasis on tail correlation• Modeling SA bond funds for rates & credit impacts – with parameters derived from actual fund performance (US IG,
US HY, International, Credit Spread duration)• Modeling cross impacts from policyholder behavior and other equity funds
• Requires stress scenario projection with sufficient resolution in the tails• Ability to quantify risk under various metrics
Mitigation• Accept the risk• Hold extra capital for tail protection • Need to consider impact on ROC & Distributable Capital during non-stress times• Need to consider impact during correlated tail events
• Hedge
Monitoring• Determine the metrics where credit risk is represented• How frequent is it measured?• What is the tolerance allowed for impact of credit spread?• External Reporting Requirements/norms
26

Credit Spread Hedge Strategy
27
TRS on Barclays US Agg Bond Index ($bln)(from Schedule DB Filings for Insurers Q1 2016 Insurer
AInsurer
BInsurer
C Insurer DInsurer
E3.9 3.7 1.3 0.8 0.8
Hedge Strategy Decisions:•Choice of instruements•Active/Passive hedge• Frequency of rebalancing
Depends on
Choice of Instruments•Effectiveness•Cost of carry• Liquidity•Reporting requirements etc•Asset Valuation•Collateral Requirements
CDX Index Swap TRS on Bond Index Equity VolInstruments
Example Swap on CDX.NA.IG index
TRS or Duration Hedged swap on Barclays US AggBond Index
Rolling VIX calls or equity puts
OTC/ Cleared Centrally Cleared OTC OTC or Centrally Cleared
RiskRepresented
Credit spread risk of a published index that references a basket of corporate IG/HY bonds
OAS risk of a published index of a mixture corp and securitized instruments
Short term equity volatility spike
Liquidity/ Price discovery
Highly liquid Less liquid Highly liquid
Effectiveness May reference a set of bonds that may not relate to actual VA risk
Most fixed income funds are indexed to a bond index and may be highly effective for portions of the risk
Depends on the correlation realized between credit spreads widening and equity volatility spikes
Typical hedge instruments used to hedge credit spreads

Final Thought:How much knowledge of past crisis should be reflected in projection systems & future risk modeling?
28

Variable Annuity –Impact of Regulatory and GAAP Changes on Hedging10/25/2016
Matt Cheung, FSA, MAAA

Disclaimer
30
The materials in this document represent the opinion of the author at the time of authorship; they may change, and are not representative of the views of Milliman or its parents, subsidiaries, or affiliates. Milliman does not certify the information, nor does it guarantee the accuracy and completeness of such information. Use of such information is voluntary and should not be relied upon unless an independent review of its accuracy and completeness has been performed. Materials may not be reproduced without the express consent of Milliman.

Introduction
Stat Changes - How did we get here?• The original intent of the study was to look at the use of captives within the VA industry• The focus became how to change the existing reserve and capital framework to remove the
motivations for using captives.
Currently, captives:• Allow LOC’s to be used in the funding of reserves. RBC C3P2 requirements do not apply
to captives.• Are used to avoid volatility in statutory capital ratios that arise from the current reserve and
capital framework, and not the base reserve and capital requirements themselves.• Provide flexibility to better align statutory sensitivities to those of the hedging program.
31DRAFT - FOR DISCUSSION PURPOSES ONLY

Funding Requirement Framework
32DRAFT - FOR DISCUSSION PURPOSES ONLY
Current Framework
• Stat Reserves = (Max(AG43 CTE70, AG43 SSA) + Voluntary Reserves)
• C3 = Max(C3P2 CTE90, C3P2 SSA) – Stat Reserves
• Funding Requirement = Max(Rating Agency TAR level, RBC multiplier x C3 + Stat Reserves)
Proposed Framework• Stat Reserves = Max(CTE70, SSA1, SSA2, SSA3) + Voluntary Reserves• C3 = 0.25 x (CTE98 – Stat Reserves) x 0.65 - (Stat. Reserves – Tax Reserves ) x 0.35• Funding Requirement = Max(Rating Agency TAR level, RBC multiplier x C3 + Stat
Reserves)
The way the RBC multiplier is applied in the current framework results in a volatile total funding requirement, as differences between reserve and C3P2 requirement changes are amplified.

Proposed Stat Framework Changes Key Framework Changes Affecting Statutory Sensitivities:
• The SSR’s equity return recovery rate after the initial down shock will be based on the forward curve.
• The SSR will no longer use a locked-in Discount Rate.
• The MRP formula used to determine the mean reversion target levels will dampen the impact of rate changes on CTE interest rate scenarios. In a Total Return equity model, changes in rates will not impact the equity scenarios.
• Updates to the SSR dynamic policyholder behavior assumptions are expected to increase the equity sensitivity of the calculation. Reflecting actual margins and expenses would also increase the equity sensitivity of SSR.
33DRAFT - FOR DISCUSSION PURPOSES ONLY
Changes to US GAAP for VA’s Currently, GMAB’s, GMIB’s, GMWB’s (and for some companies, a portion of GLWB’s) are
accounted for under SOP 03-1.
Under the proposed changes, all GMXB’s would be measured at fair value.
The equity and interest rate sensitivities of these GAAP liabilities would increase relative to what they are currently. This would encourage companies to re-think their hedging strategies (especially when taken together with the upcoming Stat changes).
Not many details yet, but an exposure draft is expected soon.
Expectation is that this change is still 3 years out.
34DRAFT - FOR DISCUSSION PURPOSES ONLY

Key Takeaways General expectation is that equity and interest rate sensitivities will be increasing on both a
GAAP and STAT basis given the impending regulation changes.
Work needs to be done to not only understand the initial reserves/requirements but also on the new sensitivities of those items in order to assess whether the existing strategy will be sufficient given the company’s risk appetite.
35DRAFT - FOR DISCUSSION PURPOSES ONLY