ofasa_evaluation of flared gas utilization for enhanced oil
TRANSCRIPT

OFASA ABUNUMAH
MSc. Petroleum and Environmental Technology Diploma Accounting and Business BSc. Chemical Engineering (SPE, SEG, AAPG, ACCA, NIM, )
January 2014
EVALUATION OF FLARED GAS UTILIZATION FOR ENHANCED OIL RECOVERY: APPLICABILITY AND
POTENTIAL IN NIGERIA
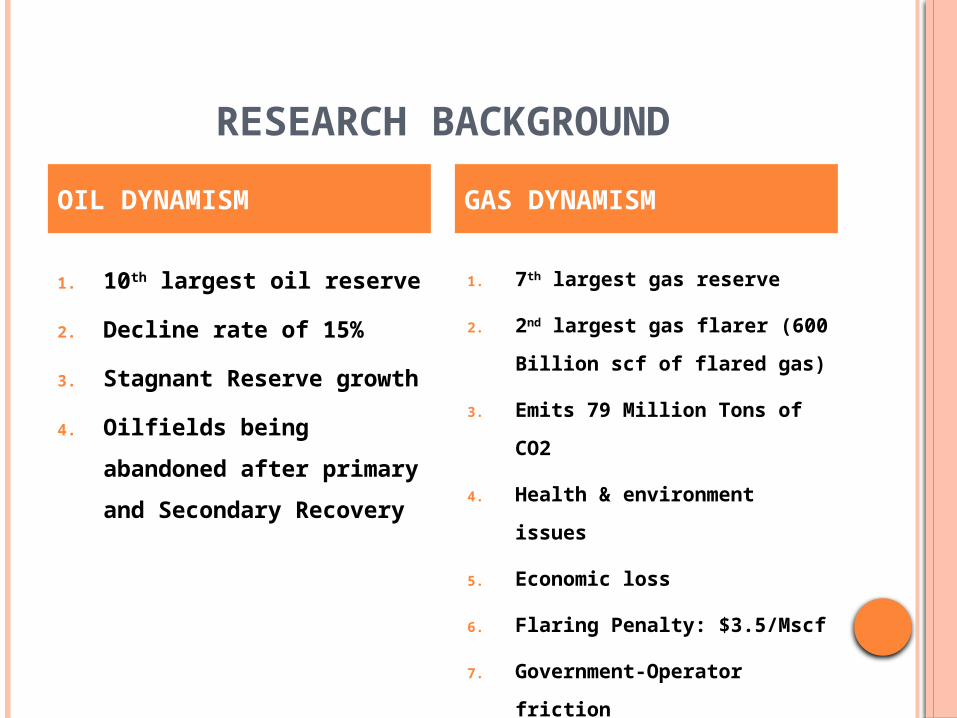
RESEARCH BACKGROUND
1. 10th largest oil reserve
2. Decline rate of 15%
3. Stagnant Reserve growth
4. Oilfields being abandoned after primary and Secondary Recovery
1. 7th largest gas reserve
2. 2nd largest gas flarer (600 Billion scf of flared gas)
3. Emits 79 Million Tons of CO2
4. Health & environment issues
5. Economic loss
6. Flaring Penalty: $3.5/Mscf
7. Government-Operator friction
OIL DYNAMISM GAS DYNAMISM
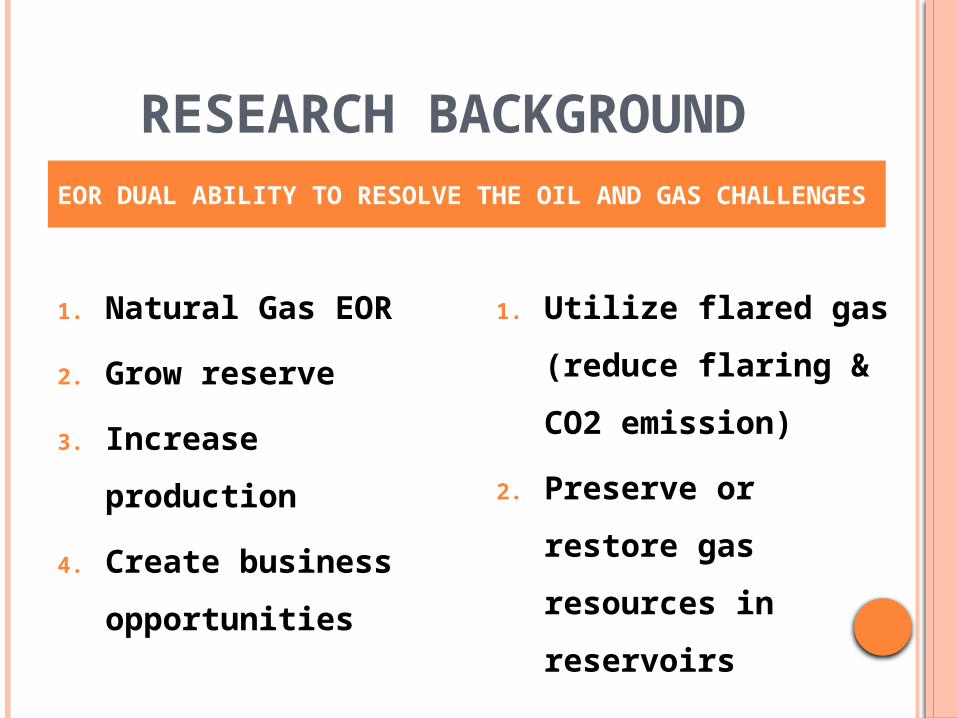
RESEARCH BACKGROUND
1. Natural Gas EOR
2. Grow reserve
3. Increase production
4. Create business opportunities
1. Utilize flared gas (reduce flaring & CO2 emission)
2. Preserve or restore gas resources in reservoirs
EOR DUAL ABILITY TO RESOLVE THE OIL AND GAS CHALLENGES

AIM & OBJECTIVES
1. Evaluate the mechanisms and applicability of Gas EOR in Nigeria oil plays.
2. Categories Nigeria oil fields by EOR technologies using the economic and technical screening criteria
3. Run an EOR simulation to determine incremental oil recovery and scale up the project to cover the 193 oilfields in Nigeria.
4. Conduct a sensitivity analysis to evaluate economic optimization of a gas EOR project.
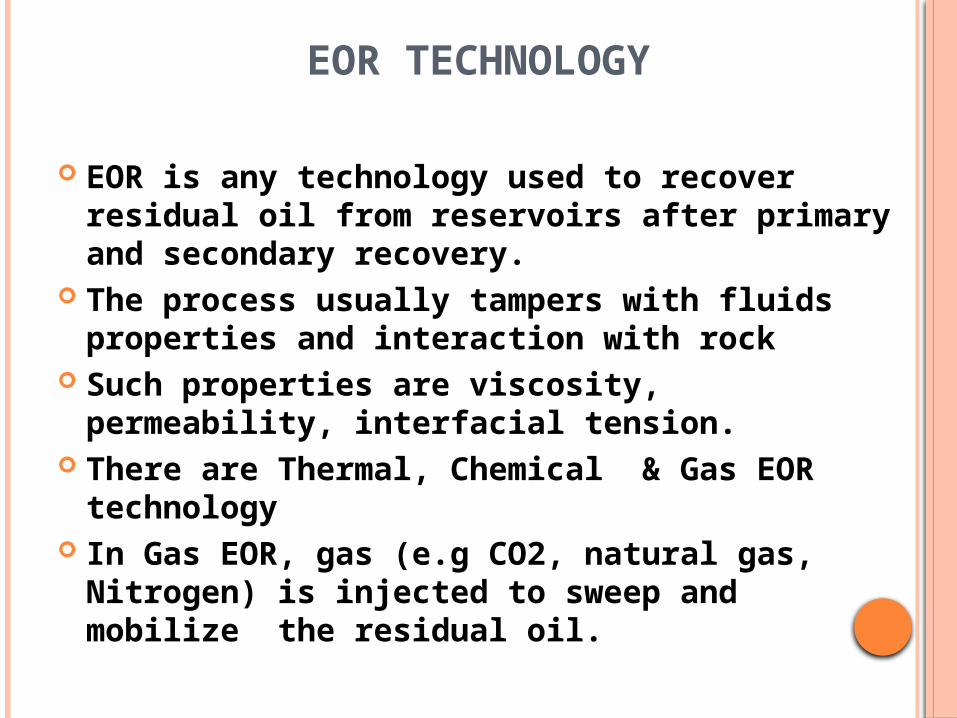
EOR TECHNOLOGY
EOR is any technology used to recover residual oil from reservoirs after primary and secondary recovery.
The process usually tampers with fluids properties and interaction with rock
Such properties are viscosity, permeability, interfacial tension.
There are Thermal, Chemical & Gas EOR technology
In Gas EOR, gas (e.g CO2, natural gas, Nitrogen) is injected to sweep and mobilize the residual oil.

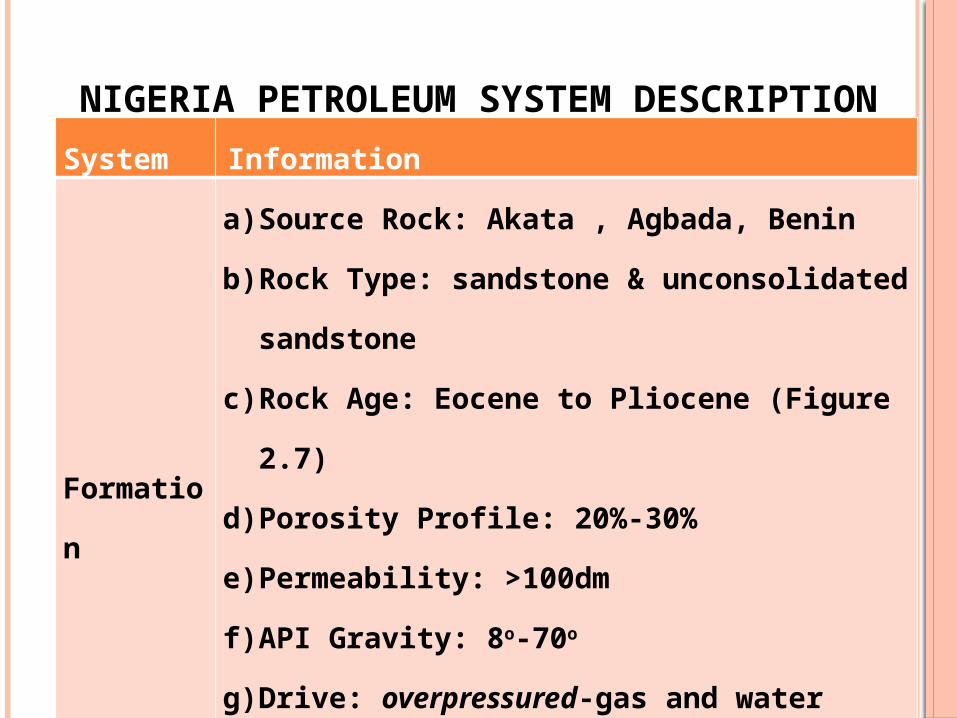
NIGERIA PETROLEUM SYSTEM DESCRIPTION
Table 1. Nigeria petroleum system description
System Information
Geological Overview
a) Name: The Niger Delta Basin
b) Location: Gulf of Guinea
c) Size: 75,000KM2
d) Sediment-
volume: 500,000 km3
thickness: 10 km
NIGERIA PETROLEUM SYSTEM DESCRIPTION
System Information
Formation
a) Source Rock: Akata , Agbada, Benin
b) Rock Type: sandstone & unconsolidated sandstone
c) Rock Age: Eocene to Pliocene (Figure 2.7)
d) Porosity Profile: 20%-30%
e) Permeability: >100dm
f) API Gravity: 8o-70o
g) Drive: overpressured-gas and water expansion
h) Reservoir depth profile: 2000-3500m

NIGERIA PETROLEUM SYSTEM DESCRIPTION
System Information
Reserve Statistics
(Billion bbl)
Remaining Reserves: 37
Cum. Production: 30
URR (@30% RF): 67
Est. OOIP (URR/RF): 223
Est. ROIP 193
EOR Target: 156

NIGERIA PETROLEUM SYSTEM DESCRIPTION
System Information
2013 E&P Statistics
a) Oil production: 2.3 Million bblb) Total gas production: 2.6 Trillion scfc) Flared gas: 600 Billion scf
d) CO2 Production: 79 Million ton
e) Current Reserve Life: 43 years
f) Active wells: 2,200g) Active rigs: 44h) Oilfields: 606

MAP OF THE NIGER DELTA OIL SYSTEM

RESEARCH METHOD & JUSTIFICATION
Evaluation Method
Study Area Selection based on active oil production
EOR Screening Taber et al. (1997), Aldasani and Bai (2005),
Analogous
Data Source NNPC, DPR, OPEC, U.S EIA
Reservoir Simulator
EORgui
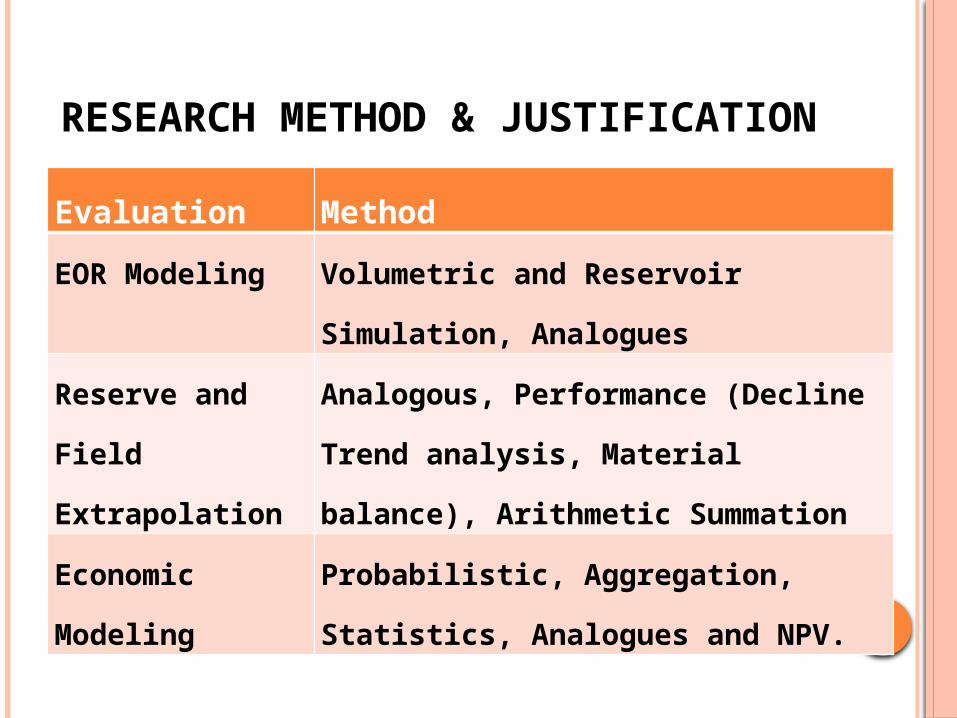
RESEARCH METHOD & JUSTIFICATION
Evaluation Method
EOR Modeling Volumetric and Reservoir Simulation,
Analogues
Reserve and Field
Extrapolation
Analogous, Performance (Decline Trend
analysis, Material balance), Arithmetic
Summation
Economic Modeling Probabilistic, Aggregation, Statistics,
Analogues and NPV.

RESEARCH RESULTS

RESERVOIR CATEGORISATION BY EOR TECHNOLOGY
Chemical EOR=3
Gas EOR =0
Thermal EOR=6
12
5
158
Figure 3.1 Nigeria Oilfields and their EOR Technology Candidature

EVALUATION OF 170 OILFIELDS
1. In Situ- utilize flared gas for onsite EOR only
2. Aggregation- central gathering & redistribution of flared gas to oilfields based on EOR needs
1. 95 oilfield are gas deficient
2. 65 oilfields are gas sufficient with gas surplus
UTILIZATION MODELS OBSERVATION

RESEARCH RESULTS
Table 1 Summary of Economic Evaluation and Opportunity Cost of Natural Gas EOR Project Decision
Model
Application of the 4,009,525 M ton of gas originally due for
flaring
Incremental
Oil
Gas EOR
Revenue
Gas EOR
Cost
Economic Implications
Cashflow
Opportunity Cost /
Differential benefit
Gas Utilised
(in scf)
Balance Gas
Flared
Gas Flaring
Reduction
Flaring
Penalty
($3.5/Mscf)
Gov Tax
(43%) +
Penalty
Opperator
Profit -
Penelty Gov Operator
M Ton M Ton % $ M M bbl $ M $ M $ M $ M $ M $ M
Status Quo 0 4,009,526 0% 69,471,982 0 0 0 69,471,982 (69,471,982) (266,368,032) (458,879,477)
In Situ 826,970 3,182,556 21% 55,143,289 3,514,624 527,193,534 298,743,003 153,377,018 75,073,514 (182,462,996) (314,333,982)
Aggregation
2,625,330 1,384,195 65% 23,983,584 11,157,654
1,673,648,09
9 948,400,589 335,840,013 389,407,496 182,462,996 314,333,982

Table 2 Economic and sensitivity analysisParamete
rs DISCOUNT OIL PRICE PROD COST TAX EOR RF
Scenario Low Base High Low Base High Low Base High Low Base High Low Base High
ECONOMIC AND SENSITIVITY ANALYSES
EOR
PROD.
(bbl)11 11 11 11 11 11 11 11 11 11 11 11 6 11 17
REVENUE 1,650 1,650 1,650 825 1,650 2,475 1,650 1,650 1,650 1,650 1,650 1,650 825 1,650 2,475
COST ($) 935 935 935 935 935 935 467.5 935 1402.5 935 935 935 467.5 935 1402.5
GROSS
INC ($)
715
715
715
(110)
715
1,540
1,183
715
248
715
715
715
358
715
1,073
DF
GROSS ($)
97
16
3
(2)
16
34
26
16
5
16
16
16
8
16
24
GOV TAX
($)
31
5
1
(1)
5
11
8
5
2
3
7
13
3
5
8
OPERATO
R ($)
66
11
2
(2)
11
23
18
11
4
13
9
3
5
11
16
SENSITIV
ITY614% 100% 19% -15% 100% 215% 165% 100% 35% 145% 100% 32% 50% 100% 150%
SENS Op 514% 0% -81% -115% 0% 115% 65% 0% -65% 45% 0% -68% -50% 0% 50%
SENS Gov 514% 0% -81% -115% 0% 115% 65% 0% -65% -60% 0% 90% -50% 0% 50%
Cost 57% 57% 57% 113% 57% 38% 28% 57% 85% 57% 57% 57% 57% 57% 57%
GOV. 14% 14% 14% -4% 14% 20% 23% 14% 5% 7% 19% 35% 14% 14% 14%
OPERAT
OR 29% 29% 29% -9% 29% 42% 49% 29% 10% 36% 25% 8% 29% 29% 29%

ECONOMIC SENSITIVITY
Low
Base
High
Low
Base
High
Low
Base
High
Low
Base
High
Low
Base
High
DISCOUNT OIL PRICE PROD COST TAX EOR RF
-20%
-10%
0%
10%
20%
30%
40%
50%
60%
Gov. Operator
Figure 2 Distribution of revenue from a unit EOR barrel
Reve
nue
shar
e pe
r EO
R ba
rrel
Discount rate
Oil Price
Prod CostTax Rate
EOR RF
Low Base High
Figure 3 Sensitivity of EOR Projects to Economic Pa-rameters. Most sensitive to discount rate.
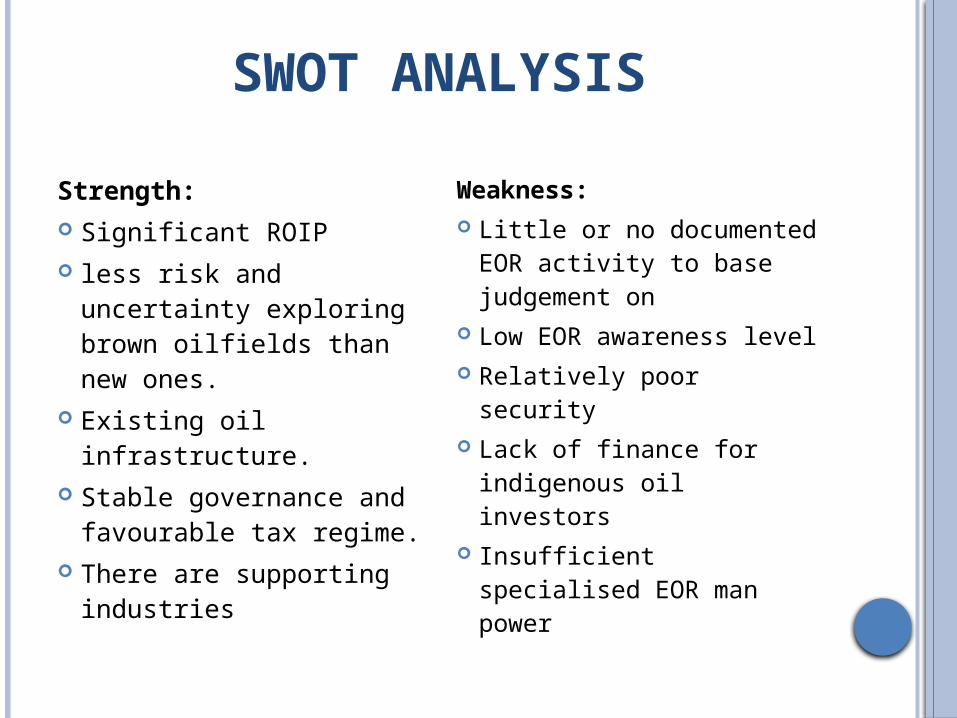
SWOT ANALYSISStrength: Significant ROIP less risk and
uncertainty exploring brown oilfields than new ones.
Existing oil infrastructure.
Stable governance and favourable tax regime.
There are supporting industries
Weakness: Little or no
documented EOR activity to base judgement on
Low EOR awareness level
Relatively poor security Lack of finance for
indigenous oil investors Insufficient specialised
EOR man power

SWOT ANALYSISOpportunities: Available and
expanding oil market
Presence of IOC OPEC membership,
new Petroleum Industrial bill
Implementation of Local Content law
Threats: Reduced market
share in North America
EOR scepticism by operators and implementation delay may lead to ineffective EOR

RESULT SUMMARY1. Oilfields Suitable for EOR: 1702. Gas EOR Recovery Factor of ROIP: 15%3. Potential throughput of ModelsIn Situ: 3.5 Billion bbl oil & 21% less flaring Aggregation: 11 Billion bbl & 65% less flaring

CONCLUSION & RECOMMENDATION
EOR technology has the ability to address the oil reserve and gas flaring challenges in the Nigeria petroleum system.
The process is technically and commercially viable.
The government and operators should engage in more proactive collaboration based on the findings of this research.


PROJECT/RESEARCH HISTORYCoventry University, United Kingdom New Model for Oil Price Prediction Using: Historic Data, Statistics and
Probability, Transient Time Analysis (2014) Environmental and Economic Impact of Gas Flaring in the Niger Delta: The
Role of Enhanced Oil Recovery (2013) Evaluation of Enhanced Oil Recovery: Applicability and Potential in Nigeria
(2013)
Hiladol Limited/Ministry of Petroleum Resources NNPC Towers, Nigeria Design of Digital Template for the Compendium of Petroleum Statistics (2012) Digital Template for Nigeria Gas Aggregator (2009) Design of the National Petroleum Data Centre (2009)
University of Port Harcourt, Nigeria Adsorption of Acetic Acid by Palm fruit Fibre (2006) Design of a Plant to Produce 100 tons/day of Drilling Mud from Local Bentonite
Clay (2006)