ofcom 2012 4g 2nd consultaton - real-wireless-cost-analysis
DESCRIPTION
Real Wireless Consulting Group Cost Analysis of 4G Services for UK Telecom RegulatorTRANSCRIPT

Technical analysis of the cost of extending an 800 MHz mobile broadband coverage obligation for the United Kingdom
Produced by Real Wireless on behalf of Ofcom
Existingsites
95% 98%
Issued to: Ofcom
Issue date: January 2012
Version: v1.01
Real Wireless Ltd PO Box 2218 Pulborough t +44 207 117 8514 West Sussex f +44 808 280 0142 RH20 4XB e [email protected] United Kingdom www.realwireless.biz

Cost of extending 800 MHz mobile broadband coverage obligation for the UK 2
Table of Contents 1 SUMMARY OF THE MOTIVATION, AIMS AND OUTCOME OF OUR STUDY ...................... 4
1.1 OFCOM HAS SUGGESTED A COVERAGE OBLIGATION ON A HOLDER OF 800 MHZ SPECTRUM, WHILE OTHERS
HAVE SUGGESTED EXTENDING THE OBLIGATION TO MORE OF THE UK .............................................................................4
1.2 THE COST OF DELIVERING MOBILE COVERAGE IN RURAL AREAS IS UNCERTAIN AND SENSITIVE TO THE
POPULATION AND TERRAIN IN SPECIFIC AREAS ............................................................................................................5
1.3 OFCOM WISH TO UNDERSTAND THE WAY IN WHICH THE COSTS OF EXTENDING MOBILE COVERAGE VIA 800
MHZ VARIES WITH THE POPULATION SERVED, THE METHOD USED TO PROVIDE COVERAGE AND THE SPECTRUM USED .............7
1.4 WE HAVE ADOPTED A DETAILED COVERAGE CALCULATION AND NETWORK PLANNING METHODOLOGY TO MEET
OFCOM’S NEEDS AND TO ADEQUATELY DETERMINE THE IMPACT OF ALL RELEVANT PARAMETERS .........................................8
1.5 COVERAGE LEVELS BASED ON 800 MHZ LTE AT EXISTING OPERATOR SITES VARY DEPENDING ON THE REGION
EXAMINED 11
1.6 THE COST OF EXTENDING THE COVERAGE OBLIGATION INCREASES STEEPLY WITH THE POPULATION SERVED AND
TARGET THROUGHPUT LEVEL, BUT MAY BE MINIMISED VIA AN APPROPRIATE CHOICE OF SITE TYPES AND BANDWIDTHS ........ 11
1.7 OUR RESULTS LEAD US TO A NUMBER OF KEY FINDINGS REGARDING THE COST OF THE POTENTIAL 800 MHZ
COVERAGE OBLIGATION WHICH OFCOM SHOULD CONSIDER IN THEIR POLICY ANALYSIS ................................................... 13
2 A CUSTOMISED TECHNICAL MODEL HAS BEEN DEVELOPED, BASED ON ESTABLISHED PRINCIPLES AND USING APPROPRIATE TECHNICAL AND COST PARAMETERS .................... 15
2.1 MODEL OVERVIEW ....................................................................................................................... 15
2.2 INPUT PARAMETERS ...................................................................................................................... 18
2.2.1 Clutter data .............................................................................................................................. 18
2.2.2 Terrain data ............................................................................................................................. 19
2.2.3 Propagation model .................................................................................................................. 20
2.2.4 Mobile network operator site data .......................................................................................... 22
2.2.5 Postcode data (coverage metric) ............................................................................................. 22
2.3 LINK BUDGETS .............................................................................................................................. 22
2.4 CAPACITY .................................................................................................................................... 26
2.5 STUDY REGION SELECTION .............................................................................................................. 27
2.6 ALTERNATE TOPOLOGIES ................................................................................................................ 30
2.6.1 Standard macrocells ................................................................................................................ 30
2.6.2 Window ledge CPE ................................................................................................................... 31
2.6.3 Outdoor community cell .......................................................................................................... 34
2.7 COST MODELLING ......................................................................................................................... 35
2.8 LIMITATIONS OF OUR MODELLING APPROACH .................................................................................... 36
3 COVERAGE DELIVERED BY EXISTING SITES VARIES BY REGION AND ACCORDING TO THE SPECTRUM AVAILABLE ................................................................................................... 38
3.1 EXISTING LTE COVERAGE ............................................................................................................... 38

Cost of extending 800 MHz mobile broadband coverage obligation for the UK 3
4 THE COST OF EXTENDING COVERAGE INCREASES STEEPLY WITH THE EXTENT OF COVERAGE BUT CAN BE SIGNIFICANTLY REDUCED BY APPROPRIATE CHOICE OF BANDWIDTH, CELL TYPE AND DEVICE TYPE ..................................................................... 41
4.1 COST OF EXTENDING COVERAGE: WALES STUDY AREA, MACROCELLS AND COMMUNITY CELLS .................... 42
4.2 COST OF EXTENDING COVERAGE: WALES STUDY AREA, IMPACT OF BANDWIDTH ...................................... 46
4.3 COST OF EXTENDING COVERAGE: WALES STUDY AREA, IMPACT OF TRANSMIT POWER............................... 49
4.4 COST OF EXTENDING COVERAGE: WALES STUDY AREA, IMPACT OF THROUGHPUT OBLIGATION ................... 51
4.5 COST OF EXTENDING COVERAGE: WALES STUDY AREA, IMPACT OF USE OF HYBRID OF COMMUNITY CELLS AND
WINDOW LEDGE CPE ......................................................................................................................................... 53
4.6 COST OF EXTENDING COVERAGE: COMPARISON AMONGST STUDY REGIONS ............................................ 55
4.7 COMPARISON OF EXTENDED COVERAGE BETWEEN GSM VOICE AND LTE DATA ....................................... 59
5 OUR RESULTS ALLOW US TO DRAW A NUMBER OF CONCLUSIONS REGARDING THE COSTS OF EXTENDING MOBILE BROADBAND COVERAGE ................................................. 61
6 ANNEX 1: DETAILS OF STUDY REGIONS ...................................................................... 65
6.1 REGION 1 - MID AND NORTH WALES .............................................................................................. 65
6.1.1 Summary statistics ................................................................................................................... 65
6.1.2 Overview maps......................................................................................................................... 66
6.2 REGION 2 - SOUTH WEST NORTHERN IRELAND ................................................................................. 67
6.2.1 Summary statistics ................................................................................................................... 67
6.2.2 Overview maps......................................................................................................................... 67
6.3 REGION 3 - SOUTHERN SCOTLAND .................................................................................................. 68
6.3.1 Summary statistics ................................................................................................................... 68
6.3.2 Overview maps......................................................................................................................... 69
6.4 REGION 4 - NORTHERN ENGLAND ................................................................................................... 70
6.4.1 Summary statistics ................................................................................................................... 70
6.4.2 Overview maps......................................................................................................................... 71
7 ANNEX 2: LINK BUDGETS ........................................................................................... 73

Cost of extending 800 MHz mobile broadband coverage obligation for the UK 4
1 Summary of the motivation, aims and outcome of our study
1.1 Ofcom has suggested a coverage obligation on a holder of 800 MHz spectrum, while others have suggested extending the obligation to more of the UK
In March 2011 Ofcom issued a consultation document setting out their proposals for the award of the 800 MHz and 2.6 GHz frequency bands [1]. Amongst those proposals, they noted a particular property of the 800 MHz band, which is part of the digital dividend which is being freed-up as the UK switches from analogue to digital TV (§1.4):
“the 800 MHz band is expected to be key to the economic delivery of next generation mobile broadband in less densely populated areas.”
In order to ensure that the benefits of future mobile services are provided in a reasonable time period, Ofcom highlighted that (§1.25):
“It is possible for us to include coverage obligations in auctioned licences to require certain minimum levels of coverage to be achieved by certain dates. We believe that there is a case for doing so in this case in order to guarantee a minimum coverage level for consumers and citizens.”
An important caveat was placed on any such obligation:
“But in specifying the obligation, it is necessary to ensure that it is proportionate and does not impose too great a cost relative to its benefits.”
Given these motivations and caveats, a coverage obligation was proposed as follows (§1.26):
“We propose to include a coverage obligation in one licence for the 800 MHz spectrum to deploy an electronic communications network that is capable of providing mobile telecommunications services with a sustained downlink speed of not less than 2 Mbps with a 90% probability of indoor reception to an area within which at least 95% of the UK population lives. We believe this should result in coverage of future mobile broadband services that approaches today’s 2G coverage by the end of 2017. We consider that such an obligation would be proportionate taking into account the likely costs and benefits.”
However, subsequent to the publication of Ofcom‟s consultation, many stakeholders expressed a view that the coverage obligation should be extended to a larger proportion of the UK population, as well as potentially specifying coverage levels in particular nations and regions as well as to the UK as a whole. In particular, a House of Commons motion in May 2011 called for the coverage obligation to be extended to
1“Consultation on assessment of future mobile competition and proposals for the award of 800 MHz and 2.6 GHz
spectrum and related issues”, Ofcom, 22nd
March 2011. Available from http://stakeholders.ofcom.org.uk/binaries/consultations/combined-award/summary/combined-award.pdf

Cost of extending 800 MHz mobile broadband coverage obligation for the UK 5
98% of the population [2], and this was supported by a House of Commons Culture, Media and Sport committee report in November 2011 [3].
1.2 The cost of delivering mobile coverage in rural areas is uncertain and sensitive to the population and terrain in specific areas
The Ofcom consultation [1] gave an indication of Ofcom‟s assessment of the number of sites required to deliver service to 95% of the UK population (§6.14):
“Our technical modelling … suggests that a network on these lines [upgrading existing sites] using LTE technology and 800 MHz spectrum would be capable of delivering mobile broadband coverage beyond the current 3G footprint and, rather, replicate something similar to current 2G coverage. For example, our modelling suggests that a network of around 9,000 sites using a 2x5 MHz 800 MHz carrier could provide a 2Mbps service, with 90% coverage confidence indoors, to an area within which 95% of the UK population lives”
Ofcom expressed a view that the incremental costs required to extend the obligation to a coverage target well above 95% would require a significant number of new sites to be built, which would impose incremental costs which are likely to exceed the incremental benefits. However, they acknowledged that this view was not based upon specific analysis of the incremental costs due to the difficulties of doing this.
There are two key issues which create particular challenges in modelling the size of deployments in relatively sparsely populated areas:
The specific population distribution in those areas, which is very non-uniform
Terrain variabilities, which are often (but not necessarily) especially significant in rural areas
Given these issues, modelling based on any assumptions of a uniform spread of either population or terrain risks significant error. Additionally, the assumption made in Ofcom‟s analysis that service is delivered from a macrocell network directly to an indoor mobile user may not be the most efficient way of delivering service in these regions. “Community small cells” in place of macrocells and fixed CPE devices delivering service via domestic/enterprise femtocells, LTE relays and Wi-Fi are all potentially more efficient for some locations.
Some work published by the ICT Knowledge Transfer Network4 suggested approximately 3,000 extra sites would be necessary to extend coverage from 95 to 99% of the UK population. However this was based on coverage at 7.2 Mbps and did not account for specific population distributions or terrain. The paper did, however,
2http://www.publications.parliament.uk/pa/cm201011/cmhansrd/cm110519/debtext/110519-
0002.htm#11051950000003
3http://www.parliament.uk/business/committees/committees-a-z/commons-select/culture-media-and-sport-
committee/news/committee-publishes-report-on-spectrum/
4 “Infrastructure analysis and solutions for 800MHz network deployment”, ICT Knowledge Transfer Network, May 2011,
from https://connect.innovateuk.org/c/document_library/get_file?folderId=865485&name=DLFE-32798.pdf The 3,000 sites figure reported above is an estimate based on the graph at Figure 2.
Cost of extending 800 MHz mobile broadband coverage obligation for the UK 6
indicate that significantly fewer sites might be needed in the case of coverage to a desktop modem placed close to a window rather than a USB dongle.
In a House of Commons debate on rural broadband and mobile coverage, Rory Stewart MP gave an estimate of a cost of £215 million pounds, characterised as a “worst-case projection, based on an estimate of 1500 new sites required to extend service from 95% to 98% and a cost of just under £150,000 per site” [5].
There were several other relevant assertions by operators and other bodies in evidence given to the Culture, Media and Sport select committee inquiry on spectrum:
1. Three stated that: “With just under 13,000 base stations Three possesses the infrastructure required to support low frequency spectrum and extend coverage to rural areas. If 800MHz was deployed over Three‟s network 96% of the UK‟s population would enjoy indoor mobile broadband coverage overnight” [6]. In subsequent oral evidence they noted that, with 2 x 10 MHz, in fact 97% of the population could be covered with existing sites, while increasing coverage from 97% to 98% would cost about £100 million in sites, and to go to 99% would cost an additional £270 million [7].
2. Vodafone stated that “our estimates of the cost of meeting the proposed coverage obligation are somewhat higher than Ofcom has suggested” [8]
3. Telefónica provided an opinion that backhaul costs were a significant component of the costs of extending coverage “If… coverage obligations are included in licences then, to be effective in delivering rural mobile broadband coverage, they must go hand-in-hand with the availability of cost effective backhaul solutions from BT, plus the ability to use BT‟s "ducts and poles". There is little value in forcing mobile operators to build masts when those masts cannot be connected back to the core network with a fit for purpose backhaul solution.” [9]
4. Everything Everywhere suggested that the quantity as well as the frequency of the spectrum used played a significant role in the cost of meeting a coverage obligation “Everything Everywhere can demonstrate that 2 x 5 MHz of sub-1 GHz spectrum will not be capable of providing sufficient performance or capacity to handle broadband traffic levels in such rural broadband not-spot areas. A key finding from the Cornwall trial is that 2x10 MHz is the minimum quantity of sub1 GHz spectrum necessary for the commercial viability of wireless access as
5House of Commons debate on “Rural broadband and mobile coverage”, Rory Stewart MP, 19
th May 2011. From
http://www.theyworkforyou.com/debates/?id=2011-05-19c.557.0
6 HC 1258 Spectrum §3.2, written evidence submitted by Hutchison 3g UK Ltd (Three), June 2011,
http://www.publications.parliament.uk/pa/cm201012/cmselect/cmcumeds/writev/1258/sp07.htm
7 Oral Evidence before the Culture, Media and Sport Committee, Kevin Russell Chief Executive Officer, Hutchison 3G,
Q85, 21/6/11 http://www.publications.parliament.uk/pa/cm201012/cmselect/cmcumeds/uc1258-i/uc125801.htm
8 HC 1258 Spectrum §25, written evidence submitted by Vodafone, June 2011,
http://www.publications.parliament.uk/pa/cm201012/cmselect/cmcumeds/writev/1258/sp12.htm
9 HC 1258 Spectrum §28, written evidence submitted by Telefónica UK, June 2011,
http://www.publications.parliament.uk/pa/cm201012/cmselect/cmcumeds/writev/1258/sp04.htm

Cost of extending 800 MHz mobile broadband coverage obligation for the UK 7
a solution for rural broadband. Otherwise, the percentage of not-spots covered to the right performance level is so limited that it no longer justifies the significant investment involved.” [10]
5. British Telecom expressed a similar doubt concerning the cost-effectiveness of service using 2 x 5 MHz of 800 MHz: “We have examined Ofcom‟s proposals to place a population coverage obligation on one 2x5MHz package of 800 MHz spectrum and are very doubtful that the specified obligation could be achieved (with significant take up of service) without significant additional spectrum being available to the licensee.” [11]
6. Arqiva provided an estimate of the cost of extending the coverage obligation to 99% of £200 million to £230 million [12].
1.3 Ofcom wish to understand the way in which the costs of extending mobile coverage via 800 MHz varies with the population served, the method used to provide coverage and the spectrum used
Given the challenges of modelling the cost of coverage, and yet the strong desire expressed by many stakeholders to extend the coverage obligation, Ofcom commissioned this study to provide direct analysis to inform any consideration of an extended coverage obligation. The objectives of our study as specified by Ofcom were as follows:
7. To estimate the mobile coverage from existing mobile operator sites for mobile broadband services provided using LTE technology within the 800 MHz spectrum band.
8. To estimate the cost of extending mobile services beyond existing coverage levels by building new sites in efficient locations.
9. Adopt a methodology which accounts for specific population and terrain distributions in sparsely populated areas so as to overcome limitations inherent in previous modelling work which was designed for densely populated areas
10. Investigate how existing coverage and costs for new site build vary with respect to the following key parameters:
The specific region of the United Kingdom within which coverage is to be extended.
The existing mobile operator whose coverage is to be extended. This report shows results only for one operator, but all existing operators have been analysed.
The bandwidth of 800 MHz spectrum employed.
The transmit power adopted.
10
HC 1258 Spectrum §19, written evidence submitted by Everything Everywhere, June 2011, http://www.publications.parliament.uk/pa/cm201012/cmselect/cmcumeds/writev/1258/sp17.htm
11 HC 1258 Spectrum §11, written evidence submitted by British Telecommunications plc, June
2011,http://www.publications.parliament.uk/pa/cm201012/cmselect/cmcumeds/writev/1258/sp13.htm
12 Oral Evidence before the Culture, Media and Sport Committee, John Cresswell, Chief Executive Officer, Arqiva, Q18 ,
21/6/11 http://www.publications.parliament.uk/pa/cm201012/cmselect/cmcumeds/uc1258-i/uc125801.htm

Cost of extending 800 MHz mobile broadband coverage obligation for the UK 8
The network topology, including the use of smaller/lower cost cells and indoor customer premises equipment.
The throughput level specified in the coverage obligation.
The intention throughout was to provide a good understanding of the way in which costs might vary with these parameters in extending the coverage beyond that which would be provided by upgrading all existing mobile operator sites to LTE at 800 MHz.
1.4 We have adopted a detailed coverage calculation and network planning methodology to meet Ofcom’s needs and to adequately determine the impact of all relevant parameters
In order to credibly estimate the cost of extending coverage we created a modelling framework with the following key features:
Account for specific population locations via the locations of full-unit postcodes, weighted by the number of residential and business delivery addresses at each
Use of specific existing operator base station site locations
Use of detailed terrain and clutter information, via databases with a 50m resolution and via propagation models intended for propagation over irregular terrain as specified by the ITU-R.
Ability to determine required new sites to meet increasing levels of obligation based on a cost-efficient site selection algorithm.
Ability to predict costs based on several types of site and consumer premises equipment
Although the coverage obligation specified in the March consultation specified only a downlink throughput level to a single user, we felt that it was important for a credible determination of the costs of extending coverage to additionally include:
potential limitations due to the uplink range
potential capacity limitations, via a cap on the number of premises served per site and unit bandwidth
In consultation with Ofcom we assigned credible constraints in both these areas and included them throughout the analysis.
Our analysis examined the variation of the cost of extending coverage with respect to the six key the six key variables specified in

Cost of extending 800 MHz mobile broadband coverage obligation for the UK 9
Table 1-1.

Cost of extending 800 MHz mobile broadband coverage obligation for the UK 10
Table 1-1: Key variables examined in our study
Variable Cases examined
The specific region of the United Kingdom within which coverage is to be extended.
Four study regions were selected:
1. Six counties within North and Mid Wales 2. Counties Tyrone and Fermanagh in the south west of
Northern Ireland 3. The Scottish Borders, East Lothian, and Mid Lothian regions
within Southern Scotland 4. The counties of Cumbria and Northumberland in Northern
England
This choice was made to consider a wide spread of population and terrain characteristics and a wide geographical spread while being tractable given the modelling methodology adopted.
The existing mobile operator whose coverage is to be extended.
We evaluated existing coverage using, with permission, site data provided by four existing mobile operators. The results presented in this report show only one operator by way of example13.
The bandwidth of 800 MHz spectrum employed.
We examined the cost of extending coverage using two bandwidths:
2 x 5 MHz
2 x 10 MHz
The transmit power adopted
We compared the cost of extending coverage given a base station transmit power at the levels proposed by Ofcom [14] and at a 5dB higher level
The network topology, including the use of smaller/lower cost cells and indoor customer premises equipment
We examined two different options for the base stations used to extend coverage:
Conventional macrocells
Small cells based on street furniture structures with reduced height and cost compared with conventional macrocells (which we refer to as “community cells”)
We also examined two different methods of providing deep indoor coverage:
Directly from outdoor cells, requiring that signals penetrate through the walls of the building, potentially at the ground floor level to reach a mobile device
Via consumer premises equipment which had a high gain
13
This report only presents results for one operator. Its purpose is to provide analysis of likely costs of providing future LTE coverage in general and differences between operators due to differences in existing site deployments are a second order issue. Also it was not the purpose of the work to give predictions for particular operators.
14 “Consultation information on technical licence conditions for 800 MHz and 2.6 GHz spectrum and related matters”,
Ofcom consultation published 2nd
June 2011, from http://stakeholders.ofcom.org.uk/consultations/technical-licence-conditions/

Cost of extending 800 MHz mobile broadband coverage obligation for the UK 11
Variable Cases examined
antenna directed towards the best nearby base station through a window at an upper floor, thereby avoiding the building penetration loss. In this “window ledge CPE” case, the device would relay the signal to the mobile device via a separate link which is not coverage-constrained.
The throughput level specified in the coverage obligation
We examined two throughput levels for the coverage obligation:
A sustained 2 Mbps downlink service, as specified in the March consultation
A sustained 5 Mbps downlink service
We have used our best endeavours to analyse the costs in a credible and meaningful fashion. In particular we have addressed the key limitations of previous work in accounting for the specific distributions of terrain and population in the areas under study. Nevertheless, a number of limitations in the modelling process should be considered when considering the significance of the results, including the following:
Regions studied: For reasons of time and complexity we have not studied the whole of the UK. Nevertheless our four study regions were chosen to be indicative of the challenges faced in extending coverage in general, and together represent a significant proportion of the entirety of areas underserved by existing operator sites.
Site optimality: Determining the most cost-effective location for a new site is a challenging problem requiring an exhaustive search of an enormous search space to be fully optimal. Instead we created an algorithm which provided a reasonably cost-efficient site selection, and used the same algorithm when comparing the costs between different input conditions.
Availability of sites and backhaul: Although our model allows us to mask areas where availability of sites and backhaul is particularly challenging, we have not used this capability in the results presented here. We have instead assumed that any desired site location is available and that appropriate backhaul can be provided to that location at the same cost for every site. In practice, this may not be true and operators may need to spend significant extra time or cost on construction in particular locations; even then some sites may be simply impossible to create. On the other hand, we have also not accounted for the fact that in some cases existing sites are present in the areas of interest and could be accessed and upgraded at significantly lower cost than we have assumed.
Costs: We have constructed a bottom-up assessment of the costs of building and operating sites (both conventional macrocells and street furniture sites) in challenging locations and considered a range of costs for the cost factors of greatest influence and uncertainty. We have evaluated these costs on a present value basis according to an approach specified by Ofcom. However, in practice the costs for individual sites may vary substantially and operator views on the appropriate approach to creating the present value may vary depending on their circumstances.
Propagation: Radio wave propagation is subject to various uncertainties in practice, which make modelling challenging. We have used credible models from published sources and parameters based on previous Ofcom work and our best endeavours, and have accounted for key uncertainties in our link

Cost of extending 800 MHz mobile broadband coverage obligation for the UK 12
budgets. Nevertheless we do not have access to the detailed proprietary models and measurement databases which operators use in their own planning work so our results may not match those which an operator would determine for themselves.
Site parameters: We have assumed that an operator could upgrade all of their existing sites to support 800 MHz LTE, which may not be possible for some of the sites due to physical limitations. Likewise, we have assumed that all newly built sites have the same parameters, including their transmit power, antenna gains and existing heights. In practice there will be variations due to specific physical and planning constraints.
Despite these limitations, we believe that our analysis is fit for the intended purpose, meeting Ofcom‟s desire to analyse the impact of potential changes to their policy regarding the 800 MHz coverage obligation as previously specified.
1.5 Coverage levels based on 800 MHz LTE at existing operator sites vary depending on the region examined
Figure 1-1 summarises the existing coverage levels in each of our study areas for one operator, assuming the use of the target throughput levels and bandwidths specified by Ofcom in the March consultation:
Figure 1-1: Coverage from existing sites for one operator (percentage of delivery addresses)
1.6 The cost of extending the coverage obligation increases steeply with the population served and target throughput level, but may be minimised via an appropriate choice of site types and bandwidths
A wide range of exercises was conducted to determine the number of sites needed to extend coverage according to key combinations of the relevant input parameters. The general behaviour of this growth on sites is illustrated in Figure 1-2 for the parameters shown in Table 1-2. It is clear that the number of new sites and associated costs rise steeply with the level of additional coverage provided. In every case, the number of
61%
65%
76%
70% 67%
74%
82%
79% 81%
90% 93% 93%
84%
92% 94% 95%
93%
98% 98% 99%
60%
65%
70%
75%
80%
85%
90%
95%
100%
1 - N. & Mid Wales
2 - SW N Ireland
3 - S. Scotland 4 - N England
Case 1: 133.3 dB – Normal power, indoor UE, height 1.5m
Case 2: 136.3 dB – Higher power, indoor UE, height 1.5m
Case 3: 144.9 dB – Normal power, outdoor UE, height 1.5m
Case 4: 147.9 dB – Higher power, outdoor UE, height 1.5m
Case 5: 157.5 dB – Window ledge CPE, height 3.5m

Cost of extending 800 MHz mobile broadband coverage obligation for the UK 13
sites required to increase coverage from 95% to 98% of delivery addresses is greater than that required to increase from 90% to 95%.
Figure 1-2: Additional sites required to extend coverage for one operator in the relevant study region for the exercises defined in Table 1-2
Table 1-2: Definition of input parameters for results indicated in Figure 1-2
0
200
400
600
800
1000
1200
1400
1600
88% 90% 92% 94% 96% 98% 100%
Additional sites required for one operator in the
relevant study region
Percentage of delivery addresses served
1 2 3 4 5 6 7
8 9 10 11 12 13 14
15 16 17 18 19
Exercise number: (defined in table 1-2)

Cost of extending 800 MHz mobile broadband coverage obligation for the UK 14
1.7 Our results lead us to a number of key findings regarding the cost of the potential 800 MHz coverage obligation which Ofcom should consider in their policy analysis
Since Ofcom proposed a coverage obligation for one of the 800 MHz spectrum licences, many stakeholders have suggested changes to key parameters of that obligation. However, relatively little analysis of the costs of making such changes has been available, making it difficult to assess potential changes directly. This report addresses these issues, examining the impact of the key variables in areas representative of some of the most challenging areas of the UK. Our analysis, while adopting acknowledged simplifications and assumptions where necessary to be tractable, has included the key effects which were missing from previous analysis, notably:
The use of real operator site locations
The modelling of propagation effects due to both terrain and clutter
The modelling of the real distribution of the UK population in both domestic and office contexts
We have also extended previous analysis in the following ways:
We have examined both conventional means of delivering service to indoor users directly from outdoor macrocells and also alternative approaches using community cells and hybrid schemes using additional customer premise equipment which have the potential to make coverage extension more cost effective in some circumstances.
We have factored in additional costs of new site build in rural areas by estimating the range of the main component costs including both capital and operational aspects.
It is not our intention here to provide a specific recommendation for how Ofcom should specify any changes to the proposed 800 MHz coverage obligation. However, our modelling has provided a number of indications of the key variables and associated costs in several areas where extending coverage may be especially challenging.
Our key findings are summarised in Table 1-3.
We welcome suggestions and comments on this analysis via [email protected] Note that additional coverage plots to illustrate the operation of our model are available at www.realwireless.biz/800coverage

Cost of extending 800 MHz mobile broadband coverage obligation for the UK 15
Table 1-3: Summary of key findings
Issue Finding based on our analysis Commentary
Coverage from existing sites
Indoor coverage from macrocells as low as 61% of study areas for 5 MHz of 800 MHz
Coverage varies significantly by region and means of provision
Rapidly rising costs with higher coverage levels
Number of sites required to increase coverage from 95% to 98% of delivery addresses is greater than that required to increase from 90% to 95%
Extending coverage to least densely populated area studied requires new sites and associated costs which rise steeply with the level of additional coverage provided
Site type Cost of additional coverage per premise using community cells is roughly half that of using macrocells
Street furniture sites match infrastructure costs more closely to distribution of unserved locations
Bandwidth Incremental costs for a given coverage level using 2 x 10 MHz are roughly 20% lower than those with 2 x 5 MHz
Bandwidth used has a significant impact on the cost of coverage, both by increasing the range of each site and by increasing the number of locations which each site can serve before capacity limitations impact significantly on the quality of service delivered
Transmit power
Can increase coverage but gains are modest
Gains are limited due to terrain and uplink limitations and should be balanced against the potential costs and the complexity of coordination with adjacent services
Throughput Increasing indoor throughput obligation from 2 Mbps to 5 Mbps increases cost of coverage extension by approximately 50%
5 Mbps is more challenging because a) higher signal to noise level is required, reducing the maximum range of a given site and b) greater required share of the available bandwidth for a given contention ratio, so capacity constraints are more significant.
Consumer premises equipment
Scope to reduce cost per premises in some cases
Cost reduction requires careful targeting of deployments to most needy premises and there are open questions regarding their ability to fully substitute for a service delivered in the conventional manner
Correlation between GSM 900 MHz voice coverage and LTE 800 MHz
Coverage extension based on LTE 800 MHz service extends GSM 900 MHz voice coverage by a similar amount and vice versa
Site range is similar for both services, although there are some differences arising from capacity issues

Cost of extending 800 MHz mobile broadband coverage obligation for the UK 16
2 A customised technical model has been developed, based on established principles and using appropriate technical and cost parameters
In this chapter we explain the technical model and associated parameters which we have used to analyse the cost of extending the potential 800 MHz coverage obligation. The modelling approach was selected in order to meet Ofcom‟s objectives as specified in §2.3, while providing a reasonable balance of development complexity and speed of analysis.
The size and type of calculations required warranted the development of a custom software model. The software model produced to undertake the calculations was written in MATLAB which enabled the modelling to handle the large quantities of data to produce the required coverage predictions and undertake the numerous path loss calculations for the establishment of potential new sites.
The following sections describe the main elements of the model:
Model overview §2.1 provides a general overview of the modelling approach and framework
Input parameters §2.2 describes the main parameters and assumptions used in our analysis, including the terrain, clutter, existing site and postcode data. It also provides details of the propagation model selected.
Link budgets §2.3 explains the link budgets constructed for the various values of input parameters and the resulting maximum acceptable path loss values
Capacity §2.4 explains how the maximum capacity of a site is computed
Region selection §2.5 provides the reasoning for the choice of the four study areas and provides their geographical and population characteristics
Alternate topologies §2.6 describes the various base station and customer premises equipment configurations which are considered
Cost modelling §2.7 provides the unit costs for the elements of the base station and customer premises equipment considered and the method of combining these into present values
Limitations of modelling approach §2.8 lists and explains the potential effect of known limitations in our modelling approach.
2.1 Model Overview
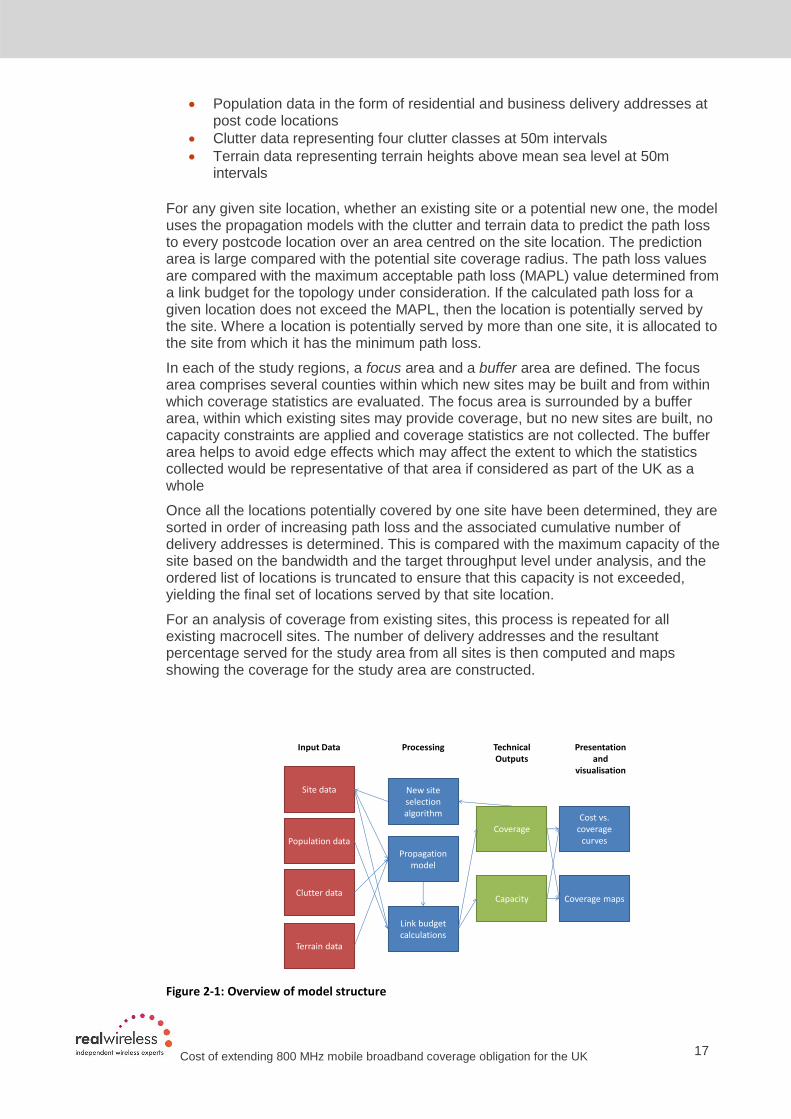
The general structure of the model is illustrated in Figure 2-1. The model has two main functions:
1. To determine the population served by existing sites for a given coverage specification. Population is assumed proportional to the number of delivery addresses served, which in turn are located at full unit postcode locations (e.g. RH20 4XB).
2. To determine the additional population (i.e. delivery addresses) served by additional sites when placed cost efficiently.
The model uses four main forms of input data:
Existing site data provided by the mobile operators, filtered to include only macrocell sites
Cost of extending 800 MHz mobile broadband coverage obligation for the UK 17
Population data in the form of residential and business delivery addresses at post code locations
Clutter data representing four clutter classes at 50m intervals
Terrain data representing terrain heights above mean sea level at 50m intervals
For any given site location, whether an existing site or a potential new one, the model uses the propagation models with the clutter and terrain data to predict the path loss to every postcode location over an area centred on the site location. The prediction area is large compared with the potential site coverage radius. The path loss values are compared with the maximum acceptable path loss (MAPL) value determined from a link budget for the topology under consideration. If the calculated path loss for a given location does not exceed the MAPL, then the location is potentially served by the site. Where a location is potentially served by more than one site, it is allocated to the site from which it has the minimum path loss.
In each of the study regions, a focus area and a buffer area are defined. The focus area comprises several counties within which new sites may be built and from within which coverage statistics are evaluated. The focus area is surrounded by a buffer area, within which existing sites may provide coverage, but no new sites are built, no capacity constraints are applied and coverage statistics are not collected. The buffer area helps to avoid edge effects which may affect the extent to which the statistics collected would be representative of that area if considered as part of the UK as a whole
Once all the locations potentially covered by one site have been determined, they are sorted in order of increasing path loss and the associated cumulative number of delivery addresses is determined. This is compared with the maximum capacity of the site based on the bandwidth and the target throughput level under analysis, and the ordered list of locations is truncated to ensure that this capacity is not exceeded, yielding the final set of locations served by that site location.
For an analysis of coverage from existing sites, this process is repeated for all existing macrocell sites. The number of delivery addresses and the resultant percentage served for the study area from all sites is then computed and maps showing the coverage for the study area are constructed.
Propagation model
Site data
Link budget calculations
Clutter data
Population data
Coverage
Capacity
Terrain data
New site selection algorithm Cost vs.
coverage curves
Coverage maps
Input Data Processing Technical Outputs
Presentation and
visualisation
Figure 2-1: Overview of model structure

Cost of extending 800 MHz mobile broadband coverage obligation for the UK 18
When analysing the cost of extending coverage via new sites, the model utilises a site selection algorithm, which at each step estimates the site location which adds the greatest number of unserved delivery addresses and hence minimises the cost of extending coverage for a given site cost. In principle this algorithm would search exhaustively over the target area for the site location which covers the largest unserved population, then repeat for the remaining unserved population. However, in practice this would be computationally infeasible, so we have adopted an optimisation approach which substantially reduces computation time while still representing an efficient outcome.
The process for the site selection algorithm in detail is illustrated in overview in Figure 2-2 and in more detail in Figure 2-3. Initially, the study area is divided into a grid of large square of approximately 9km x 9km, and the square with the greatest number of unserved delivery addresses is determined, given the MAPL and capacity constraints described previously. This square is then divided into a grid of 9 equally spaced potential site locations. Each location is evaluated to determine the location which serves the greatest number of unserved addresses. That location is then treated as the central location in a new grid of 9 potential locations having around 0.63 of the distance between them, and again the location serving the greatest number of unserved addresses is determined. The process is repeated until the spacing of potential site locations is no more than 50m, and the resulting site is selected as the most efficient at this step. The addresses served by the site are then marked as served, and the process returns to determining the large grid square with the greatest number of unserved addresses.
The whole process continues until either a preset time or number of locations is exceeded, or all locations have been served.
The output is an ordered list of sites starting with the most efficient as selected by the above algorithm, showing the number of additional delivery addresses served by the site, as well as coverage maps showing the service provided after placement of each site.
Initial selection of area with most unserved addresses
Progressive subdivision of area to determine site location serving maximum
unserved addresses(subject to max. path loss and capacity)
Remove served addresses
Repeat until all served or time limit reached
Figure 2-2: Overview of site selection algorithm

Cost of extending 800 MHz mobile broadband coverage obligation for the UK 19
Figure 2-3 New site selection algorithm - flow diagram
2.2 Input Parameters
This section describes the input parameters used to build the model and generate the results which includes the following datasets:
Clutter data
Terrain data
Existing site data
Post code data including both domestic and non-domestic delivery addresses
2.2.1 Clutter data
Clutter data is used to indicate the land use in a 50m x 50m pixel, which is then used to modify the propagation prediction to account for clutter (mainly buildings and trees) local to the mobile location. The dataset used included ten clutter categories, as illustrated in Figure 2-4.
1. Find the location with highest concentration of un-served users
• Create a grid of approx. 9 km x 9 km pixels and find the number of un-served delivery addresses
2. Determine the initial search area
• Select the pixel with max concentration from previous step
3. Create a grid of 9 trial site locations
4. Optimise new site location
• Iterate through the locations in the grid
• Calculate the path loss to each un-served postcode point and compare against the MAPL
• Select the grid location that serves the most un-served delivery addresses
• Reduce the search area
• Repeat the steps above, until the search area < 50 m
• Select the best site location
5. Re-calculate the unserved users
• Terminate if served population at or above a set level, e.g. 99%

Cost of extending 800 MHz mobile broadband coverage obligation for the UK 20
Figure 2-4: Example of clutter dataset (Wales)
2.2.2 Terrain data
The terrain data used in the model has a 50 m resolution and spans the entire United Kingdom. A representative sample is illustrated in Figure 2-5.
Figure 2-5: Example of terrain data. Values shown are terrain heights in metres above mean sea level

Cost of extending 800 MHz mobile broadband coverage obligation for the UK 21
2.2.3 Propagation model
For any analysis of coverage it is important to select a propagation model which fits with the parameters and purpose of the study. Ofcom used the SE21-Hata model in the analysis conducted for the March consultation [15], where their analysis was concentrated on relatively densely populated areas where terrain variations are moderate and the SE21-Hata model is appropriate. Our analysis, by contrast, needed to be valid for hilly and mountainous environments, which SE21-Hata takes no explicit account of. We therefore selected the ITU-R P.1812 propagation model as the basis for path loss predictions in this project [16].The P.1812 model includes specific elements for computing the impact of terrain, is valid for the frequency and antenna heights of interest here and is a publically available and peer-reviewed source. Nevertheless, it is recognised that mobile operators may have their own proprietary models based on measurements in the specific areas of interest, so there may be differences between their predictions and ours in any specific example.
Although the P.1812 model was considered suitable for our purposes, some simplification and optimisation of the model was necessary. The simplifications and associated motivations are summarised in Table 2-1.
Table 2-1: Simplifications adopted for P.1812 model
Description of simplification
Explanation
Percentage of time p% = 50
The median (over time) path loss value is relevant for coverage purposes since no interference analysis is required here
Industry clutter type has representative height equal to 15m
The industry clutter includes: School, shopping centre, power station and open cast mine. Recommendation P.1812 does not define the clutter types or heights to be used.
Model branches to accommodate “Coastal land” and “Sea” zone types are not considered
These cases are not of prime relevance to our study. The “Sea” zone type represents large bodies of water, i.e. covering a circle of at least 100 km in diameter. We assume that the signal is too weak to be useful after propagating over such large distances.
The path centre latitude φ is constant in each region
The path centre latitude varies little within each region, and is assumed constant for each region for simplicity.
Sea-level surface refractivity N0 = 327.5 N-units
Based on Figure 2 in Recommendation P.1812
Average annual value ΔN = 45 N-units
Based on Figure 1 in Recommendation P.1812
15
European Conference of Postal and Telecommunications Administrations (CEPT), European Radiocommunications Committee (ERC), REPORT 68, “Monte-Carlo simulation methodology for the use in sharing and compatibility studies between different radio services or systems”, Appendix 1 to Annex 2 (b), Naples, February 2000, revised in Regensburg, May 2001 and Baden, June 2002.
16“A path-specific propagation prediction method for point-to-areaterrestrial services in the VHF and UHF bands”, ITU-R
Recommendation P.1812, 2007.

Cost of extending 800 MHz mobile broadband coverage obligation for the UK 22
Recommendation P.1812 represents the effect of clutter via representative heights applied to each clutter type, and provides an example table of values for four categories, but does not standardise the clutter categories. We mapped the four clutter categories from SE21 to our categories and tested the example values, but found they gave a rather poor fit to the predictions of the SE21 model in the case of level terrain. Since some consistency with other work based on SE21 was desirable, we have optimised the clutter heights to provide an improved fit. The heights used are shown in Table 2-2: and the resulting alignment of the two models is shown in Figure 2-6.
Table 2-2: Optimised clutter height values for propagation modelling
Clutter category Clutter height based on example categories in Recommendation P.1812 (m)
Clutter height aligned with SE21 (m)
Dense urban 20m 17m
Urban 15m 17m
Industry 15m 15m
Suburban 10m 14m
Village 10m 10m
Parks/Recreation 10m 4m
Open 10m 4m
Open in urban 10m 4m
Forest 15m 15m
Water 10m 4m
Figure 2-6: Comparison of P.1812 and SE21 path loss models following optimisation of P.1812 clutter heights. Solid lines are P.1812, dashed lines are SE21. The optimisation was performed for BS antenna height = 16.5m (median value in the region) and for mobile antenna height = 1.5m.
Cost of extending 800 MHz mobile broadband coverage obligation for the UK 23
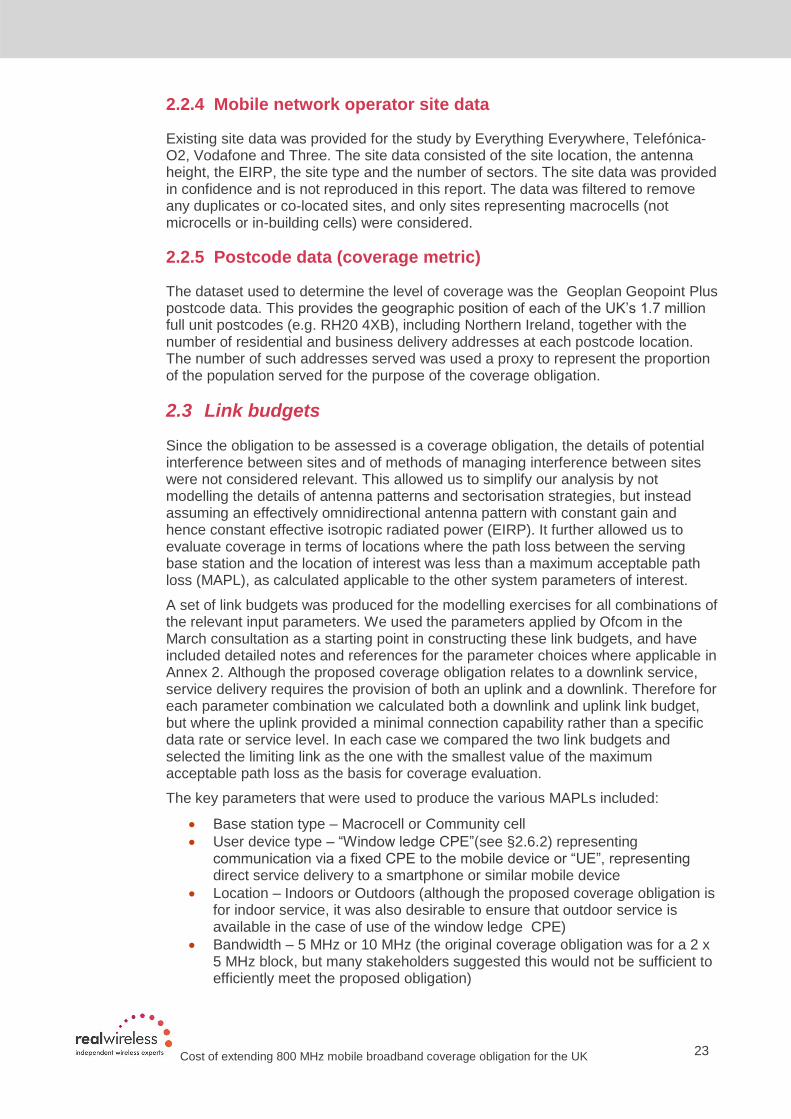
2.2.4 Mobile network operator site data
Existing site data was provided for the study by Everything Everywhere, Telefónica-O2, Vodafone and Three. The site data consisted of the site location, the antenna height, the EIRP, the site type and the number of sectors. The site data was provided in confidence and is not reproduced in this report. The data was filtered to remove any duplicates or co-located sites, and only sites representing macrocells (not microcells or in-building cells) were considered.
2.2.5 Postcode data (coverage metric)
The dataset used to determine the level of coverage was the Geoplan Geopoint Plus postcode data. This provides the geographic position of each of the UK‟s 1.7 million full unit postcodes (e.g. RH20 4XB), including Northern Ireland, together with the number of residential and business delivery addresses at each postcode location. The number of such addresses served was used a proxy to represent the proportion of the population served for the purpose of the coverage obligation.
2.3 Link budgets
Since the obligation to be assessed is a coverage obligation, the details of potential interference between sites and of methods of managing interference between sites were not considered relevant. This allowed us to simplify our analysis by not modelling the details of antenna patterns and sectorisation strategies, but instead assuming an effectively omnidirectional antenna pattern with constant gain and hence constant effective isotropic radiated power (EIRP). It further allowed us to evaluate coverage in terms of locations where the path loss between the serving base station and the location of interest was less than a maximum acceptable path loss (MAPL), as calculated applicable to the other system parameters of interest.
A set of link budgets was produced for the modelling exercises for all combinations of the relevant input parameters. We used the parameters applied by Ofcom in the March consultation as a starting point in constructing these link budgets, and have included detailed notes and references for the parameter choices where applicable in Annex 2. Although the proposed coverage obligation relates to a downlink service, service delivery requires the provision of both an uplink and a downlink. Therefore for each parameter combination we calculated both a downlink and uplink link budget, but where the uplink provided a minimal connection capability rather than a specific data rate or service level. In each case we compared the two link budgets and selected the limiting link as the one with the smallest value of the maximum acceptable path loss as the basis for coverage evaluation.
The key parameters that were used to produce the various MAPLs included:
Base station type – Macrocell or Community cell
User device type – “Window ledge CPE”(see §2.6.2) representing communication via a fixed CPE to the mobile device or “UE”, representing direct service delivery to a smartphone or similar mobile device
Location – Indoors or Outdoors (although the proposed coverage obligation is for indoor service, it was also desirable to ensure that outdoor service is available in the case of use of the window ledge CPE)
Bandwidth – 5 MHz or 10 MHz (the original coverage obligation was for a 2 x 5 MHz block, but many stakeholders suggested this would not be sufficient to efficiently meet the proposed obligation)

Cost of extending 800 MHz mobile broadband coverage obligation for the UK 24
EIRP – Normal power of 64 dBm in 5 MHz, or high power of 67 dBm in 5 MHz (64 dBm in 5 MHz corresponds to the proposed technical licence condition)
Coverage Obligation Downlink Throughput – 2 Mbps or 5 Mbps (the proposed obligation was for 2 Mbps, but many stakeholders suggested a higher throughput was appropriate)
The MAPL is calculated for all possible combinations of the parameters listed above which resulted in a total set of 47 combinations, with the resulting MAPL values as shown in Table 2-4. Given the large number of cases, many of which have similar MAPLs, we selected five values of MAPL to represent five groups of cases with closely similar MAPL values.
The following set of representative MAPLs was chosen for analysis:
Case 1: 133.3 dB – Normal power, indoor UE, height 1.5m
Case 2: 136.3 dB – Higher power, indoor UE, height 1.5m
Case 3: 144.9 dB – Normal power, outdoor UE, height 1.5m
Case 4: 147.9 dB – Higher power, outdoor UE, height 1.5m
Case 5: 157.5 dB – Fixed window ledge CPE, height 3.5m
Table 2-4: also indicates which of these representative values most closely represents each combination of input parameters and the above descriptive terms will be used in the subsequent analysis, but the table should be used to determine the most applicable coverage level for a given case.
Some general findings are apparent from the table:
All of the CPE cases and most (though not all) of the outdoor cases are uplink limited, rendering these insensitive to changes in the transmit power or downlink throughput obligation
All of the CPE cases exhibit higher MAPL than the UE cases, including the outdoor ones, indicating that the form of service which is adequate for mobile users needs to be considered if CPE are used to extend coverage.
Outdoor UE cases always exhibit lower MAPL levels than indoor UE cases, indicating that the obligation to provide indoor service is a larger driver of cost than the specific throughput level, bandwidth or transmit power (at least before potential capacity constraints are considered).
Note that community cells always exhibit the same MAPL levels as the corresponding macrocell cases in this analysis, but the coverage range will not be the same due to the lower antenna height for community cells.
Annex 2 also shows link budgets for mobile voice services based on GSM at 900 MHz. Although the specific levels of parameters used by operators may vary, these link budgets are intended for general comparison of the expected levels of coverage between sites carrying LTE services at 800 MHz and those carrying GSM voice services in a situation where parameters are chosen consistently. Table 2-3 compares the associated maximum acceptable path loss values between GSM and LTE for a specific set of input parameters. There is considerable similarity between the MAPL values for GSM at 900 MHz and LTE at 800 MHz for the corresponding environment (indoors or outdoors).. A full comparison additionally requires consideration of the (outdoor) propagation loss differences between the bands, which is examined in §0.

Cost of extending 800 MHz mobile broadband coverage obligation for the UK 25
Table 2-3: Comparison of maximum acceptable path loss for LTE at 800 MHz and GSM voice at 900 MHz
Service LTE 800 MHz 10 MHz bandwidth, 2 Mbps throughput, 64 dBm / 5 MHz EIRP
GSM 900 MHz voice
Outdoors 144.9 dB 147.5 dB
Indoors 135.1 dB 135.1 dB

Cost of extending 800 MHz mobile broadband coverage obligation for the UK 26
Table 2-4: LTE MAPL levels for each combination of input variables, in descending order of maximum acceptable path loss
Base station type (macro or community)
User device type
Indoors /Outdoors
Bandwidth (MHz)
EIRP (dBm/10MHz)
Downlink throughput required (Mbps)
MAPL DL (dB)
MAPL UL (dB)
MAPL (dB)
MAPL case : value (dB)
Uplink or Downlink Limited
Macro CPE Indoors 5 64 2 164.5 157.5 157.5 5: 157.5 UL lim
Community CPE Indoors 5 64 2 164.5 157.5 157.5 5: 157.5 UL lim
Macro CPE Indoors 10 64 2 166.1 157.5 157.5 5: 157.5 UL lim
Community CPE Indoors 10 64 2 166.1 157.5 157.5 5: 157.5 UL lim
Macro CPE Indoors 5 67 2 167.5 157.5 157.5 5: 157.5 UL lim
Community CPE Indoors 5 67 2 167.5 157.5 157.5 5: 157.5 UL lim
Macro CPE Indoors 10 67 2 169.1 157.5 157.5 5: 157.5 UL lim
Community CPE Indoors 10 67 2 169.1 157.5 157.5 5: 157.5 UL lim
Macro CPE Indoors 5 64 5 163.3 157.5 157.5 5: 157.5 UL lim
Community CPE Indoors 5 64 5 163.3 157.5 157.5 5: 157.5 UL lim
Macro CPE Indoors 10 64 5 162.1 157.5 157.5 5: 157.5 UL lim
Community CPE Indoors 10 64 5 162.1 157.5 157.5 5: 157.5 UL lim
Macro CPE Indoors 5 67 5 166.3 157.5 157.5 5: 157.5 UL lim
Community CPE Indoors 5 67 5 166.3 157.5 157.5 5: 157.5 UL lim
Macro CPE Indoors 10 67 5 159.1 157.5 157.5 5: 157.5 UL lim
Community CPE Indoors 10 67 5 159.1 157.5 157.5 5: 157.5 UL lim
Macro UE Outdoors 10 67 2 147.9 149.4 147.9 4: 147.9 UL lim
Community UE Outdoors 10 67 2 147.9 149.4 147.9 4: 147.9 UL lim
Macro UE Outdoors 5 67 2 146.2 149.4 146.2 4: 147.9 UL lim
Community UE Outdoors 5 67 2 146.2 149.4 146.2 4: 147.9 UL lim
Macro UE Outdoors 10 67 5 145.1 149.4 145.1 4: 147.9 UL lim
Community UE Outdoors 10 64 5 145.1 149.4 145.1 3: 144.9 UL lim
Macro UE Outdoors 10 64 2 144.9 149.4 144.9 3: 144.9 UL lim
Community UE Outdoors 10 64 2 144.9 149.4 144.9 3: 144.9 UL lim
Macro UE Outdoors 5 64 2 143.2 149.4 143.2 3: 144.9 UL lim
Community UE Outdoors 5 64 2 143.2 149.4 143.2 3: 144.9 UL lim
Macro UE Outdoors 5 67 5 140.9 149.4 140.9 3: 144.9 UL lim
Community UE Outdoors 5 67 5 140.9 149.4 140.9 3: 144.9 UL lim
Macro UE Outdoors 10 64 5 142.1 149.4 142.1 3: 144.9 DL lim
Community UE Outdoors 10 64 5 142.1 149.4 142.1 3: 144.9 DL lim
Macro UE Outdoors 5 64 5 136.3 137.8 136.3 2: 136.3 DL lim
Community UE Outdoors 5 64 5 136.3 137.8 136.3 2: 136.3 DL lim
Macro UE Indoors 10 67 2 137.9 149.4 137.9 2: 136.3 DL lim
Community UE Indoors 10 67 2 137.9 149.4 137.9 2: 136.3 DL lim

Cost of extending 800 MHz mobile broadband coverage obligation for the UK 27
Macro UE Indoors 5 67 2 134.7 137.8 134.7 2: 136.3 DL lim
Community UE Indoors 5 67 2 134.7 137.8 134.7 2: 136.3 DL lim
Macro UE Indoors 10 67 5 133.5 137.8 133.5 1: 133.3 DL lim
Community UE Indoors 10 67 5 133.5 137.8 133.5 1: 133.3 DL lim
Macro UE Indoors 10 64 2 133.3 137.8 133.3 1: 133.3 DL lim
Community UE Indoors 10 64 2 133.3 137.8 133.3 1: 133.3 DL lim
Macro UE Indoors 5 64 2 131.7 137.8 131.7 1: 133.3 DL lim
Community UE Indoors 5 64 2 131.7 137.8 131.7 1: 133.3 DL lim
Macro UE Indoors 5 67 5 129.3 137.8 129.3 1: 133.3 DL lim
Community UE Indoors 5 69 5 129.3 137.8 129.3 1: 133.3 DL lim
Macro UE Indoors 10 64 5 130.5 137.8 130.5 1: 133.3 DL lim
Community UE Indoors 10 64 5 130.5 137.8 130.5 1: 133.3 DL lim
Macro UE Indoors 5 64 5 126.3 137.8 126.3 1: 133.3 DL lim
Community UE Indoors 5 64 5 126.3 137.8 126.3 1: 133.3 DL lim
2.4 Capacity
The proposed coverage obligation did not include any prescription relating to capacity, and could in principle be met if only a single user could be provided with service by a given base station sector at a time. In practice, while this would set the potential throughput available to a user at quiet times in the network, it could lead to significant service degradation at busy times, potentially to below a level at which an adequate service could be provided. While a detailed analysis of capacity was beyond the scope of this analysis, it was agreed in discussion with Ofcom to set an indicative capacity constraint to be applied to each individual site. This would also help to inform the question of whether a 2 x 5 MHz block of spectrum was sufficient to deliver the coverage obligation at acceptable cost.
The following constraint was applied:
Each domestic address served by a base station sector is assumed to require a minimum number of LTE resource blocks, with a 50:1 contention ratio, net of 20% overheads.
For 2 Mbps, this maximum was set at 5 resource blocks per sector. This corresponds to a maximum of 510 domestic addresses served by a three sector site using 2 x 5 MHz of spectrum
It corresponds to 1020 domestic addresses served by a three-sector sites using 2 x 10 MHz of 800 MHz spectrum.
In the case of a 5 Mbps throughput obligation, we examined both cases where the capacity requirement was the same, at 5 resource blocks per sector, and where the capacity requirement was increased in proportion to the throughput requirement, i.e. to 12.5 resource blocks.
Where the number of domestic addresses a site could cover (below the MAPL) exceeds these levels, the site is assumed to serve the 510 or 1020 domestic addresses (or such lower number as required to produce a whole number of locations) at locations with the lowest path loss values, and the remaining locations are marked as unserved.

Cost of extending 800 MHz mobile broadband coverage obligation for the UK 28
2.5 Study region selection
While the proposed coverage obligation applies to the whole of the UK, analysis of the whole country at the desired level of detail was not practical within the time available. Instead it was decided to focus the study on four study regions, representative of areas which might exhibit poor coverage based on coverage from upgraded existing sites.
Regions were selected based on the following criteria:
Exhibiting a significant concentration and overall number of 2G not-spots based on existing Ofcom data
Exhibiting a wide range of challenging terrain and low population density
Providing a reasonable spread of locations across the nations and regions of the UK
As large as feasible
Figure 2-7 indicates the use of Ofcom not-spot data to target the study regions. While Ofcom has since published more detailed not-spot data, the data available at the time of the study provided useful guidance. Regions were selected as contiguous sets of counties.
Four regions were chosen in total and were:
Region 1 – Northern and Mid Wales, comprising the following counties:
Aberconwy and Colwyn
Carmarthenshire
Ceredigion
Denbughshire
Gwynedd
Powys
Region 2 – Southwest Northern Ireland, comprising the following counties:
Tyrone
Fermanagh
Region 3 – Southern Scotland, comprising the following counties:
East Lothian
Mid Lothian
Scottish Borders
Region 4 – Northern England, comprising the following counties:
Cumbria
Northumberland
Together these four regions constitute 63% of the population of the not-spot data set provided by Ofcom (527,199 out of 841,094). In each case the counties listed were used as the focus area for the study, while buffer regions were additionally set up to surround them (as described in §2.1). Maps of the study regions are shown in Figure 2-8: , while population and land area statistics are provided in Table 2-5. More detailed maps including postcode locations, clutter and terrain are presented in Annex 1.

Cost of extending 800 MHz mobile broadband coverage obligation for the UK 29
Figure 2-7 High level view of UK ‘Not spots’ Red lines indicate county boundaries. The size of the black circles indicate the relative size of 2G not-spots based on Ofcom data.
Table 2-5: Summary statistics of the study regions
Proportion of nation
Proportion of UK
Study region Population Area (km2)
Population Area Population Area
1 - Mid & North Wales
693,000 13,028 24% 63% 1.2% 5%
2 - Southern Scotland
278,000 5,765 5% 7% 0.5% 2%
3 - Northern England
795,000 11,781 2% 9% 1.4% 5%
4 – South-West Northern Ireland
224,000 4,977 13% 37% 0.4% 2%

Cost of extending 800 MHz mobile broadband coverage obligation for the UK 30
Region 1 – Northern and Mid Wales Region 2 – Southwest Northern Ireland
Region 3 – Southern Scotland Region 4 –Northern England
Figure 2-8: Study region maps Solid lines indicate the focus areas, while dotted lines bound the buffer areas

Cost of extending 800 MHz mobile broadband coverage obligation for the UK 31
2.6 Alternate topologies
Conventionally, provision of coverage for mobile services starts with the use of macrocells, which can deliver coverage over a wide area, and delivers that service directly from the macrocells to mobile devices (phones and other mobile-enabled devices). However, given that areas with currently poor coverage are likely to be uneconomic to provide service via conventional means, it was desirable in our study to examine alternative network topologies, which could potentially be more cost-effective in some cases.
This section provides a further definition of those topologies in terms of:
Definition of the topology itself
Differences in key radio parameters which affect the number of sites required to deliver a given service
Cost differences per site (including the cost of CPE where applicable)
Commercial status
Potential differences in the service delivered
In summary, the topologies examined are:
“Standard macrocell”
Use of LTE macrocells to deliver service directly to indoor users with mobile devices
“Window-ledge CPE”
Employ a user-deployed CPE device to „relay‟ LTE service from conventional macrocells to the user device
Such devices may reduce the number of macrocells to deliver a given service level, while avoiding the costs of a professional installation involving outdoor antennas etc.
The CPE may take various forms, with different potential impacts on the service delivered in terms of supporting devices, mobility etc.
Outdoor community small cell
Use of LTE outdoor “small cells” to directly provide service to indoor LTE devices
Such small cells may reduce the cost of deployment per site compared with standard macrocells, because they operate from lower sites, more likely to be located close to the users served and with reduced power and operational complexity. They build on the self-organising network principles and economies of scales introduced originally via femtocells
Such small cells may actually provide less coverage and capacity than a given macrocell, but may nevertheless reduce overall cost
They may also be used to allow service in places where site acquisition constraints would prevent or substantially delay deployment of conventional macrocells
2.6.1 Standard macrocells
Figure 2-9 illustrates the traditional topology for a mobile network, which has been based on the deployment of macrocell sites which are typically tower mounted (particularly for rural areas) or on building rooftops. The use of terrain features (hills and mountains) can be used to enhance coverage for a given height above local ground level. In order to deliver an indoor service, the signal must overcome losses

Cost of extending 800 MHz mobile broadband coverage obligation for the UK 32
due to clutter (especially buildings) and terrain, which typically acts as the limiting constraint on the range available from a site. Figure 2-9 shows the basic concept for a standard macro cell deployment.
The mean costs per site in rural areas may be higher than those for macrocells in other geographies, particularly due to site access, power and backhaul challenges and therefore as part of the cost modelling we have factored in a range of additional costs for these items. It should also be noted that an important consideration is the practicality of the site location and the sensitivity of building regulations in certain areas which may impose time and practicality constraints beyond those which can be included in an analysis of costs.
Figure 2-9 Standard macrocell deployment
2.6.2 Window ledge CPE
Given that the coverage obligation is specified for an indoor user, potentially on the ground floor of a building, direct delivery of service to a mobile device requires the macrocell to overcome substantial indoor propagation losses. Although these may be smaller for some buildings at 800 MHz than at higher frequencies, the path loss analysis in § 2.3 indicates that they are still a significant contribution to the cost of delivering the service. One approach to reducing this cost would be to deploy customer premises equipment (CPE) which „relays‟ the signal from a location with relatively high signal from the outdoor cell to other indoor locations, as illustrated in Figure 2-10.
Costs could be minimised by user installation on a window ledge or similar in a direction which faces the largest outdoor signal strength, thereby minimising the indoor loss, potentially to close to zero (simple indicators could facilitate this). Additionally, by selecting a location on an upper floor some height gain can be achieved, further reducing the path loss to the most advantageous outdoor base station. Given the static location of the device and the relatively line-of-sight propagation environment, there is potentially an opportunity to add significant extra antenna gain to the CPE device, and thereby increasing the maximum acceptable path loss.
An access link is then provided between the CPE and mobile device which can take several forms as illustrated in Figure 2-11, but in all cases we assume that the losses

Cost of extending 800 MHz mobile broadband coverage obligation for the UK 33
between the CPE and the mobile device are small enough that the backhaul link to the outdoor cell is the main constraint on the service quality.
This type of topology may not be a full substitute for macrocell-delivered service as CPE is required for buildings in marginal service, and handover between CPEs unlikely. Such a service provided in isolation is arguably identical to the service which would be provided via a fixed link connected to a Wi-Fi access point or femtocell, so may not constitute a fully mobile service. There are also various potential upsides and constraints associated with the different access link options, as summarised in Table 2-6. However, this solution provides a potentially cost effective way of delivering a service with reduced need to build additional macro sites, and provided there is also sufficient outdoor coverage in the vicinity of buildings served in this way, the service may be viable. Devices need only be deployed in locations where the directly delivered service is inadequate, and consumers may be motivated to bear some or all of the cost themselves. Such devices are already in use in some international LTE deployments. We discussed technical and cost parameters with existing device manufacturers in forming our views on the appropriate parameters to use in our modelling.
Figure 2-10 Window ledge CPE deployment

Cost of extending 800 MHz mobile broadband coverage obligation for the UK 34
Figure 2-11: Options for access link from window-ledge CPE
Table 2-6: Potential implications of differing CPE access link types
Type Issues arising (“+” are advantages, “-“ are disadvantages)
Wi-Fi + Supported in wide range of mobile devices + Simple support for internet services + Can give broad feature parity with 3G / LTE via use of GAN (UMA) Not supported in all mobile devices, including LTE dongles and most of today‟s feature phones Wi-Fi may not be switched on a given device GAN requires explicit support in mobile devices (i.e. not all Wi-Fi devices can support operator-delivered services, notably voice and SMS). Can build SIP or GAN client into the CPE, but still need device support Lack of native support for over-the-air QoS
3G femtocell + Support for all 3G phones and other devices + Fully operator managed + Direct support for voice and SMS - Higher CPE cost than Wi-Fi
LTE femtocell + Support for all LTE devices (assuming appropriate choice of frequency band(s)) + Support for all LTE services Higher CPE cost than Wi-Fi - Capacity impact in LTE bands of carrying traffic on both backhaul and access links
LTE relay node (Defined device in 3GPP standards)
+ Transparent support for all LTE services - Capacity impact in LTE bands of carrying traffic on both backhaul and access links - Industry ecosystem support not clear at this stage

Cost of extending 800 MHz mobile broadband coverage obligation for the UK 35
2.6.3 Outdoor community cell
An outdoor community cell is considered to be a low cost cell deployed close to the built up part of the rural towns and villages. The transmitter equipment may be deployed on street furniture to reduce cost and planning complexity (in some cases these will have existing power and backhaul), some examples of which are:
CCTV poles
Lampposts
Phone boxes
Side walls of buildings
We can envisage two main types of community cell which include:
“Metrocells” based on evolved femtocell/small cell technology, with reduced antenna height, power and capacity compared with standard macrocells. Possibly omnidirectional antenna
“Street furniture site”: essentially a full three-sector macrocell with reduced antenna height
Figure 2-12 indicates an example deployment for an outdoor community cell when located in close proximity to the residential part of the village, along with examples of a metrocell and a typical street furniture site.
Concept Metrocell Street furniture
Figure 2-12 Example outdoor community cell deployment
For our study we have analysed street furniture sites with a height and cost base representative of the street furniture sites which are sometimes deployed by operators today, typically in response to planning constraints. This provided greater certainty for our study, but we note that other options may be still more cost-effective in some cases in future. On the other hand, it may be that in practice some street

Cost of extending 800 MHz mobile broadband coverage obligation for the UK 36
furniture sites may exhibit greater power, capacity and cost constraints than we have factored into our analysis.
2.7 Cost modelling
In order to represent the costs of building new sites in rural areas, we have conducted a cost analysis including both capital (capex) and operational (opex) costs for both full macrocells and street furniture community cells. Our costs are based on 25m high towers for greenfield macrocells and 12m high columns for street furniture community cells.Rural sites, by their very nature remote from existing services, present particular challenges that can lead to significant cost impacts which are intrinsically uncertain given the paucity of existing sites in locations of interest to this study. We have also estimated costs for window ledge CPE devices, taking into account manufacturer views and our own considerations.
We estimated average site unit costs, including ranges for items with significant uncertainty. Note that these ranges are intended to indicate the range of the average costs, rather than the extremes of the range for any individual site. Civil works include site acquisition, design, ground works, electrical supply, and all builders‟ costs. Equipment costs include the tower, antennas, feeders, cabinets, backhaul link electronics and base station electronics. Opex for macro and community cell sites include rent, vendor services & maintenance, and rates & utilities. CPE Opex covers support and maintenance. We have used costs calculated in 2007 as the baseline for the costs here with an RPI increase to bring them in line with 2011 prices.
The resulting unit costs are summarised in Table 2-7.
Table 2-7: Unit costs for rural base station sites and window ledge CPE
Macro cell site, LTE & 2G/3G
Capex
Civil works High: £191k, Low: £26k
Equipment £62k
Opex
All items £16k
Community cell site
Capex
Civil works High: £39k, Low: £13k
Equipment £27k
Opex
All items £8k
Window ledge CPE
Capex
Site Capex same as a macro cell

Cost of extending 800 MHz mobile broadband coverage obligation for the UK 37
CPE £100
Opex
Site Opex same as a macro cell
CPE £10
The unit costs were converted into a present value, on a simplified basis prescribed to us by Ofcom, using the following assumptions:
20 year present value calculation
No account taken for price trends
10 year equipment lifetime (4 years for CPE)
Civil works cost not repeated during 20 year period, but no residual value assumed at end of period
3.5% social discount rate
The outcome is summarised in Table 2-8. For comparison, the Ofcom long range incremental cost analysis for 2014 provides new build macrocell costs of £134,000 capex and £15,000 opex, yielding a £375,000 present value, which is at the low end of our range as expected given the specifically rural nature of the sites in our analysis.
Table 2-8: Site and CPE cost assumptions
Costs Macrocell Low (£000)
Macrocell High (£000)
Street Furniture low (£000)
Street Furniture high (£000)
CPE per address (£)
CAPEX 88 253 41 68 100
OPEX 16 16 8 8 10
Present value (PV)
363 529 178 205 534
Hence our overall model of the incremental cost (after upgrading existing sites) of providing service to meet the coverage obligation for a given network configuration is:
PV cost of extending coverage = Number of new sites x PV cost per site for relevant site type + Number of addresses served via CPE x PV cost per CPE
2.8 Limitations of our modelling approach
We have used our best endeavours to analyse the costs in a credible and meaningful fashion. In particular we have addressed the key limitations of previous work in accounting for the specific distributions of terrain and population in the areas under study. Nevertheless, a number of limitations in the modelling process should be considered when considering the significance of the results, including the following:
Regions studied: For reasons of time and complexity we have not studied the whole of the UK. Nevertheless our four study regions were chosen to be

Cost of extending 800 MHz mobile broadband coverage obligation for the UK 38
indicative of the challenges faced in extending coverage in general, and together represent a significant proportion of the entirety of areas underserved by existing operator sites.
Site optimality: Determining the most cost-effective location for a new site is a challenging problem requiring an exhaustive search of an enormous search space to be fully optimal. Instead we created an algorithm which provided a reasonably cost-efficient site selection, and used the same algorithm when comparing the costs between different input conditions.
Availability of sites and backhaul: Although our model allows us to mask areas where availability of sites and backhaul is particularly challenging, we have not used this capability in the results presented here. We have instead assumed that any desired site location is available and that appropriate backhaul can be provided to that location at the same cost for every site. In practice, this may not be true and operators may need to spend significant extra time or cost on construction in particular locations; even then some sites may be simply impossible to create. On the other hand, we have also not accounted for the fact that in some cases existing sites are present in the areas of interest and could be accessed and upgraded at significantly lower cost than we have assumed.
Costs: We have constructed a bottom-up assessment of the costs of building and operating sites (both conventional macrocells and street furniture sites) in challenging locations and considered a range of costs for the cost factors of greatest influence and uncertainty. We have assessed these costs on a present value basis according to an approach specified by Ofcom. However, in practice the costs for individual sites may vary substantially and operator views on the appropriate approach to creating the present value may vary depending on their circumstances.
Propagation: Radio wave propagation is subject to various uncertainties in practice, which make modelling challenging. We have used credible models from published sources and parameters based on previous Ofcom work and our best endeavours, and have accounted for key uncertainties in our link budgets. Nevertheless we do not have access to the detailed proprietary models and measurement databases which operators use in their own planning work so our results may not match those which an operator would determine for themselves.
Site parameters: We have assumed that an operator could upgrade all of their existing sites to support 800 MHz LTE, which may not be true for some sites due to physical limitations. Likewise, we have assumed that all newly built sites have the same parameters, including their transmit power, antenna gains and existing heights. In practice there will be variations due to specific physical and planning constraints.
Despite these limitations, we believe that our analysis is fit for the intended purpose, meeting Ofcom‟s desire to analyse the impact of potential changes to their policy regarding the 800 MHz coverage obligation as previously specified.

Cost of extending 800 MHz mobile broadband coverage obligation for the UK 39
3 Coverage delivered by existing sites varies by region and according to the spectrum available
This section provides a selection of the key results produced by the model for a single existing network. Additional coverage plots are provided on our website at www.realwireless.biz/800coverage
3.1 Existing LTE coverage
Figure 3-2 shows the coverage provided by the existing sites of one network operator for the four study regions for these parameters:
Standard macrocell
Indoor UE
2 Mbps throughput
2x 5 MHz bandwidth
Normal transmit power.
The colour scheme used for these and subsequent coverage plots is as follows. Each pixels are coloured according to one of seven possible colours according to:
No colour: The pixel contains no postcode locations
Green: More than 60% of addresses in the pixel have service
Orange: Between 33% and 67% of addresses in the pixel have service
Red: Less than 33% of addresses in the pixel have service
Shading: o Dark the density of addresses in the pixel is higher than the average
for the study region o Light the density of addresses in the pixel is lower than the average
for the study region
In general „service‟ indicates both coverage (MAPL) and capacity constraints are satisfied, although existing sites are considered to have no capacity constraints.

Cost of extending 800 MHz mobile broadband coverage obligation for the UK 40
Table 3-1: Summary of existing coverage results (percentage of delivery addresses served in the region)
Figure 3-1: Coverage from existing sites for one operator (percentage of delivery addresses)
61%
65%
76%
70% 67%
74%
82%
79% 81%
90% 93% 93%
84%
92% 94% 95%
93%
98% 98% 99%
60%
65%
70%
75%
80%
85%
90%
95%
100%
1 - N. & Mid Wales
2 - SW N Ireland
3 - S. Scotland 4 - N England
Case 1: 133.3 dB – Normal power, indoor UE, height 1.5m
Case 2: 136.3 dB – Higher power, indoor UE, height 1.5m
Case 3: 144.9 dB – Normal power, outdoor UE, height 1.5m
Case 4: 147.9 dB – Higher power, outdoor UE, height 1.5m
Case 5: 157.5 dB – Window ledge CPE, height 3.5m
Study region
Parameters Case 1 Case 2 Case 3 Case 4 Case 5
Power Normal Higher Normal Higher Either
Location Indoor UE
Indoor UE
Outdoor UE
Outdoor UE
Window ledge CPE
MAPL (dB) 133.3 136.3 144.9 147.9 157.5
1 – N & Mid Wales
60.6% 67.4% 81.3% 84.2% 93.5%
2 - N England
70.0% 78.7% 93.1% 95.0% 98.8%
3 - S Scotland
75.6% 82.5% 92.7% 94.3% 98.0%
4 - SW NI 65.0% 73.7% 90.3% 92.5% 98.3%

Cost of extending 800 MHz mobile broadband coverage obligation for the UK 41
Figure 3-2: Coverage provided from existing sites (standard macrocell, indoor UE, 2 Mbps, 5 MHz, normal power)
Region 1 – Northern and Mid Wales 61% of delivery addresses served
Region 2 – Southwest Northern Ireland 65% of delivery addresses served
Region 3 – Southern Scotland 76% of delivery addresses served
Region 4 –Northern England 70% of delivery addresses served
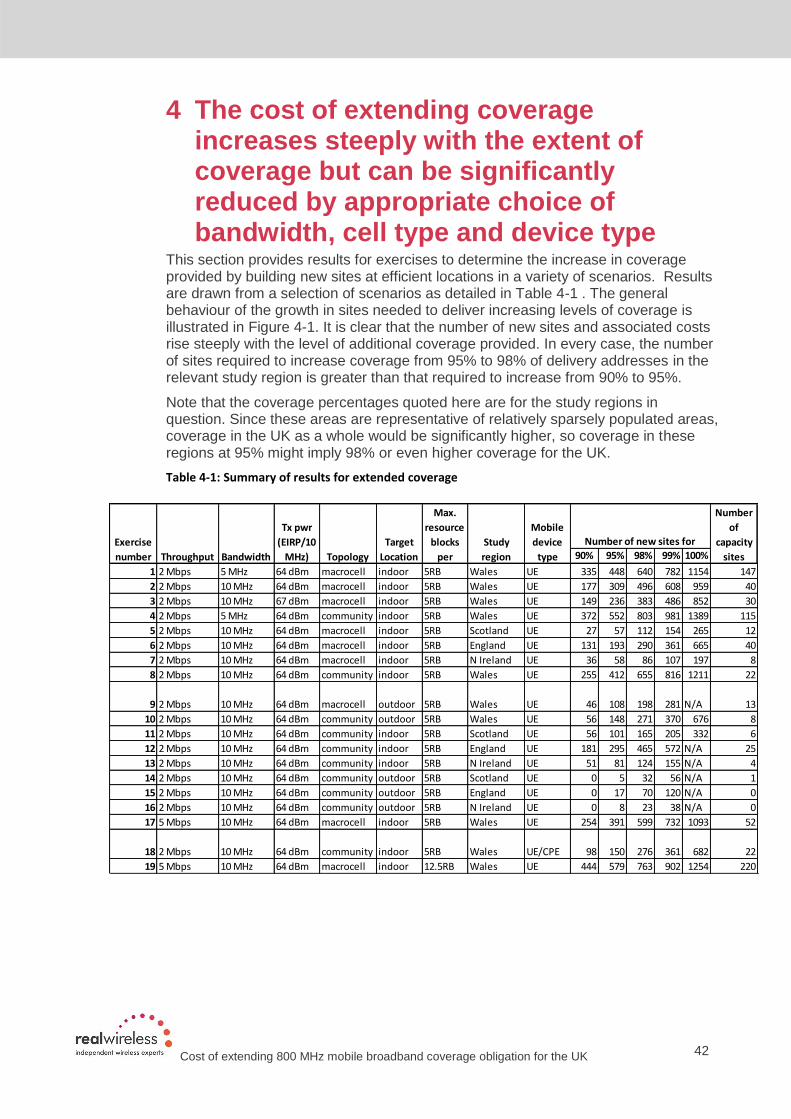
Cost of extending 800 MHz mobile broadband coverage obligation for the UK 42
4 The cost of extending coverage increases steeply with the extent of coverage but can be significantly reduced by appropriate choice of bandwidth, cell type and device type
This section provides results for exercises to determine the increase in coverage provided by building new sites at efficient locations in a variety of scenarios. Results are drawn from a selection of scenarios as detailed in Table 4-1 . The general behaviour of the growth in sites needed to deliver increasing levels of coverage is illustrated in Figure 4-1. It is clear that the number of new sites and associated costs rise steeply with the level of additional coverage provided. In every case, the number of sites required to increase coverage from 95% to 98% of delivery addresses in the relevant study region is greater than that required to increase from 90% to 95%.
Note that the coverage percentages quoted here are for the study regions in question. Since these areas are representative of relatively sparsely populated areas, coverage in the UK as a whole would be significantly higher, so coverage in these regions at 95% might imply 98% or even higher coverage for the UK.
Table 4-1: Summary of results for extended coverage
90% 95% 98% 99% 100%
1 2 Mbps 5 MHz 64 dBm macrocell indoor 5RB Wales UE 335 448 640 782 1154 147
2 2 Mbps 10 MHz 64 dBm macrocell indoor 5RB Wales UE 177 309 496 608 959 40
3 2 Mbps 10 MHz 67 dBm macrocell indoor 5RB Wales UE 149 236 383 486 852 30
4 2 Mbps 5 MHz 64 dBm community indoor 5RB Wales UE 372 552 803 981 1389 115
5 2 Mbps 10 MHz 64 dBm macrocell indoor 5RB Scotland UE 27 57 112 154 265 12
6 2 Mbps 10 MHz 64 dBm macrocell indoor 5RB England UE 131 193 290 361 665 40
7 2 Mbps 10 MHz 64 dBm macrocell indoor 5RB N Ireland UE 36 58 86 107 197 8
8 2 Mbps 10 MHz 64 dBm community indoor 5RB Wales UE 255 412 655 816 1211 22
9 2 Mbps 10 MHz 64 dBm macrocell outdoor 5RB Wales UE 46 108 198 281 N/A 13
10 2 Mbps 10 MHz 64 dBm community outdoor 5RB Wales UE 56 148 271 370 676 8
11 2 Mbps 10 MHz 64 dBm community indoor 5RB Scotland UE 56 101 165 205 332 6
12 2 Mbps 10 MHz 64 dBm community indoor 5RB England UE 181 295 465 572 N/A 25
13 2 Mbps 10 MHz 64 dBm community indoor 5RB N Ireland UE 51 81 124 155 N/A 4
14 2 Mbps 10 MHz 64 dBm community outdoor 5RB Scotland UE 0 5 32 56 N/A 1
15 2 Mbps 10 MHz 64 dBm community outdoor 5RB England UE 0 17 70 120 N/A 0
16 2 Mbps 10 MHz 64 dBm community outdoor 5RB N Ireland UE 0 8 23 38 N/A 0
17 5 Mbps 10 MHz 64 dBm macrocell indoor 5RB Wales UE 254 391 599 732 1093 52
18 2 Mbps 10 MHz 64 dBm community indoor 5RB Wales UE/CPE 98 150 276 361 682 22
19 5 Mbps 10 MHz 64 dBm macrocell indoor 12.5RB Wales UE 444 579 763 902 1254 220
Number
of
capacity
sites
Exercise
number
Study
region
Mobile
device
type
Number of new sites for
Throughput Bandwidth
Tx pwr
(EIRP/10
MHz) Topology
Target
Location
Max.
resource
blocks
per

Cost of extending 800 MHz mobile broadband coverage obligation for the UK 43
Figure 4-1: Additional sites required to extend coverage for one operator in the relevant study region as defined in Table 4-1
4.1 Cost of extending coverage: Wales study area, macrocells and community cells
Here we compare the cost of extending coverage between macrocells and community cells in the Wales study area (scenarios 1 and 4 in Table 4-1). The input parameters are:
Wales study region
2Mbps throughput obligation
2 x 5MHz bandwidth
Normal power (64dBm/10MHz)
Macrocells and community cells
Target indoor coverage directly to mobile device
By way of example of how coverage and cost varies geographically as the number of macrocell sites increases, see Table 4-2.
Figure 4-3 shows how the coverage increases with the number of sites, showing both the targetted indoor coverage and the associated outdoor coverage. There are substantial differences between the environments, but the gap narrows as the density of sites increases. In both cases, the number of sites required to achieve a given increment in coverage increases substantially as the required coverage increases.
Comparing the coverage for a given number of macrocells and community cells, the growth in coverage with the number of sites is initially rather similar, since the sites initially built to serve the largest number of additional addresses are capacity-constrained. After several hundred sites are built, the coverage per site from
0
200
400
600
800
1000
1200
1400
1600
88% 90% 92% 94% 96% 98% 100%
Additional sites required for one operator in the relevant study
region
Percentage of delivery addresses served
1 2 3 4 5 6 7
8 9 10 11 12 13 14
15 16 17 18 19
Exercise number: (defined in table 4-1)

Cost of extending 800 MHz mobile broadband coverage obligation for the UK 44
macrocells becomes larger, but the difference is only a few percentage points at most. Figure 4-3 displays the associated costs, showing both the high end and the low end of our estimated average site cost on a present value basis. Given the smaller cost per community cell, such cells appear to be a more cost effective means of increasing coverage. Some specific values are shown in Table 4-3.
In Figure 4-4 we display the incremental cost required to serve an additional domestic address. The cost increases very rapidly at high levels of coverage, as additional sites serve very few premises each but incur the same individual costs. Specific values are provided in Table 4-4: the cost per premise using community cells is roughly half that of using macrocells given the assumptions we have made.

Cost of extending 800 MHz mobile broadband coverage obligation for the UK 45
Table 4-2: Illustrative coverage plots for new site build, Wales study region, 2Mbps, 5MHz, normal power (64dBm/10MHz), indoor coverage target, macrocells
Plot
Indoor coverage % 61% (coverage from existing sites)
90%
New sites 0 335
Cost (high) 0 £177.1m
Plot
Indoor Coverage % 95% 98%
New sites 448 640
Cost (high) £236.8m £338.3m
Plot
No plot available for this case
Indoor Coverage % 99% 100%
New sites 782 1154
Cost (high) £413.4m £610m

Cost of extending 800 MHz mobile broadband coverage obligation for the UK 46
Macrocells (scenario 1) Community cells (scenario 4)
Figure 4-2: Coverage versus new sites built, Wales study region, 2Mbps, 5MHz, normal power (64dBm/10MHz), indoor coverage target
Macrocells (scenario 1) Community cells (scenario 4)
Figure 4-3: Coverage versus cost, Wales study region, 2Mbps, 5MHz, normal power (64dBm/10MHz), indoor coverage target
Table 4-3: Comparative total costs between macrocells and community cells, Wales study region, 2Mbps, 5MHz, normal power (64dBm/10MHz), indoor coverage target
Macrocells Community cells
Cost of 100% indoor (High) £609m £284m
Cost of 100% indoor (Low) £609m £247m
Cost of 99% indoor(High) £413m £200m
Cost of 99% indoor (Low) £284m £175m
55%
60%
65%
70%
75%
80%
85%
90%
95%
100%
0
20
0
40
0
60
0
80
0
1,0
00
1,2
00
1,4
00
Co
vera
ge (
%)
New sites
Indoor
Outdoor 55%
60%
65%
70%
75%
80%
85%
90%
95%
100%
0
20
0
40
0
60
0
80
0
1,0
00
1,2
00
1,4
00
Co
vera
ge (
%)
New sites
Indoor
Outdoor
50%
55%
60%
65%
70%
75%
80%
85%
90%
95%
100%
0 200 400 600
Cost
(£m, 25 yearPV)
Coverage
High end - Indoor
Low end - Indoor
50%
55%
60%
65%
70%
75%
80%
85%
90%
95%
100%
0 200 400 600
Cost
(£m, 25 yearPV)
Coverage
High end - Indoor
Low end - Indoor

Cost of extending 800 MHz mobile broadband coverage obligation for the UK 47
Macrocells (scenario 1) Community cells (scenario 4)
Figure 4-4: Cost per additional premise served, Wales study region, 2Mbps, 5MHz, normal power (64dBm/10MHz), indoor coverage target
Table 4-4: Comparative incremental cost per premise between macrocells and community cells, Wales study region, 2Mbps, 5MHz, normal power (64dBm/10MHz), indoor coverage target
Macrocells Community cells
Cost per premise at 99% indoor(High)
£27.8k per premises £13.6k per premises
Cost per premise at 99% indoor (Low)
£19.1k per premises £11.9k per premises
4.2 Cost of extending coverage: Wales study area, impact of bandwidth
Here we compare the cost of extending coverage between macrocells with bandwidths of 5 MHz and 10 MHz in the Wales study area (scenarios 1 and 2 in Table 4-1). The input parameters are:
Wales study region
2Mbps throughput obligation
2 x 5MHz and 2 x 10 MHz bandwidth
Normal power (64dBm/10MHz)
Macrocells
Target indoor coverage directly to mobile device
Figure 4-5 indicates a clear difference between the numbers of sites required to extend coverage for 5 MHz compared with 10 MHz. Around the first 150 sites are capacity limited in the 5 MHz case, while only 115 sites are capacity limited with 10 MHz. Thus the expenditure on each site can more cost-effectively provide service to a larger number of addresses with the wider bandwidth, as demonstrated in the cost curves of Figure 4-6. Indeed, the costs with 10 MHz are roughly 20% lower than those with 5 MHz, as indicated in
0
1
10
100
50% 60% 70% 80% 90% 100%
Cost per premises
(£k, 25 yearPV)
Coverage (Domestic addresses)
High end indoor
Low end - Indoor
0
1
10
100
50% 60% 70% 80% 90% 100%
Cost per premises
(£k, 25 yearPV)
Coverage (Domestic addresses)
High end indoor
Low end - Indoor

Cost of extending 800 MHz mobile broadband coverage obligation for the UK 48
Table 4-5. The fact that initial sites are capacity constrained may appear counter-intuitive given that mobile networks are usually considered initially coverage-constrained, but reflects the decreasing population density as the population served increases in these study areas. The incremental costs per premise are compared in Figure 4-7 and Table 4-6.
We adopt 10 MHz for the subsequent results examined in this section.
5 MHz bandwidth (scenario 1) 10 MHz bandwidth (scenario 2)
Figure 4-5: Coverage versus new sites built, Wales study region, 2Mbps, 5MHz and 10 MHz, normal power (64dBm/10MHz), indoor coverage target
5 MHz bandwidth (scenario 1) 10 MHz bandwidth (scenario 2)
Figure 4-6: Coverage versus cost, Wales study region, 2Mbps, 5MHz, normal power (64dBm/10MHz), indoor coverage target
55%
60%
65%
70%
75%
80%
85%
90%
95%
100%
0
20
0
40
0
60
0
80
0
1,0
00
1,2
00
Co
vera
ge (
%)
New sites
Indoor
Outdoor 55%
60%
65%
70%
75%
80%
85%
90%
95%
100%
0
20
0
40
0
60
0
80
0
1,0
00
1,2
00
Co
vera
ge (
%)
New sites
Indoor
Outdoor
55%
60%
65%
70%
75%
80%
85%
90%
95%
100%
0 200 400 600 Cost
(£m, 25 yearPV)
Coverage
High end - Indoor
Low end - Indoor
55%
60%
65%
70%
75%
80%
85%
90%
95%
100%
0 200 400 600 Cost
(£m, 25 yearPV)
Coverage
High end - Indoor
Low end - Indoor

Cost of extending 800 MHz mobile broadband coverage obligation for the UK 49
Table 4-5Comparative total costs between macrocells and community cells, Wales study region, 2Mbps, 5MHz, normal power (64dBm/10MHz), indoor coverage target
5 MHz bandwidth 10 MHz bandwidth
Cost of 100% indoor (High) £609m £507m
Cost of 100% indoor (Low) £419m £348m
Cost of 99% indoor(High) £413m £321m
Cost of 99% indoor (Low) £284m £220m
5 MHz bandwidth (scenario 1) 10 MHz bandwidth (scenario 2)
Figure 4-7: Cost per additional premise served, Wales study region, 2Mbps, 5MHz, normal power (64dBm/10MHz), indoor coverage target
Table 4-6: Comparative incremental cost per premise between 5 MHz and 10 MHz bandwidths, macro cells Wales study region, 2Mbps, 5MHz, normal power (64dBm/10MHz), indoor coverage target
5 MHz bandwidth 10 MHz bandwidth
Cost per premise at 99% indoor(High)
£27.8k per premises £26.4k per premises
Cost per premise at 99% indoor (Low)
£19.1k per premises £18.1k per premises
0
1
10
100
55% 65% 75% 85% 95%
Cost per premises
(£k, 25 yearPV)
Coverage (Domestic addresses)
High end indoor
Low end - Indoor
0
1
10
100
55% 65% 75% 85% 95%
Cost per premises
(£k, 25 yearPV)
Coverage (Domestic addresses)
High end indoor
Low end - Indoor

Cost of extending 800 MHz mobile broadband coverage obligation for the UK 50
4.3 Cost of extending coverage: Wales study area, impact of transmit power
Here we examine the potential for increasing the permitted transmit power to extend the coverage the coverage between macrocells in the Wales study area (scenarios 2 and 3 in Table 4-1). The input parameters are:
Wales study region
2Mbps throughput obligation
2 x 10MHzbandwidth
Normal power (64dBm/10MHz) and high power (67 dBm/10 MHz)
Macrocells
Target indoor coverage directly to mobile device
Figure 4-8 compares the outcomes. The coverage from existing sites is a few percentage points higher with the higher power, but the differences diminish to around 1 percentage point after 100 new sites are built. Given potential additional costs of the higher power transmitters (which are not explicitly included in the comparisons of Figure 4-9) and the extra potential for interference to adjacent systems, this may not be an cost-effective option. For subsequent results we adopt the EIRP limit of 64 dBm/10MHz as suggested by Ofcom in their consultation on technical licence conditions for the 800 MHz band.
64 dBm/10 MHz (scenario 2) 67 dBm/10 MHz (scenario 3)
Figure 4-8: Coverage versus new sites built, Wales study region, 2Mbps, 10MHz, normal power and high power macro cells, indoor coverage target
65%
70%
75%
80%
85%
90%
95%
100%
0
20
0
40
0
60
0
80
0
1,0
00
1,2
00
Co
vera
ge (
%)
New sites
Indoor
Outdoor
65%
70%
75%
80%
85%
90%
95%
100%
0
20
0
40
0
60
0
80
0
1,0
00
1,2
00
Co
vera
ge (
%)
New sites
Indoor
Outdoor

Cost of extending 800 MHz mobile broadband coverage obligation for the UK 51
64 dBm/10 MHz (scenario 2) 67 dBm/10 MHz (scenario 3)
Figure 4-9: Coverage versus cost, Wales study region, 2Mbps, 10MHz, indoor coverage target
Table 4-7: Comparative total costs between normal power and high power, Wales study region, 2Mbps, 10MHz,macro cells, indoor coverage target
Normal power (64 dBm/ 10 MHz)
High power (67 dBm/10 MHz)
Cost of 100% indoor (High) £507m £450m
Cost of 100% indoor (Low) £348m £310m
Cost of 99% indoor(High) £321m £257m
Cost of 99% indoor (Low) £220m £176m
Normal power (scenario 2) High power (scenario 3) Figure 4-10: Cost per additional premise served, Wales study region, 2Mbps, 10MHz, normal power (64dBm/10MHz), indoor coverage target
60%
65%
70%
75%
80%
85%
90%
95%
100%
0 200 400
Cost
(£m, 25 yearPV)
Coverage
High end - Indoor
Low end - Indoor
60%
65%
70%
75%
80%
85%
90%
95%
100%
0 200 400
Cost
(£m, 25 yearPV)
Coverage
High end Indoor
Low end - Indoor
0
1
10
100
60% 70% 80% 90% 100%
Cost per premises
(£k, 25 yearPV)
Coverage (Domestic addresses)
High end indoor Low end - Indoor
0
1
10
100
60% 70% 80% 90% 100%
Cost per premises
(£k, 25 yearPV)
Coverage (Domestic addresses)
High end indoor Low end - Indoor

Cost of extending 800 MHz mobile broadband coverage obligation for the UK 52
Table 4-8: Comparative incremental cost per premise between macrocells and community cells, Wales study region, 2Mbps, 10MHz, normal power (64dBm/10MHz), indoor coverage target
Normal power High power
Cost per premise at 99% indoor(High)
£26.4k per premises £22.7k per premises
Cost per premise at 99% indoor (Low)
£18.1k per premises £15.8k per premises
4.4 Cost of extending coverage: Wales study area, impact of throughput obligation
Some respondents to Ofcom‟s consultation suggested that the throughput obligation should be higher than 2 Mbps. Here we compare the cost of extending coverage between macrocells with throughput obligation of 2 Mbps and 5 Mbps in the Wales study area (scenarios 2 and 19 in Table 4-1). The input parameters are:
Wales study region
2Mbps and 5 Mbps throughput obligation (at least 5 and 12.5 resource blocks required respectively)
2 x 10MHz bandwidth
Normal power (64dBm/10MHz)
Macrocells
Target indoor coverage directly to mobile device
Note that a potential 5 Mbps throughput obligation is more challenging than for 2 Mbps for two distinct reasons: first, coverage at the higher level requires a higher signal to noise level, reducing the maximum range of a given site. Second, the higher throughput also requires a greater share of the available bandwidth for a given contention ratio, so capacity constraints are more significant. The results in Figure 4-17 are consistent with those points, exhibiting both lower coverage from the existing sites and lower coverage for a given number of sites. This is also indicated by approximately 50% higher total cost in Table 4-9 and higher cost per premise in Figure 4-13, particularly for the initial coverage extension.
2 Mbps Tput obligation (scenario 2) 5 Mbps Tput obligation (scenario 19)
Figure 4-11: Coverage versus new sites built, Wales study region, 2Mbps and 5 Mbps, 10 MHz, normal power (64dBm/10MHz), indoor coverage target
50% 55% 60% 65% 70% 75% 80% 85% 90% 95%
100%
0
20
0
40
0
60
0
80
0
1,0
00
Co
vera
ge (
%)
New sites
Indoor
Outdoor
50% 55% 60% 65% 70% 75% 80% 85% 90% 95%
100%
0
20
0
40
0
60
0
80
0
1,0
00
Co
vera
ge (
%)
New sites
Indoor
Outdoor

Cost of extending 800 MHz mobile broadband coverage obligation for the UK 53
2 Mbps Tput obligation (scenario 2) 5 Mbps Tput obligation (scenario 19)
Figure 4-12: Coverage versus cost, Wales study region, 2Mbps and 10 Mbps, 10 MHz, normal power (64dBm/10MHz), indoor coverage target
Table 4-9Comparative total costs between 2 Mbps and 5 Mbps, Wales study region, 10MHz, normal power (64dBm/10MHz), indoor coverage target
2 Mbps throughput obligation 5 Mbps throughput obligation
Cost of 99% indoor (High) £321m £476m
Cost of 99% indoor (Low) £220m £327m
2 Mbps Tput obligation (scenario 2) 5 Mbps Tput obligation (scenario 19) Figure 4-13: Cost per additional premise served, Wales study region, 2Mbps, 5MHz, normal power (64dBm/10MHz), indoor coverage target
Table 4-10Comparative incremental cost per premise between 2 Mbps and 5 Mbps throughput obligations, macro cells Wales study region, 2Mbps, 10MHz, normal power (64dBm/10MHz), indoor coverage target
2 Mbps throughput obligation 5 Mbps throughput obligations
Cost per premise at 99% indoor(High)
£26.4k per premises £29.3k per premises
Cost per premise at 99% indoor (Low)
£18.1k per premises £20.1k per premises
60%
65%
70%
75%
80%
85%
90%
95%
100%
0 200 400 Cost
(£m, 25 yearPV)
Coverage
High end - Indoor
Low end - Indoor 60%
65%
70%
75%
80%
85%
90%
95%
100%
0 200 400 Cost
(£m, 25 yearPV)
Coverage
High end - Indoor
Low end - Indoor
0
1
10
100
55% 75% 95%
Cost per premises
(£k, 25 yearPV)
Coverage (Domestic addresses)
High end indoor
Low end - Indoor
0
1
10
100
55% 75% 95%
Cost per premises
(£k, 25 yearPV)
Coverage (Domestic addresses)
High end - Outdoor Low end - Indoor

Cost of extending 800 MHz mobile broadband coverage obligation for the UK 54
4.5 Cost of extending coverage: Wales study area, impact of use of hybrid of community cells and window ledge CPE
Here we start from the results indicated in previous sections, of using community cells and a 2 x 10 MHz bandwidth as being cost-effective, but with normal power and a 2 Mbps throughput obligation. Despite these choices, the cost of delivering additional coverage directly to an indoor user rises rapidly at high coverage percentages given the limited number of incremental users served by additional sites in the areas of lowest population density.
One way to increase the cost effectiveness would be to make use of the “window ledge CPE” concept explained in §2.6.2. These will allow each site to provide a greater range and therefore potentially to deliver greater coverage if the site is not capacity limited. However, the additional CPE comes at an additional cost, so it may not be effective to provide CPE to all those in the extended coverage area. Indeed, this additional cost may be unnecessary for many users in providing the necessary minimum service.
The results in this section explore a „hybrid‟ approach, which proceeds as follows:
Initially, new sites are built targeting indoor coverage directly to indoor mobile devices
As the cost per premise of delivering additional service via this means rises, it is compared against the cost of providing additional households with service via a CPE. When this point is passed, additional service is provided via a different means
Additional sites are built to target additional outdoor coverage. This level is sufficient to both ensure service to CPEs (which have higher height and antenna gain than conventional mobile devices) and directly to on-street mobile devices. The additional costs then comprise both the cost of the additional sites and of the window ledge CPE for those locations which have outdoor but not indoor coverage only.
We describe this as a hybrid coverage approach.
The specific scenarios compared here are scenarios 8 and 18 in Table 4-1. The input parameters are:
Wales study region
2Mbps throughput obligation
2 x 10 MHz bandwidth
Normal power (64dBm/10MHz)
Community cells
Target indoor coverage directly to mobile device and window ledge CPE
Figure 4-14 shows the increase in coverage as new sites are built. At around 100 new sites the use of CPEs becomes cost effective. There is a discontinuous increase in the coverage provided, as households which would benefit from a CPE in achieving the coverage target are supplied with them, resulting in approximately 6% increase in coverage. Subsequently the coverage continues to increase, remaining always substantially above the „indoor only‟ target for a given number of additional sites.

Cost of extending 800 MHz mobile broadband coverage obligation for the UK 55
Comparing the total costs (new sites and CPE when required) in Figure 4-15, although the hybrid approach requires additional cost which reduces the potential advantage, the targeted approach ensures the costs are usually favourable relative to the conventional approach, being roughly halved at the 99% level as indicated in Table 4-11. The costs per premise are indicated in Figure 4-16 and Table 4-12.
Clearly for this hybrid approach to operate successfully in reducing costs to deliver a given benefit, it is important that the deployment of the CPE is targeted carefully and that the service delivered in this way is truly comparable to the service provided via conventional means, noting the potential challenges explained in §2.6.2. In practice the use of CPE could be more sophisticated than we have modelled, using the CPE whenever it is advantageous rather than only for a given number of additional sites, which could increase the associated cost-effectiveness relative to our model. On the other hand, determining the households which would most benefit and delivering to those devices will incur additional costs, so while there is potential for benefits, the full scale of these remains uncertain.
Service to indoor mobile devices (scenario 8) Hybrid service to indoor and window ledge CPE (scenario 18)
Figure 4-14: Coverage versus new sites built, Wales study region, 2Mbps, 10 MHz, normal power (64dBm/10MHz), indoor coverage target and hybrid indoor coverage and window ledge CPE
Indoor target coverage (scenario 8) Hybrid target coverage (scenario 18) Figure 4-15: Coverage versus cost, Wales study region, 2Mbps, 10MHz, normal power (64dBm/10MHz), indoor coverage target
60%
65%
70%
75%
80%
85%
90%
95%
100%
0
10
0
20
0
30
0
40
0
50
0
60
0
70
0
80
0
90
0
Co
vera
ge (
%)
New sites
Indoor
Outdoor
60%
65%
70%
75%
80%
85%
90%
95%
100%
0
10
0
20
0
30
0
40
0
50
0
60
0
70
0
80
0
90
0
Co
vera
ge (
%)
New sites
Indoor target
Hybrid target
60%
65%
70%
75%
80%
85%
90%
95%
100%
0 50 100 150 200
Cost
(£m, 25 yearPV)
Coverage
High end - Indoor
Low end - Indoor 60%
65%
70%
75%
80%
85%
90%
95%
100%
- 50 100 150 200
Co
vera
ge (
%)
Cost (£m, 25 year PV)
Low end hybrid
High end hybrid

Cost of extending 800 MHz mobile broadband coverage obligation for the UK 56
Table 4-11Comparative total costs between indoor target and hybrid community cells, Wales study region, 2Mbps, 10MHz, normal power (64dBm/10MHz)
Indoor coverage target Hybrid coverage target
Cost of 99% indoor(High) £167m £74m
Cost of 99% indoor (Low) £145m £64m
Indoor coverage target (scenario 8) Hybrid coverage target (scenario 18) Figure 4-16: Cost per additional premise served, Wales study region, 2Mbps, 10MHz, normal power (64dBm/10MHz), indoor coverage target
Table 4-12: Comparative incremental cost per premise between community cells serving indoor coverage and hybrid coverage targets 10 MHz bandwidths, Wales study region, 2Mbps, 10 MHz, normal power (64dBm/10MHz)
Indoor coverage target Hybrid coverage target
Cost per premise at 99% indoor(High)
£13.6k per premises £7.7k per premises
Cost per premise at 99% indoor (Low)
£11.7k per premises £6.7k per premises
4.6 Cost of extending coverage: comparison amongst study regions
Here we compare the cost of extending coverage between each of the four study regions (scenarios 8, 11, 12 and 13 for community cells in Table 4-1). The input parameters are:
Wales, West Northern Ireland, South Scotland and North England study regions
2Mbps throughput obligation
2 x 10 MHz bandwidth
0.1
1.0
10.0
60% 70% 80% 90% 100%
Cost per premises
(£k, 25 yearPV)
Coverage (Domestic addresses)
High end - Indoor
Low end - Indoor
0.1
1.0
10.0
60% 70% 80% 90% 100%
Co
st p
er
pre
mis
e (
£k,
25
ye
ar
PV
)
Coverage domestic addresses
Low end hybrid
high end hybrid

Cost of extending 800 MHz mobile broadband coverage obligation for the UK 57
Normal power (64dBm/10MHz)
Community cells
Target indoor coverage directly to mobile devices
Clearly the specifics of the existing coverage in each of the study regions varies and the associated absolute number of sites depends on the size of the region as shown in Figure 4-17.However the general form of the curves is comparable, with substantial increases in the number of sites needed to achieve gains at the highest coverage percentages. This is reflected in the significant incremental costs per premises shown above 90% coverage in each of the regions in Figure 4-19 and Table 4-14.
Wales study region (scenario 8) Scotland study region (scenario 11)
North England (scenario 12) North West Northern Ireland (scenario 13)
Figure 4-17: Coverage versus new sites built, Wales, Northern Ireland, North England and South Scotland study regions, 2Mbps, 10 MHz, normal power (64dBm/10MHz), indoor coverage target
60%
70%
80%
90%
100%
0
10
0
20
0
30
0
40
0
50
0
60
0
70
0
80
0
90
0
Co
vera
ge (
%)
New sites
Indoor
Outdoor 60%
70%
80%
90%
100%
0
50
10
0
15
0
20
0
25
0
30
0
35
0
Co
vera
ge (
%)
New sites
Indoor
Outdoor
60%
70%
80%
90%
100%
0
10
0
20
0
30
0
40
0
50
0
60
0
Co
vera
ge (
%)
New sites
Indoor
Outdoor 60%
70%
80%
90%
100%
0
20
40
60
80
10
0
12
0
14
0
16
0
Co
vera
ge (
%)
New sites
Indoor
Outdoor

Cost of extending 800 MHz mobile broadband coverage obligation for the UK 58
Wales study region (scenario 8) Scotland study region (scenario 11)
Northern England (scenario 12) North West Northern Ireland (scenario 13)
Figure 4-18: Coverage versus cost, Wales, South Scotland, North England and Northern Ireland study regions, 2Mbps, 10MHz, normal power (64dBm/10MHz), indoor coverage target
Table 4-13: Comparative total costs between the different study regions (West Wales, South Scotland, North England, West Northern Ireland) community cells, 2Mbps, 10MHz, normal power (64dBm/10MHz)
West Wales South Scotland North England Northern Ireland
Cost of 99% indoor(High)
£167m £42m £117m £32m
Cost of 99% indoor (Low)
£145m £36m £102m £27m
60%
70%
80%
90%
100%
0 50 100 150 200 250 Cost
(£m, 25 yearPV)
Coverage (Domestic …
High end - Indoor
Low end - Indoor
60%
70%
80%
90%
100%
0 20 40 60 Cost
(£m, 25 yearPV)
Coverage (Domestic …
High end - Indoor
Low end - Indoor
60%
70%
80%
90%
100%
0 20 40 60 80 100 120 Cost
(£m, 25 yearPV)
Coverage (Domestic …
High end - Indoor
Low end - Indoor 60%
70%
80%
90%
100%
0 10 20 30 40 Cost
(£m, 25 yearPV)
Coverage (Domestic delivery addresses)
High end - Indoor
Low end - Indoor

Cost of extending 800 MHz mobile broadband coverage obligation for the UK 59
Wales study region (scenario 8) South Scotland study region (scenario 11)
North England (scenario 12) North West Northern Ireland (scenario 13)
Figure 4-19: Cost per additional premise served, Wales, South Scotland, North England, Northern Ireland study regions, 2Mbps, 10MHz, normal power (64dBm/10MHz), indoor coverage target
Table 4-14Comparative incremental cost per premise between community cells serving indoor coverage and hybrid coverage targets 10 MHz bandwidths, Wales study region, 2Mbps, 10 MHz, normal power (64dBm/10MHz)
Wales study region
South Scotland region
North England study region
Northern Ireland study region
Cost per premise at 99% indoor(High)
£13.6k per premises
£9.3k per premises £7.5k per premises
£8.8k per premises
Cost per premise at 99% indoor (Low)
£11.7k per premises
£8.1k per premises £6.5k per premises
£7.7k per premises
0
1
10
100
60% 70% 80% 90% 100%
Cost per premises
(£k, 25 yearPV)
Coverage (Domestic addresses)
High end - Indoor
Low end - Indoor
0
1
10
100
60% 70% 80% 90% 100%
Cost per premises
(£k, 25 yearPV)
Coverage (Domestic addresses)
High end indoor
Low end - Indoor
0
1
10
100
60% 70% 80% 90% 100%
Cost per premises
(£k, 25 yearPV)
Coverage (Domestic addresses)
High end indoor
Low end - Indoor
0
1
10
100
60% 70% 80% 90% 100%
Cost per premises
(£k, 25 yearPV)
Coverage (Domestic addresses)
High end indoor
Low end - Indoor

Cost of extending 800 MHz mobile broadband coverage obligation for the UK 60
4.7 Comparison of extended coverage between GSM voice and LTE data
In this section we compare the coverage obtained for a given service (LTE data or GSM voice) when sites are built to target the other service (i.e. GSM voice or LTE data respectively) in the Wales study area. In each case, the LTE service examined is for a downlink throughput of 2 Mbps delivered in a 2 x 10 MHz bandwidth, resulting in the maximum acceptable path losses shown in Table 2-4 of §2.3. For newly-built LTE sites, the capacity constraints described in §2.4 are applied, while the capacity of GSM is assumed unconstrained. In all cases, all existing and new sites are assumed to be capable of supporting both services.
In Figure 4-20, new sites are built to extend the outdoor GSM 900 MHz voice coverage of an existing GSM 900MHz operator. The resulting LTE 800 MHz coverage is within around 1% of the GSM coverage for the corresponding environment (indoors or outdoors).
In Figure 4-21 sites are built to extend indoor LTE 800 MHz service. Again the associated GSM 900 MHz voice coverage is very similar for corresponding environments.
Figure 4-20: Comparison of LTE 800 MHz and GSM 900 MHz coverage when targetting GSM 900 MHz outdoor coverage for Wales study area
60%
65%
70%
75%
80%
85%
90%
95%
100%
85% 86% 87% 88% 89% 90% 91% 92% 93% 94% 95% 96% 97% 98% 99% 100%
Co
vera
ge (
% d
eliv
ery
ad
dre
sse
s)
GSM 900 MHz outdoor coverage (% delivery addresses)
GSM 900 MHz outdoor
GSM 900 MHz indoor
LTE 800 MHz outdoor
LTE 800 MHz indoor

Cost of extending 800 MHz mobile broadband coverage obligation for the UK 61
Figure 4-21: Comparison of LTE 800 MHz and GSM 900 MHz coverage when targetting LTE 800 MHz indoor coverage for Wales study area
60%
65%
70%
75%
80%
85%
90%
95%
100%
65% 70% 75% 80% 85% 90% 95% 100%
Co
vera
ge (
% d
eliv
ery
ad
dre
sse
s)
LTE 800 MHz indoor coverage (% delivery addresses)
GSM 900 MHz outdoor GSM 900 MHz indoor LTE 800 MHz outdoor LTE 800 MHz indoor

Cost of extending 800 MHz mobile broadband coverage obligation for the UK 62
5 Our results allow us to draw a number of conclusions regarding the costs of extending mobile broadband coverage
Since Ofcom proposed a coverage obligation for one of the 800 MHz spectrum licences, many stakeholders have suggested changes to key parameters of that obligation. However, relatively little analysis of the costs of making such changes has been available, making it difficult to assess potential changes directly. This report addresses these issues, examining the impact of the key variables in areas representative of some of the most challenging areas of the UK. Our analysis, while adopting acknowledged simplifications and assumptions where necessary to be tractable, has included the key effects which were missing from previous analysis, notably:
The use of real operator site locations
The modelling of propagation effects due to both terrain and clutter
The modelling of the real distribution of the UK population in both domestic and office contexts
We have also extended previous analysis in the following ways:
We have examined both conventional means of delivering service to indoor users directly from outdoor macrocells and also alternative approaches using community cells and hybrid schemes using additional customer premise equipment which have the potential to make coverage extension more cost effective in some circumstances.
We have factored in additional costs of new site build in rural areas by estimating the range of the main component costs including both capital and operational aspects.
It is not our intention here to provide a specific recommendation for how Ofcom should specify any changes to the proposed 800 MHz coverage obligation. However, our modelling has provided a number of indications of the key variables and associated costs in several areas where extending coverage may be especially challenging. These are summarised in Table 5-1 below.

Cost of extending 800 MHz mobile broadband coverage obligation for the UK 63
Table 5-1: Summary of key findings
Issue Finding based on our analysis Commentary
Coverage from existing sites
Indoor coverage from macrocells as low as 61% of study areas for 5 MHz of 800 MHz
Coverage varies significantly by region and means of provision, in particular whether additional customer premises equipment is used
Rapidly rising costs with higher coverage levels
Number of sites required to increase coverage in all study regions from 95% to 98% of delivery addresses is greater than that required to increase from 90% to 95%
Extending coverage to least densely populated area studied requires new sites and associated costs which rise steeply with the level of additional coverage provided
Site type Cost of additional coverage per premise using community cells is roughly half that of using macrocells
Street furniture sites match infrastructure costs more closely to distribution of unserved locations
Bandwidth Incremental costs for a given coverage level using 2 x 10 MHz are roughly 20% lower than those with 2 x 5 MHz
Bandwidth used has a significant impact on the cost of coverage, both by increasing the range of each site and by increasing the number of locations which each site can serve before capacity limitations impact significantly on the quality of service delivered
Transmit power
Can increase coverage but gains are modest
Gains are limited due to terrain and uplink limitations and should be balanced against the potential costs and the complexity of coordination with adjacent services
Throughput Increasing indoor throughput obligation from 2 Mbps to 5 Mbps increases cost of coverage extension by approximately 50%
5 Mbps is more challenging because a) higher signal to noise level is required, reducing the maximum range of a given site and b) greater required share of the available bandwidth for a given contention ratio, so capacity constraints are more significant.
Consumer premises equipment
Scope to reduce cost per premises in some cases
Cost reduction requires careful targeting of deployments to most needy premises and there are open questions regarding their ability to fully substitute for a service delivered in the conventional manner
Correlation between GSM 900 MHz voice coverage and LTE 800 MHz
Coverage extension based on LTE 800 MHz service extends GSM 900 MHz voice coverage by a similar amount and vice versa
Site range is similar for both services, although there are some differences arising from capacity issues

Cost of extending 800 MHz mobile broadband coverage obligation for the UK 64
In further detail, our findings are that:
Coverage from existing sites: The coverage which would be provided by upgrading existing sites in the four regions under study varies significantly depending on the form of coverage, but for indoor coverage from macrocells in 5 MHz of 800 MHz it could be as low as 61% of delivery addresses.
Rising costs with higher coverage levels: Extending coverage to least densely populated area studied requires new sites and associated costs which rise steeply with the level of additional coverage provided. In every case, the number of sites required to increase coverage from 95% to 98% of delivery addresses is greater than that required to increase from 90% to 95%.
Site type: As the proportion of locations served in a given area increases, the size of the towns and villages to be served in the remaining locations decreases, so that the cost per location of additional service increases. By using lower cost „community small cell‟ sites based on street furniture equipment, our analysis indicates that the costs of additional infrastructure can be matched more closely to the additional premises served. While they deliver comparable additional coverage for each additional site, their costs are potentially lower, making them a more cost effective means of delivering coverage. The cost per premise using community cells is roughly half that of using macrocells given the assumptions we have made.
Bandwidth: The bandwidth used to deliver additional coverage has a significant impact on the cost of coverage to a given level, both by increasing the range of each site and by increasing the number of locations which each site can serve before capacity limitations impact significantly on the quality of service delivered. Indeed, the incremental costs for a given coverage level using 2 x 10 MHz are roughly 20% lower than those with 2 x 5 MHz.
Transmit power: Increasing the transmit power allowed for sites beyond that which Ofcom has previously consulted on can increase the coverage for a given number of sites, but the gains are relatively modest (due to terrain and uplink limitations) and should be balanced against the potential costs and the complexity of coordination with adjacent services.
Throughput: A potential 5 Mbps throughput obligation is materially more challenging than for 2 Mbps for two distinct reasons: first, coverage at the higher level requires a higher signal to noise level, reducing the maximum range of a given site. Second, the higher throughput also requires a greater share of the available bandwidth for a given contention ratio, so capacity constraints are more significant. Our results are consistent with these points, exhibiting both lower coverage from the existing sites and lower coverage for a given number of sites. This results in approximately 50% higher cost of coverage extension. We are not in a position to judge the additional potential benefits which such an increased obligation may bring, but we note that the additional costs are substantial, and the throughput in question is only the minimum level. Most of the locations in the extended coverage area will benefit from greater throughput levels anyway (although we have not quantified this explicitly) and those requiring higher throughputs could also make use of the „window ledge CPE‟ approach we have examined.
Consumer premises equipment: Delivering the coverage requirement to indoor locations via a retransmitting „window ledge CPE‟ could allow the most remote locations to be covered more cost effectively, provided they are in at least basic outdoor range of a given site. However, the costs of the CPE can be significant compared to direct delivery if the devices are provided to all users, so the relevant locations need to be targeted carefully to ensure an overall benefit. Likewise, there are several open questions regarding their

Cost of extending 800 MHz mobile broadband coverage obligation for the UK 65
ability to fully substitute for a service delivered in the conventional manner. They do represent one means however for operators to optimise the use of their infrastructure in rural areas and have been successfully applied in a similar context internationally.
Similarity of GSM and LTE coverage: Coverage extension based on LTE 800 MHz service extends GSM 900 MHz voice coverage by a similar amount and vice versa. The site range is similar for both services, although there are some differences arising from capacity issues.
We welcome suggestions and comments on this analysis via [email protected] Note that additional coverage plots to illustrate the operation of our model are available at www.realwireless.biz/800coverage

Cost of extending 800 MHz mobile broadband coverage obligation for the UK 66
6 Annex 1: Details of study regions This annex provides summary area and population statistics for each of our four study regions, together with maps of the county boundaries, postcode locations, clutter categories and terrain heights.
6.1 Region 1 - Mid and North Wales
6.1.1 Summary statistics
County Area (1,000 km2) Population
Denbighshire 0.837 96,000
Aberconwy and Colwyn C.B.
1.126 112,000
Gwynedd 2.535 118,000
Powys 5.181 131,000
Carmarthenshire 2.394 178,000
Ceredigion 1.792 78,000
Total 13.028 617,000

Cost of extending 800 MHz mobile broadband coverage obligation for the UK 67
6.1.2 Overview maps
Figure 6-1: Overview map Figure 6-2: Postcode locations
Figure 6-3: Clutter map Figure 6-4: Terrain elevation map (metres above mean sea level)

Cost of extending 800 MHz mobile broadband coverage obligation for the UK 68
6.2 Region 2 - South West Northern Ireland
6.2.1 Summary statistics
County Area (1,000 km2) Population
Tyrone 3.247 166,516
Fermanagh 1.844 57,600
Total 5.091 224,116
6.2.2 Overview maps
Figure 6-5: Overview map Figure 6-6: Postcode locations
Figure 6-7: Clutter map Figure 6-8: Terrain elevation map (metres above mean sea level)

Cost of extending 800 MHz mobile broadband coverage obligation for the UK 69
6.3 Region 3 - Southern Scotland
6.3.1 Summary statistics
County Area (1,000 km2) Population
Scottish borders 4.714 112,870
East Lothian 0.681 97,500
Mid Lothian 0.374 81,140
Total 5.770 291,510

Cost of extending 800 MHz mobile broadband coverage obligation for the UK 70
6.3.2 Overview maps
Figure 6-9: Overview map Figure 6-10: Postcode locations
Figure 6-11: Clutter map Figure 6-12: Terrain elevation map (metres above mean sea level)

Cost of extending 800 MHz mobile broadband coverage obligation for the UK 71
6.4 Region 4 - Northern England
6.4.1 Summary statistics
County Area (1,000 km2) Population
Cumbria 6.788 494,400
Northumberland 5.045 310,900
Total 11.834 805,300

Cost of extending 800 MHz mobile broadband coverage obligation for the UK 72
6.4.2 Overview maps
Figure 6-13: Overview map Figure 6-14: Postcode locations
Figure 6-15: Clutter map Figure 6-16: Terrain elevation map (metres above mean sea level)


7 Annex 2: Link Budgets This annex contains the following link budgets:
Table 7-1 for LTE Community cells for both UE and CPE
Table 7-2 for LTE Macrocells for UE and CPE
Table 7-3 for GSM 900 MHz voice

Cost of extending 800 MHz mobile broadband coverage obligation for the UK 75
Table 7-1: Link budget for LTE community cells
LTE community cells link budget
Symbol units DL (CPE) UL (CPE) DL (UE) UL (UE) Comment
Frequency band MHz 800 800 800 800 Project input
Receiver type CPE Community cell
UE Community cell
Project input, UE or CPE (DL) Project input, Macro or Community cell (UL)
Number of antennas AntCnt 2 2 2 2 Technology specification
Bandwidth BW MHz 10 10 5 5 Project input, 5 or 10 MHz
Subcarrier Spacing, Receiver filter BW
subBW kHz 15 15 15 15 Technology specification
EIRP/10MHz (over all antennas)
EIRP10 dBm 67.0 67.0 Project input, 64 dBm (Assessment of future mobile competition and proposals for the award of 800 MHz and 2.6 GHz spectrum and related issues, Ofcom), or 67 dBm ([Technical licence conditions]) NB: This is the total EIRP for the system
EIRP (over all antennas)
EIRP dBm 67.0 23.0 64.0 23.0 =EIRP10 - IF(BW=5,10*LOG10(2),0) (DL) Assumption, Assessment of future mobile competition and proposals for the award of 800 MHz and 2.6 GHz spectrum and related issues, Ofcom (UL)

Cost of extending 800 MHz mobile broadband coverage obligation for the UK 76
LTE community cells link budget
Symbol units DL (CPE) UL (CPE) DL (UE) UL (UE) Comment
Tx antenna gain TxGain dBi 15.4 12.0 15.4 -1.1 Assumption, Assessment of future mobile competition and proposals for the award of 800 MHz and 2.6 GHz spectrum and related issues, Ofcom. This takes into account that shared antenna is used for all bands in the existing site. Omni-directional coverage is assumed. (Macro / DL) Assumption, same value as in Macro (Community cell / DL) Assumption, Assessment of future mobile competition and proposals for the award of 800 MHz and 2.6 GHz spectrum and related issues, Ofcom (UE / UL) Assumption, 12 dBi (CPE / UL) based on example http://www.ampedwireless.com/datasheets/Amped_WA12_Datasheet_LR.pdf existing indoor WiFi equipment and -1.1 dBi (UE/UL)
Transmit Cable, Combiner and Connector Losses
TxCCCL dB 0.0 0.0 0.0 0.0 Assumption, Assessment of future mobile competition and proposals for the award of 800 MHz and 2.6 GHz spectrum and related issues, Ofcom (Macro / DL) Assumption, same value as in Macro (Community cell / DL) Assumption, Assessment of future mobile competition and proposals for the award of 800 MHz and 2.6 GHz spectrum and related issues, Ofcom

Cost of extending 800 MHz mobile broadband coverage obligation for the UK 77
LTE community cells link budget
Symbol units DL (CPE) UL (CPE) DL (UE) UL (UE) Comment
(UE / UL) Assumption, same value as in UE (CPE / UL)
Max power (over all antennas)
dBm 51.6 11.0 48.6 24.1 =EIRP-TxGain+TxCCCL
No of occupied Subcarriers
subCnt subcarriers 600 12 300 12 Technology specification
No of occupied Resource Blocks
RBcnt RBs 50 25 Technology specification
EIRP in channel EIRPch dBm/15 kHz/ant (DL) 36.2 12.2 36.2 12.2 =EIRP - 10*LOG10(subCnt) - 10*LOG10(AntCnt) (DL), EIRP - 10*LOG10(subCnt) (UL)
Receiver Antenna Gain
RxGain dB 12.0 15.4 -1.1 15.4 =TxGain
Receive Cable, Combiner and Connector Losses
RxCCCL dB 0.0 0.0 0.0 0.0 =TxCCCL
Body Loss (relative to free space)
BL dB 0.0 0.0 5.0 5.0 Assumption, Assessment of future mobile competition and proposals for the award of 800 MHz and 2.6 GHz spectrum and related issues, Ofcom. Data-Smartphone, Application of spectrum liberalisation and trading to the mobile sector – A further consultation, Ofcom (UE) Assumption, 0 dB (CPE) 5 dB (UE)

Cost of extending 800 MHz mobile broadband coverage obligation for the UK 78
LTE community cells link budget
Symbol units DL (CPE) UL (CPE) DL (UE) UL (UE) Comment
Noise figure NF dB 10.0 5.0 10.0 5.0 Assumption, Assessment of future mobile competition and proposals for the award of 800 MHz and 2.6 GHz spectrum and related issues, Ofcom (UE / DL) Assumption, same value as in UE (CPE / DL) Assumption, 3GPP simulation assumptions for modelling macrocell base stations to determine HeNB RF requirements given in R4-092042, also in line with the Low-power shared access to spectrum for mobile broadband, Real Wireless (Macro / UL) Assumption, same value as in Macro (Community cell / UL)
Thermal Noise Density
thNsDns dBm/Hz -174 -174 -174 -174 Constant
Thermal Noise thNs dBm -132 -132 -132 -132 =thNsDns+10*LOG(subBW*1000)
Background RSSI RSSI dBm -122 -127 -122 -127 =thNs+NF
Interference Degradation Margin
IM dB 3.0 1.0 3.0 1.0 Assumption, Industry practice (DL) Assumption, H.Holma & A.Toskala, “WCDMA for UMTS: HSPA Evolution and LTE”, John Wiley & Sons, 2010, H.Holma & A.Toskala, “LTE for UMTS: OFDMA and SC-FDMA based radio access”, John Wiley & Sons, 2009 (UL)
Coverage obligation covObl Mbps 2.0 5.0 Project input, 2 or 5 Mbps

Cost of extending 800 MHz mobile broadband coverage obligation for the UK 79
LTE community cells link budget
Symbol units DL (CPE) UL (CPE) DL (UE) UL (UE) Comment
Network loading Loading % 85% 85% Assumption, The loading is defined here as the percentage of available resources (frequency and time) used to deliver download service to users as in Assessment of future mobile competition and proposals for the award of 800 MHz and 2.6 GHz spectrum and related issues, Ofcom
Frequency selective scheduling gain
schGain % 0% 0% Assumption, Single user active on the network
Overhead OHpc % 20% 20% Assumption, Assessment of future mobile competition and proposals for the award of 800 MHz and 2.6 GHz spectrum and related issues, Ofcom
Number of RB's available for data
RBcntData
RBs 34 17 =floor(RBcnt*Loading*(1-OHpc))
Required throughput per data RB
reqThPerDatRB
Mbps 0.06 0.29 =covObl/RBcntData
Required spectral efficiency in data RB
reqSE bps/Hz 0.33 1.63 =reqThPerDatRB*1000/(subBW*12) / (1+schGain)
Required SNR reqSNR dB -5.00 -7.00 1.96 -7.00 Assumption, Assessment of future mobile competition and proposals for the award of 800 MHz and 2.6 GHz spectrum and related issues, Ofcom. Minimum SNR = -5 dB. (DL) Assumption, 64kbps, H.Holma & A.Toskala, “WCDMA for UMTS: HSPA Evolution and LTE”, John Wiley & Sons, 2010,H.Holma & A.Toskala, “LTE for UMTS: OFDMA and SC-FDMA based radio access”,

Cost of extending 800 MHz mobile broadband coverage obligation for the UK 80
LTE community cells link budget
Symbol units DL (CPE) UL (CPE) DL (UE) UL (UE) Comment
John Wiley & Sons, 2009 (UL) P267
Sensitivity RxSens dBm -127.2 -134.2 -120.2 -134.2 =RSSI+reqSNR
Cell-edge coverage-confidence
% 0.78 0.78 0.78 0.78 Assumption, Corresponds to approx. 90% cell-area coverage-confidence, Application of spectrum liberalisation and trading to the mobile sector – A further consultation, Ofcom
Confidence factor cf 0.77 0.77 0.77 0.77 Inverse of the normal cumulative distribution (mean: 0)
Location variability (outdoor)
Lv_sd dB 4.3 4.3 8.3 8.3 Assumption, non-urban geotype, Assessment of future mobile competition and proposals for the award of 800 MHz and 2.6 GHz spectrum and related issues, Ofcom (UE) Assumption, Rec. ITU-R P.1812-1 §4.8, receiver in rural area (CPE)
BPL BPL_mn dB 0.0 0.0 9.6 9.6 Assumption, Assessment of future mobile competition and proposals for the award of 800 MHz and 2.6 GHz spectrum and related issues, Ofcom (UE) Assumption, 0 dB, Residential glass window (CPE), 9.6 dB for UE. NOTE – Depth 2+, suburban and rural clutter

Cost of extending 800 MHz mobile broadband coverage obligation for the UK 81
LTE community cells link budget
Symbol units DL (CPE) UL (CPE) DL (UE) UL (UE) Comment
BPL SD BPL_sd dB 0 0 7 7 Assumption, Assessment of future mobile competition and proposals for the award of 800 MHz and 2.6 GHz spectrum and related issues, Ofcom (UE) Assumption, 0 dB, Residential glass window (CPE), 7 dB for UE. NOTE- Depth 2+, suburban and rural clutter
Fade margin (indoor) FM_in dB 3.3 3.3 18.0 18.0 =sqrt(Lv_sd^2+BPL_sd^2)*cf + BPL_mn
Fade margin (outdoor)
FM_out dB 3.3 3.3 6.4 6.4 =sqrt(Lv_sd^2+0^2)*cf + 0
Maximum path loss (indoor)
dB 169.1 157.5 129.3 137.8 =EIRPch + (RxGain-RxCCCL-BL) - RxSens - FMin – IM
Maximum path loss (outdoor)
dB 169.1 157.5 140.9 149.4 =EIRPch + (RxGain-RxCCCL-BL) - RxSens – FMout -IM

Cost of extending 800 MHz mobile broadband coverage obligation for the UK 82
Table 7-2 Link budget for LTE Macrocells for UE and CPE Uplink and Downlink
Link budget for LTE Macrocells symbol units DL (CPE) UL (CPE) DL(UE) UL (UE) Comment
Frequency band MHz 800 800 800 800 Project input
Receiver type CPE Macro UE Macro Project input, UE or CPE (DL) Project input, Macro or Community cell (UL)
Number of antennas AntCnt 2 2 2 2 Technology specification
Bandwidth BW MHz 10 10 5 5 Project input, 5 or 10 MHz
Subcarrier Spacing, Receiver filter BW
subBW kHz 15 15 15 15 Technology specification
EIRP/10MHz (over all antennas) EIRP10 dBm 64.0 64.0 Project input, 64 dBm (Assessment of future mobile competition and proposals for the award of 800 MHz and 2.6 GHz spectrum and related issues, Ofcom), or 67 dBm ([Technical licence conditions]) NB: This is the total EIRP for the system
EIRP (over all antennas) EIRP dBm 64.0 23.0 61.0 23.0 =EIRP10 - IF(BW=5,10*LOG10(2),0) (DL) Assumption, Assessment of future mobile competition and proposals for the award of 800 MHz and 2.6 GHz spectrum and related issues, Ofcom (UL)

Cost of extending 800 MHz mobile broadband coverage obligation for the UK 83
Link budget for LTE Macrocells symbol units DL (CPE) UL (CPE) DL(UE) UL (UE) Comment
Tx antenna gain TxGain dBi 15.4 12.0 15.4 -1.1 Assumption, Assessment of future mobile competition and proposals for the award of 800 MHz and 2.6 GHz spectrum and related issues, Ofcom. This takes into account that shared antenna is used for all bands in the existing site. Omni-directional coverage is assumed. (Macro / DL) Assumption, same value as in Macro (Community cell / DL) Assumption, Assessment of future mobile competition and proposals for the award of 800 MHz and 2.6 GHz spectrum and related issues, Ofcom (UE / UL) Assumption, 12 dBi (CPE / UL) based on example http://www.ampedwireless.com/datasheets/
Amped_WA12_Datasheet_LR.pdf existing indoor WiFi equipment and -1.1 dBi (UE/UL)
Transmit Cable, Combiner and Connector Losses
TxCCCL dB 0.0 0.0 0.0 0.0 Assumption, Assessment of future mobile competition and proposals for the award of 800 MHz and 2.6 GHz spectrum and related issues, Ofcom (Macro / DL) Assumption, same value as in Macro (Community cell / DL) Assumption, Assessment of future mobile competition and proposals for the award of 800 MHz and 2.6 GHz spectrum and related issues, Ofcom (UE / UL)

Cost of extending 800 MHz mobile broadband coverage obligation for the UK 84
Link budget for LTE Macrocells symbol units DL (CPE) UL (CPE) DL(UE) UL (UE) Comment
Assumption, same value as in UE (CPE / UL)
Max power (over all antennas) dBm 48.6 11.0 45.6 24.1 =EIRP-TxGain+TxCCCL
No of occupied Subcarriers subCnt subcarriers
600 12 300 12 Technology specification
No of occupied Resource Blocks RBcnt RBs 50 25 Technology specification
EIRP in channel EIRPch dBm/15 kHz/ant
33.2 12.2 33.2 12.2 =EIRP - 10*LOG10(subCnt) - 10*LOG10(AntCnt)
Receiver Antenna Gain RxGain dBi 12.0 15.4 -1.1 15.4 =TxGain
Receive Cable, Combiner and Connector Losses
RxCCCL dB 0.0 0.0 0.0 0.0 =TxCCCL
Body Loss (relative to free space)
BL dB 0.0 0.0 5.0 5.0 Assumption, Assessment of future mobile competition and proposals for the award of 800 MHz and 2.6 GHz spectrum and related issues, Ofcom. Data-Smartphone, Application of spectrum liberalisation and trading to the mobile sector – A further consultation, Ofcom (UE) Assumption, 0 dB (CPE) 5 dB (UE)

Cost of extending 800 MHz mobile broadband coverage obligation for the UK 85
Link budget for LTE Macrocells symbol units DL (CPE) UL (CPE) DL(UE) UL (UE) Comment
Noise figure NF dB 10.0 5.0 10.0 5.0 Assumption, Assessment of future mobile competition and proposals for the award of 800 MHz and 2.6 GHz spectrum and related issues, Ofcom (UE / DL) Assumption, same value as in UE (CPE / DL) Assumption, 3GPP simulation assumptions for modelling macrocell base stations to determine HeNB RF requirements given in R4-092042, also in line with the Low-power shared access to spectrum for mobile broadband, Real Wireless (Macro / UL) Assumption, same value as in Macro (Community cell / UL)
Thermal Noise Density thNsDns dBm/Hz -174 -174 -174 -174 Constant
Thermal Noise thNs dBm -132 -132 -132 -132 =thNsDns+10*LOG(subBW*1000)
Background RSSI RSSI dBm -122 -127 -122 -127 =thNs+NF
Interference Degradation Margin IM dB 3.0 1.0 3.0 1.0 Assumption, Industry practice (DL) Assumption, H.Holma & A.Toskala, “WCDMA for UMTS: HSPA Evolution and LTE”, John Wiley & Sons, 2010, H.Holma & A.Toskala, “LTE for UMTS: OFDMA and SC-FDMA based radio access”, John Wiley & Sons, 2009 (UL)
Coverage obligation covObl Mbps 2.0 5.0 Project input, 2 or 5 Mbps
Network loading Loading % 85% 85% Assumption, The loading is defined here as the percentage of available resources (frequency and time) used to deliver download service to users as in Assessment of future mobile

Cost of extending 800 MHz mobile broadband coverage obligation for the UK 86
Link budget for LTE Macrocells symbol units DL (CPE) UL (CPE) DL(UE) UL (UE) Comment
competition and proposals for the award of 800 MHz and 2.6 GHz spectrum and related issues, Ofcom
Frequency selective scheduling gain
schGain % 0% 0% Assumption, Single user active on the network
Overhead OHpc % 20% 20% Assumption, Assessment of future mobile competition and proposals for the award of 800 MHz and 2.6 GHz spectrum and related issues, Ofcom
Number of RB's available for data
RBcntData RBs 34 17 =floor(RBcnt*Loading*(1-OHpc))
Required throughput per data RB
reqThPerDatRB
Mbps 0.06 0.29 =covObl/RBcntData
Required spectral efficiency in data RB
reqSE bps/Hz 0.33 1.63 =reqThPerDatRB*1000/(subBW*12) / (1+schGain)
Required SNR reqSNR dB -5.00 -7.00 1.96 -7.00 Assumption, Assessment of future mobile competition and proposals for the award of 800 MHz and 2.6 GHz spectrum and related issues, Ofcom. Minimum SNR = -5 dB. (DL) Assumption, 64kbps, H.Holma & A.Toskala, “WCDMA for UMTS: HSPA Evolution and LTE”, John Wiley & Sons, 2010,H.Holma & A.Toskala, “LTE for UMTS: OFDMA and SC-FDMA based radio access”, John Wiley & Sons, 2009 (UL) P267
Sensitivity RxSens dBm -127.2 -134.2 -120.2 -134.2 =RSSI+reqSNR
Cell-edge coverage-confidence % 0.78 0.78 0.78 0.78 Assumption, Corresponds to approx. 90% cell-area coverage-confidence, Application of spectrum liberalisation

Cost of extending 800 MHz mobile broadband coverage obligation for the UK 87
Link budget for LTE Macrocells symbol units DL (CPE) UL (CPE) DL(UE) UL (UE) Comment
and trading to the mobile sector – A further consultation, Ofcom
Confidence factor cf 0.77 0.77 0.77 0.77 Inverse of the normal cumulative distribution (mean: 0)
Location variability (outdoor) Lv_sd dB 4.3 4.3 8.3 8.3 Assumption, non-urban geotype, Assessment of future mobile competition and proposals for the award of 800 MHz and 2.6 GHz spectrum and related issues, Ofcom (UE) Assumption, Rec. ITU-R P.1812-1 §4.8, receiver in rural area (CPE)
BPL BPL_mn dB 0.0 0.0 9.6 9.6 Assumption, Assessment of future mobile competition and proposals for the award of 800 MHz and 2.6 GHz spectrum and related issues, Ofcom (UE) Assumption, 0 dB, Residential glass window (CPE), 9.6 dB for UE. NOTE – Depth 2+, suburban and rural clutter
BPL SD BPL_sd dB 0 0 7 7 Assumption, Assessment of future mobile competition and proposals for the award of 800 MHz and 2.6 GHz spectrum and related issues, Ofcom (UE) Assumption, 0 dB, Residential glass window (CPE), 7 dB for UE. NOTE- Depth 2+, suburban and rural clutter
Fade margin (indoor) FM_in dB 3.3 3.3 18.0 18.0 =sqrt(Lv_sd^2+BPL_sd^2)*cf + BPL_mn
Fade margin (outdoor) FM_out dB 3.3 3.3 6.4 6.4 =sqrt(Lv_sd^2+0^2)*cf + 0
Maximum path loss (indoor) dB 166.1 157.5 126.3 137.8 =EIRPch + (RxGain-RxCCCL-BL) -

Cost of extending 800 MHz mobile broadband coverage obligation for the UK 88
Link budget for LTE Macrocells symbol units DL (CPE) UL (CPE) DL(UE) UL (UE) Comment
RxSens - FMin – IM
Maximum path loss (outdoor) dB 166.1 157.5 137.9 149.4 =EIRPch + (RxGain-RxCCCL-BL) - RxSens – FMout -IM

Cost of extending 800 MHz mobile broadband coverage obligation for the UK 89
Table 7-3 Link budget for GSM 900 MHz voice service
Link budget for GSM 900 MHz voice service
Symbol Units DL UL Comment
Frequency band MHz 900 900
Receiver filter BW
kHz 200 200 Technology specification
Output power Pwr dBm 46.0 33.0 =EIRP-TxGain (DL) 3GPP TS 05.05, Power class 4 at 900 (UL)
EIRP EIRP dBm 62.0 33.0 UK Interface Requirement 2014, Ofcom (DL) '=Pwr+TxGain (UL)
Tx antenna gain TxGain dBi 16 0.0 Assumption, Kathrein 742 265 multi-band antenna (3 sector case), Application of spectrum liberalisation and trading to the mobile sector – A further consultation, Ofcom (DL) Assumption, H.Holma & A.Toskala, “WCDMA for UMTS: HSPA Evolution and LTE”, John Wiley & Sons, 2010, H.Holma & A.Toskala, “LTE for UMTS: OFDMA and SC-FDMA based radio access”, John Wiley & Sons, 2009 (UL)
Tx Cable, Combiner and Connector Losses
TxCCCL dB 0.0 0.0 Assumption, Mast Head Amplifier operation, Application of spectrum liberalisation and trading to the mobile sector – A further consultation, Ofcom (DL) Assumption, H.Holma & A.Toskala, “WCDMA for UMTS: HSPA Evolution and LTE”, John Wiley & Sons, 2010, H.Holma & A.Toskala, “LTE for UMTS: OFDMA and SC-FDMA based radio access”, John Wiley & Sons, 2009 (UL)
Rx antenna gain RxGain dB 0.0 16.0 =TxGain
Rx Cable, Combiner and Connector Losses
RxCCCL dB 0.0 0.0 =TxCCCL
Body Loss (relative to free
BL dB 3.0 3.0 Assumption, Speech, Application of spectrum liberalisation and trading to the mobile sector – A further consultation, Ofcom

Cost of extending 800 MHz mobile broadband coverage obligation for the UK 90
Link budget for GSM 900 MHz voice service
Symbol Units DL UL Comment
space)
Interference Degradation Margin
IM dB 3.0 3.0 Assumption, 3GPP 43.030
Sensitivity RxSens dBm -102.0 -111.0 Assumption, BS sensitivity sourced from Ericsson BTS product specification on the basis of it being commercially representative and its likely deployment in the field. Better sensitivity levels from other vendors were excluded on the basis additional improvements such as Rx diversity gain have been incorporated for environment specific deployments see http://sysdoc.doors.ch/ERICSSON/DEA9B877-6058-41CA-96E6-30A4562544C1_v1.pdf MS sensitivity sourced from an HTC handset considered to be typical of the latest commercial handsets available http://www.marmoter.net/sdp/1134971/4/pd-5339860/6874169-2084549/HTC_HD_smart_phone_windows_mobile_6_1_wifi_gps_jav.html
Cell-edge coverage-confidence
% 0.78 0.78 Assumption, Corresponds to approx. 90% cell-area coverage-confidence, Application of spectrum liberalisation and trading to the mobile sector – A further consultation, Ofcom
Confidence factor
BPL_cf 0.77 0.77 Inverse of the normal cumulative distribution (mean: 0)
Location variability (outdoor)
Lv_sd dB 8.4 8.4 Assumption, non-urban geotype, Assessment of future mobile competition and proposals for the award of 800 MHz and 2.6 GHz spectrum and related issues, Ofcom
BPL BPL_mn dB 10.4 10.4 Assumption, Interpolated values based on the Assessment of future mobile competition and proposals for the award of 800 MHz and 2.6 GHz spectrum and related issues, Ofcom, interp1(log10([800 1800 2600]),[9.6 14.8 19.1],log10(900))

Cost of extending 800 MHz mobile broadband coverage obligation for the UK 91
Link budget for GSM 900 MHz voice service
Symbol Units DL UL Comment
BPL SD BPL_sd dB 7.0 7.0 Assumption, Interpolated values based on the Assessment of future mobile competition and proposals for the award of 800 MHz and 2.6 GHz spectrum and related issues, Ofcom, round(interp1(log10([800 2600]),[7.0 9.0],log10(900)))
Fade margin (indoor)
FM_in dB 18.9 18.9 =sqrt(BPL_sd^2+Lv_sd^2)*BPL_cf + BPL_mn
Fade margin (outdoor)
FM_out dB 6.5 6.5 =sqrt(0^2+Lv_sd^2)*BPL_cf + 0
Maximum path loss (indoor)
MAPL_in_DL (DL) MAPL_in_UL (UL)
dB 139.1 128.1 =EIRP + (RxGain-RxCCCL-BL) - RxSens - FM_in - IM
Maximum path loss (outdoor)
MAPL_out_DL (DL) MAPL_out_UL (UL)
dB 151.5 140.5 =EIRP + (RxGain-RxCCCL-BL) - RxSens - FM_out - IM
Maximum path loss, min{DL,UL} (indoor)
MAPL_in dB 135.1 =MIN(MAPL_in_DL,MAPL_in_UL)
Maximum path loss, min{DL,UL} (outdoor)
MAPL_out dB 147.5 =MIN(MAPL_out_DL,MAPL_out_UL)
Planning level (indoor)
dBm -73.1 =EIRP-MAPL_in
Planning level (outdoor)
dBm -85.5 =EIRP-MAPL_out

Copyright ©2012 Real Wireless Limited. All Rights Reserved.
Rights Reserved.