ofdma-based networks capacity … and outer areas and uses different frequency reuse factor (frf)...
TRANSCRIPT

Journal of Theoretical and Applied Information Technology 15
th September 2016. Vol.91. No.1
© 2005 - 2016 JATIT & LLS. All rights reserved.
ISSN: 1992-8645 www.jatit.org E-ISSN: 1817-3195
35
OFDMA-BASED NETWORKS CAPACITY IMPROVEMENT
USING ENHANCED FRACTIONAL FREQUENCY REUSE
SCHEME
OMAR M. ESHANTA, MAHAMOD ISMAIL, ROSDIADEE NORDIN, NOR FADZILAH A
Faculty of Engineering, Universiti Kebangsaan Malaysia
E-mail: omarshanta @gmail.com, [email protected], [email protected],
ABSTRACT
OFDMA as a broadband technology is intended to offer high data rate services. In cellular networks, a
Frequency Reuse (FR) principle has been used to maximize the Signal to Noise-plus-Interference Ratio
(SINR), which in turn allows high data rates and spectral efficiency to be achieved. Earlier FR schemes
used in 2G and 3G networks are known as Integer Frequency Reuse (IFR) schemes, and were able to
improve the global SINR of the system but not the interference at cell edge. Fractional Frequency Reuse
(FFR) schemes have been proposed in OFDMA based networks (WiMAX forum 2006) to combat the low
SINR at cell edge and gain more amount of spectrum per cell. The tradeoff between interference mitigation
using IFR schemes and the extra cell BW gained from FFR scheme needs to be considered. There is a need
for the analysis and optimization of FFR key parameters which control the system performance to ensure
the highest data rate and spectral efficiency. In this paper, we propose a new FFR-based scheme called
Enhance FFR (EFFR), deriving its analytic model and using simulations to evaluate its performance along
with different FR schemes and patterns, including IFR and FFR (classified into Hard, HFFR and Soft,
SFFR). The effective SINR (SINReff) and Cell Data Rate (DRcell) are used as performance criteria.
Further, the optimum values of SINRth and power ration ψ have been defined for all FR patterns.
Simulation results show that the highest DRcell was obtained from the proposed EFFR 1x3x3, followed by
SFFR 3x1x1, at 137.85 Mbps and 111.33 Mbps, respectively.
Keywords: OFDMA, Fractional Frequency Reuse FFR, Frequency Reuse Schemes, Spectral Efficiency
1. INTRODUCTION
In wireless communications systems, to
improve the usability of the available spectrum the
total frequency band is divided into sub bands that
are allocated to adjacent divisions of the system
area. This technique can reduce the overall system
Signal to Interference plus Noise Ratio SINR, hence
improves the capacity. However, the Cell Edge
Users (CEU) still suffer from high levels of
interference and low SINR. This case is called
Integer Frequency Reuse (IFR), as shown in Figure
1. To solve the problem of low SINR at CEU, a
technique called Fractional Frequency Reuse (FFR)
has been introduced. FFR divides the cell area into
inner and outer areas and uses different Frequency
Reuse Factor (FRF) for each one with power level
of the outer area higher than that used in IFR. For
example, the inner area can have FRF = 1, while
the outer area has FRF = 3.
Investigation and optimization of FFR
control parameters (i.e., power ratio and SINR
threshold), is an interesting challenge that is being
considered by researchers. Only few works have
focused on finding the optimum Frequency Reuse
Scheme (FRS) and the optimum values of their
parameters; however, not all FRS patterns have
been considered and the optimal values of such
parameters have been determined independently.
Figure 1: FRS in OFDMA-based systems
IFR FFR

Journal of Theoretical and Applied Information Technology 15
th September 2016. Vol.91. No.1
© 2005 - 2016 JATIT & LLS. All rights reserved.
ISSN: 1992-8645 www.jatit.org E-ISSN: 1817-3195
36
The work in this paper contributes to the
improvement of OFDMA-based networks’ capacity
by proposing a new FFR scheme that improves the
total cell data rate with acceptable spectral
efficiency. This is achieved by sectorizing the Cell
Center Area (CCA) and Cell Edge Area (CEA) and
allocating different sub-bands to the sectors of the
same angle, reducing interference and increase total
cell BW. We further employ simulation modeling
to investigate and analyze various FFR schemes
including HFFR and SFFR and to determine its
optimum pattern and values for the SINRth and
power ratio parameters.
The rest of the paper is organized as
follows. Section 2 elaborates on the most relevant
works, while Section 3 introduces the basic idea of
the proposed FFR scheme. Section 4 an analytical
model is derived to facilitate the simulations, for
which a corresponding model is presented in
Section 5. The results of the simulations are
discussed in Section 6, whereas the paper is
concluded in Section.
2. RELATED WORK
Investigation and analysis of Frequency
Reuse Schemes (FRS) has been addressed in some
works in literature. Some of them aimed to analyze
and evaluate the different FR scenarios, others
worked on determining the optimal values of
system parameters. Most of these works considered
the standardized frequency reuse patterns of IFR
and FFR. However, the different patterns of SFFR
and HFFR have not been addressed sufficiently,
which leaves room for more extensive
investigations. Hereafter the most related works
are being presented.
Yuefeng et al. [1] provide a quantitative
analysis using system level simulation with two
tires wrap around to investigate the performance of
Down Link (DL) FFR in WiMAX networks. The
performance of the FFR schemes with sectorized
and none sectorized cell layout was investigated in
terms of throughput and cell coverage. The FRSs
considered in their simulations are, frequency reuse
one, frequency reuse three with segmentation, and
FFR with different reuse zone size split. Simulation
results showed that using frequency reuse one the
ICI will be decreased and hence the coverage will
be degraded. To improve the SINR a FR 3 can be
used and the coverage will be improved as well.
However, using FR 3 decreases the cell throughput
since only 1/3 of the resources (subchannels) is
assigned to each sector. The solution to this tradeoff
between coverage and throughput is the FFR.
According to the simulation results, FFR scheme
can maintain the coverage of FR 3 with an
improvement of the throughput at the same time.
This work proved the possibility of improving the
spectral efficiency of OFDMA-based networks
using FFR scheme.
Another author in the same year [2] has
determined the optimal FR factor of the Cell Edge
Users (CEU) as well as the allocated resources to
both inner and outer zones of FFR scheme that
meets the highest QoS (cell throughput). The author
used a system layout of 18 cells and 40 users per
cell, distributed uniformly, and assumed a flat
fading channel with adjacent subcarrier allocation.
The problem had been formulated as an
optimization problem, and was solved by Prima
Dual Interior Point Method. Results showed that
the best configuration that meets the highest
throughput is achieved with FRF = 3 for CEU and
by allocating 32 chunks (group of 12 subcarriers) to
the inner cell region and 18 chunks to be shared
among 3 neighbor cells. The optimal inner cell
radius was determined and was approximately
equal to 2/3 of the overall cell radius. The results of
this work are worthy and quite precise; however,
the assumptions of adjacent subcarrier allocation
with flat fading channel are more suitable for fixed
wireless networks, but not mobile wireless
networks which are frequency selective and employ
distributed subcarrier allocation to gain frequency
diversity.
One of the most related works was by
Masood [3]. Besides the valuable outcomes of his
work including the analysis and investigation of
permutation schemes and adaptive beam forming
technique, the author extensively investigated and
compared the performance of FRS including six
IFR patterns and two FFR patterns, namely FFR
and Two Level Power Control (TLPC). Even
though the FFR principle has not been standardized
yet at the time of Masood's work, his results and
analysis are considered a very good input to
evaluate the OFDMA system performance under
such scenarios. In his work on FRS, the author
considered three different scheduling schemes,
namely: equal data rate, equal bandwidth and
opportunist. Based on a fluid model that was
originally proposed for CDMA networks, Masood
proposed an analytical model for IFR, FFR, and
TLPC schemes in terms of SIR and total cell data
rate. A comparison between the above mentioned
FRS and scheduling policies in terms of SIR and
Journal of Theoretical and Applied Information Technology 15
th September 2016. Vol.91. No.1
© 2005 - 2016 JATIT & LLS. All rights reserved.
ISSN: 1992-8645 www.jatit.org E-ISSN: 1817-3195
37
cell throughput was carried out, and optimal values
of FFR parameters, namely inner cell radius and
power ratios were proposed.
The two main types of FFR namely strict
(hard) FFR and soft frequency reuse (SFR) have
been evaluated and compared in [4]. Several
evaluation metrics have been used, including
outage probability, spectral efficiency, network
throughput, and average CEU SINR. In their
simulation, the authors considered the path loss and
small-scale fading (fast fading) for simplicity. They
also considered a Base Station (BS) with the same
transmitted power for strict FFR (HFFR) and power
ratio β ≥ 1 (β = Pout / Pin) for SFR (SFFR). The
users have been classified as CEU or CCU by
calculating the average SINR and compared with a
predetermined threshold (SINRth). The resources
were allocated proportionally to the inner and outer
radii (Rin / Rout), which varies with SINRth. The
results of this work showed that the strict FFR
outperforms the SFR in terms of outage probability
and it is less sensitive to the Rin than SFR.
However, by increasing the power ratio factor (β)
SFR can show improvement in outage probability.
From network throughput point of view, strict FFR
shows the greatest performance and achieves the
highest CEU SINR compared to SFR; on the other
hand, SFR provides the balance between the
interference reduction and efficiency of resource
allocation.
Another work [5] presented a new
analytical framework to evaluate the coverage
probability and average rate in the two scenarios of
strict and soft FFR, instead of evaluating the two
cases through system level simulations. Moreover,
they proposed a resource allocation strategy that
allocates the sub bands proportional to the average
SINR. An important conclusion from their results
was to show how the power control factor �
influences the SINR of CEU. Their results showed
that as � increases the SINR and hence the
probability of coverage of CEU increases. At �=15,
the performance of SFR approaches and then
exceeds the performance of strict FFR. However,
the performance of SFR in terms of SINR and
coverage probability is bounded by two limits;
lower bound, when � = 1 for FR 1, and upper
bound when � tends to infinity for FRF > 1. The
performance of the two scenarios in terms of data
rate follows the previous conclusion, whereas the
strict FFR outperforms the SFR until � approaches
15 where the data rate of SFR reaches and then
exceeds the data rate of strict FFR. Another factor
that plays a big role in the FFR system is the initial
SINR threshold (denoted by TFR) which classifies
the users into CEU and CCE. Results showed that,
as TFR increases, the average data rate also
increases, as the low SINR users will be transferred
to the CEU region with a higher power factor,
which will improve their SINR and hence the data
rate. However, this threshold has an optimal value,
whereby exceeding this optimal value the average
cell- data rate starts to decrease, this optimal TFR
had not been defined precisely in this work. In
general, both strict FFR and SFR schemes
outperform the IFR scheme. The cell data rate
increases as � increases, while TFR has an optimal
value, which meets the highest performance.
Yet another work by Hamza [6]
comprehensively surveyed the various Inter-Cell
Interference Coordination (ICIC) schemes in the
downlink of OFDMA-based cellular networks. The
authors used smart notations to classify and
categorize various static (frequency reuse-based)
and dynamic (cell coordination-based) ICIC
schemes. The FFR itself was divided into three
classes. First class is Partial Frequency Reuse
(PFR), also known in the literature as Strict FFR or
HFFR; PFR implements Frequency Ruse Factor
(FRF) of 1 in Cell Center (CC) and FRF of 3 in the
Cell Edge (CE). The second class is Soft Frequency
Reuse (SFR) which implements FRF > 1 in CC and
FRF = 3 in the CE with two power levels. The last
class is Intelligent Frequency Reuse, which
allocates the frequency bands to different sectors
based on the load distribution, so it can start with
FRF 3 if there is no much load on CE, PFR, SFR,
or even Integer FR (IFR) with FRF = 1 in high
offered load. Another spectrally efficient scheme
that was surveyed in this work is called Enhanced
FFR (EFFR). EFFR divides the frequency band into
two segments, primary segment which is unique for
each cell and secondary segment which is common
with neighboring cells in non sectorized and FRF =
3 system. The users are allowed to use their own
primary segment, but they need to negotiate with
neighboring to use the secondary segment. Besides
the wide presentation of the various FFR schemes,
the authors presented a conclusion from their work
and other's work stating the most important
parameters that affect the performance of networks
that employ FFR schemes.
3. PROPOSED EFFR SCHEME
As a general conclusion from the above
related works, particularly [3], [5], and [6], the FFR
principle can significantly increase the SINR of
Journal of Theoretical and Applied Information Technology 15
th September 2016. Vol.91. No.1
© 2005 - 2016 JATIT & LLS. All rights reserved.
ISSN: 1992-8645 www.jatit.org E-ISSN: 1817-3195
38
CEU; hence improve the spectral efficiency of the
system. The power control factor (the power ratio)
and the SINR threshold are the most important
parameters that play a big role in the system
performance; also the system layout and the FR
pattern have a significant impact on the cell data
rate and hence on the spectral efficiency. This
conclusion gave the motivation to explore and
expand these works in order to include more
options and scenarios and to come out with new
findings.
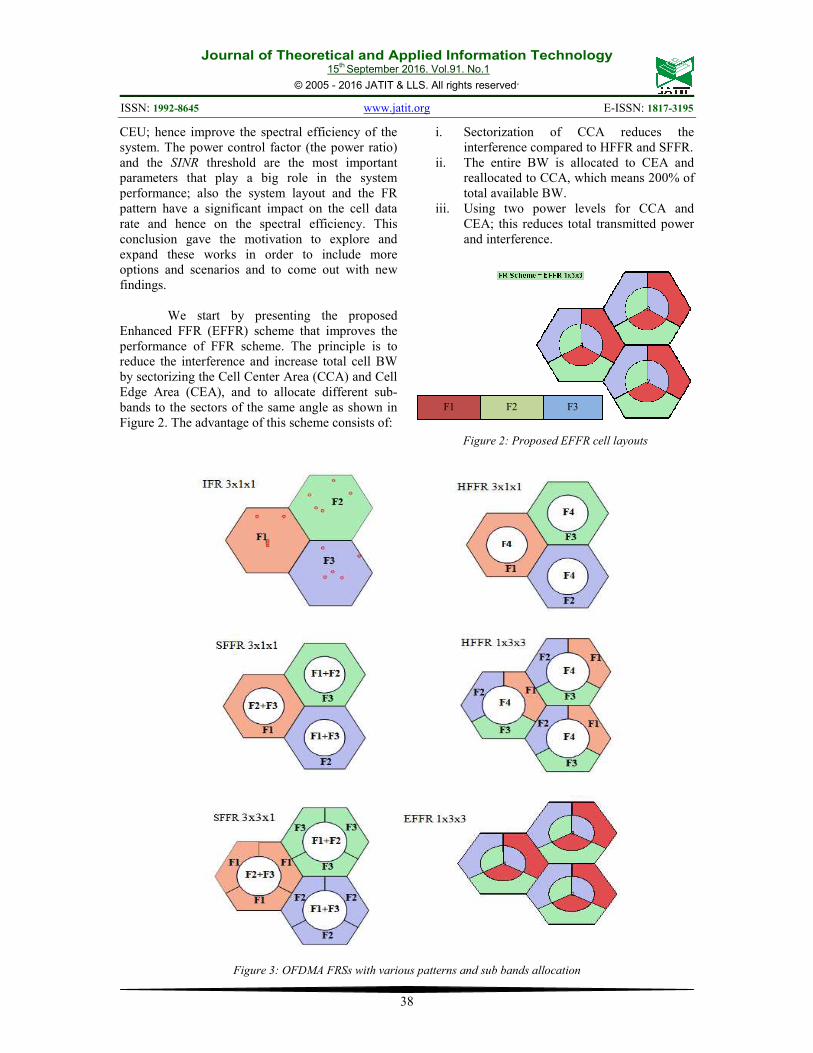
We start by presenting the proposed
Enhanced FFR (EFFR) scheme that improves the
performance of FFR scheme. The principle is to
reduce the interference and increase total cell BW
by sectorizing the Cell Center Area (CCA) and Cell
Edge Area (CEA), and to allocate different sub-
bands to the sectors of the same angle as shown in
Figure 2. The advantage of this scheme consists of:
i. Sectorization of CCA reduces the
interference compared to HFFR and SFFR.
ii. The entire BW is allocated to CEA and
reallocated to CCA, which means 200% of
total available BW.
iii. Using two power levels for CCA and
CEA; this reduces total transmitted power
and interference.
Figure 2: Proposed EFFR cell layouts
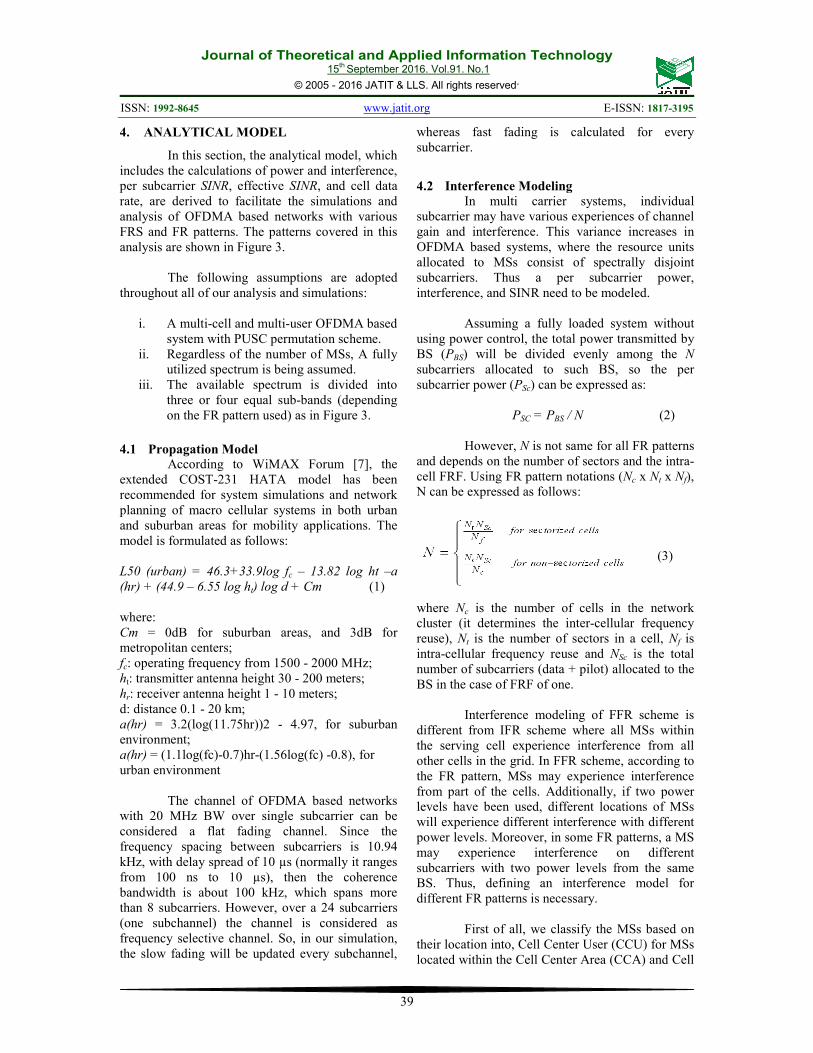
Figure 3: OFDMA FRSs with various patterns and sub bands allocation
F2 F3 F1
Journal of Theoretical and Applied Information Technology 15
th September 2016. Vol.91. No.1
© 2005 - 2016 JATIT & LLS. All rights reserved.
ISSN: 1992-8645 www.jatit.org E-ISSN: 1817-3195
39
4. ANALYTICAL MODEL
In this section, the analytical model, which
includes the calculations of power and interference,
per subcarrier SINR, effective SINR, and cell data
rate, are derived to facilitate the simulations and
analysis of OFDMA based networks with various
FRS and FR patterns. The patterns covered in this
analysis are shown in Figure 3.
The following assumptions are adopted
throughout all of our analysis and simulations:
i. A multi-cell and multi-user OFDMA based
system with PUSC permutation scheme.
ii. Regardless of the number of MSs, A fully
utilized spectrum is being assumed.
iii. The available spectrum is divided into
three or four equal sub-bands (depending
on the FR pattern used) as in Figure 3.
4.1 Propagation Model
According to WiMAX Forum [7], the
extended COST-231 HATA model has been
recommended for system simulations and network
planning of macro cellular systems in both urban
and suburban areas for mobility applications. The
model is formulated as follows:
L50 (urban) = 46.3+33.9log fc – 13.82 log ht –a
(hr) + (44.9 – 6.55 log ht) log d + Cm (1)
where:
Cm = 0dB for suburban areas, and 3dB for
metropolitan centers;
fc: operating frequency from 1500 - 2000 MHz;
ht: transmitter antenna height 30 - 200 meters;
hr: receiver antenna height 1 - 10 meters;
d: distance 0.1 - 20 km;
a(hr) = 3.2(log(11.75hr))2 - 4.97, for suburban
environment;
a(hr) = (1.1log(fc)-0.7)hr-(1.56log(fc) -0.8), for
urban environment
The channel of OFDMA based networks
with 20 MHz BW over single subcarrier can be
considered a flat fading channel. Since the
frequency spacing between subcarriers is 10.94
kHz, with delay spread of 10 µs (normally it ranges
from 100 ns to 10 µs), then the coherence
bandwidth is about 100 kHz, which spans more
than 8 subcarriers. However, over a 24 subcarriers
(one subchannel) the channel is considered as
frequency selective channel. So, in our simulation,
the slow fading will be updated every subchannel,
whereas fast fading is calculated for every
subcarrier.
4.2 Interference Modeling
In multi carrier systems, individual
subcarrier may have various experiences of channel
gain and interference. This variance increases in
OFDMA based systems, where the resource units
allocated to MSs consist of spectrally disjoint
subcarriers. Thus a per subcarrier power,
interference, and SINR need to be modeled.
Assuming a fully loaded system without
using power control, the total power transmitted by
BS (PBS) will be divided evenly among the N
subcarriers allocated to such BS, so the per
subcarrier power (PSc) can be expressed as:
PSC = PBS / N (2)
However, N is not same for all FR patterns
and depends on the number of sectors and the intra-
cell FRF. Using FR pattern notations (Nc x Nt x Nf),
N can be expressed as follows:
(3)
where Nc is the number of cells in the network
cluster (it determines the inter-cellular frequency
reuse), Nt is the number of sectors in a cell, Nf is
intra-cellular frequency reuse and NSc is the total
number of subcarriers (data + pilot) allocated to the
BS in the case of FRF of one.
Interference modeling of FFR scheme is
different from IFR scheme where all MSs within
the serving cell experience interference from all
other cells in the grid. In FFR scheme, according to
the FR pattern, MSs may experience interference
from part of the cells. Additionally, if two power
levels have been used, different locations of MSs
will experience different interference with different
power levels. Moreover, in some FR patterns, a MS
may experience interference on different
subcarriers with two power levels from the same
BS. Thus, defining an interference model for
different FR patterns is necessary.
First of all, we classify the MSs based on
their location into, Cell Center User (CCU) for MSs
located within the Cell Center Area (CCA) and Cell
Journal of Theoretical and Applied Information Technology 15
th September 2016. Vol.91. No.1
© 2005 - 2016 JATIT & LLS. All rights reserved.
ISSN: 1992-8645 www.jatit.org E-ISSN: 1817-3195
40
Edge User (CEU) for MSs located within Cell Edge
Area (CEA). Also, we define two sets of
interferers; ICCA represents the set of BSs that
interfere with MSs located within CCA and ICEA
represents the set of BSs that interfere with MSs
located within CEA. The two power levels are
denoted by PCCA and PCEA as shown in Table 1.
Table 1: Defining the set of interferers (ICCU and ICEU)
for each FRS.
FR pattern ICCA ICEA
IFR (3x1x1) NA PCEA{9,11,13,15,17,1
9}
HFFR (3x1x1) PCCA{2:19} PCEA{9,11,13,15,17,1
9}
SFFR (3x1x1) PCCA{3,5,7,8,9,11,12,
13,15,16,17,19}
PCEA{3,5,7,8,12,16}
PCCA{2:7,8,10,12,14,1
6,18}
PCEA{9,11,13,15,17,19}
SFFR (3x3x1) PCCA{3,5,7,8,9,11,12,
13,15,16,17,19} PCEA{3,5,7,8,12,16}
PCCA{2:7,8,10,12,14,1
6,18} PCEA{9,11,13,15,17,1
9}
HFFR (1x3x3) PCCA{2:19} PCEA{5,6,7,14,15,16,1
7,18}
EFFR (1x3x3) PCCA{5,6,7,14:18}
PCEA{2,3,8,9,10,19}
PCCA{3,4,10:13}
PCEA{5,6,7,14:18}
The power ratio between CCA and CEA is
defined as: C C A
C EA
P
Pψ = .Then, the total interference
,
n
u jI of MS u on subcarrier n from BS j can be
expressed as:
(4)
where g is the channel gain between MS u and BS
j, which is defined as:
(5)
where ,
n
u jSF and
,u jFF represent the Slow Fading
(log-normal) and Fast Fading (Rayleigh) factors,
respectively; PL is the path loss (COST-HATA-
231, suburban), and ,u jd is the distance between
MS u and BS j.
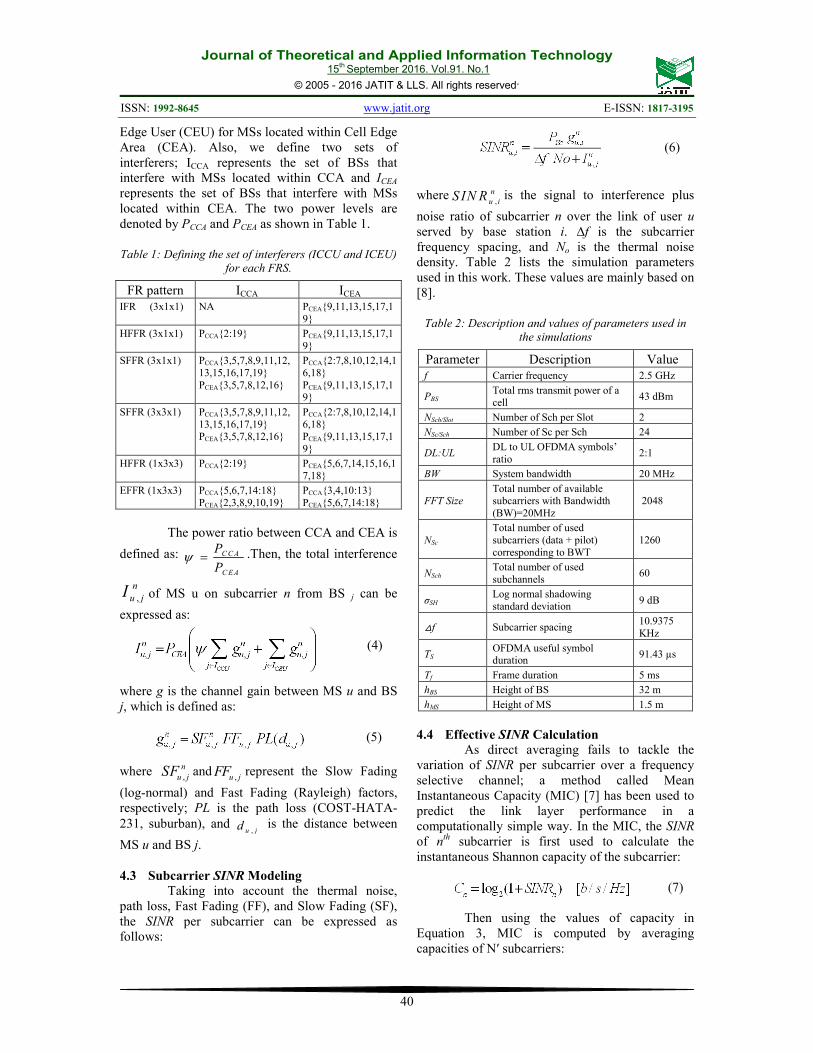
4.3 Subcarrier SINR Modeling
Taking into account the thermal noise,
path loss, Fast Fading (FF), and Slow Fading (SF),
the SINR per subcarrier can be expressed as
follows:
(6)
where,
n
u iS IN R is the signal to interference plus
noise ratio of subcarrier n over the link of user u
served by base station i. ∆f is the subcarrier
frequency spacing, and No is the thermal noise
density. Table 2 lists the simulation parameters
used in this work. These values are mainly based on
[8].
Table 2: Description and values of parameters used in
the simulations
Parameter Description Value
f Carrier frequency 2.5 GHz
PBS Total rms transmit power of a cell
43 dBm
NSch/Slot Number of Sch per Slot 2
NSc/Sch Number of Sc per Sch 24
DL:UL DL to UL OFDMA symbols’
ratio 2:1
BW System bandwidth 20 MHz
FFT Size Total number of available subcarriers with Bandwidth
(BW)=20MHz
2048
NSc
Total number of used
subcarriers (data + pilot)
corresponding to BWT
1260
NSch Total number of used
subchannels 60
σSH Log normal shadowing
standard deviation 9 dB
△f Subcarrier spacing 10.9375
KHz
TS OFDMA useful symbol duration
91.43 µs
Tf Frame duration 5 ms
hBS Height of BS 32 m
hMS Height of MS 1.5 m
4.4 Effective SINR Calculation
As direct averaging fails to tackle the
variation of SINR per subcarrier over a frequency
selective channel; a method called Mean
Instantaneous Capacity (MIC) [7] has been used to
predict the link layer performance in a
computationally simple way. In the MIC, the SINR
of nth subcarrier is first used to calculate the
instantaneous Shannon capacity of the subcarrier:
(7)
Then using the values of capacity in
Equation 3, MIC is computed by averaging
capacities of N′ subcarriers:
Journal of Theoretical and Applied Information Technology 15
th September 2016. Vol.91. No.1
© 2005 - 2016 JATIT & LLS. All rights reserved.
ISSN: 1992-8645 www.jatit.org E-ISSN: 1817-3195
41
(8)
Then, SINReff is obtained from MIC value
using following equation:
(9)
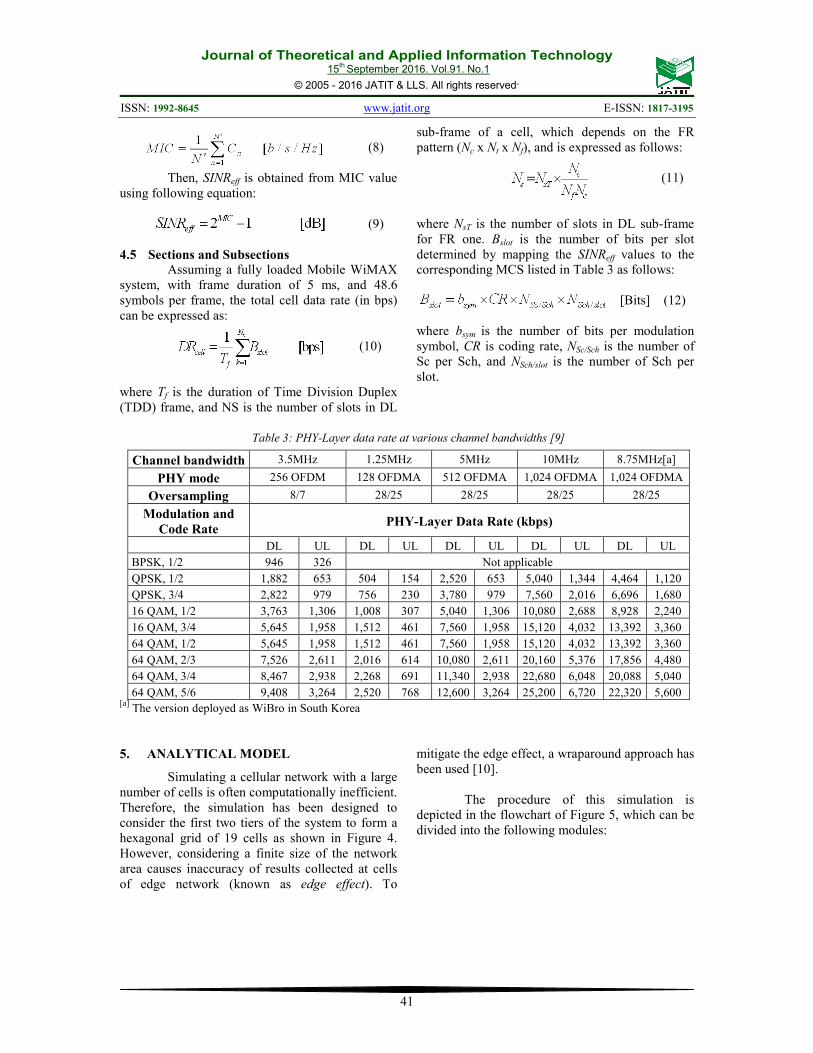
4.5 Sections and Subsections
Assuming a fully loaded Mobile WiMAX
system, with frame duration of 5 ms, and 48.6
symbols per frame, the total cell data rate (in bps)
can be expressed as:
(10)
where Tf is the duration of Time Division Duplex
(TDD) frame, and NS is the number of slots in DL
sub-frame of a cell, which depends on the FR
pattern (Nc x Nt x Nf), and is expressed as follows:
(11)
where NsT is the number of slots in DL sub-frame
for FR one. Bslot is the number of bits per slot
determined by mapping the SINReff values to the
corresponding MCS listed in Table 3 as follows:
[Bits] (12)
where bsym is the number of bits per modulation
symbol, CR is coding rate, NSc/Sch is the number of
Sc per Sch, and NSch/slot is the number of Sch per
slot.
Table 3: PHY-Layer data rate at various channel bandwidths [9]
Channel bandwidth 3.5MHz 1.25MHz 5MHz 10MHz 8.75MHz[a]
PHY mode 256 OFDM 128 OFDMA 512 OFDMA 1,024 OFDMA 1,024 OFDMA
Oversampling 8/7 28/25 28/25 28/25 28/25
Modulation and
Code Rate PHY-Layer Data Rate (kbps)
DL UL DL UL DL UL DL UL DL UL
BPSK, 1/2 946 326 Not applicable
QPSK, 1/2 1,882 653 504 154 2,520 653 5,040 1,344 4,464 1,120
QPSK, 3/4 2,822 979 756 230 3,780 979 7,560 2,016 6,696 1,680
16 QAM, 1/2 3,763 1,306 1,008 307 5,040 1,306 10,080 2,688 8,928 2,240
16 QAM, 3/4 5,645 1,958 1,512 461 7,560 1,958 15,120 4,032 13,392 3,360
64 QAM, 1/2 5,645 1,958 1,512 461 7,560 1,958 15,120 4,032 13,392 3,360
64 QAM, 2/3 7,526 2,611 2,016 614 10,080 2,611 20,160 5,376 17,856 4,480
64 QAM, 3/4 8,467 2,938 2,268 691 11,340 2,938 22,680 6,048 20,088 5,040
64 QAM, 5/6 9,408 3,264 2,520 768 12,600 3,264 25,200 6,720 22,320 5,600 [a]
The version deployed as WiBro in South Korea
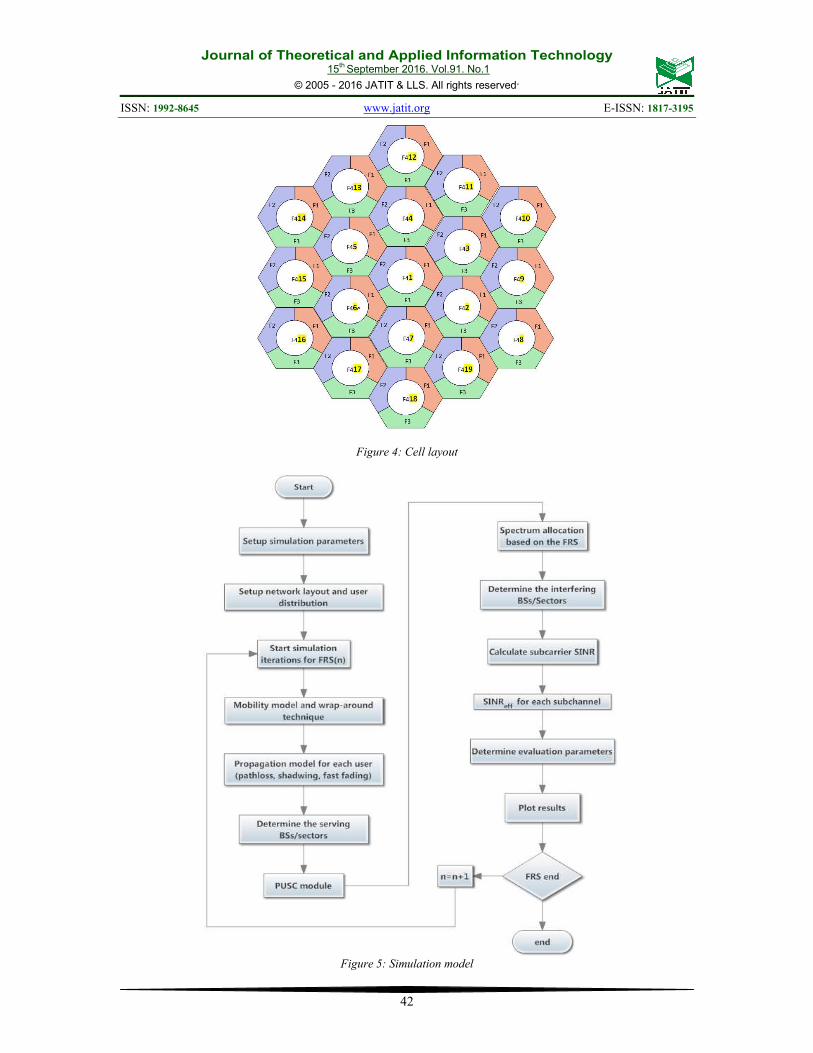
5. ANALYTICAL MODEL
Simulating a cellular network with a large
number of cells is often computationally inefficient.
Therefore, the simulation has been designed to
consider the first two tiers of the system to form a
hexagonal grid of 19 cells as shown in Figure 4.
However, considering a finite size of the network
area causes inaccuracy of results collected at cells
of edge network (known as edge effect). To
mitigate the edge effect, a wraparound approach has
been used [10].
The procedure of this simulation is
depicted in the flowchart of Figure 5, which can be
divided into the following modules:
Journal of Theoretical and Applied Information Technology 15
th September 2016. Vol.91. No.1
© 2005 - 2016 JATIT & LLS. All rights reserved.
ISSN: 1992-8645 www.jatit.org E-ISSN: 1817-3195
42
Figure 4: Cell layout
Figure 5: Simulation model
Journal of Theoretical and Applied Information Technology 15
th September 2016. Vol.91. No.1
© 2005 - 2016 JATIT & LLS. All rights reserved.
ISSN: 1992-8645 www.jatit.org E-ISSN: 1817-3195
43
a) FR Pattern Identification Module: This
module identifies the network layout parameters,
such as type of FRS, IFR/FFR, cell radius, number
of sectors, BW allocation for each sector/area, and
the total number of users.
b) Propagation Model and MS Distribution
Module: This module defines the sort of MSs’
distribution over the cell area either randomly and
uniformly or by defining a percentage for each
sector/area. Using the maximum received signal
strength, the serving BS (sector/area) will be
defined to each MS.
c) Traffic Distribution Module: This module
allocates the resource units to the MSs of each
sector/area defined in module a, and based on a
predefined type and quality of service.
6. SIMULATION RESULTS AND
DISCUSSION
In this section the performance of various
FFR schemes including HFFR, SFFR, and EFFR
will be investigated and compared with IFR as a
reference scheme. Taking SINReff as performance
criterion, the impact of FFR main parameters
(SINRth and power ratio ψ) on system performance
will be examined.
6.1 Sections and Subsections
Table 4 gives the BW allocation for each
FR pattern where BCCA and BCEA are the portion of
BW allocated to CCA and CEA, respectively, and
Bcell is the total BW available for the cell (Bcell=
BCCA + BCEA). Tables 1 and 4 will be used to
facilitate the analysis and discussion of simulation
results.
Table 4: Sub-band allocation for various FR patterns.
FR Pattern BCCA BCEA Bcell 1x1x1%
IFR (3x1x1) 1/3 (20) // 1/3 (20) 33%
HFFR (3x1x1) 1/4 (15) 1/4 (15) 1/2 (30) 50%
SFFR (3x1x1) 2/3 (40) 1/3 (20) 1 (60) 100%
SFFR (3x3x1) 2/3 (40) 1 (60) 5/3 (100) 167%
HFFR (1x3x3) 1/4 (15) 3/4 (45) 1 (60) 100%
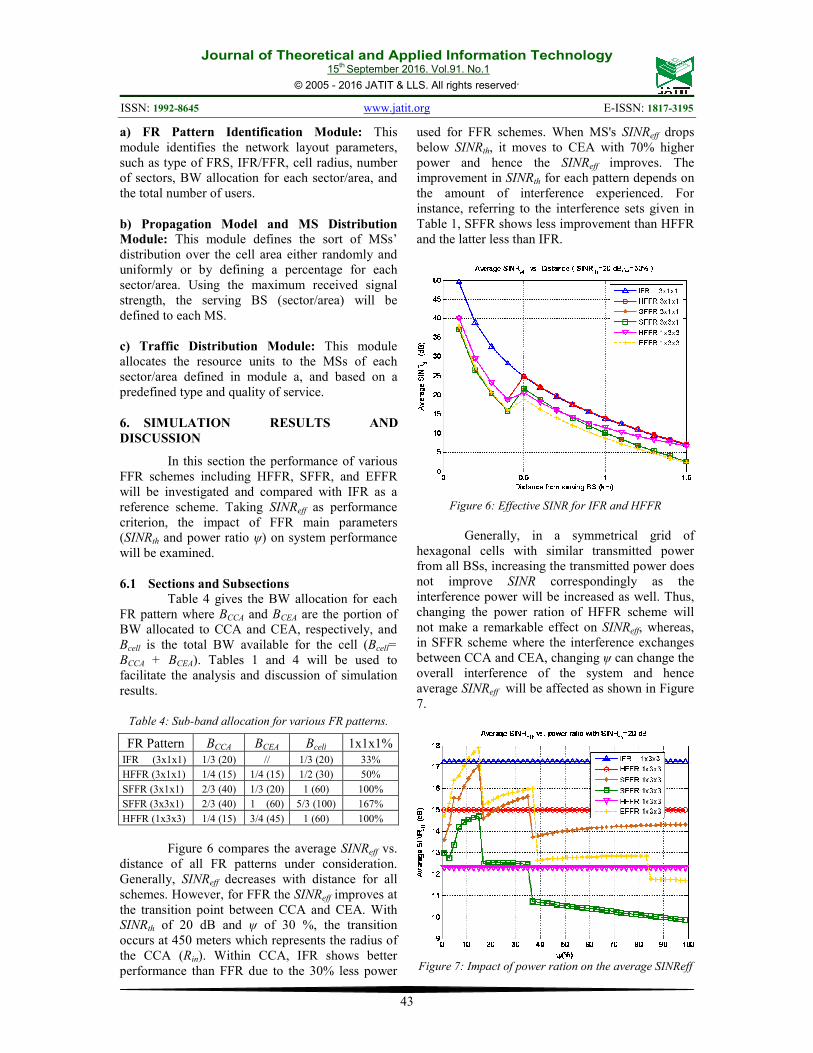
Figure 6 compares the average SINReff vs.
distance of all FR patterns under consideration.
Generally, SINReff decreases with distance for all
schemes. However, for FFR the SINReff improves at
the transition point between CCA and CEA. With
SINRth of 20 dB and ψ of 30 %, the transition
occurs at 450 meters which represents the radius of
the CCA (Rin). Within CCA, IFR shows better
performance than FFR due to the 30% less power
used for FFR schemes. When MS's SINReff drops
below SINRth, it moves to CEA with 70% higher
power and hence the SINReff improves. The
improvement in SINRth for each pattern depends on
the amount of interference experienced. For
instance, referring to the interference sets given in
Table 1, SFFR shows less improvement than HFFR
and the latter less than IFR.
Figure 6: Effective SINR for IFR and HFFR
Generally, in a symmetrical grid of
hexagonal cells with similar transmitted power
from all BSs, increasing the transmitted power does
not improve SINR correspondingly as the
interference power will be increased as well. Thus,
changing the power ration of HFFR scheme will
not make a remarkable effect on SINReff, whereas,
in SFFR scheme where the interference exchanges
between CCA and CEA, changing ψ can change the
overall interference of the system and hence
average SINReff will be affected as shown in Figure
7.
Figure 7: Impact of power ration on the average SINReff

Journal of Theoretical and Applied Information Technology 15
th September 2016. Vol.91. No.1
© 2005 - 2016 JATIT & LLS. All rights reserved.
ISSN: 1992-8645 www.jatit.org E-ISSN: 1817-3195
44
The variation of average SINReff vs. ψ of
SFFR and EFFR schemes is determined mainly by
the variation in the interference powers of ICCA and
ICEA sets, while its amplitude is determined by the
sub-bands allocation given in Table 4 as well.
Generally, excluding IFR scheme, average
SINReff improves with SINRth, as shown in Figure 8.
This gradual increment in average SINReff can be
justified due to decrement of Rin as SINRth
increases, where more MSs that are closer to BS are
transferred to CEA with higher power (PCEA), and
hence the average SINReff increases.
Figure 8: Impact of SINRth on SINReff for different FR
patterns
So far, the impact of ψ and SINRth has
been examined separately. However, the full picture
and the optimum values of these parameters can be
obtained by considering all of them together into a
single picture as presented in the next section.
6.2 Sections and Subsections
The previous section presented how the
FFR scheme behaves compared to IFR, and how
the FFR parameters affect the performance in terms
of average SINReff. This section discusses the
performance of FFR schemes by considering all
variations of system parameters and putting them
into a single picture to determine the optimal FR
pattern, taking DRcell as performance criterion.
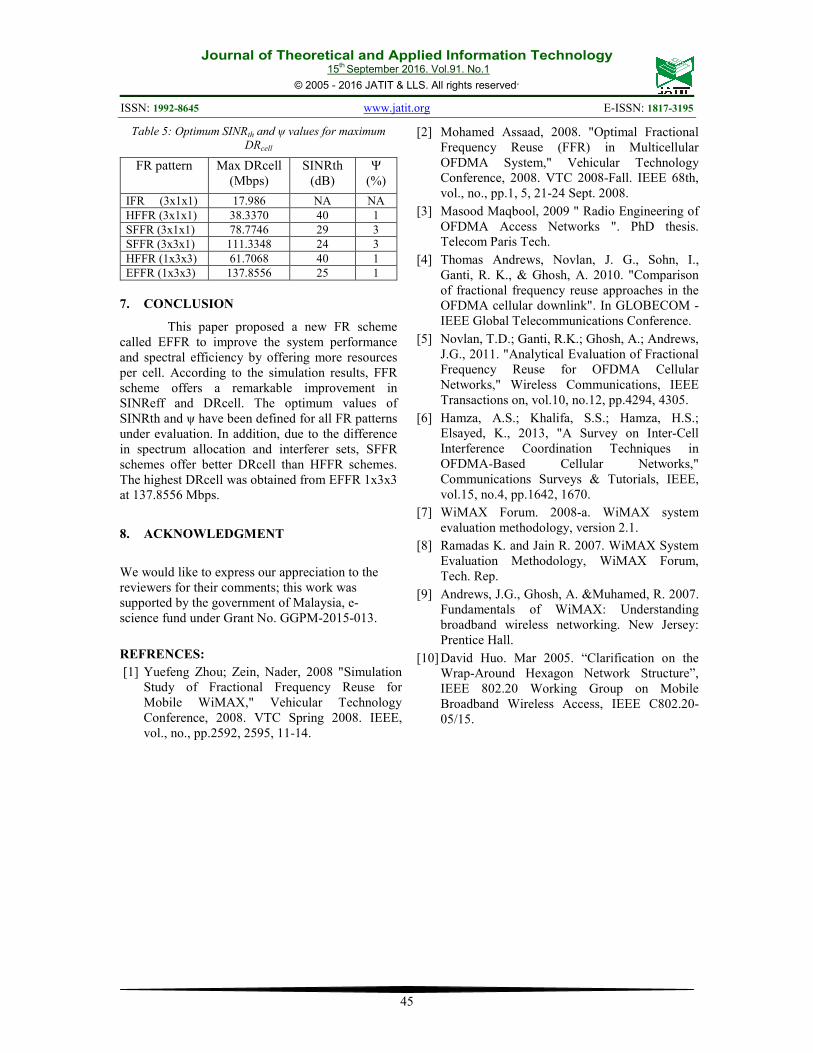
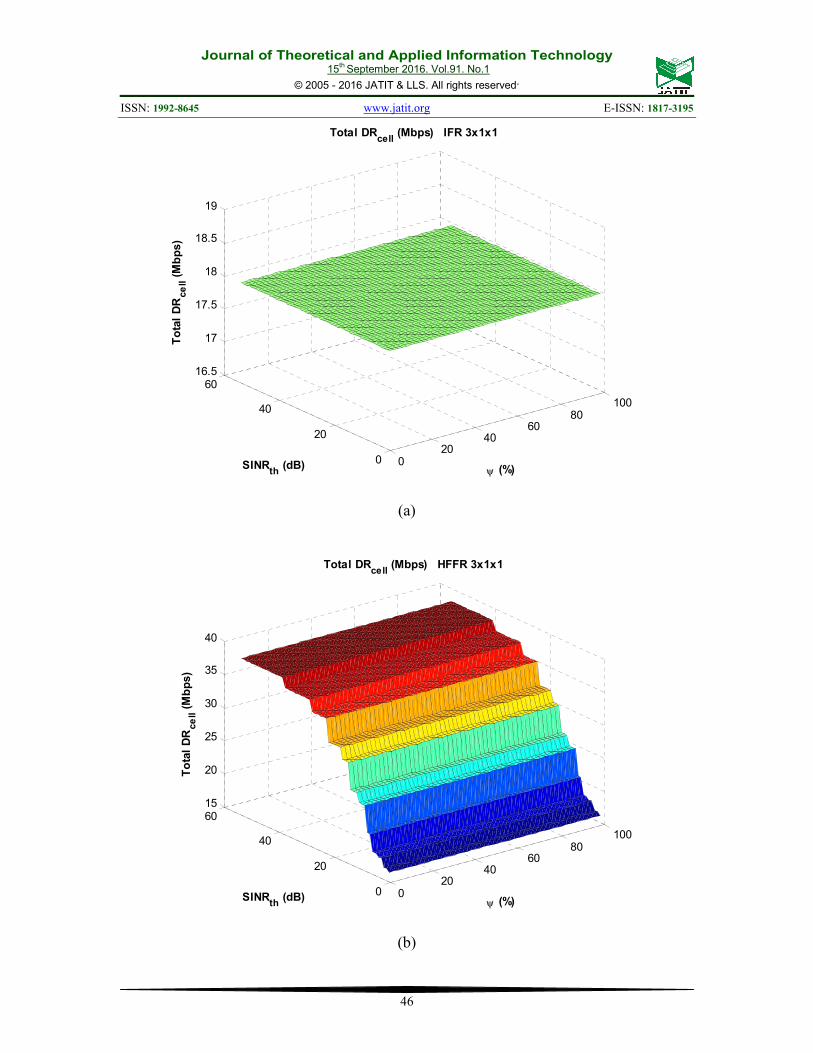
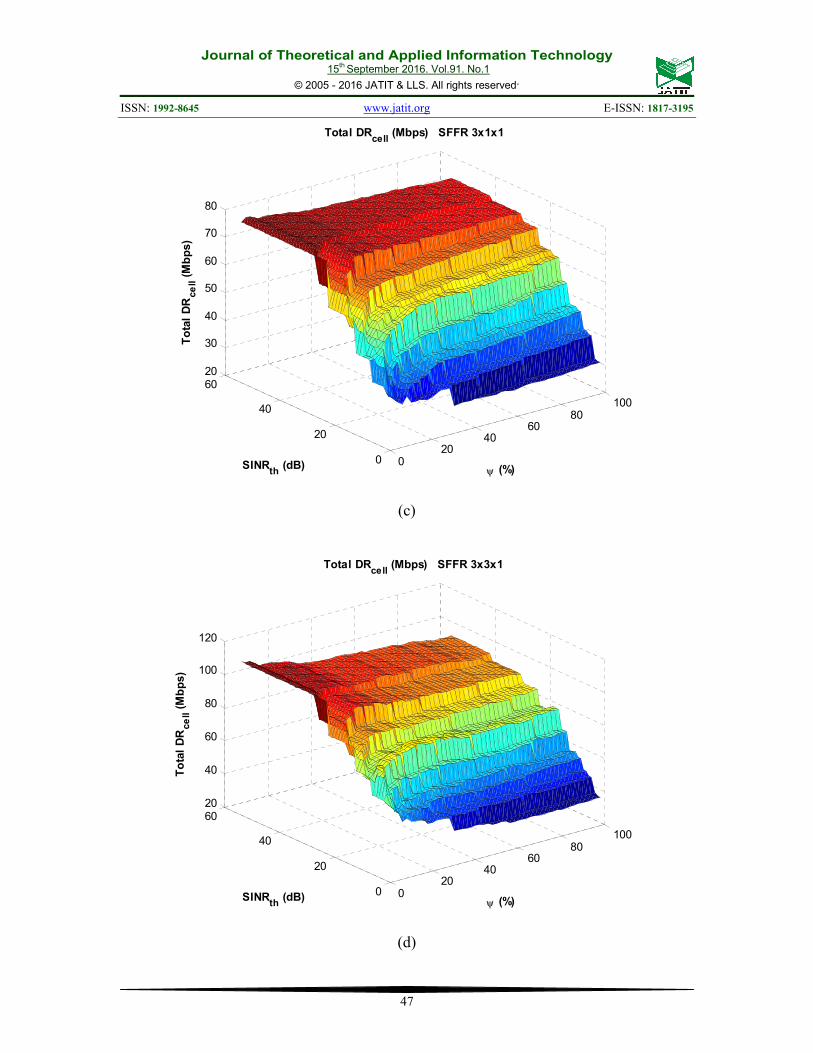
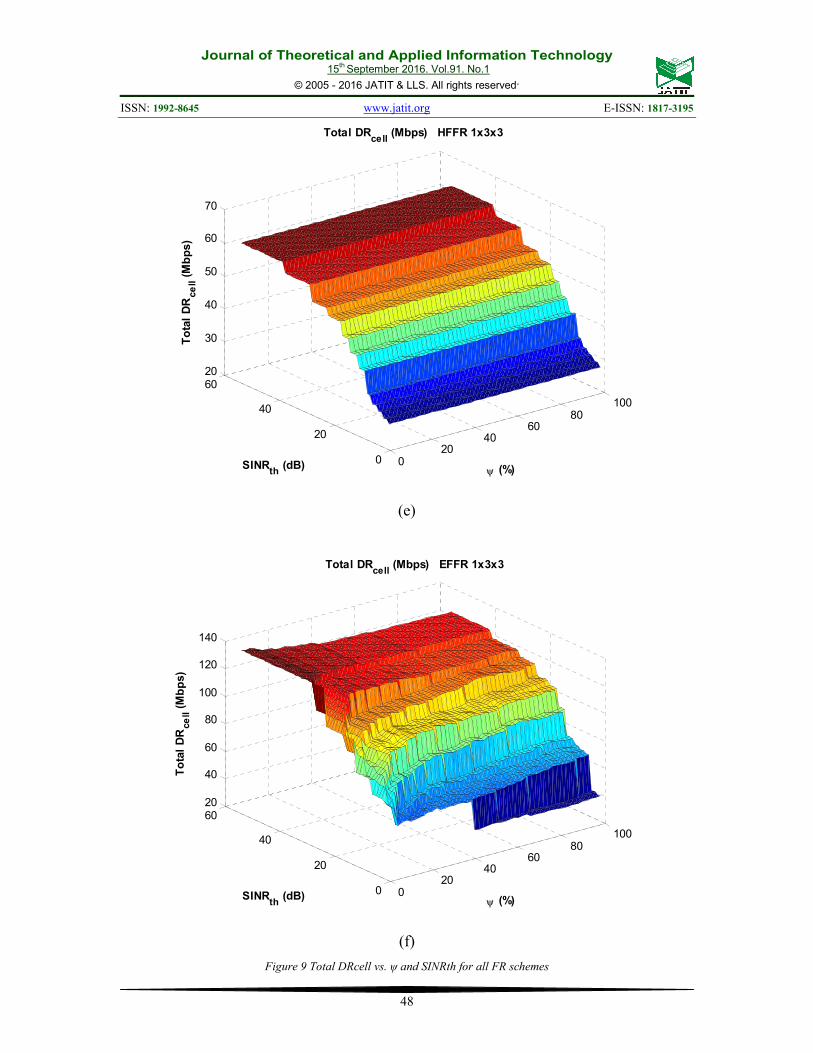
The 3D plots in Figure 9 (a-f) show the
variation of DRcell with ψ and SINRth for all FR
patterns under consideration.
As can be seen from the figure, HFFR
scheme are not affected by power ratio as explained
earlier, whereas SFFR scheme shows a noticeable
variation with ψ. On the other hand the DRcell
increases with SINRth for all FR schemes, it makes
a stairs like curve with different step size due to the
inconsistent variation of Rin as shown previously in
Figure 7. Since a fully loaded system has been
assumed, the subchannels allocated to each area
will be redistributed evenly among the new number
of MSs; some of these subchannels will be taken
from MSs distant from BS and given to the new
added MSs that are closer to the BS, with better
SINReff and higher MCS which increases the overall
DRcell.
The maximum DRcell with 137.85 Mbps
was obtained from EFFR 3x3x1 as shown in Figure
10. This improvement in DRcell over other schemes
is due to high BW allocation which is 200% of the
total available BW (Table 4) and relatively less
interferers (Table 1). SFFR 3x3x1 which has 167%
of available BW comes in the second highest DRcell
with 111.33 Mbps. On the other hand, with equal
Bcell, pattern SFFR 3x1x1 shows higher DRcell than
HFFR 1x3x3. This is because SINReff in CCA
where SFFR 3x1x1 has 2/3 of its total BW is higher
than in CEA, and hence there is a better chance of
getting higher MCS level. Table 5 gives the
optimum values of SINRth and ψ that gives the
highest DRcell for each FR pattern.
Figure 10: Comparison of maximum DRcell of all FR
patterns
Journal of Theoretical and Applied Information Technology 15
th September 2016. Vol.91. No.1
© 2005 - 2016 JATIT & LLS. All rights reserved.
ISSN: 1992-8645 www.jatit.org E-ISSN: 1817-3195
45
Table 5: Optimum SINRth and ψ values for maximum
DRcell
FR pattern Max DRcell
(Mbps)
SINRth
(dB)
Ψ
(%)
IFR (3x1x1) 17.986 NA NA
HFFR (3x1x1) 38.3370 40 1
SFFR (3x1x1) 78.7746 29 3
SFFR (3x3x1) 111.3348 24 3
HFFR (1x3x3) 61.7068 40 1
EFFR (1x3x3) 137.8556 25 1
7. CONCLUSION
This paper proposed a new FR scheme
called EFFR to improve the system performance
and spectral efficiency by offering more resources
per cell. According to the simulation results, FFR
scheme offers a remarkable improvement in
SINReff and DRcell. The optimum values of
SINRth and ψ have been defined for all FR patterns
under evaluation. In addition, due to the difference
in spectrum allocation and interferer sets, SFFR
schemes offer better DRcell than HFFR schemes.
The highest DRcell was obtained from EFFR 1x3x3
at 137.8556 Mbps.
8. ACKNOWLEDGMENT
We would like to express our appreciation to the
reviewers for their comments; this work was
supported by the government of Malaysia, e-
science fund under Grant No. GGPM-2015-013.
REFRENCES:
[1] Yuefeng Zhou; Zein, Nader, 2008 "Simulation
Study of Fractional Frequency Reuse for
Mobile WiMAX," Vehicular Technology
Conference, 2008. VTC Spring 2008. IEEE,
vol., no., pp.2592, 2595, 11-14.
[2] Mohamed Assaad, 2008. "Optimal Fractional
Frequency Reuse (FFR) in Multicellular
OFDMA System," Vehicular Technology
Conference, 2008. VTC 2008-Fall. IEEE 68th,
vol., no., pp.1, 5, 21-24 Sept. 2008.
[3] Masood Maqbool, 2009 " Radio Engineering of
OFDMA Access Networks ". PhD thesis.
Telecom Paris Tech.
[4] Thomas Andrews, Novlan, J. G., Sohn, I.,
Ganti, R. K., & Ghosh, A. 2010. "Comparison
of fractional frequency reuse approaches in the
OFDMA cellular downlink". In GLOBECOM -
IEEE Global Telecommunications Conference.
[5] Novlan, T.D.; Ganti, R.K.; Ghosh, A.; Andrews,
J.G., 2011. "Analytical Evaluation of Fractional
Frequency Reuse for OFDMA Cellular
Networks," Wireless Communications, IEEE
Transactions on, vol.10, no.12, pp.4294, 4305.
[6] Hamza, A.S.; Khalifa, S.S.; Hamza, H.S.;
Elsayed, K., 2013, "A Survey on Inter-Cell
Interference Coordination Techniques in
OFDMA-Based Cellular Networks,"
Communications Surveys & Tutorials, IEEE,
vol.15, no.4, pp.1642, 1670.
[7] WiMAX Forum. 2008-a. WiMAX system
evaluation methodology, version 2.1.
[8] Ramadas K. and Jain R. 2007. WiMAX System
Evaluation Methodology, WiMAX Forum,
Tech. Rep.
[9] Andrews, J.G., Ghosh, A. &Muhamed, R. 2007.
Fundamentals of WiMAX: Understanding
broadband wireless networking. New Jersey:
Prentice Hall.
[10] David Huo. Mar 2005. “Clarification on the
Wrap-Around Hexagon Network Structure”,
IEEE 802.20 Working Group on Mobile
Broadband Wireless Access, IEEE C802.20-
05/15.
Journal of Theoretical and Applied Information Technology 15
th September 2016. Vol.91. No.1
© 2005 - 2016 JATIT & LLS. All rights reserved.
ISSN: 1992-8645 www.jatit.org E-ISSN: 1817-3195
46
020
4060
80100
0
20
40
6016.5
17
17.5
18
18.5
19
To
tal
DR
ce
ll (
Mb
ps)
Total DRcell
(Mbps) IFR 3x1x1
ψ (%)SINRth
(dB)
(a)
020
4060
80100
0
20
40
6015
20
25
30
35
40
ψ (%)
Total DRcell
(Mbps) HFFR 3x1x1
SINRth
(dB)
To
tal
DR
ce
ll (
Mb
ps)
(b)
Journal of Theoretical and Applied Information Technology 15
th September 2016. Vol.91. No.1
© 2005 - 2016 JATIT & LLS. All rights reserved.
ISSN: 1992-8645 www.jatit.org E-ISSN: 1817-3195
47
020
4060
80100
0
20
40
6020
30
40
50
60
70
80
ψ (%)
Total DRcell
(Mbps) SFFR 3x1x1
SINRth
(dB)
To
tal
DR
ce
ll (
Mb
ps)
(c)
020
4060
80100
0
20
40
6020
40
60
80
100
120
ψ (%)
Total DRcell
(Mbps) SFFR 3x3x1
SINRth
(dB)
To
tal
DR
ce
ll (
Mb
ps)
(d)
Journal of Theoretical and Applied Information Technology 15
th September 2016. Vol.91. No.1
© 2005 - 2016 JATIT & LLS. All rights reserved.
ISSN: 1992-8645 www.jatit.org E-ISSN: 1817-3195
48
020
4060
80100
0
20
40
6020
30
40
50
60
70
ψ (%)
Total DRcell
(Mbps) HFFR 1x3x3
SINRth
(dB)
To
tal
DR
ce
ll (
Mb
ps)
(e)
020
4060
80100
0
20
40
6020
40
60
80
100
120
140
ψ (%)
Total DRcell
(Mbps) EFFR 1x3x3
SINRth
(dB)
To
tal
DR
ce
ll (
Mb
ps)
(f)
Figure 9 Total DRcell vs. ψ and SINRth for all FR schemes