off the canvas - richardson oliver – business sense. ip …€¦ · · 2017-09-21at the epo and...
TRANSCRIPT

Intellectual Asset Managementwww.IAM-media.com
Issue 81 January/February 2017Laura Quatela, Lenovo’s new
chief legal officer, talks IP
How TSMC creates corporate value from its trade secret strategy
What users think of quality at the EPO and the USPTO
Why Enfish heralds the return of software patent monetisation
Winning defence strategies in China’s litigation system
Data reveals that although the US brokered patent market may be down, it is not out
Off the canvas

34Intellectual Asset Management | January/February 2017
www.IAM-media.comFeature | Market moves
By Kent Richardson, Erik Oliver and Michael Costa
Although conditions are tough, the brokered patent market remains viable and robust; and while prices may have bottomed out, new buying opportunities are also emerging
Inside the 2016 brokered patent market
A fter five years of analysing and reporting on the patent market, the only constant appears to be change. Although asking prices have stabilised,
sales are down, bringing the value of the brokered market down to $165 million from $233 million last year. However, the launch of both IAM Market and the Industry Patent Purchase Programme (IP3) has introduced new buying opportunities. At the same time, the impact of negative patent decisions is becoming apparent as non-practising entities (NPEs) pull back from the market. For the first time, purchases by corporations have exceeded NPE purchases. Even the biggest NPEs have been affected, with RPX succeeding Intellectual Ventures (IV) as the new buying leader. Further, the data shows that the US Supreme Court’s decision in Alice has crushed much of the nascent financial technology (fintech) patent market and affected software package sales rates. Finally, we received better litigation data this year and it appears that the litigation risk from sold patents is much higher than previously reported – you may want to reconsider your risk models and membership of defensive aggregators.
When we started reporting on the market, we focused on brokered patents because they represented the majority of the public market for patents. We still believe that this market is a valuable bellwether and so this report continues to focus on it. However, the report also includes some discussion of the broader corporate-to-corporate market, as well as new sources of patents.
We maintain that the entire patent market benefits from transparency. In the past five years, we have seen a shift from a select few large companies buying and selling patents to a situation where medium-sized and pre-initial public offering companies are building out their capabilities to buy and sell patents. The industry narrative has shifted from, “I know nothing about the patent market” to “How do we best participate?” While data-driven information about pricing, technology areas, deal terms, the diligence process and other elements relating to the buying process are necessary – and quarterly patent market data is now reported in mainstream media – that information alone is insufficient. Issues of how to define a successful patent buying programme, which metrics should be used and how to source patents of particular interest most effectively must be answered as well. The patent market data can be used to help answer such questions.
How big is the market?We are currently tracking $11 billion of patent packages, across over 3,500 packages with more than 86,000 assets. Through assignment data, we see that $2.3 billion of that market has sold. However, this number likely underestimates the total sales because not all assignments are recorded.
Figure 1 shows the market that we have tracked for the past five years. It includes both private and public packages and attempts to determine an overall total dollar value for the patent market. We began doing this last year, but reworked the formula to better reflect what was being tracked. Our insight into private packages is limited to packages in which we have had work. Additionally, IP3 and IAM Market have had a significant impact on the number of available patents. That said, the dollar value of the market is surprisingly large and diverse.
Extrapolating the market through 2017, as Figure 1 does, we estimate that between $2 billion and $3 billion in new potential packages should enter the market every year. The sales data as of the second quarter of 2016 is for sales where we have identified an assignment document only. Projecting through 2017, we expect cumulative total sales to reach more than $3 billion.
Landscape transformed by IAM Market and IP3 Two big events have skewed the overall market for patents: IAM launched IAM Market and Allied Security Trust (AST) launched IP3. These two new patent marketplaces have brought many more packages to the overall patent market. Because of timing and methodology, we are unable to take account of the whole impact of these two new marketplaces on pricing and sales rates, but we do have some initial insights.
IAM Market opened for business in October 2015 and, surprisingly, now comprises 25% of all packages in our open market data. It functions as a platform for companies to list their patents and technologies for license or sale and is positioned not only to list patents for sale, but also to showcase which sellers are currently selling. (The authors are listed as sellers on IAM Market.)
Through May 2016, IAM Market listed 194 packages, with 3,724 assets, from 17 sellers, representing 25% of all packages. One note of caution is that the packages have a much wider range of supporting materials than what we usually see from brokers. IAM Market is relatively new and arguably the patents are listed for different purposes

35Intellectual Asset Management | January/February 2017www.IAM-media.com Market moves | Feature
Further, 60% of the purchased submissions were of patent families that had previously been presented on the brokered patent market. It will be interesting to see the results of the IP3 process, given the available committed capital and no-haggle process.
Additionally, as predicted, some assignments from this process have already been recorded. On September 16 2016, the IAM blog reported the discovery of assignments of 78 US patent applications and grants. Because the assignments took place outside of the market year, further details of the IP3 process will be covered next year. However, these results suggest that the process has been successful.
We see IAM Market and IP3 as complementary to existing avenues for buying and selling patents. For example, IAM Market sellers can list assets for sale which are also being presented by brokers. Similarly, brokers can and do submit patents to IP3.
The remainder of this article provides details on the market and follows the flow of a typical purchase process. We cover sourcing, asking prices, diligence steps, purchase closing and litigation, concluding with our market size estimate.
Patent brokersAs in previous years, our analysis focuses on the brokered patent market because it is open to all buyers. We work with many brokers to help our clients buy patents. When helping our clients sell patents, we offer the service of assisting patent owners in selecting a broker. As such, we have identified useful skills which brokers bring to the table, including:• initial filtering to identify suitable patent assets to sell;• selection of viable sellers, along with some certainty
that the chosen target is willing to sell;• screening of patents and identification of important
patents and claims;• pricing guidance;• guidance for sellers with regard to sales terms and
timelines;• definition of a process for diligence, bidding and sales;• development of evidence of use (EOU); and• tougher negotiation on pricing.
Brokers also have the ability to sell. For many, their network of potential buyers expands well into the hundreds; they actively seek out specific buyers’ needs
from those found on the brokered patent market. We have included IAM Market data in the overall data, except where noted.
Another important development has been the launch of IP3, an AST-run industry patent-buying initiative. IP3 brings together patent-purchasing dollars from a number of companies to buy patents without haggling. This accelerated purchase process begins with patent submissions – for this round the submissions had to be in by June 2016. Each submission is an entire patent family – a change from the previous Google process on which IP3 was modelled. Bidding on the patents occurred in late July 2016 and purchases were due to be recorded via assignments by September 2016. The process is innovative in that IP3 offers a new opportunity for inventors and companies to sell their patents in an accelerated environment with committed capital from purchasers. We have not included IP3 data in the overall data, except in estimating the market in Figure 1.
From our discussions with AST, we learned that approximately 1,400 submissions (each being a patent family, with over 3,000 patent assets submitted) were made from approximately 450 sellers. After initial filtering criteria were applied, 750 submissions were considered for more in-depth review. About half of those had at least one asset which had previously been presented on the brokered patent market. Approximately half of the IP3 submissions came from patent brokers.
Method
We do our best to maintain our past methodologies when analysing the data. For those of you who have built databases before, you likely have experienced the following: as soon as you can answer one set of questions, you can ask a whole new set of questions, necessitating changes.
We maintain a technology taxonomy with 16 general categories and 107 sub-categories. We assign each package to a single taxonomy category. We also track asking prices, bidding dates and clients’ specific diligence decisions. The technology taxonomy changes slightly every
year to better reflect changes in technology. We highlight where a taxonomy change has an impact on year-over-year comparisons.
We also adapt to changes in the marketplace and that is reflected in some changes to technology categories.
Additionally, we improve our technology (our programmers stay busy), to get the most up-to-date information available.
The totality of these changes can make year-over-year comparisons more difficult. This is why some of the numbers for the 2015
market are slightly different from those in our previous article. Where we think the difference is significant, we make sure to provide the previous year’s data using the new methodology.
Across the sales we have tracked, regardless of year of sale, the average time between recorded and executed dates was 1.75 months. Approximately 80% of sales are recorded within three months. The assignment recordation delay pushes back the timetable in which we can analyse sales as they are observed only after recordation with the US Patent and Trademark Office.
2011
-Q1
2011
-Q2
2011
-Q3
2011
-Q4
2012
-Q1
2012
-Q2
2012
-Q3
2012
-Q4
2013
-Q1
2013
-Q2
2013
-Q3
2013
-Q4
2014
-Q1
2014
-Q2
2014
-Q3
2014
-Q4
2015
-Q1
2015
-Q2
2015
-Q3
2015
-Q4
2016
-Q1
2016
-Q2
2016
-Q3
2016
-Q4
2017
-Q1
2017
-Q2
2017
-Q3
$14
$B
$12
$10
$8
$6
$4
$2
0
Cumulative sum asking price (entire market)Cumulative sum total asking price (sold)Predicted cumulative sum asking price (entire market)Predicted cumulative sum total asking price (sold)
FIGURE 1. Cumulative sum of asking prices ($ billion) – brokered and private market

36 www.IAM-media.com
The 10.4% sales rate in Figure 3 highlights the difficulty in selling newly listed packages and, accordingly, suggests that this would be a tough year for new brokers entering the market. However, overall sales rates are more robust; the total number of packages transacted did not drop by nearly as much (see Figure 3). The actual number of packages transacted each quarter
and can manage a sales process where only a few percent of contacts may have any interest. When we help a client to evaluate whether to sell directly or work with a broker, we look to whether that client has skills similar to those possessed by patent brokers, which often resemble those found in the corporate development department of a company.
Brokers with five or more packagesThe total number of brokers this year has risen to 73 (from 60 last year). However, on average, brokers are listing slightly fewer packages – despite the growth in listings. Many IAM Market listings are for sale by the owner and therefore excluded from broker analysis, thereby bringing down the total number of listings to divide between the increased number of brokers. Table 1 provides a listing of brokers with five or more packages for the 2016 market year.
Further, a smaller group of brokers continues to bring most packages to market: 15 brokers brought 10 or more packages to market, while 72% of the packages were brought by brokers which brought five or more packages to market (down from 80%). The top four brokers accounted for 35% of listed packages (last year it was 34%).
As in previous years, we continue to see little technology specialisation among brokers, with the exception of some affiliated with semiconductor reverse-engineering houses and some which focus more on hardware.
Figure 2 shows that while a few brokers were particularly successful (green circle) or unsuccessful (red circle), brokers which brought more packages to market did not show a higher sales rate. Some brokers are clearly struggling with many packages and very few sales. Unsurprisingly, those bringing the most packages to the market approached the industry sales rate. We used the 2015 calendar year for this analysis to allow sufficient time for sales to close and be recorded.
In Figure 2, ICAP Partners – with 136 listed packages in the 2015 calendar year – has so many packages that it did not fit on the chart, although it is included in the overall average. Thus, the average sales rate is heavily impacted by ICAP’s outcomes. The average of 10.4% for 2015, compared to the same analysis for the 2014 calendar year at the same time, indicates that the sales rate for packages listed in 2015 has dropped by almost 50%.
Intellectual Asset Management | January/February 2017
100%90%
80%
70%
60%
50%
40%
30%
10%
20%
0%0 5 10 15 25 30 35 40 45 5020
Sale
s rat
eNumber of listings
Broker’s 2015 sales rate2015 sales rate 10.4%
FIGURE 2. Broker listings versus sales rates by number of listed packages (calendar year)
504540353025201510
50
Actual Projected
Num
ber o
f pac
kage
s sol
d in
qua
rter
Average +/- 1 StDev
2014-Q1
2014-Q2
2014-Q3
2014-Q4
2015-Q1
2015-Q2
2015-Q3
2015-Q4
2016-Q1
2016-Q2
FIGURE 3. Actual and projected sales by sales quarter
Package distribution by tech group Average asking price per asset by tech group
Number of packages Asking price0 50 1 $0 $50,000 $100,000 $150,000 $200,000 $250,000150 200 250 300 350
$235,000
Hardware
Comms
Other
Market average $197,000
Hardware $189,000
Comms $193,000
Other $139,000
FIGURE 4. Package distribution and asking price per asset by technology group
Feature | Market moves
37Intellectual Asset Management | January/February 2017www.IAM-media.com
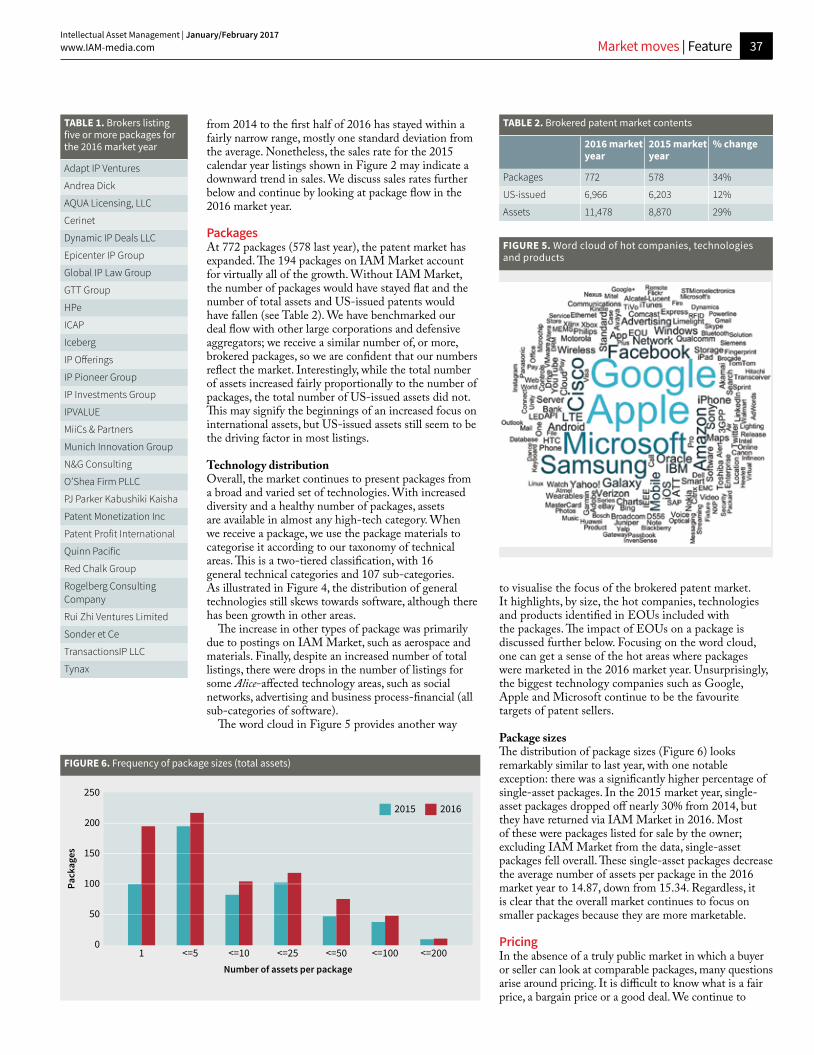
to visualise the focus of the brokered patent market. It highlights, by size, the hot companies, technologies and products identified in EOUs included with the packages. The impact of EOUs on a package is discussed further below. Focusing on the word cloud, one can get a sense of the hot areas where packages were marketed in the 2016 market year. Unsurprisingly, the biggest technology companies such as Google, Apple and Microsoft continue to be the favourite targets of patent sellers.
Package sizesThe distribution of package sizes (Figure 6) looks remarkably similar to last year, with one notable exception: there was a significantly higher percentage of single-asset packages. In the 2015 market year, single-asset packages dropped off nearly 30% from 2014, but they have returned via IAM Market in 2016. Most of these were packages listed for sale by the owner; excluding IAM Market from the data, single-asset packages fell overall. These single-asset packages decrease the average number of assets per package in the 2016 market year to 14.87, down from 15.34. Regardless, it is clear that the overall market continues to focus on smaller packages because they are more marketable.
PricingIn the absence of a truly public market in which a buyer or seller can look at comparable packages, many questions arise around pricing. It is difficult to know what is a fair price, a bargain price or a good deal. We continue to
from 2014 to the first half of 2016 has stayed within a fairly narrow range, mostly one standard deviation from the average. Nonetheless, the sales rate for the 2015 calendar year listings shown in Figure 2 may indicate a downward trend in sales. We discuss sales rates further below and continue by looking at package flow in the 2016 market year.
PackagesAt 772 packages (578 last year), the patent market has expanded. The 194 packages on IAM Market account for virtually all of the growth. Without IAM Market, the number of packages would have stayed flat and the number of total assets and US-issued patents would have fallen (see Table 2). We have benchmarked our deal flow with other large corporations and defensive aggregators; we receive a similar number of, or more, brokered packages, so we are confident that our numbers reflect the market. Interestingly, while the total number of assets increased fairly proportionally to the number of packages, the total number of US-issued assets did not. This may signify the beginnings of an increased focus on international assets, but US-issued assets still seem to be the driving factor in most listings.
Technology distributionOverall, the market continues to present packages from a broad and varied set of technologies. With increased diversity and a healthy number of packages, assets are available in almost any high-tech category. When we receive a package, we use the package materials to categorise it according to our taxonomy of technical areas. This is a two-tiered classification, with 16 general technical categories and 107 sub-categories. As illustrated in Figure 4, the distribution of general technologies still skews towards software, although there has been growth in other areas.
The increase in other types of package was primarily due to postings on IAM Market, such as aerospace and materials. Finally, despite an increased number of total listings, there were drops in the number of listings for some Alice-affected technology areas, such as social networks, advertising and business process-financial (all sub-categories of software).
The word cloud in Figure 5 provides another way
TABLE 1. Brokers listing five or more packages for the 2016 market year
Adapt IP Ventures
Andrea Dick
AQUA Licensing, LLC
Cerinet
Dynamic IP Deals LLC
Epicenter IP Group
Global IP Law Group
GTT Group
HPe
ICAP
Iceberg
IP Offerings
IP Pioneer Group
IP Investments Group
IPVALUE
MiiCs & Partners
Munich Innovation Group
N&G Consulting
O’Shea Firm PLLC
PJ Parker Kabushiki Kaisha
Patent Monetization Inc
Patent Profit International
Quinn Pacific
Red Chalk Group
Rogelberg Consulting Company
Rui Zhi Ventures Limited
Sonder et Ce
TransactionsIP LLC
Tynax
TABLE 2. Brokered patent market contents
2016 market year
2015 market year
% change
Packages 772 578 34%
US-issued 6,966 6,203 12%
Assets 11,478 8,870 29%
FIGURE 5. Word cloud of hot companies, technologies and products
Pack
ages
Number of assets per package1 <=5 <=10 <=25 <=50 <=100 <=200
2502015 2016
200
150
100
50
0
FIGURE 6. Frequency of package sizes (total assets)
Market moves | Feature

38Intellectual Asset Management | January/February 2017
www.IAM-media.com
between $250,000 and $2 million – 65% of all packages fall into this range. Here, brokers make a healthy commission while keeping purchases within buyers’ budgets so that no one deal ties up the entire budget.
We also continued to track the sub-$250,000 price range separately – an interesting range, as it represents relatively low margins for a broker. We saw an increase in these packages: 18%, up from 13%. Assuming a 25% commission for brokers, a maximum $62,500 commission is possible for such packages. Additionally, when one takes into account the overall modest sales rate of packages (more on this below), brokers have been finding ways to lower their costs. There are rarely EOUs for packages priced below $250,000 and in buying such packages, we advise clients to scale down the resources that they invest in diligence and negotiating the patent purchase agreement – unless they have significant plans for the patents. There is little to no pricing information on IAM Market and therefore IAM Market data was effectively removed from this dataset.
When excluding data from IAM Market, 82% of packages came with pricing guidance. This is almost exactly the same as the 84% last year and 83% in 2014. We believe that pricing clarifies expectations for both buyers and sellers. Additionally, 28% of packages with pricing guidance had exact asking prices, up from 26% last year. Packages without pricing guidance continue to put themselves at a disadvantage, as sales rates for such packages lag behind the market.
Clear pricing guidance helps buyers to make decisions – without guidance, the risk of no decision is higher (meaning no sale), simply because the seller is signalling a potential lack of understanding of where the market is. On the other hand, because asking prices have become more concrete, we have noticed that more of our clients are citing price as the reason for passing on a purchase. This is helpful for both sellers and buyers, as time and money are saved by not performing diligence on packages that would never close (more on this below).
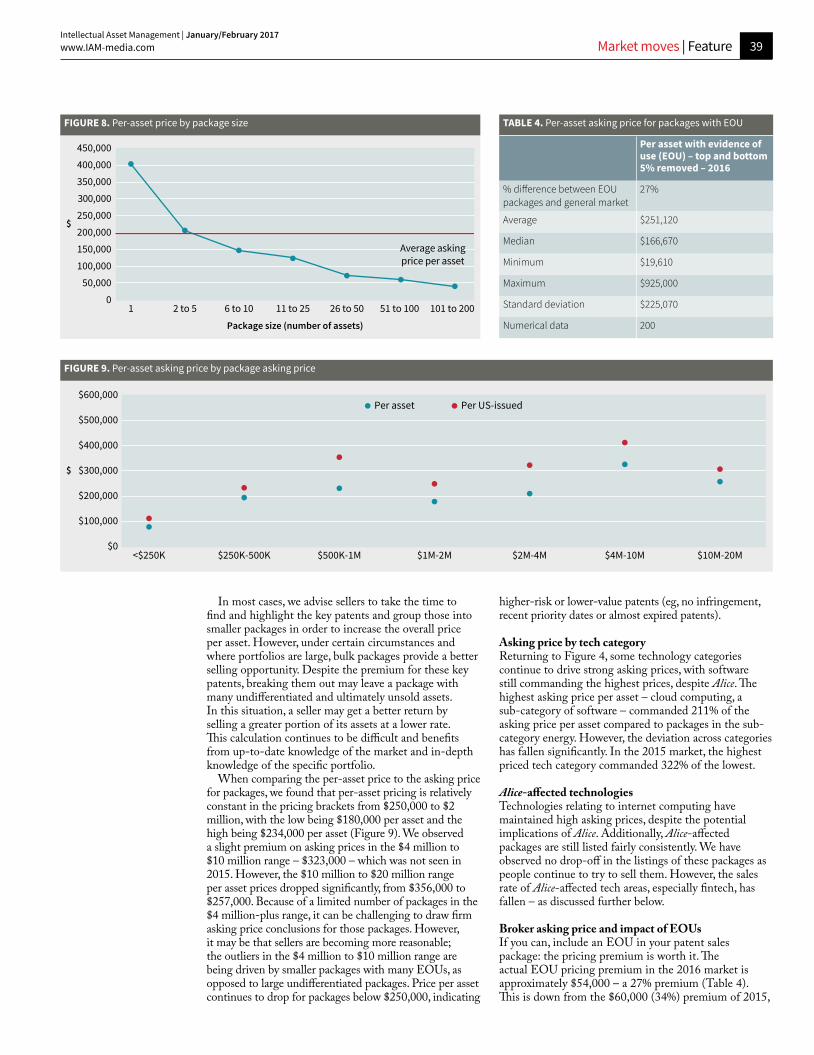
Per-asset pricing by package sizeWe analysed the interaction between pricing guidance and the number of assets in a package (Figures 8 and 9). Unsurprisingly, on average, price per asset drops considerably as the size of the package increases (from almost $400,000 to just under $50,000). This is consistent with last year’s data.
address these questions with our pricing analysis. We use the pricing analysis not only to help our clients buy and sell patents, but also to provide market-based pricing – knowing the asking price of an average patent allows us to model the price of a specific patent or package. As an added benefit, this method avoids discounted cash-flow analysis and having to determine an imputed royalty.
We believe that the availability of market pricing data helps to create liquidity in the market. For example, a novice seller approached one of our clients with a $33 million price tag for his three patent assets. With no other data, he had picked a number that he thought was reasonable. We sent him a copy of our annual market paper which he used to reprice the package at a much more reasonable $350,000. The seller moved his asking price from $33 million to $350,000. However, as the market matures, other use cases for the data arise. Recently, two companies on opposite ends of a deal used the same pricing data to argue two very different prices for the same assets; in this case, the data provided a useful structure for a pricing conversation.
Our key takeaway from pricing data is that asking prices have stabilised from 2015 to 2016 (see Table 3). Asking prices have changed only negligibly from last year, both per asset and per US-issued patent. Average price per asset increased by 3.7%, while average price per US-issued patent dropped 0.8%. The standard deviations, though still quite large, have also dropped. It is possible that the fall in asking prices has been arrested.
Figure 7 shows the distribution of asking prices. The data shows a continued focus on packages priced
Num
ber o
f pac
kage
s
<$250K $250K-500K $500,000-1M $1M-2M $2M-4M $4M-10M $10M-20M $20M+
1402016 market
120
100
80
60
40
20
0
FIGURE 7. Distribution of package asking prices (top and bottom 5% removed)
TABLE 3. Asking prices in the 2016 market
Asking price $ Top and bottom five data points from each set removed
Per asset Per US-issued patent
Average $197,320 $271,440
Median $150,000 $192,500
Minimum $16,670 $36,110
Maximum $750,000 $1 million
Standard deviation $177,400 $217,530
Numerical data 431 416
Feature | Market moves
39Intellectual Asset Management | January/February 2017www.IAM-media.com
higher-risk or lower-value patents (eg, no infringement, recent priority dates or almost expired patents).
Asking price by tech categoryReturning to Figure 4, some technology categories continue to drive strong asking prices, with software still commanding the highest prices, despite Alice. The highest asking price per asset – cloud computing, a sub-category of software – commanded 211% of the asking price per asset compared to packages in the sub-category energy. However, the deviation across categories has fallen significantly. In the 2015 market, the highest priced tech category commanded 322% of the lowest.
Alice-affected technologiesTechnologies relating to internet computing have maintained high asking prices, despite the potential implications of Alice. Additionally, Alice-affected packages are still listed fairly consistently. We have observed no drop-off in the listings of these packages as people continue to try to sell them. However, the sales rate of Alice-affected tech areas, especially fintech, has fallen – as discussed further below.
Broker asking price and impact of EOUsIf you can, include an EOU in your patent sales package: the pricing premium is worth it. The actual EOU pricing premium in the 2016 market is approximately $54,000 – a 27% premium (Table 4). This is down from the $60,000 (34%) premium of 2015,
In most cases, we advise sellers to take the time to find and highlight the key patents and group those into smaller packages in order to increase the overall price per asset. However, under certain circumstances and where portfolios are large, bulk packages provide a better selling opportunity. Despite the premium for these key patents, breaking them out may leave a package with many undifferentiated and ultimately unsold assets. In this situation, a seller may get a better return by selling a greater portion of its assets at a lower rate. This calculation continues to be difficult and benefits from up-to-date knowledge of the market and in-depth knowledge of the specific portfolio.
When comparing the per-asset price to the asking price for packages, we found that per-asset pricing is relatively constant in the pricing brackets from $250,000 to $2 million, with the low being $180,000 per asset and the high being $234,000 per asset (Figure 9). We observed a slight premium on asking prices in the $4 million to $10 million range – $323,000 – which was not seen in 2015. However, the $10 million to $20 million range per asset prices dropped significantly, from $356,000 to $257,000. Because of a limited number of packages in the $4 million-plus range, it can be challenging to draw firm asking price conclusions for those packages. However, it may be that sellers are becoming more reasonable; the outliers in the $4 million to $10 million range are being driven by smaller packages with many EOUs, as opposed to large undifferentiated packages. Price per asset continues to drop for packages below $250,000, indicating
TABLE 4. Per-asset asking price for packages with EOU
Per asset with evidence of use (EOU) – top and bottom 5% removed – 2016
% difference between EOU packages and general market
27%
Average $251,120
Median $166,670
Minimum $19,610
Maximum $925,000
Standard deviation $225,070
Numerical data 200
$
1 2 to 5 6 to 10 11 to 25 26 to 50 51 to 100
Average askingprice per asset
101 to 200
400,000
450,000
350,000
300,000
250,000
200,000
150,000
100,000
50,000
0
Package size (number of assets)
FIGURE 8. Per-asset price by package size
$
$600,000
$500,000
$400,000
$300,000
$200,000
$100,000
$0<$250K $250K-500K $500K-1M $1M-2M $2M-4M $4M-10M
Per asset Per US-issued
$10M-20M
FIGURE 9. Per-asset asking price by package asking price
Market moves | Feature

40Intellectual Asset Management | January/February 2017
www.IAM-media.com
up to litigation, most patents will have very different use cases – understanding this can help to set your patent buying programme.
The authors have worked with Mark Lemley of Stanford University on a forthcoming analysis of litigation results for transferred patents by examining a data set of US patents which were transferred and litigated through judgment. The initial results contradict the received wisdom that the authors have heard from some general counsel and chief IP counsel that one cannot successfully litigate a purchased patent. Purchased patents can be and are litigated successfully – albeit for operating companies, less successfully than organic patents. The litigation success rates vary by purchaser type and we recommend analysing the full results when the paper becomes available and using them to adjust purchase models accordingly for your company. As noted above, some caution is recommended here, as litigation is but one, fairly narrow, use case for purchased patents.
When a buyer looks to buy patents, the business use case tends to be narrow compared to the pool of packages available on the market. The vast majority of packages will not fit the business use case, irrespective of their quality. Put another way: if the claims, prior art, prosecution and applicable markets for any given package were all perfect, would you still want to buy it? The answer is most often no. However, the same assets could be exceptionally useful to another buyer. Packages that do not fit a buyer’s specific use case should be immediately removed from consideration in order
although this drop remains well within the pricing variance. Just as we observed in the 2015 market, Figures 10 and 11 show the pricing premium for EOUs with a clear upward shift in per-asset asking prices when EOUs are provided.
Brokers appear to have acknowledged this premium as well and have increasingly included EOUs in their marketing material. Excluding IAM Market (which has significantly more packages for sale by owner), the percentage of offering packages with EOUs rose from 37% to 43%. We continue to see brokers asking sellers for upfront fees to cover some of the costs of preparing the offering package, including EOUs.
Key diligence dataWhen discussing potential patent purchases, we continue our efforts to end use of the phrase ‘low quality’ with regard to broadly characterising patents. We often hear that there are ‘junk’, ‘low-quality’ or ‘weak’ patents on the patent market. Clearly, there are some patents which we can objectively agree are low quality. However, the majority of patents are never tested for quality metrics (eg, enforceability) because this is simply too expensive to test. If buying, you should be doing so with a purpose and therefore analysing the value of the assets in a particular context or for use in a specific business need. A patent needed for litigation must pass much higher diligence tests than one needed to de-risk a future alternative technology choice. Additionally, the first patent that you buy may need to meet different diligence tests from the 800th. While the best patents will stand
<$250K $250K-500K $500K-1M $1M-2M $2M-4M $4M-10M $10M-20M $20M+
35%
30%
25%
20%
15%
10%
5%
0%
FIGURE 10. Distribution of package asking prices with EOU
<$250K $250K-500K $500K-1M $1M-2M $2M-4M $4M-10M $10M-20M $20M+
35%
30%
25%
20%
15%
10%
5%
0%
FIGURE 11. Distribution of asking prices without EOU
Feature | Market moves

41Intellectual Asset Management | January/February 2017www.IAM-media.com
diligence process to highlight the importance of quickly eliminating ill-fitting packages.
Figure 12(a) shows the entire market with value distributed according to a log normal – the goal is to identify the 1% to 2% of high-value patents to purchase (highlighted in yellow). The first diligence step at Figure 12(b) is to test the package for general technology fit test (eg, wearables). The gold area shows the percentage of the market that is subjected to this test; a large section of the market is immediately eliminated (pass versus fail side of white line). The next step (Figure 12(c)) is to see whether the technology described is something of specific interest to the client (eg, heart rate monitors) – the green area shows the percentage of the market where this test is applied and again much of the remaining market is eliminated (pass versus fail side). The question at this stage could be: if we assume that the patent is otherwise perfect, would we still buy it? Where the test is applied, the answer is no 70% of the time (everything that has failed the first two tests).
The process can continue with multiple diligence phases. We show the conclusion of a four-phase process in Figure 12(d), where two more rounds of diligence are conducted. The first involves inexpensive tests, such as remaining life of the patents, bid due dates and pricing. Again, these tests are applied to a very small part of the market (the blue portion). Finally, expensive diligence is applied to only a few percent of all the market (the orange portion).
Table 5 shows the specific reasons that our clients gave for passing on these packages. In terms of Figure 12(d), this aligns with the distribution of results on packages being tested in the blue and grey areas. Pricing as the
to reduce diligence expenditures, meaning that testing quality becomes irrelevant. This is one of the many techniques which can be used to reduce the costs in a patent purchase programme.
Based on our data, a small percentage of all the packages on the market will fit a company’s specific business needs. For this article, we submit that this highly concentrated distribution of value to a particular buyer in the overall market presents a log normal distribution, similar to most companies’ patent portfolios. This is an extrapolation of Suzanne Harrison’s analysis of multiple corporate patent portfolios in her book Edison in the Boardroom.
Working with the model that value is highly concentrated, how should you deploy your diligence resources? Figures 12(a) to (d) demonstrate a tiered
TABLE 5. Reasons for passing on a package given technology fit
Reason for passing Scaled % of 2016 market
Scaled % of 2015 market
Pricing 24% 15%
Actual market adoption is too small 21% 40%
EOU fails to map properly 21% 20%
Remaining asset life is too short 15% 10%
Unresolved prior art 10% 10%
Client-specific buying criteria 7% 1%
Bids are due too soon 3% 1%
Unresolved prosecution concerns 0% 3%
Proportion of the patent market
Goal: Identify 1%-2% high-value patents to purchase
Valu
e fo
r bus
ines
s pur
pose
sof
a sp
ecifi
c bu
yer
(a)Proportion of the patent market
General technology fit
Pass Fail
Goal: Identify 1-2% high-value patents to purchase
Valu
e fo
r bus
ines
s pur
pose
sof
a sp
ecifi
c bu
yer
(b)
Proportion of the patent market
Specific technology fit
Goal: Identify 1%-2% high-value patents to purchase
Valu
e fo
r bus
ines
s pur
pose
sof
a sp
ecifi
c bu
yer
(c)Proportion of the patent market
Most expensive diligence
Goal: Identify 1-2% high-value patents to purchase
Valu
e fo
r bus
ines
s pur
pose
sof
a sp
ecifi
c bu
yer
(d)Pass Fail Pass Fail
Proportion of the patent market
Most expensive diligence
Goal: Identify 1-2% high-value patents to purchase
Valu
e fo
r bus
ines
s pur
pose
sof
a sp
ecifi
c bu
yer
(d)Pass Fail
FIGURES 12 (a) to (d). Importance of sequencing patent-buying diligence
Market moves | Feature

42Intellectual Asset Management | January/February 2017
www.IAM-media.com
rate from 2009 remains the high-water mark, with no indication of sales returning to that rate.
Sales by package sizeWe analysed the sales rate based on the size of the package listed and Table 6 illustrates that the highest sales rate occurred for packages with between 11 and 25 assets (in 2015 it was packages with between six and 10 assets). The sales identification methodology does skew towards identifying sales of larger packages because if any asset changes hands, the package is considered sold. We do not account for a buyer cherry picking from large packages. However, contrary evidence of such cherry picking is that if buyers were regularly doing this, one would expect to see a much higher sales rate in the 51 to 100 asset range. We did see a higher rate in the 101 to 200 asset range (not shown) as a result of cherry picking.
reason for passing is up to 24% (previously 15%), making it the top category for the first time. We believe that this reflects a recognition by buyers that asking prices are more stable and less negotiable. In particular, some of our clients have become more price focused. Brokers should assume that asking price is becoming more important and that people will react to it differently than in previous years.
Some issues that might be expected to cause client concern rarely cause a package to be eliminated. For example, where the bid due date is too soon, brokers are often willing to move it. As in previous years, buyers continue to improve and systematise their buying processes, resulting in fewer packages receiving expensive diligence.
SalesSales rates are down from 2015, which were themselves down from the previous year. This fall is likely the result of the drop-off in NPE buying, continued negative litigation outcomes for patent holders and a general calming in the bigger patent wars. While this represents a significant challenge for new entrants in the brokered market, overall sales rates have not fallen off a cliff (see Figure 3). Further, a number of the sales made since our last article were of older packages (eg, a number of packages listed in calendar year 2013 sold). This finding accords with the bidding recommendations discussed below in connection with Figure 14: desirable packages which address business needs move fast, followed by a long, slow tail of additional sales.
Turning to the sales analysis, our methodology uses the US Patent and Trademark Office (USPTO) assignments database to identify sales (if at least one patent in a package is found to have a sales assignment, that package is treated as sold). We use the execution date as the date of sale. The data is limited to packages received by May 31 2016 and to sales recorded with the USPTO by August 21 2016. When discussing sales, we switch to a different data set, which includes 2,273 packages, with 441 identified by sales that are measured by the calendar year. This sample set includes packages which were analysed in our previous articles and goes back to packages listed as early as 2009.
Our 2015 sales rate is currently at 10.4% (compared to 18.4% for 2014 and 14.9% for 2013 at the same juncture for each). To project the 2015 calendar year sales (Figure 13), we estimated that by the end of 12 full months, approximately 14% of packages would have sold. We then projected the future sales for an additional two years based on the slower rate of sales for packages listed in 2015 compared to those listed in 2014. The sales rates from packages listed between 2012 and 2014 were used to estimate how quickly 2015 listed package sales would fall off in subsequent years. Looking at this projection compared to 2011, 2013 and 2014 sales rates show a trend of declining success rates for patent sales.
Predicting the direction of the market is challenging. Looking back at our projections over the past few years, we see that the 2013 listings finally caught up with our initial projection of 32%, but it took two years for them to do so. However, our projection of 29% for 2014 listings has not yet been achieved (currently 24%). While not shown on the graph, the 51% sales
<1 <2 <3 <4 <5 <6
201120132014Predicted 2015
35%
40%
30%
25%
20%
15%
10%
5%
0%
Time from package listing date to sale date (years)
Cum
ulat
ive
% so
ld
FIGURE 13. Cumulative sales by years from package listing date
TABLE 6. Sales rate by package size, 2015 listings
Number of assets Sales rate – 2015 listings
1 6%
2 to 5 6%
6 to 10 14%
11 to 25 20%
26 to 50 13%
51 to 100 10%
Months from receipt date
Advantagebuying here
0 1 2 3 4 5 6 7 8 9 10 11 12 13 14 15 16 17
100%
80%
60%
40%
20%
0%
FIGURE 14. Cumulative sales percentage
Feature | Market moves

43Intellectual Asset Management | January/February 2017www.IAM-media.com
with EOUs accounted for more than half (54%) of the sales of packages listed in 2015 or 2016. EOUs are a distinct advantage, considering that the likelihood of an EOU being provided in this dataset was only 36%. Putting these numbers in context, packages with EOUs are 50% more likely to sell, while packages without are 28% less likely to sell than an average package.
Impact of Alice on salesAlthough we usually analyse sales using calendar years, the Alice ruling roughly coincides with the beginning of the 2015 market year, so we have used market years for this analysis (Figure 15). We took our 107 technology sub-categories and labelled each as either Alice affected or non-Alice affected. We identified 34 sub-categories – including most software, business processes, social networking and advertising – as Alice affected. Additionally, within these categories, we identified seven technology sub-categories (business processes, e-commerce, payments, traded instruments and items with minimal hardware relating to payments) which we categorised as fintech.
We compared the sales rates of the Alice-affected areas for the 2013, 2014, 2015 and 2016 market years (ie, June 1 of the previous year to May 31 of the market year) to the respective total sales rates. As noted, too few sample points for the 2016 market year were available to reach firm conclusions. However, there may be a rebound of sales of non-fintech, Alice-affected packages.
As Figure 15 shows, before the Alice decision, packages in Alice-affected categories were selling at above the market rate; then the rates dropped. This analysis reflects a change due to increased data availability – our previous 2015 market year analysis had initially shown that sales remained up post-Alice.
Meanwhile, for fintech patents alone, sales appear to have cratered post-Alice (down 40% compared to 2015 market year). Curiously, pricing for fintech packages lags and has not dropped relative to the abysmal sales rate.
SellersWe now turn to sellers of patents for packages received between January 1 2015 and May 31 2016 (assignments were last checked on August 21 2016). As expected and as illustrated by Figure 16, sales were mostly by
Sales by receipt dateWe also analysed how quickly packages sell in order to estimate how much time buyers have to bid. We focused this analysis on packages which sold in order to calculate when buyers need to make a decision to avoid missing out on purchasing opportunities. The speed with which buyers are reviewing and purchasing packages continues to increase as buyers become more sophisticated and systematic. Figure 14 demonstrates that for 2015 listings, 80% of sales occurred within eight months (down from 11 months) of the receipt date of the package. We also observed that some buyers can move extremely fast, as is evident by over 50% of the packages selling within the first four months (up from 30%). Accelerated decision making continues to be an advantage.
Interestingly, the increase in buyer sophistication may have had an additional effect. The more automated a buying programme becomes, the easier it is to re-examine packages if buying criteria changes. This could be why we have seen more sales of older packages, specifically 2013 listings, than in previous years. It is possible that we may start to observe a pattern of quick buying upon initial listings and then a second wave of sales two to three years later, although it may be some time before we have sufficient data to confirm or refute this hypothesis.
Sales by EOU providedThis year, we continued to see an increased sales rate for packages with EOUs in the marketing material. While we occasionally hear buyers say that broker EOUs are unhelpful, the data indicates otherwise. Provision of an EOU not only boosted asking prices by 27%, discussed above, but also increased the chance of sale. Packages
Market year
2013 2014 2015
12%
10%
8%
6%
4%
2%
0%
-2%
-4%
-6%
% d
i�er
ence
FIGURE 15. Percentage difference between Alice-affected sales rates by year
Operating company
NPE
Inventor
University/research
Defensive aggregator
Other66%
17%
10%
3%2%
1%
FIGURE 16. Distribution of seller type by sale year 2015-2016
“For fintech patents alone, sales appear tohave cratered post-Alice (down 40% compared
to 2015 market year). Curiously, pricing for fintech packages lags and has not dropped
relative to the abysmal sales rate”
Market moves | Feature

44Intellectual Asset Management | January/February 2017
www.IAM-media.com
operating companies: 66% (down from 71%). This drop was distributed fairly evenly over the other four categories. Missing from the sales data are private sales, which are not visible to us on the brokered market.
In terms of repeat sellers in this same period, 26 entities sold more than one package: 17 operating companies, five defensive aggregators, three NPEs and one inventor. These sales accounted for 36% of sold packages, 48% of sold assets and 50% of sold US-issued patents. As we discussed in an article on IV, having cross-licences (or a licence on transfer) would substantially reduce a company’s exposure to patents from regular sellers. The list of repeat sellers should be the focus for any cross-licensing strategy (Table 7).
BuyersSurprisingly, for the first time, operating companies were the largest purchasers at 48% (up from 34%). NPE purchases fell to 34% (from 42%) and defensive aggregator purchases were also down, this time to 15% (from 21%) (Figure 17). IV’s buying dropped to only 13 packages (down from 40) and may be the primary reason for the fall in NPE purchases. This also raises concerns about how successful IV’s licensing and sales have been.
During this period, 123 buyers purchased 202 packages, with 28 buyers purchasing multiple packages. Repeat buyers purchased 53% of the packages sold (Table 8). The top three buyers (IV, RPX Corporation and AST) purchased only 21% (down from 36%). Additionally, RPX took over IV’s spot as top buyer, purchasing 11% of packages, 10% of assets and 12% of US-issued patents.
Like the rest of our analysis, these numbers include the brokered patent market only and do not include private purchases.
Litigations and inter partes reviewsOf all packages sold, 10.2% have at least one US patent litigated after the listing date. We have a much better data set this year and the rates are much higher than previously reported. We strongly recommend revising any models based on the old data.
We analysed all of the packages in our database to look at the use of the assets after receipt of the package by the broker. Because we used a better source of US litigation and inter partes review data this year, it makes it impossible to compare our results to our previous year’s analysis. Focusing on package-level analysis for packages received in the market years from 2012 to 2016, and looking for packages with at least one litigation or inter partes review as of October 2016, we found that the sold packages are litigated and inter partes reviewed to a greater degree than packages generally (Table 9). For inter partes reviews, Table 9 focuses on packages listed in the market years 2014 to 2015, since we wanted to account for full implementation of the America Invents Act.
Table 9 suggests that purchased patents are used in either litigations or perhaps private assertions (not all inter partes reviews have corresponding litigations) with much greater frequency than previously found. When analysed on a per-US patent basis, about 1.2% of US patents presented are litigated.
Our new data source allows us to better analyse the timing of the first litigation for the sold packages (Figure
TABLE 8. Repeat buyers (bought at least two packages in 2015-2016)
Buyer
9051147 Canada Inc
Alliacense Limited LLC
Allied Security Trust
Beijing Xiaomi Mobile Software Co, Ltd
Carlow Innovations LLC
Commscope Emea Limited
Domo, Inc
Empire IP LLC
Facebook, Inc
Finnavations LLC
Gemalto SA
Google Inc
Huawei Technologies Co, Ltd
Intellectual Discovery Co, Ltd
Intellectual Ventures
Knapp Investment Company
Linkedin Corporation
Marking Object Virtualization Intelligence, LLC
Microsoft Technology Licensing LLC
Open Invention Network, LLC
Optimum Communications Services, Inc
Palo Alto Networks, Inc
Rakuten, Inc
Red Hat, Inc
RPX Corporation
Taiwan Semiconductor Manufacturing Co, Ltd
Twitter, Inc
Uniloc Luxembourg SA
Operating company
NPE
Defensive aggregator
Other
48%
34%
15%
3%
FIGURE 17. Distribution of buyer type by sale year 2015-2016
TABLE 7. Repeat sellers (sold at least two packages in 2015-2016)
Seller
Alcatel Lucent
Allied Security Trust
ATT
BAE Systems, Inc
British Telecom
Caveo
Elizabeth Dyor
Empire IP, LLC
Harris Corporation
IBM
Imation Corporation
Intel
NEC
Netsocket
Nokia Solutions and Networks
Panasonic Corporation
Petnote LLC
QinetiQ Limited
Rockstar
Rovi Corporation
TP Lab, Inc
Tyco Electronics
Verisign, Inc
Verizon
VideoMining Corporation
Xerox/PARC
Feature | Market moves

45Intellectual Asset Management | January/February 2017
www.IAM-media.com
18). Surprisingly, the filing of litigations is somewhat delayed after a purchase. Litigations start in earnest around four months from the sales date, with around half of all first litigations filed around one year. The tail is long, though – nearly 20% of litigated sold packages are not first litigated until more than two years from the sale (43 months is the longest delay from sale to first litigation in our data set).
When developing a strategy for addressing the risk of litigation from packages listed on the brokered patent market, it is important to look at which packages get litigated. Figure 19 examines the proportion of litigations that came from sold and unsold packages. All of the packages in this dataset have at least one US-issued asset which was litigated after the listing date, while 56% of all litigations after a listing are from sold patents. This highlights the importance of a robust risk clearance function for the in-house team. A combination of cross-licences, licence on transfer agreements and membership of defensive aggregators can reduce these litigation risks. Similarly, the remaining
Months from receipt date
0 1 2 3 4 5 6 7 8 9 10 11 12 13 14 15 16 17 18 19 20 21 22 23 24
100%
80%
60%
40%
10%20%
90%
70%
50%
30%
0%
FIGURE 18. Cumulative distribution of months from listing date to earliest case filing date for each litigated package
56% 44%
0% 10% 20% 30% 40% 50% 60% 70% 80% 90%
Sold Not sold
100%
Pack
ages
with
litig
atio
n
FIGURE 19. Post-listing litigation activity
TABLE 9. Frequency of litigation and inter partes reviews in packages
Packages with litigation (2012-2016 market year packages)
Packages with inter partes reviews (2014-2015 market year packages)
Package type Prior to listing date After listing date Prior to listing date After listing date
Sold packages 5.4% 10.2% 0% 3%
All packages 3.8% 3.5% 0% 1.4%
Data summary
Summary of 2016 results
Annual sales $165 million
Asking price per US-issued patent $271,000
Asking price per patent asset $197,000
EOU asking price premium 27%
Package sales rate (cy) 21%
Number of people employed as brokers 137
Sold package litigation rate (tt) 10.2%
All package litigation rate (tt) 3.5%
Packages listed 772
US-issued patents 6966
Patent assets 11478
Average number of assets per package 14.8
Median number of assets per package 5
Packages with 10 or fewer US-issued patents 75%
� All data is market year June 2015 to May 2016, unless noted
� Calendar year (cy) – calendar year 2015
� Total tracking (tt) – listed June 2012 to May 2016
44% of litigations came from assets that never changed hands – the original owner could not sell the patents and sued. This suggests that monitoring the brokered patent marketplace and defensive purchasing can be valuable as well.
Full market size
Once again, the brokered market has shrunk: we estimate that actual sales from June 1 2015 to May 31 2015 were $165 million (down from $233 million the previous year).
We have continued to reuse the methodologies adopted in last year’s article to simplify the analysis by using the actual observed sales which were executed in the 2016 market year, along with their asking prices. As with last year, if no pricing guidance was provided, the average asking price per asset for that market year (eg, $197,000 for 2016 market year listing) was multiplied by the number of assets to determine the expected asking price.
In the 2016 market year, 118 sales were identified,
Market moves | Feature

46Intellectual Asset Management | January/February 2017
www.IAM-media.com
• New sources such as IAM Market and IP3 have transformed the landscape of available buying opportunities.
• The impact of negative patent decisions shows in the data, with NPEs down but not out. With the increased litigation risk from both sold and available patents, defensive aggregator membership and risk models should be re-evaluated.
The evolution of the patent market continues as more companies look to participate. Companies should define success in their patent buying/selling programmes with metrics calibrated to market data. Through focused sourcing and intake processes, buyers can streamline their processes to identify high-value patents more effectively (see Figure 12 and accompanying discussion). Further, buyers can leverage the market pricing data that we provide and pair it with company-specific valuation models. Buyer expectations have helped to drive the market to be more efficient: more and varied sources of patents, provision of more EOUs and clearer pricing guidance. Taken together, these result in improved liquidity and a market that is significantly more transparent than it was five years ago.
accounting for a total asking price of $242 million. We know that some of the sales in that period have not yet been recorded – estimated at approximately 3% – so we reduced our standard 35% discount between the asking price and the expected selling price to 32%. Thus, our expected total market size for the 2016 market is $165 million. In our analysis last year, we estimated the 2015 market at $233 million, so the market has declined by approximately 30%.
Using an average commission rate of 25%, the revenue from this market for brokers is $41 million per year. We back-tested the market size by estimating the average loaded labour rate per broker ($300,000 a year), resulting in 137 full-time equivalent brokers. Assuming that three brokers work in each brokerage, this results in approximately 46 brokerages. Our data shows 73 brokerages, which suggests that there are even fewer brokers per brokerage or that brokers are doing other things (eg, consulting). Additionally, each brokerage brings about nine packages to the market per year. However, our data shows that a few brokers bring many packages to the market, with the majority bringing a few packages.
Opportunities and reflections
We started writing these articles on the brokered patent market five years ago to inform the market and we will continue to do so (“Turning the spotlight on the brokered patent market”, IAM issue 57; “The brokered patent market in 2013”, IAM issue 63; “The brokered patent market in 2014”, IAM issue 69; and “The brokered patent market in 2015 – driving off a cliff or just a detour?”, IAM issue 75).
Key findings and action items from this year’s analysis include the following: • At $165 million, the brokered market is down, but
robust and viable. Companies can fill niches, build counter-assertion portfolios and address potential risk cost effectively.
Kent Richardson and Erik Oliver are founding partners and Michael Costa is an intellectual asset analyst with the ROL Group, Los Altos, United States
When buying patents:�� state the business case for buying – identify the specific
problem that you are trying to solve;�� model a return for your buying programme – adjust
existing models for litigation risk;�� arrange your buying operations to reflect that over 90%
of the patents will not fit your needs – eliminating those patents from consideration early will greatly reduce your costs (see Figures 12(a) to (d) and accompanying discussion); and
�� operationalise your buying programme as much as possible – this is becoming more common and is therefore more important for all buyers.
Programme parameters include:�� timeline;�� budget;�� buying team authority and responsibilities;�� buying criteria;�� listing of acceptable sources of patent packages; and
�� special requirements, such as a whitelist of unlicensed companies.
The following is a fail-fast triage process for eliminating undesirable packages quickly:�� Extract criteria from the business case to identify
interesting markets and technologies, and define the diligence needs.
�� Undertake a multi-part analysis of markets, technical knowledge and legal analysis where a failure in any one area eliminates the package from further review.
�� Track basic information about your programme so that you can learn from your past.
Tips for bidding and buying include the following:�� Build a valuation model to determine a maximum bid
price.�� Assume that diligence will take longer than planned.�� Consider adding a consulting agreement with the
inventors if they are available.
Action plan
“At $165 million, the brokered market is down, but robust and viable. Companies can fill niches, build counter-assertion portfolios and address potential risk cost effectively”
Feature | Market moves
You need accurate, reliable evidence of use to assert your patents. Inside Technology can help you find it faster. It’s the ideal first checkpoint for semiconductor and electronics companies, law firms and other licensing professionals seeking to achieve their IP goals.
For more information www.chipworks.com/inside-technology
IAM_inside-technology-ad_rev6.0CC.indd 1 18/11/2016 1:09:02 PM