office financial management
TRANSCRIPT

OFM 2007-08 Annual Report
ooffffiiccee
ooff ffiinnaanncciiaall
mmaannaaggeemmeenntt
aannnnuuaall rreeppoorrtt 22000077--0088
OFM 2007-08 Annual Report
Statutory reporting compliance index Aboriginal and
Torres Strait Islanders 84 Access details Inside front cover Action plan for women 83 Aims and Objectives 4 Annual Report
costs and details Inside front cover Auditor-General’s opinion 40 Charter 4 Clients and stakeholders 16 Code of conduct 11 Commitment to Service 16 Committees 88 Consultants 85 Consumer response 7, 38 Contact details Inside front cover Corporate objectives 4 Credit card certification 86 Disability Strategic Plan 83 Economic/other factors
affecting achievement 14 Electronic service delivery 38 Energy management policy 94 Equal employment opportunity 84 Ethnic affairs priorities statement 83 Exemptions from
reporting provisions 109 Executive remuneration
and qualifications 10 Female Executive Officers 12 Financial statements 39 Freedom of Information 97 Highlights of 2007-08 3 Human resources 11,12 Legislation 104, 109 Legislative change 106 Letter of submission to Minister
Inside front cover Major assets 86 Management and activities 1-38 Management and structure 8-9 Mission 4 Occupational health and safety 82 Organisation chart 8 Overseas travel and visitors 85 Payment of accounts 96 Performance indicators 5,6,7,13,17 18,19,23,28,33,35,37 Personnel policies, practices 33-38 Principal Officers 8,10 Privacy management plan 87 Promotion 96 Publications 96 Remuneration - officers
above SES level 10 Report on operations 1-38 Research and development 23 Risk management 35 Senior executive service 8,10,12 Staff establishment tables 12 Statement of Secretary’s
performance 10 Summary review of
operations 1-38, 82-110 Time for payment of accounts 86 Time for provision of
services 5-7,17,23 Waste reduction 94 31 October 2008 ISSN 1322-8102 Total external production costs for this annual report were $5,366.90 (GST included). This annual report and a range of publications are available on the NSW Treasury website www.treasury.nsw.gov.au
The Hon Eric Roozendaal MLC Treasurer Governor Macquarie Tower
1 Farrer Place SYDNEY NSW 2000
Dear Treasurer I have pleasure in submitting the Annual Report of the NSW Treasury's
Office of Financial Management for the financial year ended 30 June 2008, for presentation to the Parliament of New South Wales in accordance with the Annual Reports (Departments) Act 1985.
The Report contains the Consolidated Financial Statements for Treasury, covering both the Office of Financial Management and the Office of State Revenue.
A second volume containing a report on the operations of the Office of State Revenue is submitted separately.
A third volume contains the financial statements for the Crown Entity and its commercial activities. Treasury is responsible for managing Crown finances, which concern public sector wide assets, liabilities and transactions that are the overall responsibility of government and not individual agencies.
Yours sincerely
John Pierce Secretary
31 October 2008
Office of Financial Management address Level 27 Governor Macquarie Tower
1 Farrer Place Sydney NSW 2000 Executive Reception Hours
Monday to Friday 8.30 am to 5.30 pm Telephone (02)9228 4426
Fax (02)9221 7029 Web: www.treasury.nsw.gov.au
OFM 2007-08 Annual Report - 1
comprises the Office of Financial Management (OFM) and the Office of State Revenue (OSR). This is OFM’s volume of Treasury’s Annual Report. It documents OFM’s performance in implementing its corporate plan. OFM’s Corporate Plan outlines the strategic framework for managing the State’s finances. That framework supports achievement of State Plan priorities, particularly maintaining NSW’s Triple A credit rating and maintaining, and investing in, State infrastructure. OFM has been assigned lead agency responsibility for these two priorities, working in partnership with other Government agencies. The Corporate Plan framework provides the context for OFM’s operations. It outlines our mission, the results we seek to influence and the strategies we apply to maximise the impact of our services. The Corporate Plan provides the structure for our internal and external performance reporting. It also provides the context for OFM’s annual Results and Services Plan and the performance agreements of the Secretary and all OFM officers. This annual report outlines the progress being made towards the achievement of planned results due to the application of OFM’s strategies, and the services and achievements that support them. Result indicators report on progress towards the planned results. Service measures allow the standard of our services to be monitored. Efficiency measures reveal how well OFM operates as an organisation. OFM’s annual report includes some references to the activities of the NSW Self Insurance Corporation (SICorp), a statutory authority managed by OFM. Full detail of SICorp operations is published in its own separate annual report, as required by its founding legislation.
Our Annual Report is presented in the following sections:
2 Overview of OFM in 2007 - 08
18 Our planned results – our performance 2007 - 08
18 Strong State finances supporting the delivery and long run affordability of government services
28 Policy settings promoting a competitive State economy
33 Supporting activity in 2007 - 08
33 Building a values-based organisation to support the achievement of our planned business results
39 Financial Statements of the NSW Treasury
81 Appendices
111 Index
Acronyms list AASB Australian Accounting Standards Board
AER Australian Energy Regulator
ANZSOG Australian New Zealand School of Government
ATOC Australasian Treasury Officers Conference
BFMD Budget and Financial Management Directorate
CGC Commonwealth Grants Commission
CMU Corporate Management Unit
COAG Council of Australian Governments
CSO Community Service Obligation
EESD Environment and Economic Services Directorate
FED Fiscal and Economic Directorate
FMF Financial Management Framework
GAAP Generally Accepted Accounting Principles
GFS Government Finance Statistics
GSP Gross State Product
HFE Horizontal Fiscal Equalisation
HSSD Human and Social Services Directorate
ICT Information and Communication Technology
IGA Inter-Governmental Agreement
IPART Independent Pricing and Regulatory Tribunal
MCE Ministerial Council on Energy
NCC National Competition Council
NCOS Net Cost of Services
NCP National Competition Policy
NFL Net Financial Liabilities
NP National Partnership
NRA National Reform Agenda
OFM Office of Financial Management
OH&S Occupational Health and Safety
OIM Office of Infrastructure Management
OSR Office of State Revenue
PAC Public Accounts Committee
PAR Performance Agreement and Review
PFAA Public Finance and Audit Act
PFP Privately Financed Project
PMBS Performance Management and Budgeting System
PPP Public Private Partnership
PSWO Public Sector Workforce Office
RBA Reserve Bank of Australia
RSP Results and Services Plan
SiCorp NSW Self Insurance Corporation
SOC State Owned Corporation
SFS State Fiscal Strategy
SIS State Infrastructure Strategy
SPP Specific Purpose Payments
TAM Total Asset Management
TMF Treasury Managed Fund
TOES Treasury On-line Entry System
VFI Vertical Fiscal Imbalance

overview of OFM’s performance in 2007-08
2 - OFM 2007-08 Annual Report
John Pierce Secretary
2007-08 was another eventful year for OFM – a year of achievement, and challenge. The credit rating agencies again assigned a Triple A credit rating to NSW, recognising the State’s financial performance and the Government’s commitment to the State Fiscal Strategy. The Triple A is a State Plan priority, and as lead agency, we will continue to provide financial management advice to maintain this rating. However, this will not be without its challenges in the year ahead as the Government seeks to implement its plans to maintain the strength of the State’s finances, while combating the impact of global economic changes. During the year we also advised on the development of an updated ten year State Infrastructure Strategy that sets out the Government’s plans to maintain and invest in infrastructure. Again we have lead responsibility to advise on this State Plan priority, while ensuring consistency with the overall fiscal strategy. OFM supported delivery of the Government’s broader priorities by aligning the 2008-09 State budget process with the State Plan.
2007-08 also presented OFM with great opportunities to contribute to historic public sector reforms and our involvement will continue in the coming years. We had a leading role in advising the NSW Government on the development of the Council of Australian Government’s reform program. Our involvement in implementing these reforms, which began early in 2008, challenges us to focus our limited resources and means we need to rely on strong team work, both within OFM and with other agencies. OFM also participated in the development of the Government’s strategy to secure the States’ energy supply. This remains a challenge for the new financial year as we continue to advise on, and coordinate the implementation strategy. To support the delivery of these priorities we rearranged the responsibilities of the OFM Executive and we are drawing on our expertise across Branch boundaries. Strong team work has been to the fore and has enabled us to deliver as required. To enhance our capability, we progressed our business improvement program. In March 2008, we launched a new Corporate Plan. The Plan documents the strategic management framework that guides our operations to ensure our services and strategies deliver the priorities entrusted to us. Most importantly, it provides a frame of reference that allows OFM officers to identify how they are contributing to our planned results. OFM performed outstandingly in rising to the challenges assigned to us during 2007-08. An organisation is only as good as its people and I sincerely thank OFM management and staff for their efforts. They have shown once again that our people are our strongest resource. I would also like to acknowledge two officers who recently retired after contributing so much during lengthy careers in Treasury. Ian Neale, Executive Director Environment and Economic Services, and Garry Lambert, Executive Administration Officer retired in mid 2008 after many years of loyal and professional service to Treasury and the NSW Government. Their contribution has left an outstanding legacy and I wish them well in their lives beyond Treasury.
John Pierce Secretary
NSW Triple A Moody’s: NSW’s Aaa is stable, reflecting…
“…a sound record of financial performance, low debt burden and sizeable and diverse economic base.” October 2007
Following the 2008-09 Budget, which outlined a large scale capital improvement program, largely funded by an increase in debt, Moody’s expressed the view that…
“…the state’s low starting point allows for additional borrowing without impact to the rating.” June 2008
Standard and Poor’s: In reaffirming NSW’s AAA rating, cited…
“…forecast accrual operating surpluses” and NSW’s “improving financial performance driven by the government’s fiscal discipline.” September 2007
“…the NSW 2008-09 budget is consistent with the state’s AAA rating.” June 2008
But, in noting the Government’s Energy Reform plans, a warning was given that the alternative of “debt funding new generation capacity would likely put the rating under pressure.” June 2008
overview of OFM’s performance in 2007-08
OFM 2007-08 Annual Report - 3
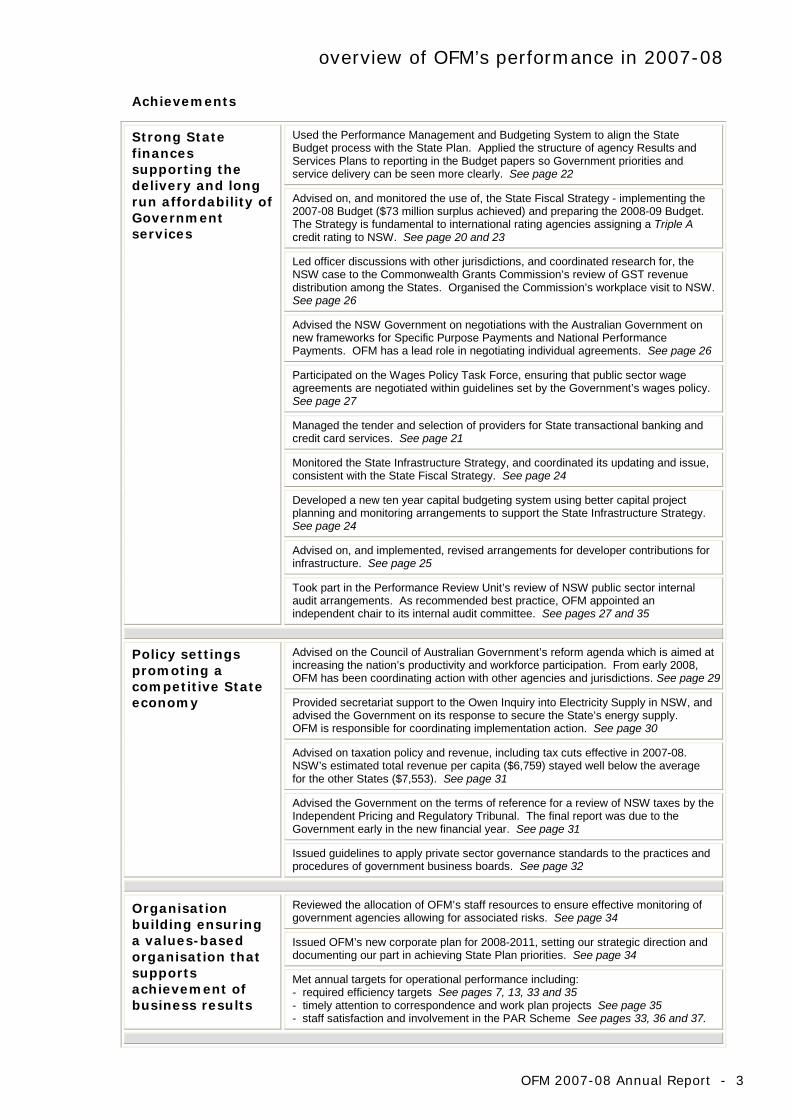
Achievements
Strong State finances supporting the delivery and long run affordability of Government services
Used the Performance Management and Budgeting System to align the State Budget process with the State Plan. Applied the structure of agency Results and Services Plans to reporting in the Budget papers so Government priorities and service delivery can be seen more clearly. See page 22
Advised on, and monitored the use of, the State Fiscal Strategy - implementing the 2007-08 Budget ($73 million surplus achieved) and preparing the 2008-09 Budget. The Strategy is fundamental to international rating agencies assigning a Triple A credit rating to NSW. See page 20 and 23
Led officer discussions with other jurisdictions, and coordinated research for, the NSW case to the Commonwealth Grants Commission’s review of GST revenue distribution among the States. Organised the Commission’s workplace visit to NSW. See page 26
Advised the NSW Government on negotiations with the Australian Government on new frameworks for Specific Purpose Payments and National Performance Payments. OFM has a lead role in negotiating individual agreements. See page 26
Participated on the Wages Policy Task Force, ensuring that public sector wage agreements are negotiated within guidelines set by the Government’s wages policy. See page 27
Managed the tender and selection of providers for State transactional banking and credit card services. See page 21
Monitored the State Infrastructure Strategy, and coordinated its updating and issue, consistent with the State Fiscal Strategy. See page 24
Developed a new ten year capital budgeting system using better capital project planning and monitoring arrangements to support the State Infrastructure Strategy. See page 24
Advised on, and implemented, revised arrangements for developer contributions for infrastructure. See page 25
Took part in the Performance Review Unit’s review of NSW public sector internal audit arrangements. As recommended best practice, OFM appointed an independent chair to its internal audit committee. See pages 27 and 35
Policy settings promoting a competitive State economy
Advised on the Council of Australian Government’s reform agenda which is aimed at increasing the nation’s productivity and workforce participation. From early 2008, OFM has been coordinating action with other agencies and jurisdictions. See page 29
Provided secretariat support to the Owen Inquiry into Electricity Supply in NSW, and advised the Government on its response to secure the State’s energy supply. OFM is responsible for coordinating implementation action. See page 30
Advised on taxation policy and revenue, including tax cuts effective in 2007-08. NSW’s estimated total revenue per capita ($6,759) stayed well below the average for the other States ($7,553). See page 31
Advised the Government on the terms of reference for a review of NSW taxes by the Independent Pricing and Regulatory Tribunal. The final report was due to the Government early in the new financial year. See page 31
Issued guidelines to apply private sector governance standards to the practices and procedures of government business boards. See page 32
Organisation building ensuring a values-based organisation that supports achievement of business results
Reviewed the allocation of OFM’s staff resources to ensure effective monitoring of government agencies allowing for associated risks. See page 34
Issued OFM’s new corporate plan for 2008-2011, setting our strategic direction and documenting our part in achieving State Plan priorities. See page 34
Met annual targets for operational performance including: - required efficiency targets See pages 7, 13, 33 and 35 - timely attention to correspondence and work plan projects See page 35 - staff satisfaction and involvement in the PAR Scheme See pages 33, 36 and 37.

ur
d eve
te ts eve
Mission
Results
Efficient management offinancial assets and liabilities
Balance Sheet
Promoting state resource management to achieve better public services and a stronger New South Wales economy
Strong State finances supporting the delivery and long run affordability of Policy settings promoting a competitive State economy
Government services, including State Plan priorities
Better resource allocation Sufficient and Commercial incentives and Implementation of competition,decisions linked to predictable disciplines applied by regulatory and human capitalGovernment priorities Government businesses to reforms with a focus on revenue flows ensure performance and the COAG reform program
appropriate returns ontaxpayers’ equity
A well informed Budget Sustainable investment, process incorporating sound maintenance and Improved An efficient management practices, management of arrangements and competitive appropriate incentives and clear infrastructure assets for Commonwealth tax system accountability funding
General Government Financial State Infrastructure Revenue Commercial Policy Microeconomic Reform Management Management Framework Strategy Strategy Framework Strategy
s it State Fiscal Strategy
O
nne to achi
diasul
to achi
egieg to do
NSW Treasury on a Page
Our Plawhat we hope
Our IntermeRe
what we want
Our Strathow we are goin
Our Services
p
p
p
pp
p
Advice on State Resource Managementp
Economic and fiscal strategies p Efficiency and effectiveness of public sector agencies Budget management Public sector management systems p
Infrastructure, asset management and procurement p
p Financial asset and liability management
Acting with integrity
Valuing the individual
Focusing on our stake holdersProviding leadership at all levels
Continuously learning and innovating pp
Our Values

overview of OFM’s performance in 2007-08
OFM 2007-08 Annual Report - 5
Result Indicators
Target 2003- 2004
2004- 2005
2005- 2006
2006- 2007
2007- 2008
Strong State finances supporting the delivery and long run affordability of government services
Maintaining a Triple A credit rating for NSW
Triple A Triple A Triple A Triple A Triple A Triple A
Maintaining a downward trend in General Government Sector net financial liabilities compared to GSP
< 7.5% by June 2010
< 6.0% by June 2015
8.8% 8.3% 8.7% 7.7% 8.4%
Maintaining average annual nominal growth of infrastructure spending over the medium term
Annual change
12 year
average to 2017-18 < 4.6%
na
na
na
na
na
na
16.7%
4.6%
14.1%
4.6%
Deviation of underlying actual expenses from budget
< +1% +4.4% +2.8% +0.1% +0.2% +1.8%
Keeping the Budget in surplus
Surplus Result
$1,153m $724m $1,928m $827m $73m
State superannuation liabilities on track to be fully funded by 30 June 2030
100% by June 2030
64.3% 67.2% 76.0% 79.1% 68.9%
This level and the long term trend remain consistent with achieving the 2030 target
NSW’s share of GST revenue relative to an equal per capita share
Improved NSW share
0.89117 0.86750 (review
outcome)
0.86846 0.87332 0.89079
Achieving an appropriate rate of return on equity in commercial government businesses
> 7% na 4.9% 5.0% 6.3% 6.2%
Policy settings promoting a competitive State economy
NSW’s total state revenue per capita to be less than the average for the other states
NSW <
Other States
NSW $5,913
Others $6,351
NSW $6,145
Others $6,709
NSW $6,476
Others $7,181
NSW $6,879
Others $7,572
NSW $6,759
Others $7,553
Years prior to 2007-08 include Commonwealth specific purpose “payments through the States” to local government and other bodies. These are excluded from 2007-08.
Planned results may be affected by external factors beyond the control of OFM, or government. While annual targets for result indicators are not generally applicable, the monitoring of actual data reveals progress towards the results that OFM is ultimately seeking to influence.
overview of OFM’s performance in 2007-08
6 - OFM 2007-08 Annual Report
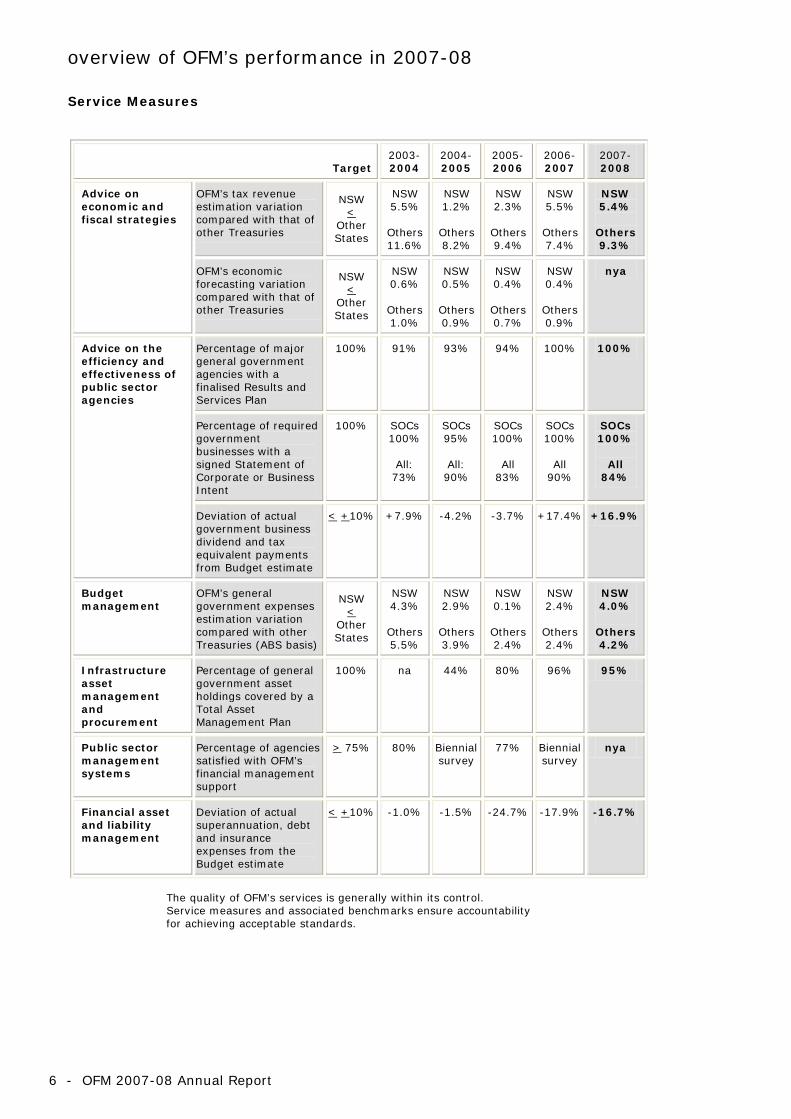
Service Measures
Target 2003- 2004
2004- 2005
2005- 2006
2006- 2007
2007- 2008
Advice on economic and fiscal strategies
OFM’s tax revenue estimation variation compared with that of other Treasuries
NSW <
Other States
NSW 5.5%
Others 11.6%
NSW 1.2%
Others 8.2%
NSW 2.3%
Others 9.4%
NSW 5.5%
Others 7.4%
NSW 5.4%
Others 9.3%
OFM’s economic forecasting variation compared with that of other Treasuries
NSW <
Other States
NSW 0.6%
Others 1.0%
NSW 0.5%
Others 0.9%
NSW 0.4%
Others 0.7%
NSW 0.4%
Others 0.9%
nya
Advice on the efficiency and effectiveness of public sector agencies
Percentage of major general government agencies with a finalised Results and Services Plan
100% 91% 93% 94% 100% 100%
Percentage of required government businesses with a signed Statement of Corporate or Business Intent
100% SOCs 100%
All: 73%
SOCs 95%
All: 90%
SOCs 100%
All
83%
SOCs 100%
All
90%
SOCs 100%
All
84%
Deviation of actual government business dividend and tax equivalent payments from Budget estimate
< +10% +7.9% -4.2% -3.7% +17.4% +16.9%
Budget management
OFM’s general government expenses estimation variation compared with other Treasuries (ABS basis)
NSW <
Other States
NSW 4.3%
Others 5.5%
NSW 2.9%
Others 3.9%
NSW 0.1%
Others 2.4%
NSW 2.4%
Others 2.4%
NSW 4.0%
Others 4.2%
Infrastructure asset management and procurement
Percentage of general government asset holdings covered by a Total Asset Management Plan
100% na 44% 80% 96% 95%
Public sector management systems
Percentage of agencies satisfied with OFM’s financial management support
> 75% 80% Biennial survey
77% Biennial survey
nya
Financial asset and liability management
Deviation of actual superannuation, debt and insurance expenses from the Budget estimate
< +10% -1.0% -1.5% -24.7% -17.9% -16.7%
The quality of OFM’s services is generally within its control. Service measures and associated benchmarks ensure accountability for achieving acceptable standards.
overview of OFM’s performance in 2007-08
OFM 2007-08 Annual Report - 7
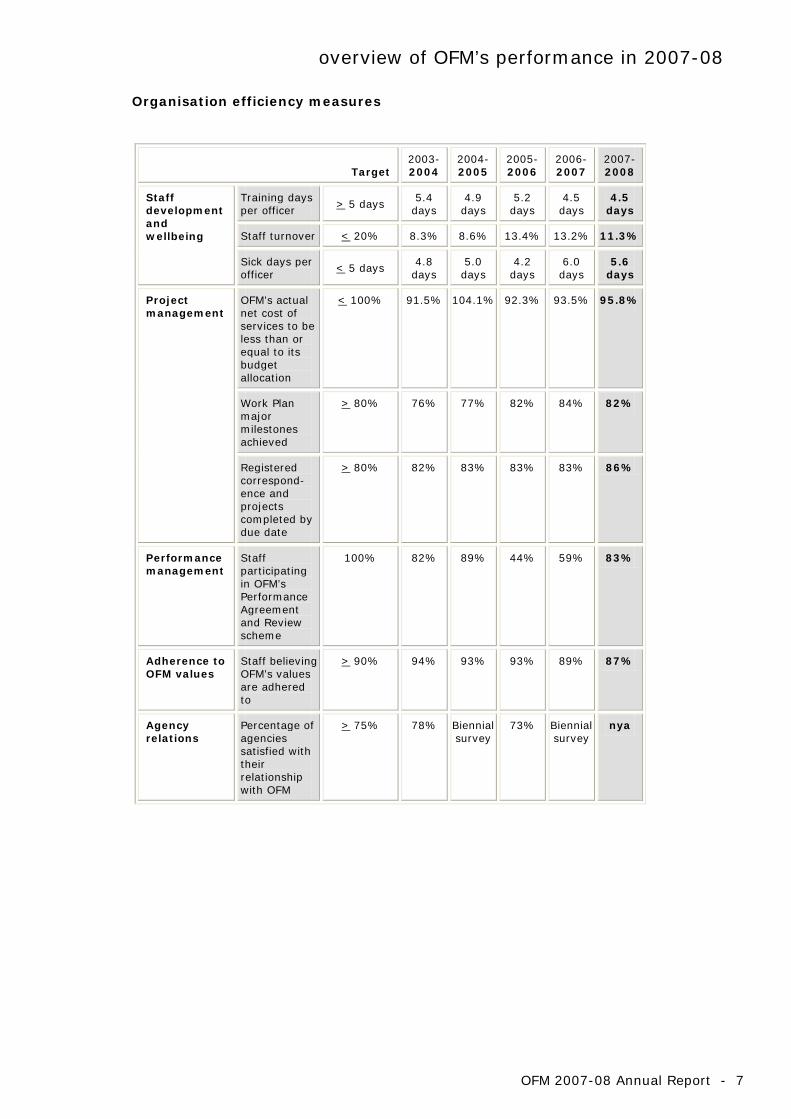
Organisation efficiency measures
Target 2003- 2004
2004- 2005
2005- 2006
2006- 2007
2007- 2008
Staff development and wellbeing
Training days per officer > 5 days
5.4 days
4.9 days
5.2 days
4.5 days
4.5 days
Staff turnover < 20% 8.3% 8.6% 13.4% 13.2% 11.3%
Sick days per officer
< 5 days 4.8 days
5.0 days
4.2 days
6.0 days
5.6 days
Project management
OFM’s actual net cost of services to be less than or equal to its budget allocation
< 100% 91.5% 104.1% 92.3% 93.5% 95.8%
Work Plan major milestones achieved
> 80% 76% 77% 82% 84% 82%
Registered correspond-ence and projects completed by due date
> 80% 82% 83% 83% 83% 86%
Performance management
Staff participating in OFM’s Performance Agreement and Review scheme
100% 82% 89% 44% 59% 83%
Adherence to OFM values
Staff believing OFM’s values are adhered to
> 90% 94% 93% 93% 89% 87%
Agency relations
Percentage of agencies satisfied with their relationship with OFM
> 75% 78% Biennial survey
73% Biennial survey
nya

organisation structure
8 - OFM 2007-08 Annual Report
FISCAL AND ECONOMIC DIRECTORATE
Advises on economic conditions and strategy, including microeconomic reform
Advises on fiscal strategy, including revenue and intergovernmental financial strategy
OFFICE OF INFRASTRUCTURE MANAGEMENT
Advises on infrastructure, asset management and procurement
Advises on the efficiency and effectiveness of public sector agencies in the property and planning sector
BUDGET AND FINANCIAL MANAGEMENT DIRECTORATE
Coordinates Budget management
Advises on public sector management systems and reform for the general government sector
Undertakes finanacial asset and liabilty management
Advises on the efficiency and effectiveness of public sector transport and ports agencies
ENVIRONMENT AND ECONOMIC SERVICES DIRECTORATE
Advises on the efficiency and effectiveness of public sector agencies in the environment and economic services sector
Advises on public sector management systems for the commercial sector
Undertakes financial asset and liability management
HUMAN AND SOCIAL SERVICES DIRECTORATE
Advises on the efficiency and effectiveness of public sector agencies in the social and human services sector
From 21 January 2008:
Supports the Secretary in overseeing OFM operational functions
A NSW Electricity Generation and Retail Project Team was established in January 2008 to coordinate OFM’s participation in the implementation of the Government’s strategy to secure the State’s energy supply. The Team is headed by Wayne Jarman who reports directly to the Secretary.
A Corporate Management Unit advises on corporate support policy and systems.
Deputy Secretary Fiscal and Economics Kevin Cosgriff
Deputy Secretary Office of Infrastructure Management Michael Schur
Deputy Secretary Budget and Financial Management Mark Ronsisvalle
Executive Director Human and Social Services Philip Mussared
Executive Director Environment and Economic Services Ian Neale
SECRETARY John Pierce

adjustments to OFM’s structure
OFM 2007-08 Annual Report - 9
Organisational Change OFM is responsible for NSW public sector procurement policy but until this year contracted the Department of Commerce to deliver procurement services. Following a review of the Service Level Agreement with Commerce, functions concerning delivery of procurement policy and project Gateway Reviews and the operation of the Major Capital Projects Reporting System were transferred to OFM on 10 September 2007. Officers involved were transferred into the Infrastructure, Asset Management and Procurement Branch of the Office of Infrastructure Management. The changes increase transparency and accountability, remove duplication and support the implementation of the long term capital budgeting process. In December 2007, the reporting arrangements for OFM’s Business Improvement Branch were changed. In recognition of its across-OFM focus, the Branch was transferred from the Budget and Financial Management Directorate and a direct reporting line established to the Senior Director, Corporate Management Unit. Individual Executive members continue to provide leadership on Business Improvement projects. Interim arrangements for OFM’s Executive were implemented in January 2008 to ensure that OFM is well positioned to address a number of emerging strategic issues: securing the State’s energy supply participating in the implementation of the reform program agreed to by
the Council of Australian Governments (COAG) on 20 December 2007 coordinating transport infrastructure planning and management. The temporary arrangements enabled the Secretary to be involved directly with these government priorities. The following action was taken: From 21 January 2008, Philip Mussared, Executive Director Human
and Social Services was allocated responsibility to support the Secretary in overseeing OFM operational functions.
Temporary acting arrangements were implemented to address Mr Mussared’s normal responsibilities. Caralee McLiesh, who joined OFM from the World Bank, acted from 21 January 2008 until 28 March 2008. Hugo Harmstorf, one of OFM’s Branch Directors, acted from 31 March 2008 until 4 July 2008.
An Electricity Generation and Retail Project Team was established to support the electricity reform, largely drawing on the staff of OFM’s Commercial Sector Performance Branch and the Energy Branch. Wayne Jarman, a previous CEO of the NSW Treasury Corporation and more recently a senior executive with the Royal Bank of Canada, was contracted from 14 January 2008 to head the Project Team.
Some rearrangement of responsibilities across OFM’s resource allocation branches took place in February and March 2008. These adjustments were made to accommodate the establishment of the Electricity Project Team and OFM’s heavy involvement in the implementation of the COAG Reform Program. The adjustment of Branch responsibilities also reflected OFM’s adoption of a risk based approach to agency monitoring. On 26 March 2008, a further meeting of COAG agreed on implementation arrangements for reforms associated with specific purpose payment arrangements and the national infrastructure program. Consequently OFM took action in April 2008 to temporarily reallocate resources and funding to the Fiscal and Economic Directorate to coordinate OFM’s direct role in negotiating new agreements.

executive performance
10 - OFM 2007-08 Annual Report
Secretary of the Treasury John Pierce B.Comm (Hons) Level 8 Remuneration $438,740
Achievements and Performance Assessment Under Mr Pierce’s leadership, the Government continued to receive sound fiscal advice from the NSW Treasury. This advice, and the financial management service provided, contributed to Triple A credit rating status again being conferred for 2007-08. The Treasury also fulfilled its responsibility to advise on the Government’s infrastructure strategy. Mr Pierce is making a leading contribution to the implementation of the COAG reform program and the strategy to secure NSW’s energy supply.
Members of the OFM Executive
Achievements and Performance Assessment OFM Executive members strongly led the application of OFM strategies. They provided capable support in overseeing OFM operations and managing stakeholder relations, allowing the Secretary to focus on Government priorities for energy sector reform and contribution to the COAG reform program. All Executive members participated in the Performance Agreement and Review Scheme and were assessed as either meeting or exceeding standards for overall performance and adherence to OFM values.
Kevin Cosgriff MA (Econ) BSc (Hons) Level 6 Remuneration $298,580
Deputy Secretary, Fiscal and Economic Played a lead role advising on policy and implementation action for the
Government’s strategy to secure the State’s energy supply; and coordinated OFM’s participation in the implementation of the COAG reform program.
Mark Ronsisvalle PSM, BEc Level 6 Remuneration $298,123
Deputy Secretary, Budget and Financial Management Advised on, and managed the process for, the development,
preparation and implementation of the NSW Budget and associated performance reporting.
Michael Schur MSc (Econ) MComm (Econ) Level 6 Remuneration $292,611
Deputy Secretary, Office of Infrastructure Management Oversighted the development and implementation of a long term
strategic capital budget system, and utilised it to update the State Infrastructure Strategy.
Philip Mussared BEc (Hons), BA, FCPA Level 6 Remuneration $298,869
Executive Director, Human and Social Services until 20 January 2008 Advised on, and monitored, funding for public sector human and social
service agencies, which account for 80% of the State Budget. from 21 January 2008 Oversighted OFM core business activity, including participation in the
implementation of State Plan priorities, and the development and implementation of OFM business improvement initiatives.
Ian Neale FCPA Level 6 Remuneration $289,543
Executive Director, Environment and Economic Services Advised on, and monitored, funding for environment and economic
service agencies, including the budget provision for the World Youth Day major event.
Executive remuneration is actual payment received based on total monetary remuneration and the value of employment benefits as per employment contracts, plus allowances for acting in higher positions. In line with public sector policy, there were no performance related incentive payments.

OFM’s people
OFM 2007-08 Annual Report - 11
OFM’s organisation building activity sets the foundation for the achievement of its planned results. This includes ensuring strong corporate processes and systems to support our staff. Ultimately though, OFM’s performance is dependent on the excellence of its people. The Human Resource Plan outlines strategies to enhance the performance and contribution of our staff. It focuses on maximising our capability with effective recruitment and staff development opportunity.
OFM’s Values
OFM is a values-driven organisation
Agreed values prescribe appropriate behaviours for our organisation and our people
Acting with integrity
Valuing the individual
Focusing on our stakeholders
Providing leadership at all levels
Continuously learning and innovating
OFM’s code of conduct OFM’s code of conduct sets ethical standards and provides guidance to staff on appropriate behaviours. Staff can access the code from OFM’s intranet. The code of conduct is based on: the public’s right to expect high levels of integrity
and competence from our staff
the Government’s right to impartial, accurate advice and prompt policy operation, and
the rights and obligations of staff. Last year, an examination of OFM’s audit and risk processes included an external review of the code. Although no major deficiencies were identified, some suggested improvements were recommended. These were taken into account and a revised code of conduct was issued early in 2007-08.
Directorate Staff
FED(69)
OIM(44)
HSSD(37)
EESD(40)
BFMD(71)
Executive and support staff are allocated across Directorates on a pro rata basis.
FED Fiscal and
Economic Directorate
BFMD Budget and Financial Management Directorate
OIM Office of Infrastructure Management
EESD Environment and Economic Services Directorate
HSSD Human and Social Services Directorate

OFM’s people
12 - OFM 2007-08 Annual Report
Staffing OFM operates with 261 equivalent full time staff members. Changes in recent years to OFM’s staff level and grade profile reflect adjustments to OFM’s responsibilities:
Establishment of SiCorp as a statutory authority and reporting on its staff number in its own annual report.
Transfer of activities from the Department of Commerce to OFM, including Gateway review and Procurement Policy.
Increased activities relate to:
the COAG reform process, including changed federal funding arrangements
the review of “Red Tape”, and
the Energy reform project. These new responsibilities required the establishment of a number of temporary positions at senior levels. OFM staff number and grades
2003- 2004
2004- 2005
2005- 2006
2006- 2007
2007- 2008
Executive 6 6 6 6 6
Branch Directors 20 20.4 19.6 19.6 21.6
Treasury Technical Officers 27 31.4 32.2 37.4 46.3
Grade 7-12 113.2 114.5 113.3 106.8 118.5
Grade 3-6 42 50.6 48 52.2 50.8
Grade 1-2 12.6 3 2.8 2.8 1.8
Clerical Officer 3/4 0 0 0 0 0
DPO 8 10 4 8 14
Indigenous Cadet 0 0 0 1 2
total 228.8 235.9 225.9 233.8 261
OFM Chief Executive and Senior Executive Officers
2003- 2004
2004- 2005
2005- 2006
2006- 2007
2007- 2008
M F M F M F M F M F
Level 8 1 - 1 - 1 - 1 - 1 -
Level 7 - - - - - - - - - -
Level 6 2 - 2 - 2 1 5 - 5 -
Level 5 2 1 2 1 2 - - - - -
Level 4 - - - - - - - - - -
Level 3 1 1 - 1 1 2 2 2 2 3
Level 2 13 5 14.8 4.6 12 4.6 12 3.6 13 3.6
Level 1 - - - - - - - - - -
total 19 7 19.8 6.6 18 7.6 20 5.6 21 6.6
OFM Staff Age Profile
0 10 20 30 40 50 60
18-24
25-29
30-34
35-39
40-44
45-49
50-54
55-59
60+
Age
Number

OFM’s budget
OFM 2007-08 Annual Report - 13
Finances Treasury‘s budget funds the operation of the Office of Financial Management (OFM) and the Office of State Revenue (OSR). In 2007-08, OFM’s total expenses of $48.12 million accounted for 23.6 per cent of total Treasury expenses (excluding administered grants). OFM’s expenses in 2007-08 were roundly $6.6 million higher that the previous year. A number of factors contributed to this increase:
The transfer of procurement policy functions from the Department of Commerce to OFM in September 2007 increased OFM’s budget by $2.7 million. The Department of Commerce budget was reduced.
In 2006-07 OFM had carried a higher than expected number of staff vacancies. This was due to the more competitive employment market, and the lead time needed to recruit staff to respond to the newly established National Reform Agenda (NRA, which was subsequently subsumed into the COAG reform program).
In 2007-08, OFM undertook a concerted recruitment drive to fill vacant positions. NRA processes slowed during the first quarter of the year due to changes at the Commonwealth level, but accelerated in the later part of the year following COAG’s agreement on a broader reform program. Consultant expenditure increased in response to the identification of critical projects. Although expenses increased, OFM operated within its budgeted net cost of services (NCOS) and met its required efficiency target. OFM underspent its budget for 2007-08 by $1.7 million. This shortfall was mainly a result of:
A carry over of the higher than normal vacancy rate from the previous year.
The lead time in fully implementing the changes associated with the transfer of procurement to OFM.
Lower than expected transition costs coming from the procurement transfer.
Less than expected expenditure on COAG activities during the first quarter of the year.
During the year approval was given to a temporary increase in OFM’s Capital Authorisation Limit to improve the utilisation of the floor space it occupies. The approved annual capital allocation of $0.35 million was supplemented with an additional $0.60 million. This capital allocation was fully expended in 2007-08. The additional investment will result in significant savings with floor space utilisation being improved by more than 10 per cent.
Treasury Expenses
OFM, $48.12M,
23.6%
OSR $155.77M,
76.4%
Benchmark <100%
% of actual NCOS to Budget
2003-2004 91.5%
2004-2005 104.1%
2005-2006 92.3%
2006-2007 93.5%
2007-2008 95.8%
Excludes $325 million for OSR First Home Owner Grants payments

OFM’s environment
14 - OFM 2007-08 Annual Report
Economic factors 2007-08 was a tale of two halves.
At the start of the year, the economic outlook for NSW was positive. Growth and final demand were expected to strengthen. By the Half-yearly Budget Review, domestic demand and employment had lifted more sharply than expected. Accordingly, forecasts were revised higher. The second half of 2007-08 saw a slowing in growth in NSW state final demand. Australia’s terms of trade continued to be boosted by rising global commodity prices, but negative influences had emerged:
The US economy slowed more than expected on the collapse of the subprime mortgage market and the problems spread through global financial markets, with significant declines in equity markets.
World oil prices surged, contributing to inflation, while reducing household disposable income.
Broader inflationary pressures emerged in the Australian economy and the RBA raised interest rates to the highest levels in over a decade.
As a result, in 2008 consumer spending growth and confidence slowed sharply, the housing construction recovery was delayed, and the broader housing market slowed. Forecasts for 2008-09 reflect the continuation of that slowing, amidst continuing global financial market instability.
Fiscal influences The 2007-08 Budget estimated a $40 million surplus1. This was revised upward to $170 million at the time of the Half-Yearly Budget Review, and further to $700 million at the time of the 2008-09 Budget, reflecting the net impact of: Increased revenue from transfer duty, payroll tax
and land tax.
Lower than expected investment income due to the significant falls in equity markets.
Upward revision of Commonwealth specific purpose payments, which increased expenses and revenues.
Upward revision of total expenses due to repayment of rail sector debt.
The final result for 2007-08 was a budget surplus of $73 million. This lower than expected surplus was due to a sharp and late slowing in transfer duty revenue, further shortfalls in investment income, and cost overruns in Health. The Budget position in 2008-09 will continue to be negatively impacted by the cyclical slowing in the economy and revenues. A major change over the last year has been higher planned capital spending. In the 2007-08 Budget, general government sector capital spending was expected to average $4.6 billion per year to 2010-11. By the 2008-09 Budget, capital spending plans had increased to an average of $5.3 billion per year to 2010-11. Response OFM advised the Government and participated in implementing its strategies to deal with the 2007-08 budgetary pressures. By year end, the following actions had been taken:
The performance management and budgeting system, which focuses on agency performance and value for money, was utilised in the annual budget process.
The Government’s wages policy was applied to moderate the growth in employee costs while maintaining past real value gains.
Efficiency dividends continued to drive productivity reforms.
Implementation started on COAG’s plan to reform Commonwealth-State funding agreements to take effect from 1 January 2009.
Agencies were required to reprioritise their budget allocations so that State Plan priorities and service delivery improvements are delivered within a budget-neutral framework.
Capital budgeting process reforms were introduced to ensure delivery of the large capital program on time and on budget - an annual Infrastructure Review was added to the budget process.
1 To facilitate comparison of budget results, the 2007-08 Budget estimate has been restated in accordance with the Australian Accounting Standard AASB 1049. The impact of this restatement is to reduce the budgeted surplus in the 2007-08 budget papers from $376 million to $40 million, and in the 2007-08 Half-Yearly Review from $506 million to $170 million.
The economic and financial environment in which OFM operates can impact on our ability to achieve the results we plan for. Matters beyond the control of OFM and government can emerge – global shocks, droughts and other natural disasters, Commonwealth Government decisions. The State Fiscal Strategy ensures the Government is well placed with a strong State balance sheet to combat such unforeseen developments. OFM advises when specific action is required to address impacts on the State’s finances.

priorities for the year ahead – 2008-09
OFM 2007-08 Annual Report - 15
Strong state finances supporting delivery and long run affordability of Government services Applying the State Fiscal Strategy to ensure appropriate service delivery and investment in infrastructure, while promoting fiscal outcomes that preserve the State’s Triple A credit rating. Utilising the Financial Management Framework for General Government agencies to link budgeting and planning and assist agencies deliver value for money programs and services:
Priority
Applying the Performance Management and Budgeting System.
Working with the Department of Premier and Cabinet and relevant agencies to implement the Government’s wages policy.
Applying and monitoring the State Infrastructure Strategy to ensure necessary public infrastructure maintenance and investment while ensuring consistency with the State Fiscal Strategy.
Priority
Implementing the long term capital budget process.
Policy settings promoting a competitive state economy Pursuing Microeconomic Reform to ensure an efficient policy and regulatory environment:
Priority
Participating in the implementation of the Council of Australian Governments’ reform program.
Advising on, and participating in the implementation of, the Government’s strategy to secure the State’s energy supply.
OFM Organisation Building Building a values-based organisation – strengthening our capability, support systems and stakeholder alliances to support the achievement of our planned results: Priority
Implementing an improved business information management system for OFM.
Conducting a biennial survey to check OFM’s adherence to our code of good practice with agencies.
OFM’s Strategic Framework The strategic framework outlined in OFM’s corporate plan will continue to provide the context for our operations. We will ensure that our services and strategies continue to target our planned results.
MISSION
RESULTS
STRATEGIES
SERVICES
ORGANISATION BUILDING
VALUES

OFM’s commitment to stakeholders
16 - OFM 2007-08 Annual Report
OFM serves the Government and the community through our main client - the Treasurer. Agreed values dictate our work philosophy and prescribe appropriate behaviours for the organisation and our people. Other major stakeholders include: Our staff
Central and line agencies and government businesses
Parliament
The Auditor-General and IPART
Rating agencies
Interest groups, media and unions
Commitment to the Community Independent and professional advice to
decision-makers Access to information
Commitment to the Treasurer
Efficient and effective administration of OFM, including successful implementation of Corporate Plan initiatives and delivery of State Plan priorities assigned to Treasury
Provision of accurate, relevant, professional and timely advice and information
Commitment to Staff
Job satisfaction, personal development and career opportunities and the ability to participate and contribute information
Strong leadership and effective management
Commitment to Agencies
Working in partnership to pursue the successful implementation of financial management reforms
Openness, mutual respect and sharing of information
OFM’s Code of Good Practice with Agencies
Regular Consultation, Openness and Courtesy
OFM meets regularly with agencies, at least quarterly with larger ones, to discuss financial and relevant issues. Agencies must give OFM timely information on all developments. OFM discusses issues with agencies before making a final decision or recommendation to the Treasurer. OFM works with agencies in planning and implementing financial management reforms. When required, consultative councils including CEOs of key agencies are set up to discuss proposed reforms and implications for agencies. Agencies' views are sought if OFM’s proposed changes affect a range of agencies. The need for teamwork, both within OFM and with other agencies, must be taken into account for all OFM’s corporate plan initiatives. Our planning methodology also requires special attention to any implementation issues for agencies. For each agency an OFM officer is designated as a single point of contact with OFM. Agencies must also establish their designated contact with OFM.
Consistent, Accurate Advice and Timely Responses
A team based approach minimises the problems arising from changes in staff dealing with an individual agency. OFM endeavours to ensure that all staff are fully trained to provide informed advice to agencies. Agency contact officers ensure prompt response to ministerial and agency letters and requests. OFM will give direct advice within 15 working days. If referred to the Treasurer, a response is likely within 20 working days. Agencies are informed if these deadlines cannot be met. Agencies should give timely responses to OFM’s reporting and data requests.
Performance Evaluation
Agencies are surveyed every two years to assess how they rate OFM’s commitment to service.
OFM’s commitment to agencies
OFM 2007-08 Annual Report - 17
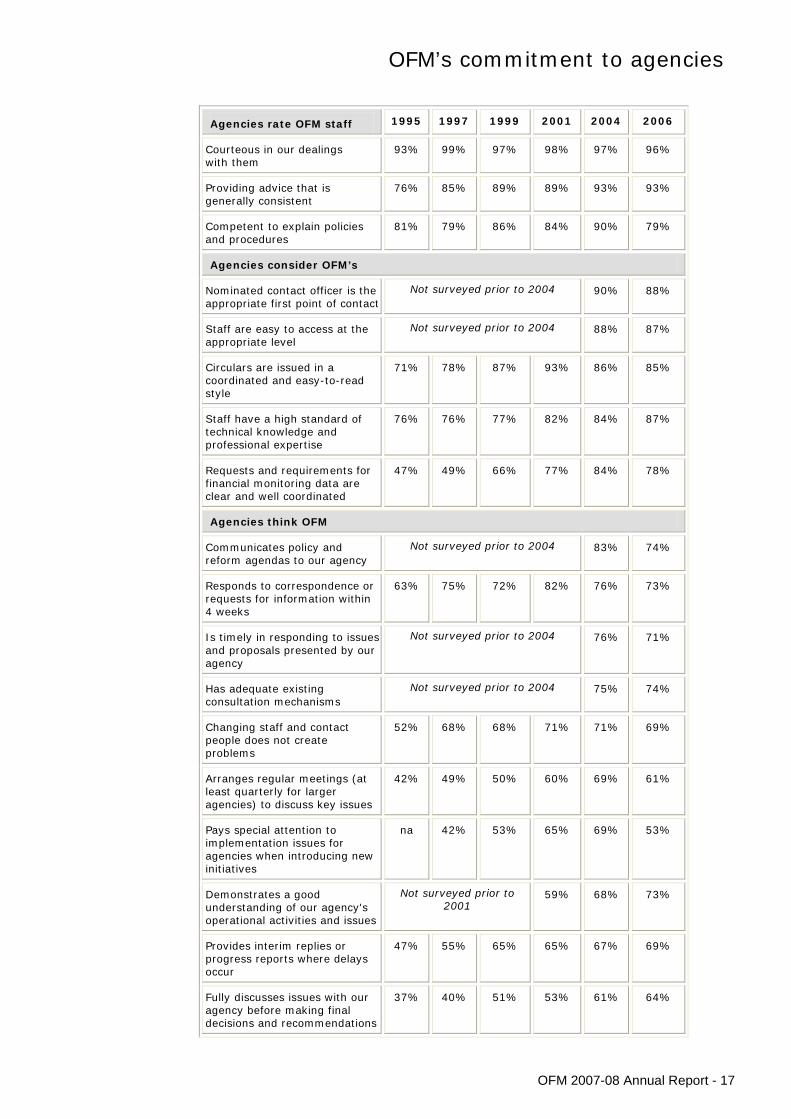
Agencies rate OFM staff 1995 1997 1999 2001 2004 2006
Courteous in our dealings with them
93% 99% 97% 98% 97% 96%
Providing advice that is generally consistent
76% 85% 89% 89% 93% 93%
Competent to explain policies and procedures
81% 79% 86% 84% 90% 79%
Agencies consider OFM’s
Nominated contact officer is the appropriate first point of contact
Not surveyed prior to 2004 90% 88%
Staff are easy to access at the appropriate level
Not surveyed prior to 2004 88% 87%
Circulars are issued in a coordinated and easy-to-read style
71% 78% 87% 93% 86% 85%
Staff have a high standard of technical knowledge and professional expertise
76% 76% 77% 82% 84% 87%
Requests and requirements for financial monitoring data are clear and well coordinated
47% 49% 66% 77% 84% 78%
Agencies think OFM
Communicates policy and reform agendas to our agency
Not surveyed prior to 2004 83% 74%
Responds to correspondence or requests for information within 4 weeks
63% 75% 72% 82% 76% 73%
Is timely in responding to issues and proposals presented by our agency
Not surveyed prior to 2004 76% 71%
Has adequate existing consultation mechanisms
Not surveyed prior to 2004 75% 74%
Changing staff and contact people does not create problems
52% 68% 68% 71% 71% 69%
Arranges regular meetings (at least quarterly for larger agencies) to discuss key issues
42% 49% 50% 60% 69% 61%
Pays special attention to implementation issues for agencies when introducing new initiatives
na 42% 53% 65% 69% 53%
Demonstrates a good understanding of our agency's operational activities and issues
Not surveyed prior to 2001
59% 68% 73%
Provides interim replies or progress reports where delays occur
47% 55% 65% 65% 67% 69%
Fully discusses issues with our agency before making final decisions and recommendations
37% 40% 51% 53% 61% 64%

Our performance in 2007-08
18 - OFM 2007-08 Annual Report
Strong State finances supporting the delivery and long run affordability of government services
Planned Results Result Indicators Outcome in 2007-08
Strong State finances supporting the delivery and long run affordability of government services, as a result of:
Maintaining NSW’s Triple A credit rating
Downward trend in general government net financial liabilities (NFL) relative to GSP
Appropriate growth in infrastructure spending
Both Moody’s and Standard and Poors confirmed the Triple A for 2007-08.
NFL relative to economic activity increased to 8.4% in 2007-08, largely due to the impact of negative investment returns on superannuation liabilities. A downward trend is forecast to resume after 2009-10.
The State’s annual capital expenditure increased by 14.1% in 2007-08. The State Infrastructure Strategy issued in June. It forecast average capital spending of 4.6% per annum during the 12 years to 2017-18.
Better resource allocation decisions linked to Government priorities
Budget to be in surplus
A surplus of $73 million was achieved in 2007-08. The original Budget forecast was for a $40 million surplus.
A well informed Budget process incorporating sound management practices, appropriate incentives and clear accountability
Percentage deviation of actual from budgeted expenses
2007-08 expenses were 1.8% higher than budgeted, after adjusting for Commonwealth ‘pass through’ funding and additional rail debt repayments. This compares with target deviation of 1% or lower, and variances of 0.2% in 2006-07 and 0.1% in 2005-06.
Sustainable investment, maintenance and management of infrastructure assets
Percentage of budget infrastructure expenditure covered by benchmark quality TAM plans
97% of Budget spending on infrastructure is determined and monitored having regard to Total Asset Management (TAM) plans.
Efficient management of financial assets and liabilities
State superannuation liabilities fully funded by 30 June 2030
The level of, and trend in, the percentage of liabilities that are funded remains consistent with full funding by 2030, as targeted by the State Fiscal Strategy.
Sufficient and predictable revenue flows
Percentage deviation of actual from budgeted tax revenue, relative to total revenue
The 2007-08 outcome for this result indicator was 2.1%, within the +3% target.
Improved arrangements for Commonwealth funding
At least maintaining NSW’s GST share relative to an equal per capita share
NSW’s relative share of GST grants slightly improved this year due to the annual update of data, including recording abolition of some State taxes. The 5 yearly fundamental review of relativities will occur in 2010.
Commercial incentives and disciplines applied by government businesses to ensure performance and appropriate returns on taxpayer equity
Rate of return on equity in commercial government businesses
The actual rate of return of 6.2% was marginally below the 7% target.
OFM 2007-08 Annual Report - 19
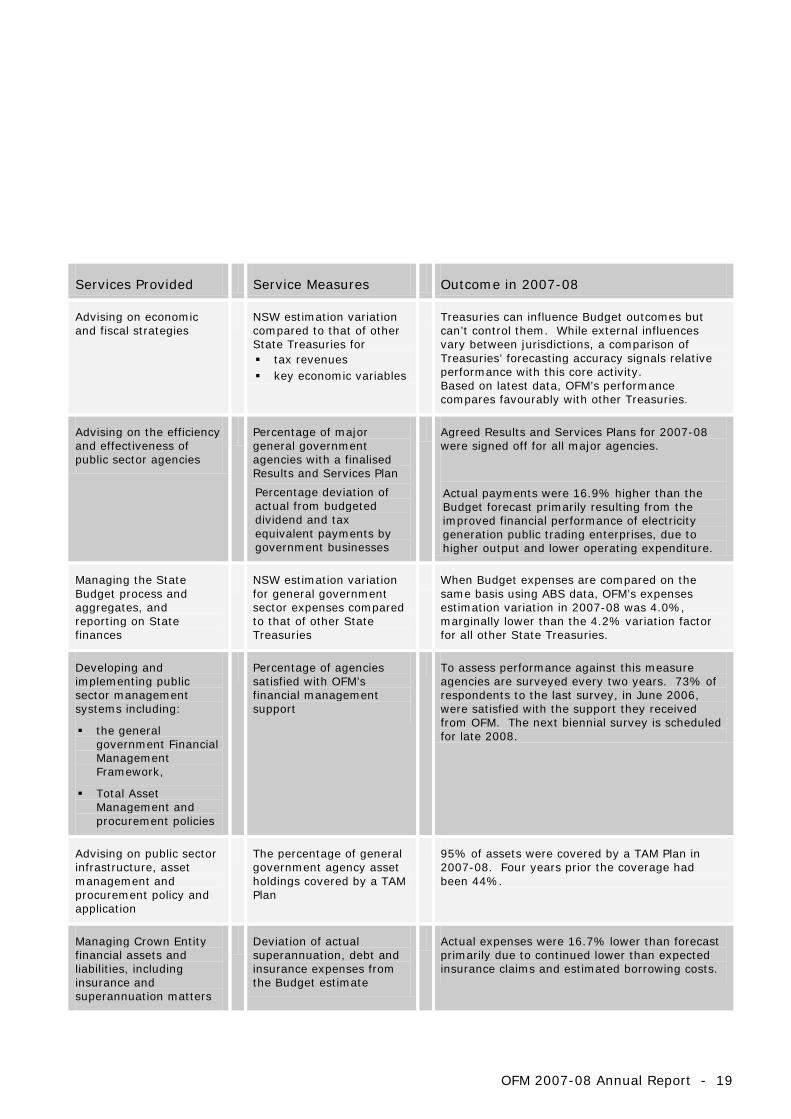
Services Provided Service Measures Outcome in 2007-08
Advising on economic and fiscal strategies
NSW estimation variation compared to that of other State Treasuries for tax revenues key economic variables
Treasuries can influence Budget outcomes but can’t control them. While external influences vary between jurisdictions, a comparison of Treasuries’ forecasting accuracy signals relative performance with this core activity. Based on latest data, OFM’s performance compares favourably with other Treasuries.
Advising on the efficiency and effectiveness of public sector agencies
Percentage of major general government agencies with a finalised Results and Services Plan
Percentage deviation of actual from budgeted dividend and tax equivalent payments by government businesses
Agreed Results and Services Plans for 2007-08 were signed off for all major agencies.
Actual payments were 16.9% higher than the Budget forecast primarily resulting from the improved financial performance of electricity generation public trading enterprises, due to higher output and lower operating expenditure.
Managing the State Budget process and aggregates, and reporting on State finances
NSW estimation variation for general government sector expenses compared to that of other State Treasuries
When Budget expenses are compared on the same basis using ABS data, OFM’s expenses estimation variation in 2007-08 was 4.0%, marginally lower than the 4.2% variation factor for all other State Treasuries.
Developing and implementing public sector management systems including:
the general government Financial Management Framework,
Total Asset Management and procurement policies
Percentage of agencies satisfied with OFM’s financial management support
To assess performance against this measure agencies are surveyed every two years. 73% of respondents to the last survey, in June 2006, were satisfied with the support they received from OFM. The next biennial survey is scheduled for late 2008.
Advising on public sector infrastructure, asset management and procurement policy and application
The percentage of general government agency asset holdings covered by a TAM Plan
95% of assets were covered by a TAM Plan in 2007-08. Four years prior the coverage had been 44%.
Managing Crown Entity financial assets and liabilities, including insurance and superannuation matters
Deviation of actual superannuation, debt and insurance expenses from the Budget estimate
Actual expenses were 16.7% lower than forecast primarily due to continued lower than expected insurance claims and estimated borrowing costs.

Strong State finances supporting the delivery and long run affordability of government services
20 - OFM 2007-08 Annual Report
State Fiscal Strategy
The State Fiscal Strategy aims to achieve fiscal outcomes for NSW that ensure the strength of the State’s balance sheet and the maintenance of NSW’s Triple A credit rating, which is a State Plan priority. Credit rating agencies have confirmed that the Fiscal Strategy is fundamental to NSW retaining the Triple A. It is also the cornerstone of OFM’s strategic framework for managing state resources. Services provided by all OFM Directorates contribute to the implementation of the Strategy. The Fiscal and Economic Directorate is the principal adviser on fiscal policy. Our Resource Allocation branches work in partnership with other agencies to ensure shared responsibility for implementation of the Fiscal Strategy. The Office of Infrastructure Management ensures infrastructure policy and systems are consistent with the Fiscal Strategy. The Budget and Financial Management Directorate contributes through its coordination of, and reporting on, the State Budget. The Fiscal Strategy focuses on maintaining the State’s net financial liabilities at levels that allow public services to be maintained and improved, and tax rates to remain competitive, in the face of economic fluctuations. The Fiscal Responsibility Act 2005 mandates the Strategy and sets medium and long-term targets for major Budget aggregates, including: reducing general government net
financial liabilities as a share of GSP to 7.5% or less by 30 June 2010, and to 6% or less by June 2015
maintaining general government underlying net debt as a share of GSP at or below its level at 30 June 2005, and
eliminating total State sector unfunded superannuation liabilities by 30 June 2030.
OFM’s Planned Action 2007-08
Monitoring progress against the medium and long term targets for major budget aggregates as set out in the Fiscal Responsibility Act 2005
OFM reported progress against the medium and long term fiscal targets in the 2007-08 Half-Yearly Budget Review in December 2007.
A further progress check was given in the 2008-09 Budget Papers, which reported: estimated surpluses in 2008-09 and
the forward years
the peaking of general government net financial liabilities as a share of GSP in 2009-10, followed by the resumption of their downward trend, consistent with the Fiscal Strategy.
OFM’s Planned Action 2007-08
Ensuring that agency efficiency dividends are achieved for 2007-08 and forward years.
The Fiscal Responsibility Act contains a number of fiscal principles directed at controlling the growth in expenses. Fiscal Principles 2 and 3 are focused
on controlling the growth in net cost of services and expenses, and public sector employee costs, in a way that is consistent with the fiscal targets.
Fiscal Principle 5 states that the budget should be framed taking into account long-term fiscal pressures.
These elements of the Fiscal Strategy will only be achieved if agencies achieve the required efficiency dividend savings. Dividend savings targets were achieved in 2007-08, as they had been in the two preceding years. Credit Rating Reviews Credit ratings indicate the soundness of an entity’s financial position. Triple A is the highest rating assessed by independent international credit rating agencies. During 2007, OFM met with international credit rating agencies, Standard & Poor’s (S&P) and Moody’s, for their annual credit rating reviews. Subsequently, S&P confirmed NSW’s Triple A rating in September 2007 and Moody’s in October. S&P said that the 2008-09 NSW Budget was consistent with the State’s existing Triple A rating. OFM will meet again with both credit rating agencies during the first half of 2008-09 as part of their annual review processes.
MISSION
Promoting state resource management to achieve better public services and a stronger NSW economy
RESULTS
Strong State finances supporting delivery and affordability of Government services
Policy settings promoting a competitive State economy
SERVICES
Advising on appropriate fiscal strategy options
Advising on the fiscal implications of industrial relations
Recommending appropriate microeconomic reforms
Recommending tax and revenue policy
STRATEGY State Fiscal Strategy
Our performance in 2007-08
OFM 2007-08 Annual Report - 21
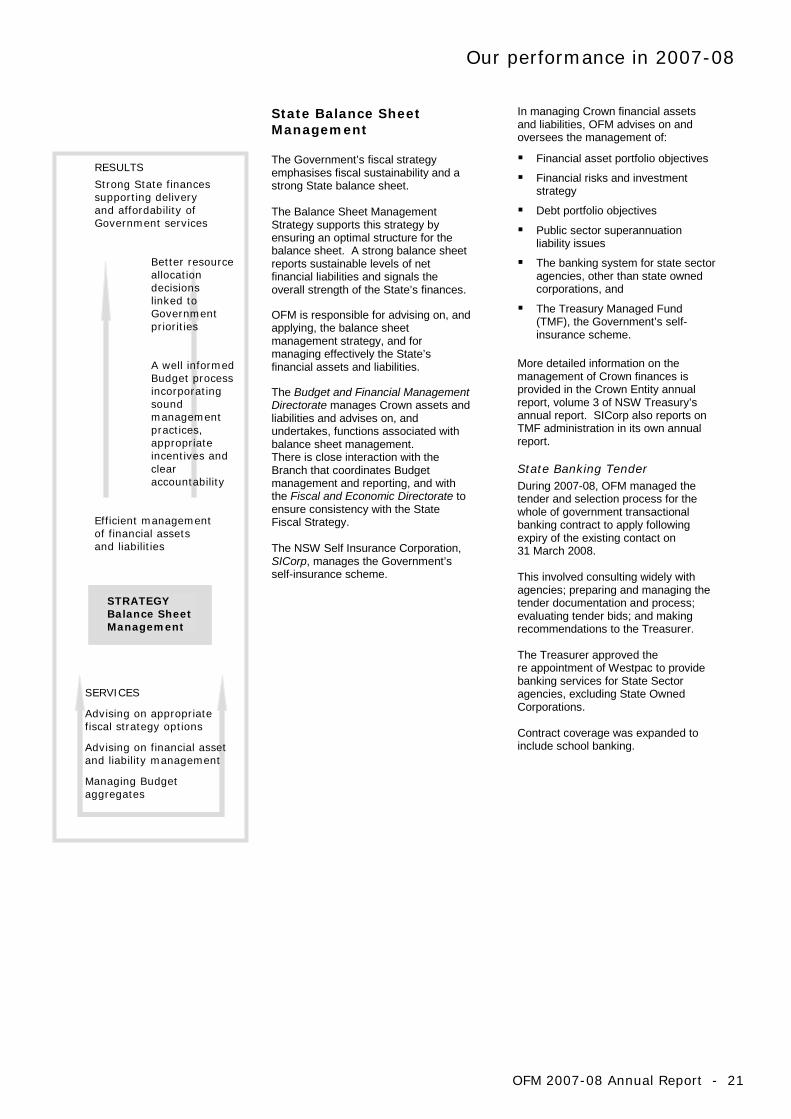
State Balance Sheet Management The Government’s fiscal strategy emphasises fiscal sustainability and a strong State balance sheet. The Balance Sheet Management Strategy supports this strategy by ensuring an optimal structure for the balance sheet. A strong balance sheet reports sustainable levels of net financial liabilities and signals the overall strength of the State’s finances. OFM is responsible for advising on, and applying, the balance sheet management strategy, and for managing effectively the State’s financial assets and liabilities. The Budget and Financial Management Directorate manages Crown assets and liabilities and advises on, and undertakes, functions associated with balance sheet management. There is close interaction with the Branch that coordinates Budget management and reporting, and with the Fiscal and Economic Directorate to ensure consistency with the State Fiscal Strategy. The NSW Self Insurance Corporation, SICorp, manages the Government’s self-insurance scheme.
In managing Crown financial assets and liabilities, OFM advises on and oversees the management of:
Financial asset portfolio objectives
Financial risks and investment strategy
Debt portfolio objectives
Public sector superannuation liability issues
The banking system for state sector agencies, other than state owned corporations, and
The Treasury Managed Fund (TMF), the Government’s self-insurance scheme.
More detailed information on the management of Crown finances is provided in the Crown Entity annual report, volume 3 of NSW Treasury’s annual report. SICorp also reports on TMF administration in its own annual report. State Banking Tender During 2007-08, OFM managed the tender and selection process for the whole of government transactional banking contract to apply following expiry of the existing contact on 31 March 2008. This involved consulting widely with agencies; preparing and managing the tender documentation and process; evaluating tender bids; and making recommendations to the Treasurer. The Treasurer approved the re appointment of Westpac to provide banking services for State Sector agencies, excluding State Owned Corporations. Contract coverage was expanded to include school banking.
RESULTS
Strong State finances supporting delivery and affordability of Government services
Better resource allocation decisions linked to Government priorities A well informed Budget process incorporating sound management practices, appropriate incentives and clear accountability
Efficient management of financial assets and liabilities
STRATEGY Balance Sheet Management
SERVICES
Advising on appropriate fiscal strategy options
Advising on financial asset and liability management
Managing Budget aggregates

Strong State finances supporting the delivery and long run affordability of government services
22 - OFM 2007-08 Annual Report
General Government Financial Management Framework The Financial Management Framework is OFM’s strategy to link budgeting and planning within the State Budget process, and in general government agencies. The Budget and Financial Management Directorate develops, and advises on the application of, the Framework and its components. The Directorate also provides guidance to our Resource Allocation Branches who assist and oversight implementation by agencies.
OFM’s Planned Action 2007-08
Developing and implementing the Performance Management and Budgeting System to ensure ongoing alignment of State Plan priorities, and delivery within the State Plan’s cost neutral framework.
Maintaining Results and Services Plans as the basis of the Performance Management and Budgeting System to achieve better resource allocation and management.
The Financial Management Framework utilises the Performance Management and Budgeting System to align the Budget with the State Plan’s priorities and to improve agency performance and value for money. Agency Results and Services Plans ensure clear accountability by specifying the results expected from the public resources allocated to the agency. The Performance Management and Budgeting System re-inforces the link between planning, budgeting and reporting – the three main elements of the performance management cycle. In 2007-08, OFM made significant progress in implementing these components.
Planning The State Plan determined the priorities for the 2008-09 Budget. All budget dependent agencies prepared a Results and Services Plan setting out the linkages between Government priorities, agency results and services, and service costs. State Plan lead and partner agencies integrated State Plan priorities and targets with their Results and Services Plans and identified links with existing agency budgets. A clear “line of sight” was established between the State Plan, Priority Delivery Plans and agency Results and Services Plans. Budgeting The State Budget process was aligned with the State Plan. An important element of the Government’s expenditure strategy is delivering State Plan priorities within a budget-neutral framework. To support this, the 2008-09 Budget process aligned with State Plan accountability structures to ensure funding of new policy initiatives was achieved by re-prioritising existing agency budgets. Agency Results and Services Plans were used to negotiate the expected level of performance to be achieved with the agreed level of Budget funding. Performance was articulated through result indicators and service measures. Reporting The structure of Results and Service Plans was applied to agency reporting in the State Budget papers to improve the reporting on the funding of Government priorities and service delivery. An agency result indicators table was added, and service groups replaced programs. These changes increase the focus on agency results and services performance, with continuing close scrutiny on the costs of service delivery. The Performance Management and Budgeting system will continue to be a foundation of the Government’s expenditure strategy during the coming year.
RESULTS
Strong State finances supporting delivery and affordability of Government services Better resource allocation decisions linked to Government priorities A well informed Budget process incorporating sound management practices, appropriate incentives and clear accountability
SERVICES
Advising on economic and fiscal strategies
Advising on the efficiency and effectiveness of general government agencies
Managing the Budget process, aggregates and reporting
Developing and implementing public sector management systems
Advising on infrastructure, asset management and procurement policy and implementation
STRATEGY Financial Management Framework

Our performance in 2007-08
OFM 2007-08 Annual Report - 23
Public Sector Financial Management and Reporting
OFM is responsible to ensure best practice accounting, financial and reporting standards in the NSW public sector. The 2008-09 Budget was presented for the first time in accordance with Australian Accounting Standard AASB 1049 Whole of Government and General Government Sector Financial Reporting. This Standard harmonises Government Finance Statistics (GFS) and Generally Accepted Accounting Principles (GAAP) into a single financial reporting format. Previously, multiple reporting formats were presented in the Budget Papers. During the coming year OFM will:
Prepare for, and implement, AASB 1049 for the Whole of Government and General Government sector for the 2008-09 Outcomes reports, including reviewing systems and policies.
Continue to participate on the inter-jurisdictional working group, including commenting on the proposals for the next stage of the AASB GFS/GAAP project, relating to individual general government sector agencies.
2002-2003
2003-2004
2004-2005
2005-2006
2006-2007
2007-2008
Target
Report on State Finances tabled on
14 Oct 29 Oct 25 Oct 27 Oct 31 Oct 26 Oct <31 Oct
Report on the Half Yearly Budget Review issued on
24 Dec 23 Dec 20 Dec 21 Dec 20 Dec 19 Dec <31 Dec
Reporting on State Finances
Accurate, informative and timely reports on the management of State finances ensure accountability for the use of public funds. OFM coordinated the NSW Budget for 2008-09, which the Treasurer, the Hon Michael Costa MLC, presented to Parliament on 3 June 2008. Monthly Financial Statements on the Budget for the year to date were prepared and issued in line with Public Finance and Audit Act requirements. The following reports issued by the required dates: The Report on State Finances for 2006-07. The Half Yearly Review of the 2007-08 NSW Budget.
Reports on NSW finances are available on OFM’s website www.treasury.nsw.gov.au.
Research and Development OFM does not undertake Research and Development activity. However, in 2007-08, in recognition of the accounting profession’s role in developing accounting standards for the public and private sectors, OFM provided a grant of $169,000 to the Australian Accounting Research and Standards Bodies. The grant was made under: Service Group 52.1: State Resource Management

Strong State finances supporting the delivery and long run affordability of government services
24 - OFM 2007-08 Annual Report
State Infrastructure Strategy The State Infrastructure Strategy (SIS) maps planned major government infrastructure across NSW over a ten year period. It provides for necessary public infrastructure maintenance and investment by linking the State Budget with longer term infrastructure plans, while ensuring consistency with the State Fiscal Strategy. OFM is responsible for applying and monitoring the SIS, a critical strategy supporting implementation of the State Fiscal Strategy.
OFM’s Planned Action 2007-08
Overseeing the implementation of the State Infrastructure Strategy
The Office of Infrastructure Management is the lead adviser on the SIS. This includes working with our Resource Allocation Branches to ensure that agencies properly apply asset management and procurement policies. This responsibility involves Advising on physical asset
management and procurement policy Assessing and monitoring major capital
investment projects Assessing proposed Privately
Financed Projects and guiding their implementation
Asset Management and the Budget
During 2007-08, OFM advised on and implemented a new 10 year capital budgeting process to strengthen the linkage of the SIS with the shorter term budget cycle. The enhanced process better allows capital planning and funding decision making to take into account the principles and parameters of the State Fiscal Strategy. OFM advised on the following elements of the new SIS budget process. Total Asset Management (TAM) Policy
was rationalised. Agencies now supply TAM data and a concise strategy, including 10 year capital plans and supporting business cases. These plans underpin the agencies’ request for capital funding.
An annual Infrastructure Review was introduced as part of the budget process. The review considers the 10 year plans of individual agencies and the aggregate capital requirements of all agencies over this period within the context of the fiscal outlook. Investment decisions take into account both the medium term demands and the fiscal constraints.
These changes assist the Government to forecast infrastructure requirements and prioritise investments. They improve the linkage between physical assets and service delivery. New Treasury Circulars issued in May 2008 to formalise the changes to the SIS budget process - TC 08/06 (TAM) and TC 08/07 (Procurement). A Policy & Guidelines paper (TPP 08-2) also issued. To further support capital planning, business case guidelines are being updated and data management systems upgraded. The new SIS budget process also informed the preparation of the biennial SIS public report, which issued in June 2008. It contains infrastructure plans and updated capital projections for the period 2008-09 to 2017-18. Procurement Policy and Practice
OFM is responsible for public sector procurement policy and its application by agencies. The Department of Commerce provides agencies with practical guidance on procurement practice and procedures. During 2007-08, action by OFM to strengthen procurement policy and practice focused on simplification of procurement policy, the Gateway review process and the monitoring of major projects. In September 2007, OFM assumed direct responsibility for procurement policy development, overseeing Gateway reviews and producing major capital project reports. These functions and the officers involved were transferred from the Department of Commerce. OFM’s direct involvement with these activities supports the new SIS budget process. The Gateway review process provides an independent assessment of capital projects at key stages of the procurement process. During 2007-08, the participation of OFM analysts as reviewers increased and agency compliance improved. The number of OFM reviewers
increased from 30 to over 40
the number of Gateway reviews significantly increased, from 48 to 74
agencies undergoing Gateway reviews doubled, from 13 to 28
agency compliance with Gateway strengthened - 67 per cent of projects listed in the 2007-08 Budget Infrastructure Statement were reviewed compared to 39 per cent the year before.
projects reviewed had an estimated total cost of $4,041 million.
RESULTS
Strong State finances supporting delivery and affordability of Government services Better resource allocation decisions linked to Government priorities A well informed Budget process incorporating sound management practices, appropriate incentives and clear accountability Sustainable investment, maintenance and management of infrastructure assets
SERVICES
Advising on economic and fiscal strategies
Advising on the efficiency and effectiveness of general government agencies
Advising on infrastructure, asset management and procurement policy and implementation
STRATEGY State Infrastructure Management
Our performance in 2007-08
OFM 2007-08 Annual Report - 25
Since 2004-05, Business Case Gateway Reviews prior to the funding decision have been mandatory for all high value, complex or innovative procurements. In 2007-08, Strategic Gateway Reviews also became mandatory for larger projects. The Gateway system is being further upgraded to support the SIS budget process. A new on-line risk assessment tool will allow agencies to assess more objectively project risk. The Major Capital Projects Reporting System was transferred to OFM in September 2007. Following a review of its role and scope, the system is being integrated into a new OFM capital planning and monitoring system which will replace a number of existing processes. These changes will improve communication and accountability for procurement outcomes. They also support the new SIS budget process. In the coming year, OFM will further update and streamline the procurement policy framework. Procurement policy and guidelines
material available to agencies will be audited – outdated and superseded material will be removed.
Guidance material on each step in the procurement process will be updated and improved.
A new web site will be developed to simplify agency access to procurement resources.
Infrastructure Development Contributions During the year, OFM was involved in the comprehensive review of development contribution policies for State and local government. The aim was to ensure a more consistent and transparent approach to development contributions. Subsequently, changes to development contributions were included in reformed planning legislation. The changes relate to the types of infrastructure that can be included in a contribution; the portion of infrastructure costs to be included in a contribution; the collection and use of contribution revenue; and arrangements for developers to provide infrastructure on behalf of Government. OFM continues to be involved in implementing the new development contribution arrangements through its representation on the Infrastructure Levy Implementation Committee.
Privately Financed Projects The Office of Infrastructure Management supports private sector delivery of public infrastructure and related services when this results in value for money outcomes. Between 2001–02 and 2007-08, about $9.5 billion worth of new public infrastructure was completed or was underway in NSW through Privately Financed Project (PFP) arrangements. In 2007-08, OFM was instrumental in procuring and negotiating a number of initiatives that involve private sector participation. Contracts were awarded for: Orange Hospital Redevelopment
and Associated Services - costing $194 million in net present value terms, an 11.6 per cent saving over traditional public sector delivery.
Colongra Gas Transportation and Storage Service Agreement - with a contract value of $70 million.
Procurements of PFPs on the market were also progressed, including the Royal North Shore Hospital Redevelopment, Stage 2. PFP contracts in construction were monitored, including the Bonnyrigg Living Communities Project; Rail Rolling Stock; Newcastle Mater Hospital Redevelopment; Long-Bay Prison and Forensic Hospitals; and New Schools Project 1 and 2. The June 2008 update of the State Infrastructure Strategy listed potential PFP projects including:
Wagga Wagga Hospital
M4 East Extension
Elements of the North West Metro and other Metro proposals, and
Intermodal Logistics facilities.

Strong State finances supporting the delivery and long run affordability of government services
26 - OFM 2007-08 Annual Report
Revenue Strategy OFM’s advice on Revenue Strategy seeks to ensure necessary revenues from taxes and charges commensurate with requirements of the State Fiscal Strategy. This will contribute to strong State finances that support the delivery and affordability of Government services. (The Revenue Strategy also aims for an efficient and competitive tax system, an element of the overall policy settings that promote a competitive State economy. Initiatives in that regard during 2007-08 are outlined in the next chapter of this report.) Transfer payments from the Australian Government account for a substantial proportion of total State revenues, so the level of Commonwealth funding received by NSW is a critical factor to be taken into account when advising on State Revenue Strategy. Planned results are necessarily constrained by the level of funding received. The Fiscal and Economic Directorate is the lead adviser on Revenue Strategy, covering advice on tax policy and revenue promotion of intergovernmental
arrangements that reflect NSW needs. Taxation Policy and Revenue
During 2007-08, OFM advised on a number of initiatives that connect with the Fiscal Strategy’s revenue requirements. In renewing the Casino Agreement with Star City Casino, new tax arrangements were negotiated to deliver higher revenues to NSW. Over the four years to 2011-12, the additional revenue from these new tax rates is estimated to be $32.7 million. The original casino exclusivity provision was extended for another 12 years from 14 November 2007. OFM reviewed the impact of Club Gaming Taxation, working with the Office of Liquor, Gaming and Racing and the Office of State Revenue on an assistance package for registered clubs that face genuine financial hardship. Subsequently, the Government announced the provision of temporary assistance for 12 months from June 2008 to clubs with a fall in gaming revenue of 15 per cent or more. OFM also modelled tax options to introduce Keno into hotels from 11 September 2007. Previously, only registered clubs and the Casino could offer Keno in NSW. (Hotels in other states offer Keno.) It is estimated that hotel Keno will provide the State Budget with $1.8 million in 2008-09 and $13 million over the forward estimates period.
Intergovernmental Financial Arrangements
In 2007-08, NSW had the lowest per capita total revenue of all the States and received the lowest level of GST grants per capita of all the States. The distribution of the GST grants is recommended by the Commonwealth Grants Commission (CGC) based on their definition of horizontal fiscal equalisation. As a result of this methodology, NSW will again be a donor state in 2008-09, contributing an estimated $2 billion to the cross subsidy to go to South Australia, Tasmania and the Territories. The CGC is currently undertaking its periodic methodology review, which is scheduled to report in early 2010. While a more fundamental review would have been preferred, NSW is participating in the review to seek a more favourable outcome for the State. In 2007-08, OFM made around 20 submissions to the CGC in response to discussion papers on assessments proposed for the 2010 review, including those for: capital expenses revenue major expenditure, such as for roads,
transport services, education and health.
As part of the 2010 Review, OFM hosted a State visit by the CGC from 31 March to 4 April 2008. Meetings were organised with chief executive officers of various NSW agencies to present the arguments and data to highlight NSW’s unique circumstances. Visits were also arranged to front line service delivery agencies, such as schools, hospitals and prisons, to demonstrate the costs faced by NSW in providing these services. Apart from the periodic methodology review, the CGC updates the distribution relativities each year for latest data and any revisions to historical data. The outcome of the annual update was released in February 2008. The impact on NSW was a relativity gain of $342 million. Specific Purpose Payments
On 26 March 2008 the Council of Australian Governments announced changes to Commonwealth-State funding. The number of Specific Purpose Payments (SPPs) is to be cut from 92 to five or six new national agreements for the delivery of core services – health, affordable housing, early childhood and schools, vocational education and training and disability services.
RESULTS
Strong State finances supporting delivery and affordability of Government services Better resource allocation decisions linked to Government priorities Sufficient and predictable revenue flows
Improved arrangements for Commonwealth funding
SERVICES
Advising on tax and revenue policy
Advising on inter-governmental arrangements
STRATEGY Revenue Strategy

Our performance in 2007-08
OFM 2007-08 Annual Report - 27
In addition, new National Partnership agreements will provide incentives for reform or funding for specific projects in areas of joint responsibility such as transport, regulation, environment, water and early childhood. During 2007-08, OFM worked with government agencies and other jurisdictions to develop: sector-specific costing and funding
models government financial reporting and
performance measurement systems to provide greater transparency and accountability, and
optimal funding solutions and agreements to support achievement of real outcomes for the community.
This work will continue in 2008-09, with reforms to be implemented by 1 January 2009. Microeconomic Reform OFM’s advice on microeconomic reform targets improved productivity for the NSW economy. This includes action to ensure the productivity of government agencies. Service Delivery Reviews OFM analysts routinely examine the financial performance of agencies as part of their monitoring of the application of the State Fiscal Strategy. Our analysts also participate in special periodic reviews of agency funding and service delivery, and often work with the agencies involved to implement resulting reforms. This includes participation in reviews undertaken by the Performance Review Unit (PRU), which was established in August 2007 to provide an augmented central agency capacity to review service delivery performance as part of State Plan accountability structures. The PRU is accountable to the Director-General of the Department of Premier and Cabinet and has a reporting relationship with the Secretary of the Treasury. It undertakes agency and/or functional area reviews; major structural reviews involving major agencies; and develops sector-wide management improvement strategies. During 2007-08, OFM participated in the PRU’s review of the Ambulance Service of NSW and a review of Internal Audit Capacity in the NSW Public Sector. We are also contributing to the reviews of Housing NSW and the Department of State and Regional Development. Reports on these reviews, which commenced in early 2008, will be finalised in the new financial year.
Public Sector Industrial Relations
OFM advises the Treasurer on strategies to reform NSW public sector working arrangements. This includes working with the Department of Premier and Cabinet to ensure that the Government’s wages policy is adhered to. Principle 3 of the Fiscal Responsibility Act, 2005 requires that: wages policy is consistent with fiscal
targets, and
in determining employment conditions, public trading enterprises take into account conditions in their industry and the Government’s wages policy.
OFM worked with the Public Sector Workforce Office (PSWO) to advise on an appropriate wages policy. In September 2007 the Government’s wages policy was issued by way of a Premier’s memorandum. A wages task force was established, comprising officers from Treasury and the PSWO. The task force advises agencies on savings reforms and wage bargaining parameters. This process has helped to ensure that employee related expenses remain consistent with the forward estimates and the State Fiscal Strategy. This requires keeping the budget impact of growth in employee costs to 2.5 per cent per annum beyond current wage agreements. In the year, a number of new agreements were concluded consistent with the wages policy.
RESULTS
Strong State finances supporting delivery and affordability of Government services Better resource allocation decisions linked to Government priorities A well informed Budget process
SERVICES
Advising on economic and fiscal strategies
Advising on the efficiency and effectiveness of general government agencies
STRATEGY Microeconomic Reform
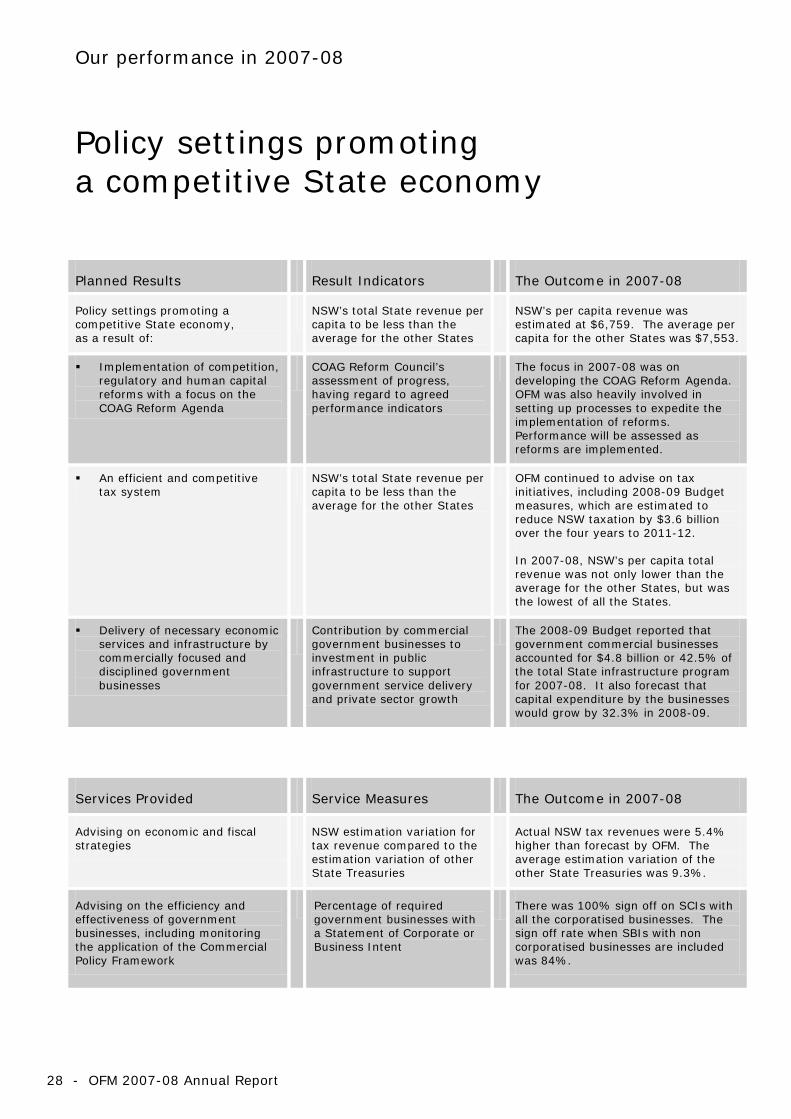
Our performance in 2007-08
28 - OFM 2007-08 Annual Report
Policy settings promoting a competitive State economy Planned Results Result Indicators The Outcome in 2007-08
Policy settings promoting a competitive State economy, as a result of:
NSW’s total State revenue per capita to be less than the average for the other States
NSW’s per capita revenue was estimated at $6,759. The average per capita for the other States was $7,553.
Implementation of competition, regulatory and human capital reforms with a focus on the COAG Reform Agenda
COAG Reform Council’s assessment of progress, having regard to agreed performance indicators
The focus in 2007-08 was on developing the COAG Reform Agenda. OFM was also heavily involved in setting up processes to expedite the implementation of reforms. Performance will be assessed as reforms are implemented.
An efficient and competitive tax system NSW’s total State revenue per
capita to be less than the average for the other States
OFM continued to advise on tax initiatives, including 2008-09 Budget measures, which are estimated to reduce NSW taxation by $3.6 billion over the four years to 2011-12. In 2007-08, NSW’s per capita total revenue was not only lower than the average for the other States, but was the lowest of all the States.
Delivery of necessary economic services and infrastructure by commercially focused and disciplined government businesses
Contribution by commercial government businesses to investment in public infrastructure to support government service delivery and private sector growth
The 2008-09 Budget reported that government commercial businesses accounted for $4.8 billion or 42.5% of the total State infrastructure program for 2007-08. It also forecast that capital expenditure by the businesses would grow by 32.3% in 2008-09.
Services Provided Service Measures The Outcome in 2007-08
Advising on economic and fiscal strategies NSW estimation variation for
tax revenue compared to the estimation variation of other State Treasuries
Actual NSW tax revenues were 5.4% higher than forecast by OFM. The average estimation variation of the other State Treasuries was 9.3%.
Advising on the efficiency and effectiveness of government businesses, including monitoring the application of the Commercial Policy Framework
Percentage of required government businesses with a Statement of Corporate or Business Intent
There was 100% sign off on SCIs with all the corporatised businesses. The sign off rate when SBIs with non corporatised businesses are included was 84%.
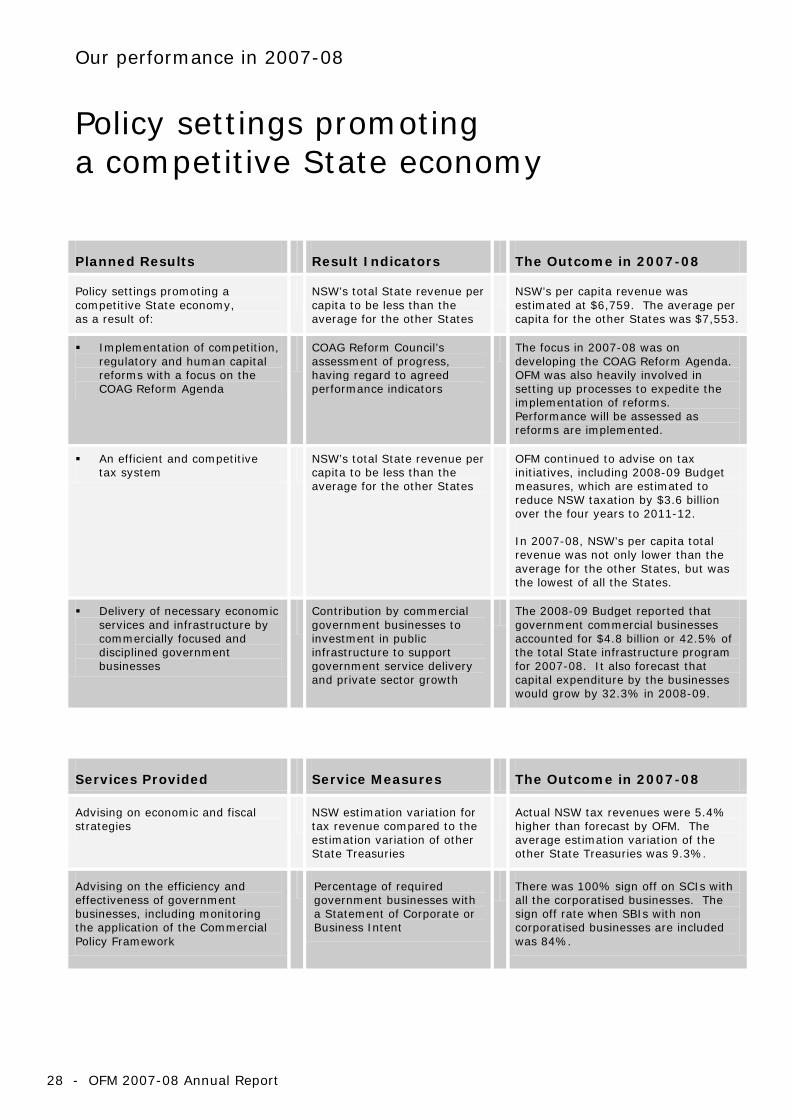
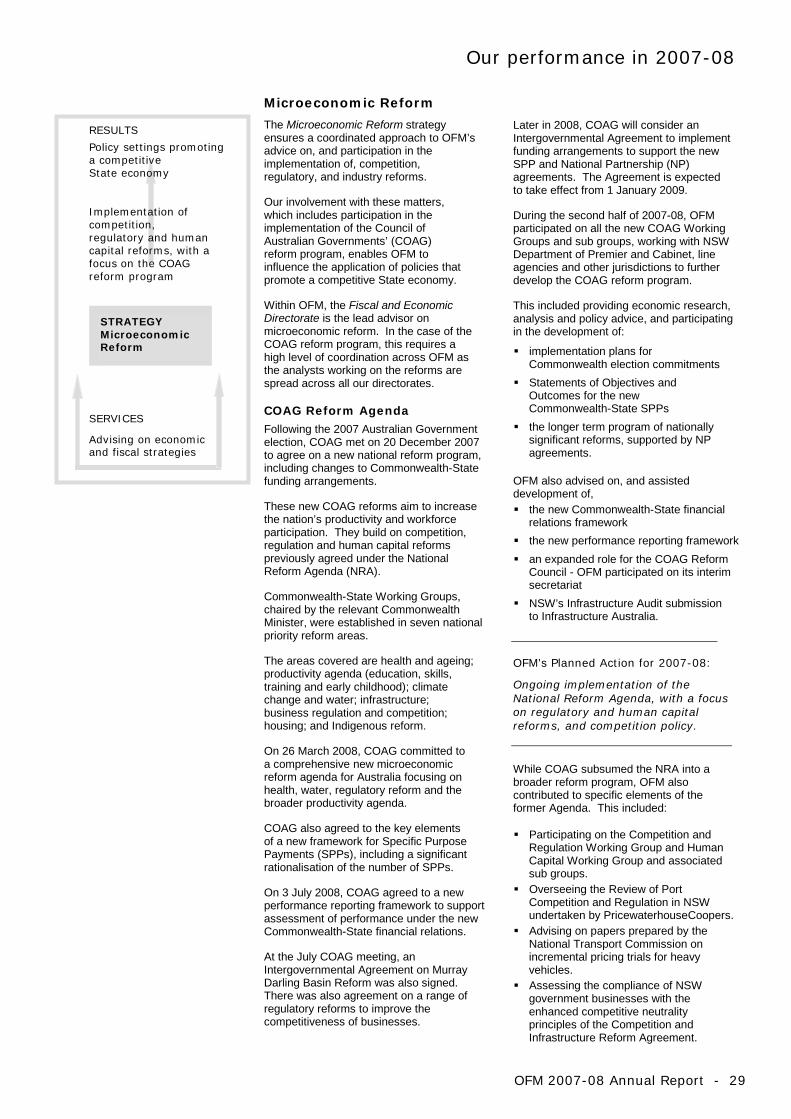
Our performance in 2007-08
OFM 2007-08 Annual Report - 29
Microeconomic Reform
The Microeconomic Reform strategy ensures a coordinated approach to OFM’s advice on, and participation in the implementation of, competition, regulatory, and industry reforms. Our involvement with these matters, which includes participation in the implementation of the Council of Australian Governments’ (COAG) reform program, enables OFM to influence the application of policies that promote a competitive State economy. Within OFM, the Fiscal and Economic Directorate is the lead advisor on microeconomic reform. In the case of the COAG reform program, this requires a high level of coordination across OFM as the analysts working on the reforms are spread across all our directorates. COAG Reform Agenda Following the 2007 Australian Government election, COAG met on 20 December 2007 to agree on a new national reform program, including changes to Commonwealth-State funding arrangements. These new COAG reforms aim to increase the nation’s productivity and workforce participation. They build on competition, regulation and human capital reforms previously agreed under the National Reform Agenda (NRA). Commonwealth-State Working Groups, chaired by the relevant Commonwealth Minister, were established in seven national priority reform areas. The areas covered are health and ageing; productivity agenda (education, skills, training and early childhood); climate change and water; infrastructure; business regulation and competition; housing; and Indigenous reform. On 26 March 2008, COAG committed to a comprehensive new microeconomic reform agenda for Australia focusing on health, water, regulatory reform and the broader productivity agenda. COAG also agreed to the key elements of a new framework for Specific Purpose Payments (SPPs), including a significant rationalisation of the number of SPPs. On 3 July 2008, COAG agreed to a new performance reporting framework to support assessment of performance under the new Commonwealth-State financial relations. At the July COAG meeting, an Intergovernmental Agreement on Murray Darling Basin Reform was also signed. There was also agreement on a range of regulatory reforms to improve the competitiveness of businesses.
Later in 2008, COAG will consider an Intergovernmental Agreement to implement funding arrangements to support the new SPP and National Partnership (NP) agreements. The Agreement is expected to take effect from 1 January 2009. During the second half of 2007-08, OFM participated on all the new COAG Working Groups and sub groups, working with NSW Department of Premier and Cabinet, line agencies and other jurisdictions to further develop the COAG reform program. This included providing economic research, analysis and policy advice, and participating in the development of:
implementation plans for Commonwealth election commitments
Statements of Objectives and Outcomes for the new Commonwealth-State SPPs
the longer term program of nationally significant reforms, supported by NP agreements.
OFM also advised on, and assisted development of, the new Commonwealth-State financial
relations framework the new performance reporting framework an expanded role for the COAG Reform
Council - OFM participated on its interim secretariat
NSW’s Infrastructure Audit submission to Infrastructure Australia.
OFM’s Planned Action for 2007-08:
Ongoing implementation of the National Reform Agenda, with a focus on regulatory and human capital reforms, and competition policy.
While COAG subsumed the NRA into a broader reform program, OFM also contributed to specific elements of the former Agenda. This included: Participating on the Competition and
Regulation Working Group and Human Capital Working Group and associated sub groups.
Overseeing the Review of Port Competition and Regulation in NSW undertaken by PricewaterhouseCoopers.
Advising on papers prepared by the National Transport Commission on incremental pricing trials for heavy vehicles.
Assessing the compliance of NSW government businesses with the enhanced competitive neutrality principles of the Competition and Infrastructure Reform Agreement.
RESULTS
Policy settings promoting a competitive State economy
Implementation of competition, regulatory and human capital reforms, with a focus on the COAG reform program
SERVICES
Advising on economic and fiscal strategies
STRATEGY Microeconomic Reform

Policy settings promoting a competitive and sustainable State economy
30 - OFM 2007-08 Annual Report
Climate Change
OFM’s involvement with the COAG reform program includes membership of its Working Group on Climate Change and Water. We also advise on climate change and energy efficiency matters more generally. This year OFM advised on:
an emissions trading scheme to achieve national emission reduction targets
NSW’s energy efficiency strategy sustainability policy and climate
change-related impact modelling. OFM also coordinated the NSW submission in response to the Garnaut Review’s Emissions Trading Scheme Discussion Paper.
Internal Government Red Tape Review
In 2007, NSW government agencies implemented the reforms recommended in Stage 1 of the Internal Government Red Tape Review. Those reforms, such as reduced frequency of reporting and exemptions for small agencies, will significantly reduce the reporting burden on agencies. Stage 2 of the review involves a more intensive examination of certain regulatory policies and the impact they have on agency activities. This stage is concerned with reducing the compliance burden on agencies by removing unnecessary or duplicative requirements, and improving the efficiency of other regulatory requirements. OFM’s Planned Action for 2007-08:
Continuing participation in red tape reviews to reduce the burden on both government and private sector organisations. During 2007-08, reviews on heritage requirements, equal employment policy, ethnic affairs policy and ports were completed. Work commenced on reviewing requirements in the following areas: information security privacy aboriginal heritage threatened species planning procurement policy occupational health and safety policy environmental and other planning annual reporting shared corporate services.
Energy Sector Reform
The NSW Government continues to work with other jurisdictions, through the COAG Ministerial Council on Energy (MCE), to progress national reform of the gas and electricity markets. OFM is a key advisor in this process. During 2007-08, OFM:
worked with other jurisdictions to finalise, through the MCE, the rules for national economic regulation of electricity distribution, which commenced on 1 January 2008.
drafted legislative amendments to transfer responsibility for economic regulation of electricity distribution from IPART to the Australian Energy Regulator (AER), which took effect on 1 January 2008.
finalised the National Gas Law, and rules to improve the gas access regulatory regime and transfer responsibility for the economic regulation of gas distribution from IPART to the AER.
In May 2007, the NSW Government appointed Professor Anthony Owen to inquire into the State’s future energy needs. OFM worked closely with the Department of Premier and Cabinet, and the Department of Water and Energy to assist with the Inquiry. The Owen report, the Inquiry into Electricity Supply in New South Wales was released on 11 September 2007. The main finding was that NSW needs to be prepared to add baseload generation capacity by 2013-14 with private sector involvement. On 10 December 2007, the Government said that it would accept Professor Owen’s key recommendations. It announced the intention to lease existing State-owned generators and move electricity retail activities to the private sector. Power stations and the electricity distribution network would remain in public ownership. A Consultative Reference Committee was established to provide for further consultation with stakeholders. OFM provided technical advice to the Committee during its deliberations. Parliament determined that the Auditor-General should review and report on certain aspects of the Government’s strategy. OFM will continue to advise on achievable and effective action to secure NSW’s energy supply. Expert advisors will assist with implementation and OFM will work closely with them to ensure the Government’s objectives are met.

Our performance in 2007-08
OFM 2007-08 Annual Report - 31
Revenue Strategy One of the main objectives of the Revenue Strategy is for NSW to have a tax system that is efficient and competitive, key requirements for a competitive State economy. The Fiscal and Economic Directorate is the lead adviser on Revenue Strategy, and works in consultation with our Resource Allocation Branches to balance the contribution from taxpayers, users of government services, and dividends and tax equivalents paid by commercial government businesses. OFM advises the Government on tax policy, mindful of the State Fiscal Strategy’s requirements for:
sufficient revenue to achieve appropriate Budget results, and
tax restraint to minimise the burden on NSW taxpayers.
The States primarily fund their services from two sources – State taxes and Commonwealth grants. In 2007-08 NSW had the lowest per capita total revenue of all the States. NSW relies on Commonwealth funding for 42 per cent of its revenues, which is among the lowest of all States. In 2007-08, NSW received the lowest GST grant per capita. In 2008-09, NSW will receive an estimated $2 billion less in grants than will be generated by activity in the State. The GST distribution arrangements require NSW to rely on its own taxes more than a number of the other States. Subject to this constraint, OFM provides tax policy advice to make NSW State taxes as competitive as possible. A number of tax measures were announced in the 2008-09 Budget, helping to reduce taxation in NSW by $3.6 billion over the four years to 2011-12. Transfer Duty
The abolition of transfer duty on non-land business assets was brought forward 18 months, to apply from 1 January 2011. This will put NSW’s tax arrangements for businesses on a competitive footing with other States and Territories. The accelerated abolition of this duty will reduce revenue by $88 million in 2010-11, and by $182 million in 2011-12. Payroll Tax Annual indexation of the payroll tax free threshold was introduced, linked to movements in the Sydney CPI. The threshold to apply from 1 July 2008 was lifted to $623,000.
The phased reduction of the payroll tax rate was also announced. From 1 January 2009 the rate will fall from 6 per cent to 5.75 per cent. It will fall further to 5.65 per cent from 1 January 2010, and again to 5.5 per cent from 1 January 2011. These lower rates improve the competitiveness of NSW payroll tax, particularly with the neighbouring states of Victoria and Queensland. The NSW rate will be in the mid range of all states’ rates. The reduction in payroll tax rate will reduce revenue by an estimated $114 million in 2008-09, rising to $644 million in 2011-12. Total cost to revenue over the four years to 2011-12 is $1.6 billion. OFM’s Planned Action for 2007-08:
Implementing payroll tax harmonisation with other States to further simplify requirements for business.
From 1 July 2007, harmonised payroll tax arrangements were introduced between NSW and Victoria. The NSW Payroll Tax Act 2007 and Victorian legislation provide for highly harmonised arrangements - 101 sections out of 106 are virtually identical. Both States maintain the discretion to set their own tax rates and tax-free thresholds. Work continued on administrative harmonisation during the year. The Tax Commissioners of Victoria and NSW agreed on a protocol to govern the management and maintenance of administrative harmonisation. IPART Review of State Taxation
In August 2007, the Premier asked the Independent Pricing and Regulatory Tribunal (IPART) to advise on options to make NSW taxes simpler, more efficient and more competitive. An OFM staff member was seconded to assist IPART. OFM advised on the technical operation of state taxes, including their impact on economic activity. In June 2008, IPART submitted its draft Review of Taxation report to the Treasurer. It contained 28 recommendations for reforming state taxes. The Government agreed in principle to a number of the recommendations, including the reduction of payroll tax, which had already been announced. Other recommendations are to be referred to the review of Australia’s Future Tax System, which was announced by the Australian Government when IPART was well into its review.
RESULTS
Strong State finances supporting delivery and affordability of Government services
Policy settings promoting a competitive State economy
Better resource allocation decisions linked to Government priorities
Sufficient and predictable revenue flows
An efficient and competitive tax system
SERVICES
Advising on economic and fiscal strategies, including tax and revenue policy
STRATEGY Revenue Strategy

Policy settings promoting a competitive and sustainable State economy
32 - OFM 2007-08 Annual Report
Commercial Policy Framework The Commercial Policy Framework applies the disciplines faced by the private sector to government businesses. The Framework seeks to strengthen the State’s finances through high performing government businesses, while safeguarding the state and taxpayers’ investment in these enterprises. The Framework promotes competitiveness and efficient allocation of the State’s resources, by ensuring a level playing field between government and private sector businesses. Within OFM, the Environment and Economic Services Directorate advises on the application of the Commercial Policy Framework. The Directorate works closely with our resource allocation branches which monitor the performance of the individual businesses and advise the shareholding ministers (including the Treasurer). The Framework consists of a suite of policies to guide the governance and operation of government businesses. The areas covered include Financial Distribution Policy, Capital Structure Policy, Reporting and Monitoring Policy, Government Guarantee Fee Policy, Tax Equivalent Policy and Social Program Policy. During 2007-08, OFM issued updated guidance on the following components: In July 2007, new Financial Appraisal
Guidelines issued, reflecting current asset management and procurement policy requirements.
Also in July, a new edition of the Treasury Management Policy issued, reflecting new accounting standards and changes to the Public Authorities (Financial Arrangements) Act 1987. It also clarifies agency treasury management risk identification and methods for mitigating exposures.
In November 2007, Guidelines for Boards of Government Businesses issued, outlining the private sector corporate governance standards that are most appropriate for the practices and procedures of the boards of government businesses.
The Financial Distribution Policy for Government Businesses will be reviewed during the coming year. Papers outlining the individual policies of the Commercial Policy Framework are available from Treasury’s web site.
Government Commercial Activities OFM applies the principles of the Commercial Policy Framework when advising on, and participating in, the major initiatives and reforms of government businesses. OFM’s involvement with the reform of the energy sector is outlined earlier in this chapter. OFM was also involved with action to support the operations of Forests NSW. Following Government approval, Forests NSW called for expressions of interest to collaborate in developing marketing products for investment in plantation. The aim is to assist Forests NSW meet its future wood supply commitments given that its replanting program has been affected by bushfire and drought. With Forests NSW, the Department of Premier and Cabinet, and an independent probity advisor, OFM oversighted the EOI process and assessed submissions received. With other agencies, OFM also advises on and monitors action to secure Sydney’s water supply. During the year OFM participated on the Metropolitan Water Plan steering group and the project control group for the desalination plant. OFM advised on the determination of Sydney Water prices by the Independent Pricing and Regulatory Tribunal. OFM participated on the project control group for the Tillegra Dam project to secure the water future of the Lower Hunter and the Central Coast regions.
RESULTS
Strong State finances supporting delivery and affordability of Government services
Policy settings promoting a competitive State economy
Sufficient and predictable revenue flows
Commercial incentives and disciplines applied by Government businesses to ensure performance and appropriate returns on taxpayers’ equity
SERVICES
Advising on economic and fiscal strategies
Advising on the efficiency and effectiveness of government businesses
Advising on, and implementing, public sector management systems
Coordinating the reporting of public sector finances
STRATEGY Commercial Policy Framework

Our performance in 2007-08
OFM 2007-08 Annual Report - 33
Building a values-based organisation that supports the achievement of our planned business results Strengthening our capability, support systems and stakeholder alliances
Our Focus Efficiency Indicator The Outcome in 2007-08
Applying our values Staff believing that OFM’s values are adhered to
Staff satisfaction
87% of staff responding to our quarterly staff surveys consider that OFM’s agreed values are being applied.
90% of staff responding to the quarterly surveys were satisfied with OFM, and 93% were satisfied with their job.
Strengthening support systems
Work plan milestones achieved
Correspondence and requests completed by the due date
82% of priority project milestones scheduled in our work plans for the year were completed.
86% of registered correspondence and other action items were attended to within deadline.
Building our capability Number of training days per officer
Staff turnover
Staff participating in OFM’s performance and development scheme
Each staff member averaged 4.5 days training, similar to 2006-07 results but marginally below the 5 day target.
Staff turnover rate was 11.3%, well within the acceptable target. This included officers promoted to other parts of the public sector.
83% of staff took part in our Performance Agreement and Review scheme, a big increase on 59% in 2006-07, and 44% in 2005-06.
Fostering stakeholder alliances
Agencies satisfied with their relationship with OFM
Agencies satisfied with OFM’s financial management support
The last biennial survey of agencies was in June 2006, when 73% of responding agencies expressed satisfaction with OFM, and 77% believed our financial management support is helpful. The target is 75% or more. Agencies will be resurveyed in late 2008.

Organisation Building
34 - OFM 2007-08 Annual Report
Organisational Efficiency OFM’s planning system aims to ensure that our business objectives or planned results are clear and that our officers can see the contribution that they are making. We stress the importance of strong supporting corporate processes and systems. The Corporate Plan outlines our strategic management framework. It documents our mission, the results we seek to influence and the strategies we apply to maximise the impact of our services. Results indicators allow progress toward our planned results to be monitored. Service measures report on the standard of our services. The framework is reflected in the Treasury on a Page document which maps the contribution OFM services and strategies make to the achievement of our planned results and mission. Our contribution to the State Plan is also demonstrated.
OFM’s Planned Action 2007-08:
Issuing a new OFM corporate plan.
In March 2008, to mark the beginning of a new three year planning cycle, the Secretary launched OFM’s new Corporate Plan. This Plan sets OFM’s strategic direction for the three years to 2011. The new Plan reflects the re-presentation of OFM’s strategic framework following its review in mid 2007 by the Planning Coordination Committee, and its subsequent endorsement by the OFM Executive Board and the Treasurer. The new plan also reflects some revisions to OFM’s result indicators and performance measures. The Corporate Plan sets the framework, and provides a clear line of sight, for all our planning and performance management documentation, from the State Plan to individual performance agreements. During 2007-08, updated versions of the following issued:
Results and Services Plan
State Plan priority delivery plans
Directorate and Branch work plans
Officer performance agreements - including for the Secretary, Executive members, Branch managers and all other staff members.
OFM’s internal and external performance reports, including this annual report and State Budget Paper 3, reflect the structure of the Corporate Plan.
Business Improvement In late 2006, OFM began implementing a Business Improvement Program that aims to ensure the best use of our people, systems and technology. Initiatives under this program include Investigating improved business
information management systems. Using business intelligence tools to
improve data and analysis and, over time, agency data inputs.
Clarifying the roles and responsibilities of the Executive and Branch managers.
Developing a strategy to improve the clarity and relevance of OFM’s advice, maximising the use of evidence.
Taking risk factors into account to ensure effective monitoring of agencies and best use of our limited resources.
Branch work plans to assist the planning, resourcing and monitoring of projects and performance management.
Better using regular management reports to monitor operational performance, including performance management action, recruitment action, leave management, and spending on consultants.
OFM’s Planned Action 2007-08:
Continuing the OFM business improvement program.
There was further progress with the business improvement initiatives designed to improve the content base for OFM economic and financial analysis. Major briefing templates were redesigned to improve the focus on key points and relevant data, and to provide greater capacity to canvas options. Updated guidance material on analysing economic, financial and policy issues was developed, drawing on academic research and other sources. Training was delivered to strengthen skill in developing and structuring reasoned conclusions. A gradual roll-out of updated business intelligence technologies was also commenced to enhance the ability to analyse and present information from OFM’s core financial data base. The collection and analysis of non-financial data will also be improved, including key performance information such as indicators now included in the annual Budget papers. The trial of a more risk based approach to monitoring agencies was also commenced in one of OFM’s resource allocation branches.
MISSION RESULTS STRATEGIES SERVICES
Ensuring OFM’s organisational efficiency with strong corporate procedures and systems that support management and staff.
ORGANISATION BUILDING Organisational Efficiency

Our performance in 2007-08
OFM 2007-08 Annual Report - 35
Insurance OFM has insurance cover over all its assets and major risks. Insurance policies for workers compensation cover, building contents, computer equipment, motor vehicles and public liability are in place with the Government’s self insurance scheme, the Treasury Managed Fund (TMF). The TMF premium incentive scheme encourages effective risk management. Agencies that manage risk well receive lower premiums. Those with poor risk management are penalised. OFM seeks lower premiums by reducing its operational risks. Workers’ compensation risks are managed with early intervention, workplace inspections and active rehabilitation.
Performance Review and Risk Management
OFM has an Audit and Risk Committee to: oversee the internal audit function,
risk management, corporate governance and other internal assurance processes that operate within OFM
assess risks arising from OFM’s operations and the adequacy of measures to moderate those risks
ensure the integrity of external financial reporting
ensure appropriate management reporting.
The performance reviews oversighted by the Committee include audits of key activities and functions as scheduled in an annual Audit Plan. The areas to be audited are determined based on their exposure to potential financial or operating risk. Staff can access the Audit and Risk Committee charter from OFM’s intranet. The Committee has nine members - 2 independents (one of whom is the Chair), 3 members of OFM’s Executive, and 4 Branch Directors who represent operational areas of OFM. A review of Internal Audit Capacity in the NSW Public Sector, undertaken by the Performance Review Unit (PRU) during the year, recommended that public sector audit and risk committees should have an independent chair. OFM was a member of the steering and working groups for this review. OFM’s Deputy Secretary, Operations is also chairing its implementation committee.
OFM moved quickly to ensure best practice by its own Audit and Risk Committee and appointed an independent Chair, Mr Jim Mitchell, former Deputy NSW Auditor-General. Mr Mitchell chaired his first meeting on 2 May 2008. (Provision for the other independent member had been actioned in 2004.) The Committee met on 9 occasions during 2007-08. As well as Committee members, meetings were attended by observers from the Audit Office; the Internal Audit Bureau (IAB), which OFM contracts to carry out internal audits; and other OFM Directors who are responsible for areas subject to review. The Committee considered a number of significant matters, including a review and update of its own charter following the PRU review of public sector internal audit arrangements. Other matters dealt with concerned: OFM’s Internal Audit Plan for 2007-08
Preparation of the 2006-07 total State Sector Accounts
Valuation of Crown land reserves
Crown entity asset and liability risk management
OFM’s policy and procedures. The following internal audit reviews were considered:
SiCorp’s management of third party providers
Crown entity financial system internal controls
Electronic funds transfer and internet banking
Project management for the upgrade of OFM’s financial information system
Effectiveness of State Budget management processes
OFM’s process for procuring consultants and contractors.
Audit findings were generally satisfactory. Recommendations to improve performance and processes, and management responses to them, are documented in a Risk Register that is monitored by the Committee. In 2008-09, the Committee will review and update OFM’s risk register and use it to determine the scheduling of internal audit reviews.
Project Management Performance
2003-2004
Actual
2004-2005
Actual
2005-2006
Actual
2006-2007
Actual
2007-2008
Actual
Target
Scheduled work plan project milestones achieved
76% 77% 82% 84% 82% >80%
Correspondence or projects completed by due date
82% 83% 83% 83% 86% >80%
Average days late correspondence or projects completed late
8 days
10 days
16 days
11 days
7 days
<10 days

Organisation Building
36 - OFM 2007-08 Annual Report
Staff Development
OFM provides customised in-house training programs to meet the needs of our officers. This approach is cost effective and allows realistic case studies and scenarios to be included. When required, OFM works with external providers to support staff development. During 2007-08, OFM staff attended 324 courses covering 179 different programs, with 64 of these programs conducted in-house. The remaining programs and conferences were conducted by other government agencies and the private sector. Staff were able to self select their participation in training. OFM’s training program continues to emphasise the importance of writing skill. During 2007-08,
An OFM style guide was developed to guide staff on correct language and punctuation, and other elements of good writing.
New writing templates were developed to support the provision of evidence based advice - by June 2008, 70% of staff had been trained to use the templates, which will be used from August 2008.
A revised writing skills course will be rolled out in 2008-09. It will incorporate the new templates and the style guide, which will be revised to take into account its use during the past 6 months. Other initiatives were implemented.
“Hot topic” seminars were introduced in response to feedback provided from our 2007 staff opinion survey. Staff nominate and present topics, allowing others to benefit from their knowledge and experience.
Taking into account OFM’s agreed corporate values, an Ethics in Practice course was developed with the NSW Division of the Institute of Public Administration Australia and provided to new starters and other OFM officers.
The Certificate IV in Government was again offered to staff, and for the first time the Certificate IV in Records Management.
Local, interstate and overseas secondments are another development option for OFM staff. Under a partnership arrangement, an officer from the United Kingdom Civil Service was seconded for 6 months to OFM’s Fiscal Strategy Branch. Under a similar arrangement, an OFM officer was seconded for 4 months to learn about the budget system and processes of the Ontario Ministry of Finance, Canada. Performance Appraisal and Review (PAR) OFM’s PAR scheme ensures that managers and staff are agreed on goals to be achieved and the support required, and that performance feedback is given. In recent years, to support higher compliance, the PAR cycle was revised to remove conflicts with key work periods. PAR participation is listed as a key deliverable of all managers. In 2007-08, 83% of staff participated. Two years prior the participation rate was only 44%. Recruitment Effectiveness Effective recruitment is crucial for OFM to maintain a strong staff base. In 2007-08, the graduate program remained a vital part of our recruitment strategy. This program is aimed at attracting talented entry level staff who are given the opportunity to develop and progress through the organisation. Graduates rotate through the major operational areas of OFM during their first 12 months. At the end of the year they are placed in a permanent position. Fourteen new graduates were recruited from more than 300 who applied for our specialist accounting and other positions. These recruits had studied a range of disciplines at NSW and interstate universities. Our previous graduates assisted at the career fairs of five Sydney universities. OFM participated for the first time in the Sector’s Fast Track Graduate Program for Accounting and Policy Graduates. Selected graduates will spend six months in OFM before they are placed with two other agencies, also for six months. Following these placements the graduates return to work at OFM. OFM also recruited two officers from the NSW Indigenous Cadet Program.
MISSION RESULTS STRATEGIES SERVICES
Applying a multi-faceted staff development strategy to ensure that OFM has the capability to pursue its planned business results.
Training days in 2008-09 Face to Face 1,046 days E-Learning 180 days
TOTAL 1,226 days
ORGANISATION BUILDING Staff Development

Our performance in 2007-08
OFM 2007-08 Annual Report - 37
Staff Feedback Surveys are used to monitor the commitment OFM makes to its staff - job satisfaction, and personal and career development opportunity in an environment of strong leadership and effective management. A comprehensive survey issues to staff every two years. A briefer quarterly questionnaire also provides the opportunity for staff to flag emerging issues and for management to monitor trends. A biennial staff opinions survey was conducted in July 2007. The results of the survey were considered at OFM’s annual planning conference in November. Survey results were used to assess adherence to each of OFM’s values and to identify any issues for the implementation of our priority projects. A positive response was received to 89% of questions from more than half the staff. Overall, results of the 2007 survey were similar to that of 2005. There was a significant increase in satisfaction with feedback on work performance. There was a fall in satisfaction with cooperation between Directorates and Branches. The largely positive responses in the biennial survey also were reflected in the quarterly questionnaires during the year. Staff continued to express strong positive attitudes to OFM (90% satisfied) and their jobs (93% satisfied).
Historical analysis OFM’s quarterly staff survey has been in place since 1990. During 2007-08, the 18 years of available data was analysed to identify any changes and trends in staff attitudes to core questions. The following trends emerged: The percentage of staff participating in the
quarterly survey has declined from an average 60% during the 1990s to an average 50% since 2000.
Attitudes across all questions were more positive in 2007 than in 1990. Attitudes to most questions troughed in the mid 1990s.
Generally, strongly positive attitudes have been expressed throughout the history of the questionnaire in terms of satisfaction with Treasury (average 85%) and the job (average 91%).
While staff concern with Opportunity continues to be an issue that OFM seeks to address – with the staff training program and development opportunities – attitudes in 2007 (75%) were more positive than in 1990 (65%) and 1995 (53%).
There has been a strong improvement in attitudes to Salary versus Duties – from 67% in 1990 (and 68% in 1995) to 81% in 2007.
Staff Survey Results
2003-2004
Actual
2004-2005
Actual
2005-2006
Actual
2006-2007
Actual
2007-2008
Actual
Target
Biennial Survey
staff response 82% na 79% na 69% >75%
staff agree they are valued
74% na 78% na 78% >75%
staff agree they have sufficient opportunities to develop their skills
84% na 72% na 69% >75%
Quarterly Questionnaire
staff believe OFM values are being adhered to
94% 93% 93% 89% 87% >90%
staff satisfied with OFM
95% 90% 91% 89% 90% >90%
staff satisfied with their job
95% 92% 95% 93% 93% >90%

Organisation Building
38 - OFM 2007-08 Annual Report
Agency Relations
If OFM is to achieve its planned results, it is important for us to maintain strong relationships with other central agencies and line agencies. OFM, and agencies, have a joint responsibility to apply the Government’s Fiscal Strategy and maintain the State’s Triple A credit rating. Our code of good practice commits us to: Working in partnership with agencies
to pursue successful implementation of financial management reforms.
Openness, mutual respect and the sharing of information.
Every two years, OFM surveys agencies to check whether they feel we have complied with the code. The last survey was conducted in 2006 and its results were reported in detail in the 2005-06 annual report. The next biennial survey is scheduled for late 2008 and will be reported in next year’s annual report. Historical data on our relationship with agencies is repeated in this current report – see Our Commitment to Agencies on page 17. The secondment of officers between OFM and other agencies strengthens inter-agency relationships. Officers seconded from OFM learn more about the environment and the business of their host agency. Officers seconded into OFM gain an insight of the whole of government fiscal strategy and associated requirements. During 2007-08, 12 OFM staff were seconded to other government agencies. There were 7 secondments from other agencies into OFM.
Communication Strategies
Good communication supports our internal operations, and helps us to maintain strategic partnerships with other agencies. OFM’s Web Communication Strategy is based on improving and expanding our websites. We analyse the areas most accessed to ensure that appropriate and easily accessed content is available for users of the sites. In 2007-08, OFM applied a content management system to its web and intranet sites to comply with the NSW Government Style Directive. The Government Information Office confirmed the new web site as one of their compliant or near compliant sites. A number of OFM staff were trained in the new system, allowing some areas to take responsibility for directly updating content. Electronic Service Delivery
The web site is used increasingly as OFM’s main vehicle to apply the Government’s Electronic Service Delivery Strategy and to provide information to our clients. The particular needs of public sector agencies are addressed with a dedicated Information for Agencies area on the web site. The conversion of the site to a content management system allowed us to expand content, and strengthen the security of this area. Treasury Circulars issue to agencies via the web site, and our Policy & Guidelines Papers are also available on line. A subscription service automatically notifies agencies as new Circulars issue. More generally, OFM’s web site provides the broader community with access to: all NSW Treasury publications,
including our annual report
reports on NSW finances, including the State Budget Papers and the State Infrastructure Strategy
advertised OFM job vacancies and tender specifications.
A system is in place to enable agencies to electronically lodge their financial data directly into Treasury’s Financial Information System.
MISSION RESULTS STRATEGIES SERVICES
Applying an agency relations strategy that emphasises the need for OFM to work in partnership with other agencies in developing and implementing State financial reforms.
OFM Website Top 10 pages 2004-2005
2005-2006
2006-2007
2007-2008
Budget Papers 4 2 1 1
Search Page 6 5 4 2
Treasury Circulars Index - 6 10 3
Publications Index 2 1 2 4
Current OFM jobs advertised 5 7 5 5
External Links Page 8 4 3 6
Working with Government Website - - 8 7
Publications by Policy Area Index 7 9 6 8
Procurement Index 9 8 7 9
Financial Reports - - - 10
ORGANISATION BUILDING Agency Relations

OFM 2007-08 Annual Report - 39
financial statements
Auditor-General's Opinion 40
Statement by Treasury Head
42
Operating Statement 43
Statement of Recognised Income and Expense
44
Balance Sheet 45
Cash Flow Statement 46
Program Statement – Expenses and Revenues
47
Summary of Compliance with Financial Directives
48
Notes to Financial Statements
49

40 - OFM 2007-08 Annual Report
INDEPENDENT AUDITOR'S REPORT
THE TREASURY To Members of the New South Wales Parliament I have audited the accompanying financial report of The Treasury, which comprises the balance sheet as at 30 June 2008, and the operating statement, statement of recognised income and expense, cash flow statement, program statement - expenses and revenues, and summary of compliance with financial directives for the year then ended, and a summary of significant accounting policies and other explanatory notes. Auditor's Opinion In my opinion, the financial report: • presents fairly, in all material respects, the financial position of The Treasury as of
30 June 2008, and of its financial performance and its cash flows for the year then ended in accordance with Australian Accounting Standards (including the Australian Accounting Interpretations)
• is in accordance with section 45E of the Public Finance and Audit Act 1983 (the PF&A Act) and the Public Finance and Audit Regulation 2005.
Secretary's Responsibility for the Financial Report The Secretary is responsible for the preparation and fair presentation of the financial report in accordance with Australian Accounting Standards (including the Australian Accounting Interpretations) and the PF&A Act. This responsibility includes establishing and maintaining internal control relevant to the preparation and fair presentation of the financial report that is free from material misstatement, whether due to fraud or error; selecting and applying appropriate accounting policies; and making accounting estimates that are reasonable in the circumstances. Auditor's Responsibility My responsibility is to express an opinion on the financial report based on my audit. I conducted my audit in accordance with Australian Auditing Standards. These Auditing Standards require that I comply with relevant ethical requirements relating to audit engagements and plan and perform the audit to obtain reasonable assurance whether the financial report is free from material misstatement. An audit involves performing procedures to obtain audit evidence about the amounts and disclosures in the financial report. The procedures selected depend on the auditor's judgement, including the assessment of the risks of material misstatement of the financial report, whether due to fraud or error. In making those risk assessments, the auditor considers internal control relevant to The Treasury's preparation and fair presentation of the financial report in order to design audit procedures that are appropriate in the circumstances, but not for the purpose of expressing an opinion on the effectiveness of The Treasury's internal control. An audit also includes evaluating the appropriateness of accounting policies used and the reasonableness of accounting estimates made by the Secretary, as well as evaluating the overall presentation of the financial report. I believe that the audit evidence I have obtained is sufficient and appropriate to provide a basis for my audit opinion.
GPO BOX 12 Sydney NSW 2001

OFM 2007-08 Annual Report - 41
My opinion does not provide assurance: about the future viability of The Treasury, that it has carried out its activities effectively, efficiently and economically, about the effectiveness of its internal controls, or on the assumptions used in formulating the budget figures disclosed in the financial report. Independence In conducting this audit, the Audit Office has complied with the independence requirements of the Australian Auditing Standards and other relevant ethical requirements. The PF&A Act further promotes independence by: providing that only Parliament, and not the executive government, can remove an
Auditor-General, and
mandating the Auditor-General as auditor of public sector agencies but precluding the provision of non-audit services, thus ensuring the Auditor-General and the Audit Office are not compromised in their role by the possibility of losing clients or income.
Peter Achterstraat Auditor-General 16 September 2008 SYDNEY

42 - OFM 2007-08 Annual Report
Statement by The Treasury Head
Pursuant to Section 45F of the Public Finance and Audit Act 1983, I state that:
(a) the accompanying financial statements in respect of the year ended 30 June 2008 have been
prepared in accordance with applicable Australian Accounting Standards, other authoritative
pronouncements of the Australian Accounting Standards Board (AASB), the requirements of
the Public Finance and Audit Act 1983 and Regulation 2005, and the Financial Reporting
Directions published in the Financial Reporting Code for Budget Dependent General
Government Sector Agencies or issued by the Treasurer under section 9(2) of the Act;
(b) the statements and notes exhibit a true and fair view of the financial position and
transactions of the Treasury; and
(c) there are no circumstances, which would render any particulars included in the financial
statements to be misleading or inaccurate.
J Pierce Secretary 8 September 2008

New South Wales Treasury
OFM 2007-08 Annual Report - 43
Operating Statement for the Year Ended 30 June 2008
Notes Actual
2008 $’000
Budget
2008 $'000
Actual
2007 $'000
Expenses excluding losses
Operating expenses Employee related 2(a) 120 536 123 753 110 709 Other operating expenses 2(b) 48 361 42 948 45 150 Depreciation and amortisation 2(c) 12 281 14 630 13 612 Grants and subsidies 2(d) 347 772 344 351 345 639 Other expenses 2(e) - 42 71 Total Expenses excluding losses 528 950 525 724 515 181
Revenue Sale of goods and services 3(a) 37 378 30 286 28 752 Investment revenue 3(b) 2 835 1 769 1 880 Retained taxes, fees and fines 3(c) 431 180 260 Other revenue 3(d) 852 5 874 5 948 Total Revenue 41 496 38 109 36 840 Gain / (loss) on disposal 4 (378) - (251) Other gains / (losses) 5 (548) - (1 967) Net Cost of Services 20 488 380 487 615 480 559 Government Contributions Recurrent appropriation 6 471 750 465 229 462 724 Capital appropriation 6 5 119 5 119 6 444
Acceptance by the Crown Entity of employee benefits and other liabilities
7 8 057 6 120 7 694
Total Government Contributions 484 926 476 468 476 862 SURPLUS / (DEFICIT) FOR THE YEAR 16 (3 454) (11 147) (3 697)
The accompanying notes form part of these financial statements.

New South Wales Treasury
44 - OFM 2007-08 Annual Report
Statement of Recognised Income and Expense for the Year Ended 30 June 2008
Notes Actual 2008 $’000
Budget
2008 $'000
Actual 2007 $'000
TOTAL INCOME AND EXPENSE RECOGNISED DIRECTLY IN EQUITY -
-
-
Surplus / (Deficit) for the year 16 (3 454) (11 147) (3 697)
TOTAL INCOME AND EXPENSE RECOGNISED FOR THE YEAR (3 454) (11 147) (3 697)
The accompanying notes form part of these financial statements.
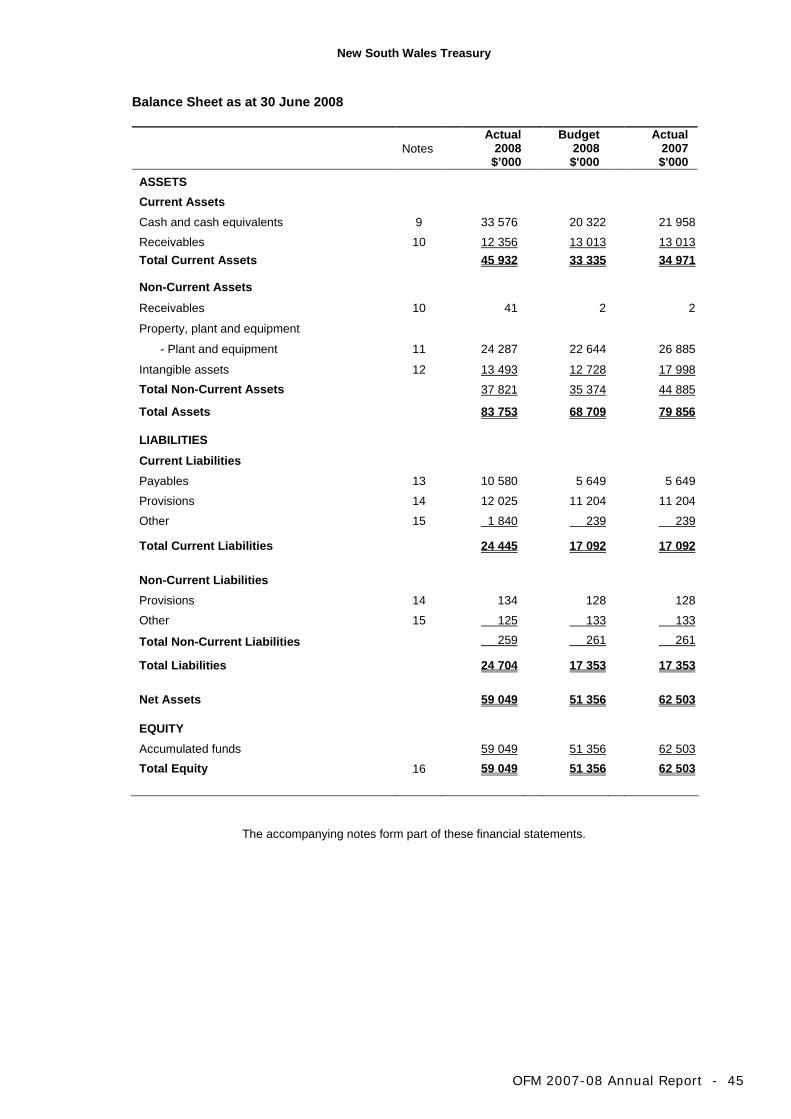
New South Wales Treasury
OFM 2007-08 Annual Report - 45
Balance Sheet as at 30 June 2008
Notes Actual
2008 $’000
Budget
2008 $'000
Actual
2007 $'000
ASSETS Current Assets
Cash and cash equivalents 9 33 576 20 322 21 958
Receivables 10 12 356 13 013 13 013 Total Current Assets 45 932 33 335 34 971
Non-Current Assets
Receivables 10 41 2 2
Property, plant and equipment
- Plant and equipment 11 24 287 22 644 26 885
Intangible assets 12 13 493 12 728 17 998 Total Non-Current Assets 37 821 35 374 44 885
Total Assets 83 753 68 709 79 856
LIABILITIES
Current Liabilities
Payables 13 10 580 5 649 5 649
Provisions 14 12 025 11 204 11 204
Other 15 1 840 239 239
Total Current Liabilities 24 445 17 092 17 092
Non-Current Liabilities
Provisions 14 134 128 128
Other 15 125 133 133
Total Non-Current Liabilities 259 261 261
Total Liabilities 24 704 17 353 17 353
Net Assets 59 049 51 356 62 503
EQUITY Accumulated funds 59 049 51 356 62 503 Total Equity 16 59 049 51 356 62 503
The accompanying notes form part of these financial statements.

New South Wales Treasury
46 - OFM 2007-08 Annual Report
Cash Flow Statement for the Year Ended 30 June 2008
Notes Actual
2008 $’000
Budget
2008 $'000
Actual
2007 $'000
CASH FLOWS FROM OPERATING ACTIVITIES
Payments
Employee related (111 029) (117 633) (103 811)
Grants and subsidies (347 052) (344 351) (345 754)
Other (52 425) (50 674) (52 115) Total Payments (510 506) (512 658) (501 680) Receipts
Sale of goods and services 37 296 30 286 28 221
Retained taxes, fees and fines 431 180 260
Interest received 2 208 1 769 1 690
GST 8 612 7 684 7 916
Other 658 5 874 5 999 Total Receipts 49 205 45 793 44 086 Cash Flows from Government
Recurrent appropriation 6 473 582 465 229 462 724 Capital appropriation (excluding equity appropriations) 6 5 119 5 119 6 444
Cash transfers to the Consolidated Fund (165) - (406) Net Cash Flows from Government 478 536 470 348 468 762 NET CASH FLOWS FROM OPERATING ACTIVITIES 20 17 235
3 483
11 168
CASH FLOWS FROM INVESTING ACTIVITIES
Proceeds from sale of plant and equipment 182 - 18
Purchases of plant and equipment (5 676) (5 119) (6 591)
Other (123) - (73) NET CASH FLOWS FROM INVESTING (5 617) (5 119) (6 646) ACTIVITIES NET INCREASE / (DECREASE) IN CASH 11 618 (1 636) 4 522
Opening cash and cash equivalents 21 958 18 694 17 436
CLOSING CASH AND CASH EQUIVALENTS 9 33 576 17 058 21 958
The accompanying notes form part of these statements.

OFM
2007-0
8 A
nnual R
eport - 4
7
New
South Wales Treasury
Program Statement - Expenses and Revenues for the year ended 30 June 2008
Program 52.1.1* Program 52.2.1* Program 52.3.1* Program 52.4.1* Not Attributable Total TREASURY’S EXPENSES & REVENUES 2008 2007 2008 2007 2008 2007 2008 2007 2008 2007 2008 2007
$’000
$’000
$’000
$’000 $’000 $’000 $’000 $’000 $’000 $’000 $’000 $’000 Expenses excluding losses Operating expenses Employee related 32 970 29 444 48 658 48 846 34 053 27 914 4 855 4 505 - - 120 536 110 709 Other operating expenses 14 592 11 564 17 250 17 310 15 362 15 172 1 157 1 104 - - 48 361 45 150 Depreciation and amortisation 390 391 8 385 8 543 2 733 3 963 773 715 - - 12 281 13 612 Grants and subsidies 169 169 22 182 21 510 - - 325 421 323 960 - - 347 772 345 639 Other expenses - - - - - 71 - - - - - 71 Total Expenses excluding losses 48 121 41 568 96 475 96 209 52 148 47 120 332 206 330 284 - - 528 950 515 181 Revenue Sale of goods and services 8 583 18 3 240 3 190 25 545 25 541 10 3 - - 37 378 28 752 Investment revenue 631 483 1 366 792 712 539 126 66 - - 2 835 1 880 Retained taxes, fees and fines - - - - 431 260 - - - - 431 260 Grants and contributions - - - - - - - - - - - - Other revenue 21 5 636 810 307 3 - 18 5 - - 852 5 948 Total Revenue 9 235 6 137 5 416 4 289 26 691 26 340 154 74 - - 41 496 36 840 Gain / (loss) on disposal (298) (1) (68) (153) (6) (84) (6) (13) - - (378) (251) Other gains / (losses) - - - - - (1 870) (548) (97) (548) (1 967) Net Cost Of Services 39 184 35 432 91 127 92 073 25 463 22 734 332 606 330 320 - - 488 380 480 559 Government contributions ** - - - - - - - - 484 926 476 862 484 926 476 862 NET (EXPENDITURE) / REVENUE FOR THE YEARS (39 184) (35 432) (91 127) (92 073) (25 463 (22 734) (332 606) (330 320) 484 926 476 862 (3 454) (3 697) ADMINISTERED EXPENSES & REVENUES Administered Expenses Other (Note 26) - - 104 155 103 926 - - - - - - 104 155 103 926 Total Administered Expenses - - 104 155 103 926 - - - - - - 104 155 103 926 Administered Revenues Consolidated Fund Revenue earned (Note 27(a)) Taxes, fees, and fines - - 15 967 318 15 966 667 290 871 244 265 - - - - 16 258 189 16 210 932 Other - - 755 292 618 316 - - - - - - 755 292 618 316 Total Administered Revenues - - 16 722 610 16 584 983 290 871 244 265 - - - - 17 013 481 16 829 248 Administered Revenues less Expenses - - 16 618 455 16 481 057 290 871 244 265 - - - - 16 909 326 16 725 322
* The name and purpose of each program is summarised in Note 8. ** Appropriations and acceptance by the Crown Entity of employee benefits and other liabilities are made on an agency basis and not to individual programs. Consequently, government contributions must be included in the “Not Attributable” column.

New South Wales Treasury
48 - OFM 2007-08 Annual Report
Summary of Compliance with Financial Directives for the year ended 30 June 2008 2008 2007
Recurrent Appropriation
Expenditure/ Net Claim on Consolidated Fund
Capital Appropriation
Expenditure/ Net Claim on Consolidated Fund
Recurrent Appropriation
Expenditure/ Net Claim on Consolidated Fund
Capital Appropriation
Expenditure/ Net Claim on Consolidated Fund
$’000 $’000 $’000 $’000 $’000 $’000 $’000 $’000 Original Budget Appropriation/ Expenditure
Appropriation Act
465 229 464 575 5 119 5 119 419 206 418 764 6 444 6 444
465 229 464 575 5 119 5 119 419 206 418 764 6 444 6 444 Other Appropriations/Expenditure
Section 22 – expenditure for certain works and services
31 000 3 422 -
-
39 000
39 000
-
-
Transfers from another agency (section 27 of the Appropriation Act)
- - -
-
13 000
4 960
-
-
Transfers to another agency (section 27 of the Appropriation Act)
- - -
-
(150)
-
-
-
Transfers from another agency (section 32 of the Appropriation Act)
2 727 1 557 - -
Transfers from another agency (section 32 (3) of the Appropriation Act)
(370) - - -
Transfers from another agency (section 33 of the Appropriation Act)
2 196 2 196 - -
35 553 7 175 - - 51 850 43 960 - - Total Appropriations/ Expenditure/ Net Claim on Consolidated Fund (includes transfer payments)
500 782
471 750
5 119
5 119
471 056
462 724
6 444
6 444
Amount drawn down against Appropriation
473 582
5 119
462 889
6 444
Liability to Consolidated Fund (Note 15)
1 832 - 165 -
The Summary of Compliance is based on the assumption that Consolidated Fund moneys are spent first (except where otherwise identified or prescribed).
The “Liability to Consolidated Fund” represents the difference between the “Amount drawn down against Appropriation” and the “Total Expenditure / Net Claim on Consolidated Fund”.

New South Wales Treasury Notes to the Financial Statements 30 June 2008
OFM 2007-08 Annual Report - 49
1. SUMMARY OF SIGNIFICANT ACCOUNTING POLICIES (a) Reporting Entity
The Treasury, as a reporting entity comprises all the operating activities of the Office of Financial Management (OFM) and the Office of State Revenue (OSR). The OFM serves the Treasurer and the Government by providing economic, budgetary and financial advice on the effective management of and accounting for the State’s finances and for providing timely and relevant information on the overall State finances. The OSR is responsible for the administration and collection of specific taxes imposed by the State of New South Wales and income tax equivalents from State Government businesses. OSR is also responsible for the processing and enforcement of fines, administration and payment of grants under the First Home Owner Grant Scheme (FHOGS) and Unclaimed Money.
In the process of preparing the financial statements for The Treasury, all transactions between the OSR and the OFM have been eliminated.
The Treasury is a NSW government agency. The Treasury is a not-for-profit entity (as profit is not its principal objective) and it has no cash generating units. It is consolidated as part of the NSW Total State Sector Accounts.
Administered activities are consolidated as part of the Crown Entity accounts.
This financial report for the year ended 30 June 2008 has been authorised for issue by the Secretary on 8 September 2008.
(b) Basis of Preparation
The Treasury’s financial report is a general purpose financial report which has been prepared in accordance with:
applicable Australian Accounting Standards (which include Australian Accounting Interpretations)
the requirements of the Public Finance and Audit Act 1983 and Regulation 2005, and
the Financial Reporting Directions published in the Financial Reporting Code for Budget Dependant General Government Sector Agencies or issued by the Treasurer.
Plant and equipment is measured at fair value. Other financial report items are prepared in accordance with the historical cost convention.
Judgements, key assumptions and estimations management has made are disclosed in the relevant notes to the financial report.
All amounts are rounded to the nearest one thousand dollars and are expressed in Australian currency.
(c) Statement of Compliance
The consolidated and parent entity financial statements and notes comply with Australian Accounting standards, which include Australian Accounting interpretations.
(d) Administered Activities
The Treasury administers, but does not control, certain activities on behalf of the Crown Entity. It is accountable for the transactions relating to those administered activities but does not have the discretion, for example, to deploy those resources for the achievement of the Treasury’s own objectives. The accrual basis of accounting; accounting standards and Crown entity revenue recognition policies have been adopted.
Transactions and balances relating to the administered activities are not recognised as the Treasury’s revenues, expenses, assets and liabilities, but are disclosed in the accompanying schedules as “Administered Revenues”, “Administered Expenses”, “Administered Assets” and “Administered Liabilities”.
New South Wales Treasury Notes to the Financial Statements 30 June 2008
50 - OFM 2007-08 Annual Report
In accordance with the Crown Entity’s current revenue recognition policy (TC 92/25 “Accounting for Crown Revenue”) State revenue is recognised as follows within Note 27 (a):
Government-assessed revenues (primarily land tax) are regarded as being able to be measured reliably at the time of issuing the assessment.
Taxpayer-assessed revenues (including pay-roll tax) are regarded as being able to be measured reliably when the funds are received by the Treasury. Additional revenues are recognised for assessments subsequently issued following the review of returns lodged by taxpayers.
Interest payable on government and taxpayer - assessed revenues is brought to account on a daily basis.
Enforcement orders issued by the State Debt Recovery Office (SDRO) are regarded as being able to be measured reliably when the enforcement order is issued. Infringements issued, are regarded as being able to be measured reliably when the cash is received.
Receivables and liabilities reported under administered activities are a result of statutory requirements and are not financial instruments.
(e) Insurance
The Treasury’s insurance activities are conducted through the NSW Treasury Managed Fund Scheme of self insurance for Government agencies. The expense (premium) is determined by the Fund Manager based on past claim experience.
(f) Accounting for the Goods and Services Tax (GST)
Revenues, expenses and assets are recognised net of the amount of GST, except where:
the amount of GST incurred by The Treasury as a purchaser that is not recoverable from the Australian Taxation Office is recognised as part of the cost of acquisition of an asset or as part of an item of expense.
receivables and payables are stated with the amount of GST included.
Cash flows are included in the cash flow statement on a gross basis. However, the GST components of cash flows arising from investing activities and financing activities which is recoverable from, or payable to, the Australian Taxation office are classified as operating cash flows.
(g) Income Recognition
Income is measured at the fair value of the consideration or contribution received or receivable. Additional comments regarding the accounting policies for the recognition of income are discussed below.
(i) Parliamentary Appropriations and Contributions Except as specified below, parliamentary appropriations and contributions from other bodies (including grants and donations) are generally recognised as revenue when the Treasury obtains control over the assets comprising the appropriations / contributions. Control over appropriations / contributions is normally obtained upon the receipt of cash.
Unspent appropriations are recognised as liabilities rather than revenue as the authority to spend the money lapses and the unspent amount must be repaid to the Consolidated Fund.
The liability is disclosed in Note 15 as part of “Current / Non-Current Liabilities - Other”. The amount will be repaid and the liability will be extinguished in the next financial year.
(ii) Sale of Goods Revenue from the sale of goods is recognised as revenue when the Treasury transfers the significant risks and rewards of ownership of the assets.
(iii) Rendering of Services Revenue is recognised when the service is provided or by reference to the stage of completion (based on labour hours incurred to date). Infringement fees are recognised when the service is provided. Land tax search fees are recognised as revenue when the Treasury obtains control of the assets that result from them.
(iv) Investment Revenue
Interest revenue is recognised using the effective interest method as set out in AASB 139 Financial Instruments: Recognition and Measurement

New South Wales Treasury Notes to the Financial Statements 30 June 2008
OFM 2007-08 Annual Report - 51
(h) Assets
(i) Acquisition of Assets The cost method of accounting is used for the initial recording of all acquisitions of assets controlled by the Treasury. Cost is the amount of cash or cash equivalents paid or the fair value of the other consideration given to acquire the asset at the time of its acquisition or construction or, where applicable, the amount attributed to that asset when initially recognised in accordance with the specific requirements of other Australian Accounting Standards.
Assets acquired at no cost, or for nominal consideration, are initially recognised as assets and revenues at their fair value at the date of acquisition.
Fair value means the amount for which an asset could be exchanged between knowledgeable, willing parties in an arm’s length transaction.
Where payment for an item is deferred beyond normal credit terms, its cost is the cash price equivalent, i.e. the deferred payment amount is effectively discounted at an asset-specific rate.
(ii) Capitalisation Thresholds Office furniture and equipment costing at least $5 000 is capitalised. Computer hardware costing at least $1 000 is also capitalised. However, grouped assets with inter-related functions such as the computer network are capitalised regardless of cost.
(iii) Revaluation of Property, Plant and Equipment Physical non-current assets are valued in accordance with the “Valuation of Physical Non-Current Assets at Fair Value” Policy and Guidelines paper (TPP 07-1). This policy adopts fair value in accordance with AASB 116 Property, Plant and Equipment. Property, plant and equipment is measured on an existing use basis, where there are no feasible alternative uses in the existing natural, legal, financial and socio-political environment. However, in the limited circumstances where there are feasible alternative uses, assets are valued at their highest and best use. Fair value of property, plant and equipment is determined based on the best available market evidence, including current market selling prices for the same or similar assets. Where there is no available market evidence, the asset’s fair value is measured at its market buying price, the best indicator of which is depreciated replacement cost. As The Treasury does not own Land, Building or Infrastructure assets, management does not believe that the revaluation of physical non-current assets over five years is warranted, unless it becomes aware of any material difference in the carrying amount of any class of assets. Most of the Treasury’s assets are non-specialised with short useful lives and are therefore measured at depreciated historical cost, as a surrogate for fair value.
(iv) Impairment of Property, Plant and Equipment As a not-for-profit entity with no cash generating units, The Treasury is effectively exempted from AASB 136 Impairment of Assets and impairment testing. This is because AASB 136 modifies the recoverable amount test to the higher of fair value less costs to sell and depreciated replacement cost. This means that, for an asset already measured at fair value, impairment can only arise if selling costs are material. Selling costs are regarded as immaterial.
(v) Depreciation of Property, Plant and Equipment Depreciation is provided for on a straight-line basis for all depreciable assets so as to write off the depreciable amount of each asset as it is consumed over its useful life to The Treasury. All material separately identifiable components of assets are recognised and depreciated over their shorter useful lives. The useful lives of each category of depreciable assets are:
Computer Hardware 4 years
Office Equipment 7 years
Office Furniture 5 to 10 years
Computer Software 1 to 10 years depending on the expected usage of the application.

New South Wales Treasury Notes to the Financial Statements 30 June 2008
52 - OFM 2007-08 Annual Report
(vi) Maintenance Day-to-day servicing costs or maintenance are charged as expenses when incurred, except where they relate to the replacement of a part or component of an asset, in which case the costs are capitalised and depreciated.
(vii) Leased Assets Operating lease payments are charged to the Operating Statement in the periods in which they are incurred. The Treasury has not entered into any finance leases.
(viii) Intangible Assets The Treasury recognises intangible assets only if it is probable that future economic benefits will flow to The Treasury and the cost of the asset can be measured reliably. Intangible assets are measured initially at cost. Where an asset is acquired at no or nominal cost, the cost is its fair value as at the date of acquisition.
All research costs are expensed. Development costs are only capitalised when certain criteria are met.
The useful lives of intangible assets are assessed to be finite. Intangible assets are subsequently measured at fair value only if there is an active market. As there is no active market for The Treasury’s intangible assets, the assets are carried at cost less any accumulated amortisation.
The Treasury’s intangible assets are amortised using the straight line method over a period ranging from 1 to 10 years depending upon the nature of the application.
Intangible assets are tested for impairment where an indicator of impairment exists. However, as a not-for-profit entity with no cash generating units, The Treasury is effectively exempted from impairment testing (refer Para (iv)).
(ix) Receivables Receivables are non-derivative financial assets with fixed or determinable payments that are not quoted in an active market. These financial assets are recognised initially at fair value, usually based on the transaction cost or face value. Subsequent measurement is at amortised cost using the effective interest method, less an allowance for any impairment of receivables. Any changes are accounted for in the Operating Statement when impaired, derecognised or through the amortisation process.
Short-term receivables with no stated interest rate are measured at the original invoice amount where the effect of discounting is immaterial.
(x) Impairment of Financial Assets All financial assets, except those measured at fair value through profit and loss, are subject to an annual review for impairment. An allowance for impairment is established when there is objective evidence that the entity will not be able to collect all amounts due.
For financial assets carried at amortised cost, the amount of the allowance is the difference between the asset’s carrying amount and the present value of estimated future cash flows, discounted at the effective interest rate. The amount of the impairment loss is recognised in the Operating Statement.
Any reversals of impairment losses are reversed through the Operating Statement, where there is objective evidence. Reversals of impairment losses of financial assets carried at amortised cost cannot result in a carrying amount that exceeds what the carrying amount would have been had there not been an impairment loss.
(xi) De-recognition of Financial Assets and Financial Liabilities
A financial asset is derecognised when the contractual rights to the cash flows from the financial assets expire; or if The Treasury transfers the financial assets:
where substantially all the risks and rewards have been transferred or
where The Treasury has not transferred substantially all the risks and rewards, if the entity has not retained control.
Where The Treasury has neither transferred nor retained substantially all the risks and rewards are transferred control, the asset is recognised to the extent of the Treasury’s continuing involvement in the asset.
A financial liability is derecognised when the obligation specified in the contract is discharged or cancelled or expires.

New South Wales Treasury Notes to the Financial Statements 30 June 2008
OFM 2007-08 Annual Report - 53
(xii) Trust Funds The Treasury receives monies in a trustee capacity for various trusts as set out in Note 22. As The Treasury performs only a custodial role is in respect of these monies, and because the monies cannot be used for the achievement of The Treasury’s own objectives, these funds are not recognised in the financial statements.
(xiii) Other Assets Other assets are recognised on a cost basis.
(i) Liabilities
(i) Payables
These amounts represent liabilities for goods and services provided to The Treasury and other amounts. Payables are recognised initially at fair value, usually based on the transaction cost or face value. Subsequent measurement is at amortised cost using the effective interest method. Short-term payables with no stated interest rate are measured at the original invoice amount where the effect of discounting is immaterial.
(ii) Employee Benefits and Other Provisions
(a) Salaries and wages, annual leave, sick leave and on-costs
Liabilities for salaries and wages (including non-monetary benefits), annual leave and paid sick leave that fall due wholly within 12 months of the reporting date are recognised and measured in respect of employees’ services up to the reporting date at undiscounted amounts based on the amounts expected to be paid when the liabilities are settled.
Unused non-vesting sick leave does not give rise to a liability as it is not considered probable that sick leave taken in the future will be greater than the benefits accrued in the future.
The outstanding amounts of pay-roll tax, workers’ compensation insurance premiums and fringe benefits tax, which are consequential to employment, are recognised as liabilities and expenses where the employee benefits to which they relate have been recognised.
(b) Long service leave and superannuation
The Treasury’s liabilities for long service leave and defined benefit superannuation are assumed by the Crown Entity. The Treasury accounts for the liability as having been extinguished resulting in the amount assumed being shown as part of the non-monetary revenue item described as “Acceptance by the Crown Entity of employee benefits and other liabilities”.
Long service leave is measured at present value in accordance with AASB 119 Employee Benefits. This is based on the application of certain factors (specified in NSWTC 07/04) to employees with five or more years of service, using current rates of pay. These factors were determined based on an actuarial review to approximate present value.
The superannuation expense for the financial year is determined by using the formulae specified in the Treasurer’s Directions. The expense for certain superannuation schemes (i.e., Basic Benefit and First State Super) is calculated as a percentage of the employees' salary. For other superannuation schemes (i.e. State Superannuation Scheme and State Authorities Superannuation Scheme), the expense is calculated as a multiple of the employees’ superannuation contributions.
(iii) Other Provisions
Other provisions exist when: The Treasury has a present legal or constructive obligation as a result of a past event; it is probable that an outflow of resources will be required to settle the obligation; and a reliable estimate can be made of the amount of the obligation.
Any provisions for restructuring are recognised only when The Treasury has a detailed formal plan and has raised a valid expectation in those affected by the restructuring that it will carry out the restructuring by starting to implement the plan or announcing its main features to those affected.
(j) Budgeted Amounts
The budgeted amounts are drawn from the budgets as formulated at the beginning of the financial year and with any adjustments for the effects of additional appropriations, s 21A, s 24 and/or s 26 of the Public Finance and Audit Act 1983.
The budgeted amounts in the Operating Statement and the Cash Flow Statement are generally based on the amounts disclosed in the NSW Budget Papers (as adjusted above). However, in the Balance Sheet, the amounts vary from the Budget Papers, as the opening balances of the budgeted amounts are based on carried forward actual amounts i.e. per the audited financial statements (rather than carried forward estimates).

New South Wales Treasury Notes to the Financial Statements 30 June 2008
54 - OFM 2007-08 Annual Report
(k) Grants and Subsidies The FHOGS was introduced in July 2000 to compensate first home buyers for the impact of the introduction of GST. OSR is responsible for the payment of the grant to approved applicants. The amount is net of returns of payments made in relation to contracts not settled and recoveries by compliance auditors of payments made to ineligible applicants. Write-offs are added back. Penalties, imposed in terms of the FHOGS legislation on applicants for wrongful claims, are also netted off against the total amount of payments made in the year. From the 1st July 2008 the FHOGS will become an administered activity of The Treasury for the Crown (as opposed to a departmental activity) and will be reported under Notes 23 to 27. Receivables owing as at 30 June 2008 will remain with OSR. The FHOGS receivables are a statutory requirement and are not financial liabilities or financial assets. Included under grants and subsidies are payments to The NSW Department of Lands who provide land information and valuation services required to administer the Land Tax Management Act 1956.
(l) Comparative Information
Except where an Australian Accounting Standard permits or requires otherwise, comparative information is disclosed in respect of the previous period for all amounts reported in the financial statements.
(m) New Australian Accounting Standards Issued But Not Effective
The following new Accounting Standards issued and not yet effective have not been early adopted.
AASB 3 (March 2008), AASB 127 and AASB 2008-3 regarding business combinations (1 July 2009);
AASB 8 and AASB 2007-3 regarding operating segments (1 January 2009);
AASB 101 (Sept 2007) and AASB 2007-8 regarding presentation of financial statements (1 January 2009);
AASB 123 (June 2007) and AASB 2007-6 regarding borrowing costs (1 January 2009);
AASB 1004 (Dec 2007) regarding contributions (1 July 2008);
AASB 1049 (Oct 2007) regarding the whole of government and general government sector financial reporting (1 July 2008);
AASB 1050 (Dec 2007) regarding administered items (1 July 2008);
AASB 1051 (Dec 2007) regarding land under roads (1 July 2008);
AASB 1052 (Dec 2007) regarding disaggregated disclosures (1 July 2008);
AASB 2007-9 regarding amendments arising from the review of AASs 27, 29 and 31 (1 July 2008);
AASB 2008-1 regarding share based payments (1 January 2009);
AASB 2008-2 regarding puttable financial instruments (1 January 2009);
Interpretation 4 (Feb 2007) regarding determining whether an arrangement contains a lease (1 January 2008);
Interpretation 12 and AASB 2007-2 regarding service concession arrangements (1 January 2008);
Interpretation 13 on customer loyalty programmes (1 July 2008);
Interpretation 14 regarding the limit on a defined benefit asset (1 January 2008);
Interpretation 129 (Feb 2007) regarding service concession disclosures (1 January 2008);
Interpretation 1038 (Dec 2007) regarding contributions by owners (1 July 2008).
The impact of these new Standards and Interpretations will have no material impact on the financial report of The Treasury in future periods.

New South Wales Treasury Notes to the Financial Statements 30 June 2008
OFM 2007-08 Annual Report - 55
2. EXPENSES EXCLUDING LOSSES
2008 $'000
2007 $'000
(a) Employee related expenses Salaries and wages (including recreation leave) 99 584 90 922 Superannuation – defined benefit plans 4 515 3 604 Superannuation – defined contribution plans 5 630 5 272 Long service leave 3 279 3 883 Workers’ compensation insurance 654 565 Pay-roll tax and fringe benefits tax 6 796 6 216 On-costs on LSL not assumed by Crown 78 247 120 536 110 709 Employee related expenses of $0.7 million (2006-2007 - $1.0 million) have been incurred for various capital projects and are included in computer software costs, intangible costs and capital work in progress in Notes 11 and 12. Except as noted, there are no other employee related payments included in asset and expenditure accounts.
(b) Other operating expenses Auditor’s remuneration Audit or review of financial reports 274 231 Operating lease rental expense Minimum lease payments 9 724 9 731 Maintenance (i) 1 128 584 Insurance 152 120 Other Contractors’ and consultancy fees 13 901 11 431 Printing and advertising 3 938 3 230 Centralised corporate support charges 3 648 3 562 Computer maintenance and software licences 1 596 1 846 Data access fees 2 475 2 289 Training 865 860 Building maintenance and utilities 2 234 2 181 Minor plant, equipment and stores 886 1 180 Postal charges 390 565 Bank charges 1 941 2 424 Other 5 209 4 916 48 361 45 150
(c) Depreciation and amortisation expense Depreciation (Note 11) Computer hardware 2 564 2 584 Computer software 1 443 1 849 Office equipment 757 435 Office furniture 945 945 5 709 5 813 Amortisation (Note 12) 6 572 7 799
Total depreciation and amortisation 12 281 13 612
(d) Grants and subsidies FHOGS (ii) 325 421 323 960 Department of Lands (iii) 22 182 21 510 Other 169 169 347 772 345 639
(e) Other expenses Compensation payments (Statute Barred Infringements) (iv) - 71 - 71

New South Wales Treasury Notes to the Financial Statements 30 June 2008
56 - OFM 2007-08 Annual Report
2008 $'000
2007 $'000
(i) Reconciliation – Total Maintenance Maintenance expense – contracted labour and other( non-employee related), as above
1 128 584
Maintenance related employee expenses included in Note 2(a) 5 141 3 378 Total maintenance expenses included in Note 2(a) + 2(b) 6 269 3 962
(ii) Total FHOGS payments 338 745 338 406 Less Returns – payments on contracts not settled (11 172) (11 480) Refunds – ineligible payments (2 742) (2 628) Penalties on wrongful claims (643) (615) Add Write-off of Refunds due 1 233 277 Net FHOGS payments 325 421 323 960
(iii) The NSW Department of Lands provides land information and valuation services required to administer the Land Tax Management Act 1956.
(iv) In 2007-2008 , no compensation payments were due to clients of the SDRO who were financially
disadvantaged due to infringements reaching a statute barred status(2006 -2007 $71 000).

New South Wales Treasury Notes to the Financial Statements 30 June 2008
OFM 2007-08 Annual Report - 57
3. REVENUES
2008 $'000
2007 $'000
(a) Sale of goods and services Sale of Goods Sale of publications 18 18 Rendering of Services Land tax search fees 2 705 2 693 Administration fees 517 477 Infringement processing fees 25 436 25 429 Other (i) 8 702 135 37 378 28 752 Infringement processing fees represent a service provided by the SDRO to a range of local government and public sector clients.
(b) Investment revenue
Interest 2 835 1 880 2 835 1 880 (c) Retained taxes, fees and fines Fees Collection fees 431 260 431 260 Annulment fees imposed by the SDRO are recognised as revenues as they are controlled by The Treasury and can be deployed for the achievement of its objectives. They are not required to be paid to the Consolidated Fund.
(d) Other revenue
Crown Assets and Liabilities Management (i) - 5 510 Other (ii) 852 438 852 5 948 (i) Includes $8.6 million (2006-2007 $5.5 million) relating to recoupment
of administration costs composed mainly of salaries and accommodation for OFM employees relating to Crown Assets and Liability Management. These were previously reported under (d) Other revenue.
(ii) Primarily attributable to reimbursement of legal fees associated with
debt recovery action.
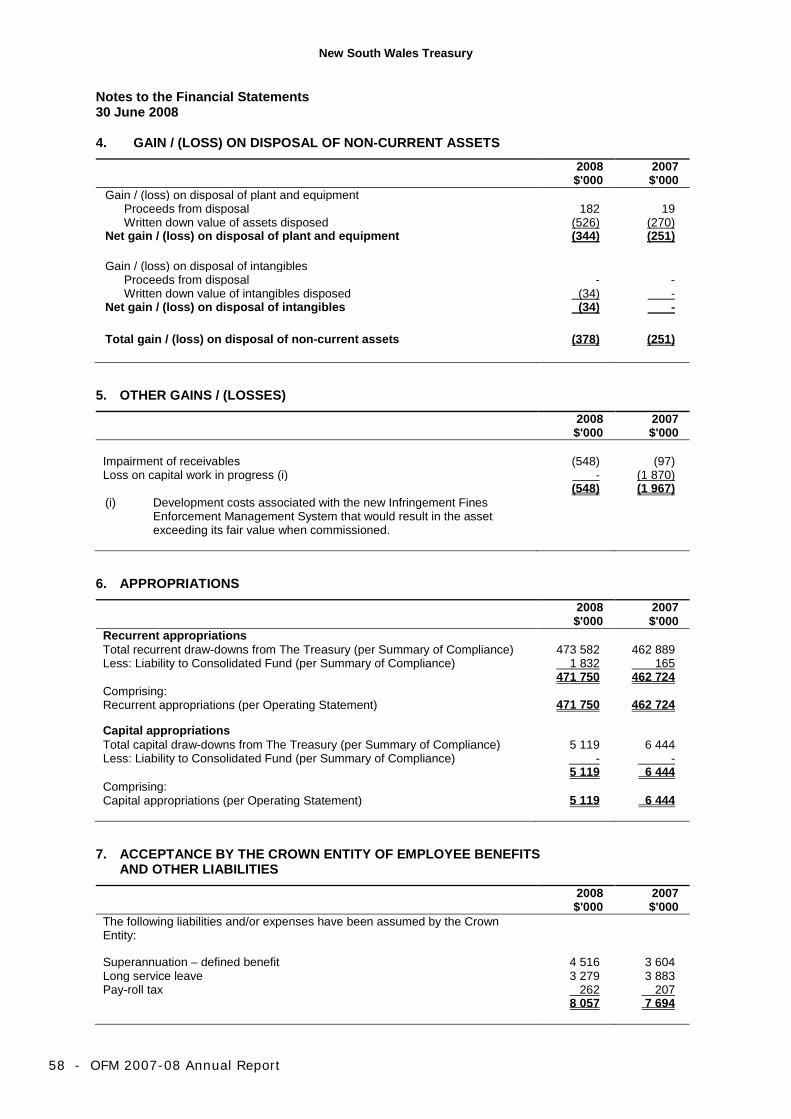
New South Wales Treasury Notes to the Financial Statements 30 June 2008
58 - OFM 2007-08 Annual Report
4. GAIN / (LOSS) ON DISPOSAL OF NON-CURRENT ASSETS
2008 $'000
2007 $'000
Gain / (loss) on disposal of plant and equipment Proceeds from disposal 182 19 Written down value of assets disposed (526) (270)
Net gain / (loss) on disposal of plant and equipment (344) (251) Gain / (loss) on disposal of intangibles
Proceeds from disposal - - Written down value of intangibles disposed (34) -
Net gain / (loss) on disposal of intangibles (34) - Total gain / (loss) on disposal of non-current assets (378) (251)
5. OTHER GAINS / (LOSSES)
2008 $'000
2007 $'000
Impairment of receivables (548) (97) Loss on capital work in progress (i) - (1 870) (548) (1 967) (i) Development costs associated with the new Infringement Fines
Enforcement Management System that would result in the asset exceeding its fair value when commissioned.
6. APPROPRIATIONS
2008 $'000
2007 $'000
Recurrent appropriations Total recurrent draw-downs from The Treasury (per Summary of Compliance) 473 582 462 889 Less: Liability to Consolidated Fund (per Summary of Compliance) 1 832 165 471 750 462 724 Comprising: Recurrent appropriations (per Operating Statement) 471 750 462 724
Capital appropriations Total capital draw-downs from The Treasury (per Summary of Compliance) 5 119 6 444 Less: Liability to Consolidated Fund (per Summary of Compliance) - - 5 119 6 444 Comprising: Capital appropriations (per Operating Statement) 5 119 6 444
7. ACCEPTANCE BY THE CROWN ENTITY OF EMPLOYEE BENEFITS
AND OTHER LIABILITIES
2008 $'000
2007 $'000
The following liabilities and/or expenses have been assumed by the Crown Entity:
Superannuation – defined benefit 4 516 3 604 Long service leave 3 279 3 883 Pay-roll tax 262 207 8 057 7 694

New South Wales Treasury Notes to the Financial Statements 30 June 2008
OFM 2007-08 Annual Report - 59
8. PROGRAMS / ACTIVITIES OF THE TREASURY
(a) Program 52.1.1 Better public services and a stronger NSW economy Objective: Ensuring State finances support the delivery and long run affordability of
services. Implementing policy settings that promote a competitive State economy.
(b) Program 52.2.1 All revenue is collected Objective: Ensure effective and equitable collection of revenue from taxes, duties and
other sources due to the State of New South Wales.
(c) Program 52.3.1 All fines are processed and enforced correctly and on time Objective: Ensure effective and timely infringement processing and fine enforcement
services.
(d) Program 52.4.1 Eligible applicants receive their benefits Objective: Ensure eligible applicants receive payments due under State Government
schemes.
Advice on procurement policy performed by the Department of Commerce was transferred to OFM on 1July 2007. The following table summarises the expenses and revenues recognised by the Department of Commerce in 2007 under program 51.1.3 - NSW Procurement (in part) and, by the OFM in 2008 under program 52.1.1 - Better Public Services and a Stronger NSW Economy (in part).
OFM 2008
Program 52.1.1
$'000
Department of Commerce
2007 Program 51.1.3
$'000
Expenses Operating expenses Employee related 1 023 657 Other operating expenses 595 215 Depreciation and amortisation 5 - Other expenses - - Total Expenses excluding losses 1 623 872 Total Revenue - - Gain/(loss) on disposal - - Net Cost of Services 1 623 872

New South Wales Treasury Notes to the Financial Statements 30 June 2008
60 - OFM 2007-08 Annual Report
9. CURRENT ASSETS – CASH AND CASH EQUIVALENTS
2008 $'000
2007 $'000
Cash at bank and on hand 33 576 21 958 33 576 21 958
For the purposes of the Cash Flow Statement, cash and cash equivalents include cash at bank and cash on hand. Cash and cash equivalent assets recognised in the Balance Sheet are reconciled at the end of the financial year to the Cash Flow Statement as follows:
Cash and cash equivalents (per Balance Sheet) 33 576 21 958
Closing cash and cash equivalents (per Cash Flow Statement) 33 576 21 958
Refer to Note 21 for details regarding credit risk, liquidity risk and market risk arising from financial instruments. 10. CURRENT/NON-CURRENT ASSETS – RECEIVABLES
2008 $'000 2007
$'000 Current
Sale of goods and services (i) 5 566 5 489 Other (i) 847 861 Prepayments 964 1 243 GST receivable from ATO 638 432 FBT receivable 38 44 Interest 1 624 997 FHOGS (ii) 3 462 4 182 Less: Allowance for impairment 783 2 679 235 3 947 12 356 13 013
Non-Current
Prepayments 41 2
Total 12 397 13 015
(i) Sales of goods and services and Other As at 30 June 2008 $ 5.3 million, (2006-2007 $5.1 million) receivables for the sale of goods and services is attributable to services provided to SDRO clients, including councils and other statutory bodies. $ 1.9 million, (2006-2007 $2.4 million) represents the value of services provided for which invoices are yet to issue. The total receivables position as at 30 June 2008 was as follows:
2008 $'000
2007 $'000
Total receivables Current amount 2 243 2 367 Overdue amount 4 170 3 983 6 413 6 350 Less: Allowance for impairment - - 6 413 6 350

New South Wales Treasury Notes to the Financial Statements 30 June 2008
OFM 2007-08 Annual Report - 61
Overdue Amounts
Receivable
Less than 3
months 3 to 6 months More than 6 months Total
Allowance for impairment
Net
2008 $’000
2007 $’000
2008 $’000
2007 $’000
2008 $’000
2007 $’000
2008 $’000
2007 $’000
2008 $’000
2007 $’000
2008 $’000
2007 $’000
Sales of goods and services
3 127 2 442 126 158 150 522 3 403 3 122 - - 3 403 3 122
Others 677 831 14 14 76 16 76 7 861 - - 767 861
Total 3 804 3 273 140 172 226 538 4 170 3 983 - - 4 170 3 983
Refer to Note 21 for credit risk, liquidity risk and market risk arising from financial instruments. (ii) FHOGS Debt The FHOGS debt is the result of Compliance audits of grants paid where applicants do not legally qualify as first home owners. In addition to seeking recovery of grant payments, penalties are imposed in accordance with FHOGS legislation on offending claims. A provision for impairment has been created for those outstanding amounts which are considered to be irrecoverable. The amounts are statutory receivables and are not classified as financial instruments. The total debt position as at 30 June 2008 was as follows:
2008 $'000
2007 $'000
Total debt Current amount 25 515 Overdue amount 3 531 3 732 3 556 4 247 Less: Allowance for impairment 783 235 2 773 4 012
Overdue Amounts
Receivable
Less than 3
months 3 to 6 months More than 6 months Total
Allowance for impairment*
Net
2008 $’000
2007 $’000
2008 $’000
2007 $’000
2008 $’000
2007 $’000
2008 $’000
2007 $’000
2008 $’000
2007 $’000
2008 $’000
2007 $’000
FHOGS
804
730
469
569
2 258
2 433
3 531
3 732
783
235
2 748
3 497 * The allowance for impairment relates to matters primarily greater than 90 days overdue. Movements in the provision for impaired overdue amounts are as follows:
2008 $'000
2007 $'000
Total Debt Opening balance 235 139 Provision for impairment recognised 548 96 783 235

New South Wales Treasury Notes to the Financial Statements 30 June 2008
62 - OFM 2007-08 Annual Report
11. NON-CURRENT ASSETS – PLANT & EQUIPMENT
Computer Hardware
$’000
Computer Software
$’000
Office Equipment
$’000
Office Furniture
$’000
Capital Work in
Progress $’000
Total
$’000 At 1 July 2007 – fair value
Gross carrying amount 16 811 7 992 5 195 17 040 7 488 54 526 Accumulated depreciation and impairment 11 036
5 250
1 296
10 059
-
27 641 Net carrying amount 5 775 2 742 3 899 6 981 7 488 26 885 At 30 June 2008 – fair value
Gross carrying amount 19 814 7 945 5 529 10 610 5 650 49 548 Accumulated depreciation and impairment 12 940
6 454
1 434
4 433
-
25 261 Net carrying amount 6 874 1 491 4 095 6 177 5 650 24 287
Reconciliation
A reconciliation of the carrying amount of each class of plant and equipment at the beginning and end of the current reporting period is set out below.
Computer Hardware
Computer Software
Office Equipment
Office Furniture
Capital Work in Progress
Total
$’000 $’000 $’000 $’000 $’000 $’000 Year ended 30 June 2008
Net carrying amount at start of year 5 775
2 742
3 899
6 981
7 488
26 885
Additions 182 44 133 577 4 679 5 615 Disposals (693) (239) (676) (7 007) - (8 615) Transfer to / (from) CWIP 3 514
148
877
-
(6 517)
(1 978)
Depreciation expense (2 564) (1 443) (757) (945) - (5 709) Other movements
Write back on disposal 660
239 619 6 571 - 8 089
Net carrying amount at end of year 6 874 1 491 4 095 6 177 5 650 24 287

New South Wales Treasury Notes to the Financial Statements 30 June 2008
OFM 2007-08 Annual Report - 63
Computer Hardware
Computer Software
Office Equipment
Office Furniture
Capital Work in Progress
Total
$’000 $’000 $’000 $’000 $’000 $’000 At 1 July 2006– fair value
Gross carrying amount 17 858 7 756 2 734 16 916 15 240 60 504 Accumulated depreciation and impairment 12 067
3 401
1 804
9 114
-
26 386 Net carrying amount 5 791 4 355 930 7 802 15 240 34 118 At 30 June 2007– fair value
Gross carrying amount 16 811 7 992 5 195 17 040 7 488 54 526 Accumulated depreciation and impairment 11 036
5 250
1 296
10 059
-
27 641 Net carrying amount 5 775 2 742 3 899 6 981 7 488 26 885
Reconciliation
A reconciliation of the carrying amount of each class of plant and equipment at the beginning and end of the previous reporting period is set out below.
Computer Hardware
Computer Software
Office Equipment
Office Furniture
Capital Work in Progress
Total
$’000 $’000 $’000 $’000 $’000 $’000 Year ended 30 June 2007 Net carrying amount at start of year 5 791
4 355
930
7 802
15 240
34 118
Additions 228 - 195 124 6 094 6 641 Disposals (3 705) - (1 123) - - (4 828) Transfer to / (from) CWIP 2 430
236
3 389
-
(11 976)
(5 921)
Depreciation expense (2 584) (1 849) (435) (945) - (5 813) Other movements
Loss on capital work in progress
- - - - ( 1 870) (1 870)
- 943 - - 4 558 Write back on
disposal 3 615 Net carrying amount at end of year 5 775 2 742 3 899 6 981 7 488 26 885

New South Wales Treasury Notes to the Financial Statements 30 June 2008
64 - OFM 2007-08 Annual Report
12. INTANGIBLE ASSETS
Computer Software
$’000 At 1 July 2007 Cost (gross carrying amount) 82 299 Accumulated amortisation and impairment 64 301 Net carrying amount 17 998 At 30 June 2008 Cost (gross carrying amount) 79 993 Accumulated amortisation and impairment 66 500 Net carrying amount 13 493
Computer Software
$’000 Year ended 30 June 2008 Net carrying amount at start of year 17 998 Additions: Internal development 1 978 Acquired separately 123 Disposals (4 407) Amortisation (recognised in “depreciation and amortisation”) (6 572) Other movements Write back on disposal 4 373 Net carrying amount at end of year 13 493
Computer Software
$’000 At 1 July 2006 Cost (gross carrying amount) 76 293 Accumulated amortisation and impairment 56 502 Net carrying amount 19 791 At 30 June 2007 Cost (gross carrying amount) 82 299 Accumulated amortisation and impairment 64 301 Net carrying amount 17 998
Computer Software
$’000 Year ended 30 June 2007 Net carrying amount at start of year 19 791 Additions 85 Amortisation (recognised in “depreciation and amortisation”) (7 799) Transfer to/ (from) CWIP 5 921 Net carrying amount at end of year 17 998

New South Wales Treasury Notes to the Financial Statements 30 June 2008
OFM 2007-08 Annual Report - 65
13. CURRENT LIABILITIES – PAYABLES
2008 $'000
2007 $'000
Accrued salaries, wages and on-costs 2 483 1 874 Creditors 8 097 3 775 10 580 5 649
14. CURRENT / NON-CURRENT LIABILITIES – PROVISIONS
2008 $'000
2007 $'000
Current Employee benefits and related on-costs Recreation leave 8 831 8 211 Provision for pay-roll tax on recreation leave liability 530 487 Provision for pay-roll tax on long service leave liability 1 599 1 562 Provision for on-costs on long service leave liability 1 024 887 Provision for fringe benefits tax 41 57 12 025 11 204 Non-current Employee benefits and related on-costs Provision for pay-roll tax on long service leave liability 85 82 Provision for on-costs on long service leave liability 49 46 134 128 Aggregate employee benefits and related on-costs Provisions – current 12 025 11 204 Provisions – non-current 134 128 Accrued salaries, wages and on-costs (Note 13) 2 483 1 874 14 642 13 206
15. CURRENT / NON–CURRENT LIABILITIES – OTHER
2008 $'000
2007 $'000
Current Lease incentive 8 74 Liability to the Consolidated Fund 1 832 165
1 840 239 Non-Current
Lease incentive 125 133
Total 1 965 372
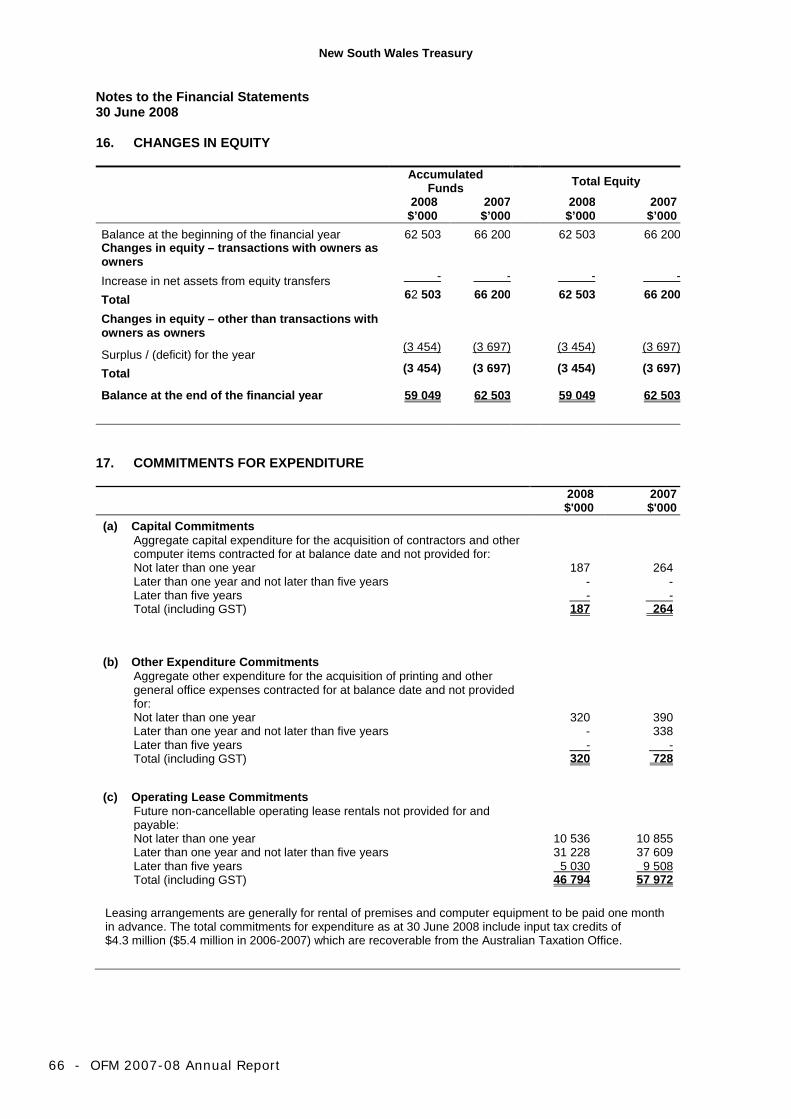
New South Wales Treasury Notes to the Financial Statements 30 June 2008
66 - OFM 2007-08 Annual Report
16. CHANGES IN EQUITY
Accumulated Funds Total Equity
2008 $’000 2007
$’000 2008 $’000
2007 $’000
Balance at the beginning of the financial year 62 503 66 200 62 503 66 200 Changes in equity – transactions with owners as owners
Increase in net assets from equity transfers - - - -
Total 62 503 66 200 62 503 66 200
Changes in equity – other than transactions with owners as owners
Surplus / (deficit) for the year (3 454) (3 697) (3 454) (3 697)
Total (3 454) (3 697) (3 454) (3 697)
Balance at the end of the financial year 59 049
62 503
59 049
62 503
17. COMMITMENTS FOR EXPENDITURE
2008 $'000
2007 $'000
(a) Capital Commitments Aggregate capital expenditure for the acquisition of contractors and other computer items contracted for at balance date and not provided for:
Not later than one year 187 264 Later than one year and not later than five years - - Later than five years - - Total (including GST) 187 264
(b) Other Expenditure Commitments Aggregate other expenditure for the acquisition of printing and other general office expenses contracted for at balance date and not provided for:
Not later than one year 320 390 Later than one year and not later than five years - 338 Later than five years - - Total (including GST) 320 728
(c) Operating Lease Commitments
Future non-cancellable operating lease rentals not provided for and payable:
Not later than one year 10 536 10 855 Later than one year and not later than five years 31 228 37 609 Later than five years 5 030 9 508 Total (including GST) 46 794 57 972
Leasing arrangements are generally for rental of premises and computer equipment to be paid one month in advance. The total commitments for expenditure as at 30 June 2008 include input tax credits of $4.3 million ($5.4 million in 2006-2007) which are recoverable from the Australian Taxation Office.
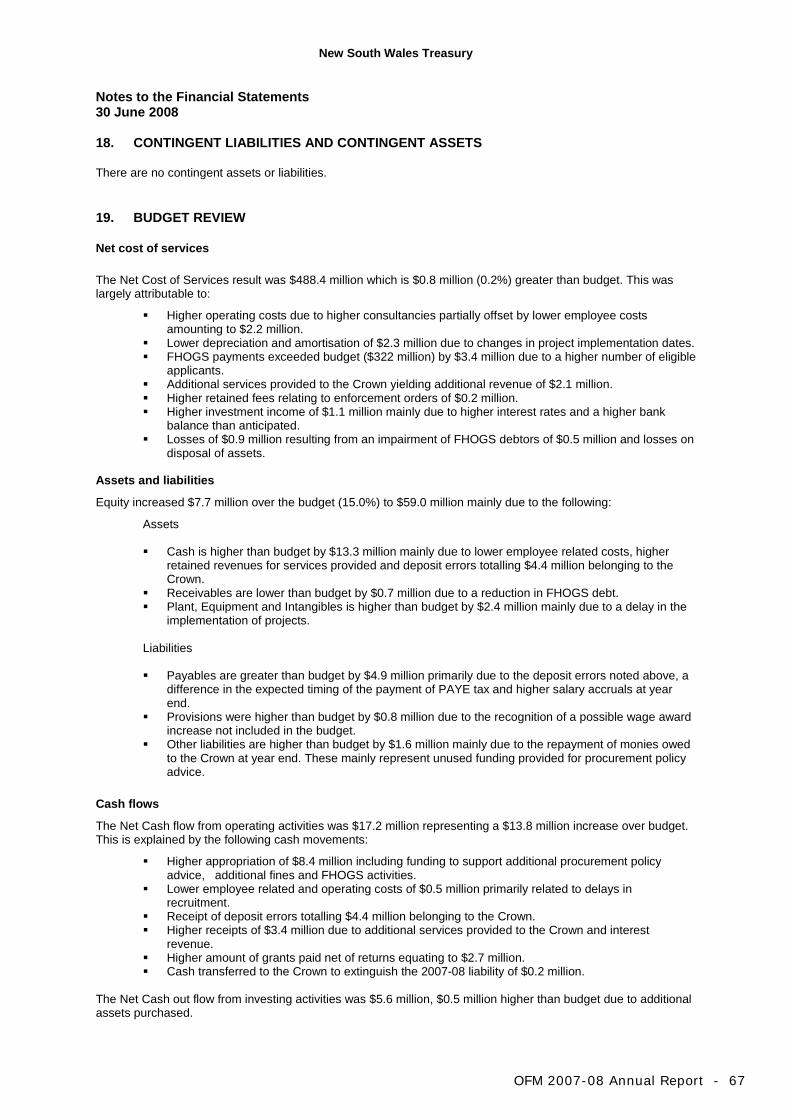
New South Wales Treasury Notes to the Financial Statements 30 June 2008
OFM 2007-08 Annual Report - 67
18. CONTINGENT LIABILITIES AND CONTINGENT ASSETS There are no contingent assets or liabilities. 19. BUDGET REVIEW Net cost of services The Net Cost of Services result was $488.4 million which is $0.8 million (0.2%) greater than budget. This was largely attributable to:
Higher operating costs due to higher consultancies partially offset by lower employee costs amounting to $2.2 million.
Lower depreciation and amortisation of $2.3 million due to changes in project implementation dates. FHOGS payments exceeded budget ($322 million) by $3.4 million due to a higher number of eligible
applicants. Additional services provided to the Crown yielding additional revenue of $2.1 million. Higher retained fees relating to enforcement orders of $0.2 million. Higher investment income of $1.1 million mainly due to higher interest rates and a higher bank
balance than anticipated. Losses of $0.9 million resulting from an impairment of FHOGS debtors of $0.5 million and losses on
disposal of assets. Assets and liabilities
Equity increased $7.7 million over the budget (15.0%) to $59.0 million mainly due to the following:
Assets Cash is higher than budget by $13.3 million mainly due to lower employee related costs, higher
retained revenues for services provided and deposit errors totalling $4.4 million belonging to the Crown.
Receivables are lower than budget by $0.7 million due to a reduction in FHOGS debt. Plant, Equipment and Intangibles is higher than budget by $2.4 million mainly due to a delay in the
implementation of projects. Liabilities Payables are greater than budget by $4.9 million primarily due to the deposit errors noted above, a
difference in the expected timing of the payment of PAYE tax and higher salary accruals at year end.
Provisions were higher than budget by $0.8 million due to the recognition of a possible wage award increase not included in the budget.
Other liabilities are higher than budget by $1.6 million mainly due to the repayment of monies owed to the Crown at year end. These mainly represent unused funding provided for procurement policy advice.
Cash flows
The Net Cash flow from operating activities was $17.2 million representing a $13.8 million increase over budget. This is explained by the following cash movements:
Higher appropriation of $8.4 million including funding to support additional procurement policy advice, additional fines and FHOGS activities.
Lower employee related and operating costs of $0.5 million primarily related to delays in recruitment.
Receipt of deposit errors totalling $4.4 million belonging to the Crown. Higher receipts of $3.4 million due to additional services provided to the Crown and interest
revenue. Higher amount of grants paid net of returns equating to $2.7 million. Cash transferred to the Crown to extinguish the 2007-08 liability of $0.2 million.
The Net Cash out flow from investing activities was $5.6 million, $0.5 million higher than budget due to additional assets purchased.
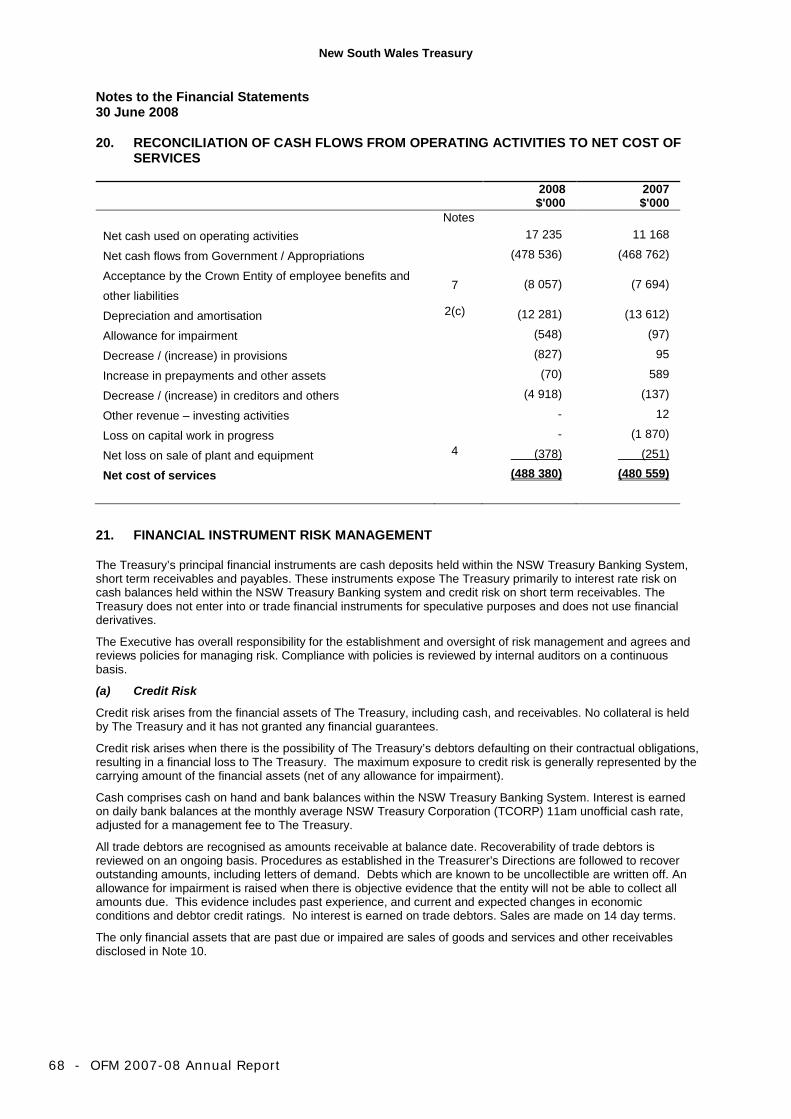
New South Wales Treasury Notes to the Financial Statements 30 June 2008
68 - OFM 2007-08 Annual Report
20. RECONCILIATION OF CASH FLOWS FROM OPERATING ACTIVITIES TO NET COST OF SERVICES
2008 $'000
2007 $'000
Notes Net cash used on operating activities 17 235 11 168
Net cash flows from Government / Appropriations (478 536) (468 762)
Acceptance by the Crown Entity of employee benefits and
other liabilities
7 (8 057) (7 694)
Depreciation and amortisation 2(c) (12 281) (13 612)
Allowance for impairment (548) (97)
Decrease / (increase) in provisions (827) 95
Increase in prepayments and other assets (70) 589
Decrease / (increase) in creditors and others (4 918) (137)
Other revenue – investing activities - 12
Loss on capital work in progress - (1 870)
Net loss on sale of plant and equipment 4 (378) (251)
Net cost of services (488 380) (480 559)
21. FINANCIAL INSTRUMENT RISK MANAGEMENT The Treasury’s principal financial instruments are cash deposits held within the NSW Treasury Banking System, short term receivables and payables. These instruments expose The Treasury primarily to interest rate risk on cash balances held within the NSW Treasury Banking system and credit risk on short term receivables. The Treasury does not enter into or trade financial instruments for speculative purposes and does not use financial derivatives.
The Executive has overall responsibility for the establishment and oversight of risk management and agrees and reviews policies for managing risk. Compliance with policies is reviewed by internal auditors on a continuous basis.
(a) Credit Risk
Credit risk arises from the financial assets of The Treasury, including cash, and receivables. No collateral is held by The Treasury and it has not granted any financial guarantees.
Credit risk arises when there is the possibility of The Treasury’s debtors defaulting on their contractual obligations, resulting in a financial loss to The Treasury. The maximum exposure to credit risk is generally represented by the carrying amount of the financial assets (net of any allowance for impairment).
Cash comprises cash on hand and bank balances within the NSW Treasury Banking System. Interest is earned on daily bank balances at the monthly average NSW Treasury Corporation (TCORP) 11am unofficial cash rate, adjusted for a management fee to The Treasury.
All trade debtors are recognised as amounts receivable at balance date. Recoverability of trade debtors is reviewed on an ongoing basis. Procedures as established in the Treasurer’s Directions are followed to recover outstanding amounts, including letters of demand. Debts which are known to be uncollectible are written off. An allowance for impairment is raised when there is objective evidence that the entity will not be able to collect all amounts due. This evidence includes past experience, and current and expected changes in economic conditions and debtor credit ratings. No interest is earned on trade debtors. Sales are made on 14 day terms.
The only financial assets that are past due or impaired are sales of goods and services and other receivables disclosed in Note 10.

New South Wales Treasury Notes to the Financial Statements 30 June 2008
OFM 2007-08 Annual Report - 69
(b) Liquidity Risk
Liquidity risk is the risk that The Treasury will be unable to meet its payment obligations when they fall due. The Treasury continuously manages risk through monitoring future cash flows and commitment maturities. No assets have been pledged as collateral and the Treasury’s exposure to liquidity risk is deemed insignificant based on prior periods’ data and current assessment of risk.
The liabilities are recognised for amounts due to be paid in the future for goods or services received, whether or not invoiced. Amounts owing to suppliers (which are unsecured) are settled in accordance with the policy set out in Treasurer’s Direction 219.01. If trade terms are not specified, payment is made no later than the end of the month following the month in which an invoice or a statement is received. Treasurer’s Direction 219.01 allows the Minister to award interest for late payment. No interest for late payment was made during the 2007-2008 year (2006-2007 $nil). The table below summarises the maturity profile of The Treasury’s financial liabilities together with any interest rate exposure.
Maturity Analysis $’000
Carrying Amount
<1 Year 1 – 5 Years >5 Years
2008 Financial liabilities Accrued salaries, wages and on-costs 2 483 2 483 - - Creditors 8 097 8 097 - - Total 10 580 10 580 - - 2007 Financial liabilities Accrued salaries, wages and on-costs 1 874 1 874 - - Creditors 3 775 3 775 - - Total 5 649 5 649 - -
(c) Market Risk Market risk is the risk that the fair value or future cash flows of a financial instrument will fluctuate because of changes in market prices. The Treasury’s exposure to market risk is primarily through interest rates on cash and cash equivalents. The Treasury does not have any exposure to foreign currency risk, does not enter into commodity contacts and does not trade in derivatives of any nature. The effect on profit and equity due to a reasonably possible change in risk variable is outlined below for interest rate risk. A reasonably possible change of +/- 1 per cent is used, consistent with current trends in interest rates. The basis will be reviewed annually and amended where there is a structural change in the level of interest rate volatility. The Treasury’s exposure to interest rate risk follows.

New South Wales Treasury Notes to the Financial Statements 30 June 2008
70 - OFM 2007-08 Annual Report
Interest rate risk $’000
Carrying amount
-1% +1%
Profit Equity Profit Equity 2008 Financial assets Cash and cash equivalents 33 576 (336) (336) 336 336 Receivables 6 413 - - - - Financial liabilities Payables 10 580 - - - - Total increase / decrease) (336) (336) 336 336 2007 Financial assets Cash and cash equivalents 21 958 (220) (220) 220 220 Receivables 6 350 - - - - Financial liabilities Payables 5 649 - - - - Total increase / decrease) (220) (220) 220 220
(d) Fair Value The carrying value of receivables less any impairment provision and payables is a reasonable approximation of their fair value due to their short term nature.

New South Wales Treasury Notes to the Financial Statements 30 June 2008
OFM 2007-08 Annual Report - 71
22. TRUST FUNDS Monies held in trust for the Crown Entity and others are not recognised in the financial statements, as the OSR cannot use them for the achievement of its objectives. They are held in either a trust bank account or public monies bank account. The following is a summary of the transactions in these accounts: (a) Unclaimed Money Trust Accounts Testamentary
& Trust Common Fund
Testamentary & Trust Interest
Companies Liquidation Total
2008 $'000
2007 $'000
2008 $'000
2007 $'000
2008 $'000
2007 $'000
2008 $'000
2007 $'000
Cash balance at the beginning of the financial year 4 340 4 313 6 769 6 259 1 007 1 170 12 116 11 742 Add: Receipts 14 27 601 510 2 2 617 539 Less: Expenditure - - - - - 2 - 2 Transfers to Crown - - - - 253 163 253 163 Cash balance at the end of the financial year 4 354 4 340 7 370 6 769 756 1 007 12 480 12 116
(b) SDRO Client Funds Account - Fines
2008 $'000
2007 $'000
Cash balance at the beginning of the financial year 14 585 13 131 Add: Receipts 122 483 119 146 Less: Payments 122 524 117 692 Cash balance at the end of the financial year 14 544 14 585
Funds held in this account represent amounts collected on behalf of clients. These funds are remitted to clients in the month following collection.
(c) SDRO Public Monies Accounts - Fines 2008
$'000 2007 $'000
Cash balance at the beginning of the financial year 5 567 8 468 Add: Receipts 155 075 127 650 Less: Payments 152 048 130 551 Cash balance at the end of the financial year 8 594 5 567
Amounts held in the Public Monies account for the SDRO represent receipts collected during the debt management process, on behalf of clients that are remitted in the month following receipt.

72 - O
FM 2
007-0
8 A
nnual R
eport
New
South Wales Treasury
23. ADMINISTERED ASSETS – RECEIVABLES (a) Tax Receivables
Assets administered by OSR for the Crown Entity are primarily tax and fine receivables. They are not recognised in the Balance Sheet. 2008
$'000 2007 $'000
Current and instalment amounts 752 015 828 975 Overdue amounts 159 531 174 263
911 546 1 003 238 Less: allowance for impairment 23 362 31 423 Net receivables 888 184 971 815
The receivables above represent taxes owed by clients at the close of business on 30 June 2008 and exclude any credit balances, which are disclosed separately in Note 24. Included in current amounts are matters totalling $504.7 million ($468.9 million 2006-2007) that are under objection or appeal. Current and Instalment Amounts
The following is a summary of receivable balances by tax type: Current Instalments Total Allowance for
impairment Net
2008 $'000
2007 $'000
2008 $'000
2007 $'000
2008 $'000
2007 $'000
2008 $'000
2007 $'000
2008 $'000
2007 $'000
Duties (ii) 559 023 582 439 - - 559 023 582 439 (1 481) (1 668) 557 542 580 771 Pay-roll tax 35 305 36 527 - - 35 305 36 527 (5 048) (6 303) 30 257 30 224 Land tax 127 411 186 191 9 086 14 341 136 497 200 532 (145) (159) 136 352 200 373 Parking space levy 8 311 8 411 - - 8 311 8 411 (101) (85) 8 210 8 326 Accommodation levy - 23 - - - 23 - - - 23 Club gaming devices (i) 3 657 163 8 549 - 12 206 163 - - 12 206 163 Hotel gaming devices 673 880 - - 673 880 - - 673 880 Total receivables 734 380 814 634 17 635 14 341 752 015 828 975 (6 775) (8 215) 745 240 820 760
(i) For the final quarter in 2007-2008, approved clubs can pay their gaming machine tax in three equal instalments without being charged interest
for the late payment. The scheme aims to assist clubs demonstrating hardship. (ii) Duties receivables include an assessment for $460.9 million consisting of $258.9 million duty and $202 million interest ($423.7 million consisting of
$258.9 million duty and $164.8 million interest in 2006-2007) which is subject to appeal in the Supreme Court. The matter is currently in the legal discovery phase. The Chief Commissioner of State Revenue does not believe that there are grounds for impairing the receivable at this time.

OFM
2007-0
8 A
nnual R
eport - 7
3
New
South Wales Treasury
Overdue Amounts
Less than 30 days
31 - 90 days Greater than 90 days
Total Allowance for impairment*
Net
2008 $'000
2007 $'000
2008 $'000
2007 $'000
2008 $'000
2007 $'000
2008 $'000
2007 $'000
2008 $'000
2007 $'000
2008 $'000
2007 $'000
Duties 810 1 097 1 465 2 655 7 346 9 384 9 621 13 136 (1 989) (2 671) 7 632 10 465 Pay-roll tax 6 313 2 902 6 586 6 577 26 483 43 521 39 382 53 000 (12 890) (18 466) 26 492 34 534 Land tax 3 646 11 715 13 671 10 737 90 258 81 483 107 575 103 935 (1 509) (1 865) 106 066 102 070 Parking space levy 6 43 - 177 1 443 2 001 1 449 2 221 (199) (206) 1 250 2 015 Club gaming devices 850 301 - - 69 51 919 352 - - 919 352 Hotel gaming devices - - 16 228 569 1 391 585 1 619 - - 585 1 619 Total receivables 11 625 16 058 21 738 20 374 126 168 137 831 159 531 174 263 (16 587) (23 208) 142 944 151 055
* The allowance for impairment relates to matters primarily greater than 90 days overdue. Recovery of receivables is reviewed on an ongoing basis. Debts, which are known to be uncollectible, are written off. An allowance for impairment is raised when there is objective evidence that the entity will not be able to collect all amounts due. The credit risk is the carrying amount (net of any allowance for impairment). Interest is charged on overdue receivables in accordance with S22 of the Tax Administration Act 1996. The carrying amount approximates fair value. Debt recovery action may result in negotiated payment arrangements or the initiation of legal debt recovery procedures, if clients are unwilling to pay. Land Tax Under the Land Tax Management Act 1956, a charge is held over land owned by taxpayers for unpaid land tax. If normal recovery procedures have been unsuccessful, a caveat is generally registered on the title until the debt is paid.

74 - O
FM 2
007-0
8 A
nnual R
eport
New
South Wales Treasury
(b) Fine Receivables (SDRO) 2008
$'000 2007 $'000
Opening balance 855 155 790 841 Movement excluding write off adjustment 43 272 64 314 Write off adjustment (37 380) - 861 047 855 155 Less: application of AAS29 (i) 609 298 617 209 Closing balance 251 749 237 946
(i) Receivables that do not meet the asset recognition criteria.
$0.5 million (2006-2007 $0.5 million) being repaid by referring agencies to the SDRO is not included in the receivables reported above.
The following is a summary of receivable balances by year of enforcement:
Pre 2006 Pre 2006 Write off
Pre 2006 Post Write off
2006 2007 2008 Total AAS29 Net
Source $'000 $'000 $'000 $'000 $'000 $'000 $'000 $'000 $'000 Current (i) Infringement processing Bureau 264 090 (23 090) 241 000 50 568 54 672 89 859 436 099 244 734 191 365 Court 167 333 - 167 333 34 042 32 719 40 409 274 503 227 994 46 509 State electoral office 10 907 (476) 10 431 158 388 2 970 13 947 8 884 5 063 Sheriff's office 10 760 (59) 10 701 2 117 3 159 2 269 18 246 17 384 862 Other 17 329 - 17 329 10 580 3 074 3 110 34 093 26 307 7 786 Historical (ii) Warrant Index Unit (WIU) 51 185 - 51 185 36 668 3 51 892 51 816 76 Road and Traffic Authority (RTA) 44 160 (13 113) 31 047 17 11 1 192 32 267 32 179 88 Total historical and current fines 565 764 (36 738) 529 026 97 518 94 691 139 812 861 047 609 298 251 749 RTA sanction costs (iii) 5 769 (642) 5 127 789 1 081 2 355 9 352 - 9 352 Total owing 571 533 (37 380) 534 153 98 307 95 772 142 167 870 399 609 298 261 101
(i) Current fines are those referred to SDRO following its establishment in 1998. (ii) Historical fines are those that were referred to the SDRO on its establishment from the WIU and the RTA. Amounts are owing in each of the years as
they have been enforced over a period of time. (iii) RTA sanction costs reported above are paid to the RTA when collected. (iv) $37.4 million of fine receivables approved for write off prior to 30 June 2008 are included in the above figures and will be written off in the subsidiary
ledger in 2008-2009.

New South Wales Treasury Notes to the Financial Statements 30 June 2008
OFM 2007-08 Annual Report - 75
24. ADMINISTERED LIABILITIES Credit balances against tax receivables have not been netted off against the receivables reported in Note 23 and are required to be shown separately as administered liabilities.
2008
$'000 2007 $'000
Duties 4 528 5 138 Pay-roll tax 6 964 5 061 Land tax 8 060 8 791 Parking space levy 380 53 Tax equivalents - - Club gaming devices - 1 Hotel gaming devices 17 16 Totalizator tax on and off course totes - 4 Insurance protection tax 15 1 Fines 400 38 Total administered liabilities 20 364 19 103
The credit balances above are primarily matters awaiting final assessments pending receipt of additional information. Credit situations are also created where taxes are paid in advance or overpayments are to be refunded to clients. Credit balances for fines represent overpayments.
25. ADMINISTERED REVENUE – DEBTS WRITTEN OFF/REMISSIONS (a) Debts written off
Tax/Fines
$'000
2008 Penalties/
Interest $'000
Total $'000
Tax/Fines $'000
2007 Penalties/
Interest $'000
Total $'000
Duties 4 069 2 599 6 668 1 051 301 1 352 Parking space levy 3 9 12 2 2 4 Pay-roll tax 13 603 9 827 23 430 6 967 3 746 10 713 Land tax 858 620 1 478 1 079 262 1 341 Club gaming devices 32 13 45 272 83 355 Hotel gaming devices 500 303 803 35 15 50 Insurance protection tax 36 - 36 - - - Total debts written off 19 101 13 371 32 472 9 406 4 409 13 815 A debt is only considered irrecoverable where it is either uneconomic to recover, the debtor cannot be located, the personal or financial circumstances of the debtor does not warrant the taking of recovery action, legal proceedings through the courts have proved unsatisfactory or legal advice suggests follow up would be ineffective.

New South Wales Treasury Notes to the Financial Statements 30 June 2008
76 - OFM 2007-08 Annual Report
(b) Remissions
In accordance with the Taxation Administration Act 1996 administered by OSR, the Chief Commissioner or his delegate has the discretionary power to remit partially or wholly a statutory penalty and/or interest. Penalties and interest remitted during the year amounted to: 2008 2007 Penalties Interest Total Penalties Interest Total
$'000 $'000 $'000 $'000 $'000 $'000 Duties 93 4 057 4 150 110 1 782 1 892 Parking space levy 1 1 118 1 119 7 1 924 1 931 Pay-roll tax 226 10 208 10 434 502 5 930 6 432 Land tax - 13 922 13 922 - 11 818 11 818 Accommodation levy - 56 56 - - - Health insurance levies - - - - 448 448 Club gaming devices - 39 39 - 11 11 Hotel gaming devices - 37 37 - 17 17 Fixed odds sports betting - 1 1 - - - Totalizator tax on and off course totes - 10 10 - 6 6 Total remissions 320 29 448 29 768 619 21 936 22 555
Interest and penalty can be remitted in part or full if the client can provide a satisfactory explanation for the default. Land tax remission reversals of $40 000 ($4 000 2006-2007) related to prior years have not been included.
26. ADMINISTERED EXPENSES – OTHER During the year, OSR incurred the following expenses on behalf of the Crown Entity: 2008
$'000 2007 $'000
Act of Grace payments 536 7 413 Petroleum subsidies (i) 42 143 40 931 Court imposed interest payments 2 213 1 114 Unclaimed money refund - S14 Public Finance and Audit Act 95 89 Bad debts expense (iv) 24 411 19 116 Land tax discounts (ii) 15 909 15 996 GST rebate - Clubs (iii) 18 848 19 267 Total administered expenses 104 155 103 926
(i) Petroleum subsidies
Petroleum subsidies are paid to petroleum distributors to enable northern NSW retailers to compete with Queensland retailers who are provided with a subsidy by the Queensland Government.
(ii) Land tax discounts
A 1.5 per cent discount is offered to land tax clients for full payment of their liability by the first instalment date.
(iii) GST rebate – Clubs
The GST rebate is paid to clubs to compensate for the impact of the GST and commenced during 2004-2005. It is based on gaming profits and is paid quarterly.
(iv) Bad debts expense During 2007-2008 the allowance for impairment includes interest accruing on overdue receivables. Adjustments reducing the impairment allowance by $1.4 million for 2007-2008 and increasing the comparative for 2006-2007 by $3.6 million (2005-2006 $4.6 million) have been included.

New South Wales Treasury Notes to the Financial Statements 30 June 2008
OFM 2007-08 Annual Report - 77
27. ADMINISTERED REVENUE - CONSOLIDATED FUND Administered revenue information is presented on a revenue earned (accruals) and revenue collected (cash) basis. Actual
2008 $'000
Budget 2008 $'000
Actual 2007 $'000
(a) Revenue earned Taxes, penalties and interest Duties (i) 5 539 719 5 269 400 5 952 131 First home purchase scheme - - 1 Total duties 5 539 719 5 269 400 5 952 132 Parking space levy (i) 50 165 51 000 52 004 Pay-roll tax (i) (ii) 7 043 876 6 763 000 6 440 454 Land tax (i) (ii) 1 968 378 1 752 000 2 065 665 Accommodation levy (i) 32 - - Health insurance levy (i) 125 363 123 000 119 665 Insurance protection tax 67 843 68 750 67 160 Gaming and racing Keno tax 7 687 7 900 7 668 Totalizator tax on and off course totes (i) 141 265 154 200 147 022 Fixed odds sports betting (i) 5 662 4 961 5 822 Fixed odds racing betting 294 404 414 Footy TAB 665 783 724 Club gaming devices (i) (iv) 608 986 623 000 661 056 Hotel gaming devices (i) 407 383 438 000 446 881 Total gaming and racing 1 171 942 1 229 248 1 269 587 Total taxes, penalties and interest 15 967 318 15 256 398 15 966 667 Fines (vi) Motor traffic fines (iii) 245 493 191 200 207 829 Other fines 1 358 1 500 888 Court fines 6 851 6 500 6 294 Fees 37 169 32 800 29 254 Total fines 290 871 232 000 244 265 Total taxes, fines, penalties and interest 16 258 189 15 488 398 16 210 932 Other Tax equivalents 751 427 421 300 605 623 Unclaimed money 3 256 19 000 11 344 Other revenue 609 - 1 349 Total other 755 292 440 300 618 316 Total revenue earned 17 013 481 15 928 698 16 829 248

New South Wales Treasury Notes to the Financial Statements 30 June 2008
78 - OFM 2007-08 Annual Report
(i) Included in the revenue earned figures are interest and penalties amounting to: 2008
$'000 2007 $'000
Duties (iv) 43 230 191 694 Parking space levy 1 801 3 533 Pay-roll tax 27 718 31 395 Land tax 34 926 31 528 Accommodation levy 32 - Health insurance levy - 746 Totalizator tax on and off course totes 10 6 Fixed odds sports betting 1 - Club gaming devices 165 119 Hotel gaming devices 256 447 Total 108 139 259 468
(ii) The budget for payroll tax and land tax include consolidation elimination estimates for public sector
agencies of $803 million and $2 million respectively. (iii) $13.8 million (2006-2007 $18.9 million) has been recognised in motor traffic fine revenue that relates
to the increase in recoverable fines for the current year (refer to Note 23 (b)). (iv) For the final quarter in 2007-2008, approved clubs can pay their gaming machine tax in three equal
instalments without being charged interest for the late payment. The scheme aims to assist clubs demonstrating financial hardship.
(v) $187 000 relating to the reversal of a prior period assessment for Debits tax has not been included. (vi) The following table provides a reconciliation of the comparative for 2007. The change in presentation
is a result of the continued integration of the fine infringement and fine debt recovery operations. 2007
$'000 2007 Comparative
$’000 Motor
traffic Fees Courts Other Total
Infringement processing Traffic 84 963 84 963 - - - 84 963 Parking 10 041 10 041 - - - 10 041 Red light camera 9 670 9 670 - - - 9 670 Speed camera 32 334 32 334 - - - 32 334 Other revenue 5 730 2 251 3 479 - - 5 730 142 738 139 259 3 479 - - 142 738 Debt recovery Motor traffic 69 615 68 304 1 311 - - 69 615 Local courts 5 782 266 - 5 516 - 5 782 Enforcement 24 464 - 24 464 - - 24 464 Other 1 258 - - 778 480 1 258 Electoral 408 - - - 408 408 101 527 68 570 25 775 6 294 888 101 527 Total fines 244 265 207 829 29 254 6 294 888 244 265

New South Wales Treasury Notes to the Financial Statements 30 June 2008
OFM 2007-08 Annual Report - 79
Actual
2008 $'000
Actual 2007 $'000
(b) Revenue collected Taxes, penalties and interest Duties 5 555 205 5 424 915 First home purchase scheme 16 28 Total duties 5 555 221 5 424 943 Parking space levy 51 507 47 767 Pay-roll tax 7 026 756 6 399 998 Land tax 1 996 776 1 954 704 Health insurance levy 125 362 119 218 Insurance protection tax 67 821 67 381 Gaming and racing Keno tax 7 687 7 668 Totalizator tax on and off course totes 141 250 147 021 Fixed odds sports betting 5 660 5 822 Fixed odds racing betting 294 414 Footy TAB 665 724 Club gaming devices 596 292 663 041 Hotel gaming devices 407 786 446 660 Total gaming and racing 1 159 634 1 271 350 Total taxes, penalties and interest (i) 15 983 077 15 285 361 Fines (ii) Motor Traffic fines 231 690 188 914 Other fines 1 358 888 Court fines 6 851 6 294 Fees 37 169 29 254 Total fines 277 068 225 350 Total taxes, fines, penalties and interest 16 260 145 15 510 711 Other Tax equivalents 751 427 605 582 Unclaimed money 3 256 11 344 Other revenue 609 1 349 Total other 755 292 618 275 Total revenue collected 17 015 437 16 128 986
(i) $187 000 relating to a refund of debits tax for a prior period has not been included. (ii) The following table provides a reconciliation of the comparative for 2006-2007. The change in presentation
is a result of the continued integration of the fine infringement and fine debt recovery operations.

New South Wales Treasury Notes to the Financial Statements 30 June 2008
80 - OFM 2007-08 Annual Report
28. ADMINISTERED CONTINGENT LIABILITIES AND CONTINGENT ASSETS There are currently 186 matters where the Crown Solicitor is acting on behalf of The Treasury. The Crown Solicitor is unable to provide an estimate of settlement for these matters.
End of Audited Financial Statements
2007 $'000
2007 Comparative $’000
Motor traffic
Fees Courts Other Total
Infringement processing Traffic 84 963 84 963 - - - 84 963 Parking 10 041 10 041 - - - 10 041 Red light camera 9 670 9 670 - - - 9 670 Speed camera 32 334 32 334 - - - 32 334 Other revenue 5 730 2 251 3 479 - - 5 730 142 738 139 259 3 479 - - 142 738 Debt recovery Motor traffic 50 700 49 389 1 311 - - 50 700 Local courts 5 782 266 - 5 516 - 5 782 Enforcement 24 464 - 24 464 - - 24 464 Other 1 258 - - 778 480 1 258 Electoral 408 - - - 408 408 82 612 49 655 25 775 6 294 888 82 612 Total fines 225 350 188 914 29 254 6 294 888 225 350

OFM 2007-08 Annual Report - 81
appendices
occupational health & safety
82
action plan for women 83
ethnic affairs priorities statement
83
disability strategic plan 83
privacy management plan 83
equal employment opportunity
84
expenditure on consultants 85
major assets acquired 86
accounts payable performance
86
credit card certification 86
overseas visits 87
committees and boards 88
energy management and performance
94
waste reduction and purchasing policy
94
Treasury circulars 95
publications 96
freedom of information 97
Treasurer’s legislation 98
annual reporting legislation
109
index 111
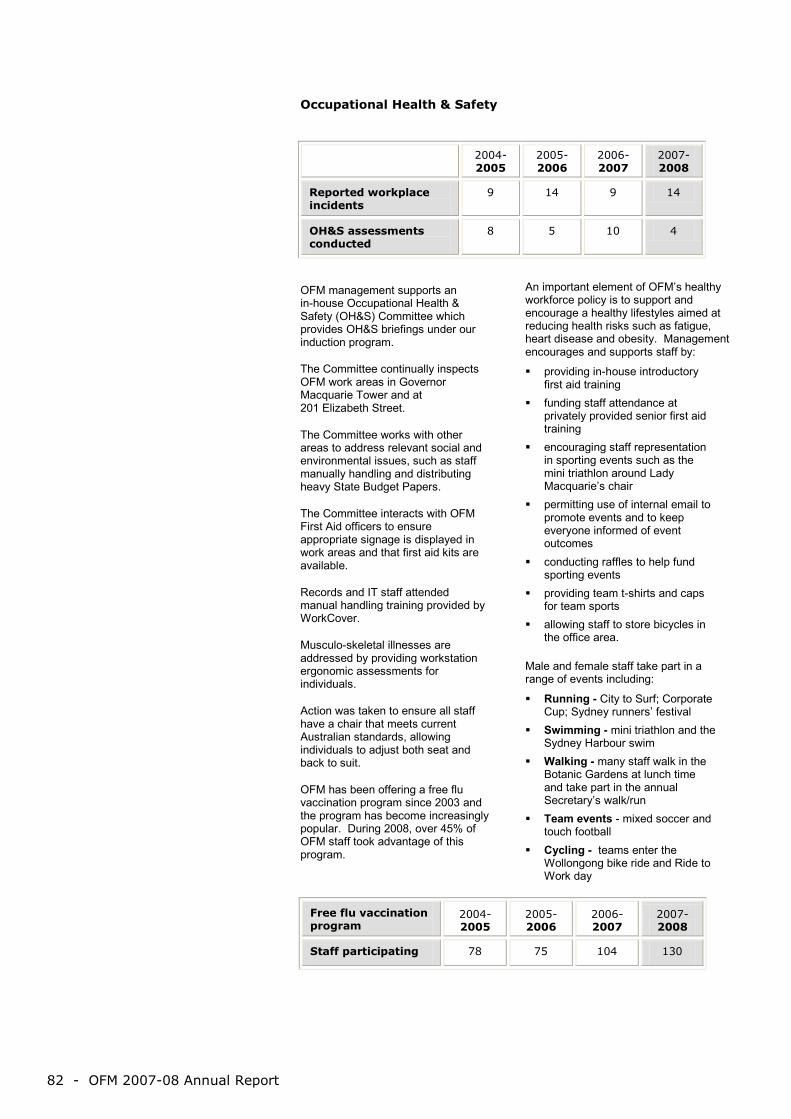
82 - OFM 2007-08 Annual Report
Occupational Health & Safety OFM management supports an in-house Occupational Health & Safety (OH&S) Committee which provides OH&S briefings under our induction program. The Committee continually inspects OFM work areas in Governor Macquarie Tower and at 201 Elizabeth Street. The Committee works with other areas to address relevant social and environmental issues, such as staff manually handling and distributing heavy State Budget Papers. The Committee interacts with OFM First Aid officers to ensure appropriate signage is displayed in work areas and that first aid kits are available. Records and IT staff attended manual handling training provided by WorkCover. Musculo-skeletal illnesses are addressed by providing workstation ergonomic assessments for individuals. Action was taken to ensure all staff have a chair that meets current Australian standards, allowing individuals to adjust both seat and back to suit. OFM has been offering a free flu vaccination program since 2003 and the program has become increasingly popular. During 2008, over 45% of OFM staff took advantage of this program.
An important element of OFM’s healthy workforce policy is to support and encourage a healthy lifestyles aimed at reducing health risks such as fatigue, heart disease and obesity. Management encourages and supports staff by:
providing in-house introductory first aid training
funding staff attendance at privately provided senior first aid training
encouraging staff representation in sporting events such as the mini triathlon around Lady Macquarie’s chair
permitting use of internal email to promote events and to keep everyone informed of event outcomes
conducting raffles to help fund sporting events
providing team t-shirts and caps for team sports
allowing staff to store bicycles in the office area.
Male and female staff take part in a range of events including:
Running - City to Surf; Corporate Cup; Sydney runners’ festival
Swimming - mini triathlon and the Sydney Harbour swim
Walking - many staff walk in the Botanic Gardens at lunch time and take part in the annual Secretary’s walk/run
Team events - mixed soccer and touch football
Cycling - teams enter the Wollongong bike ride and Ride to Work day
2004-2005
2005-2006
2006-2007
2007-2008
Reported workplace incidents
9 14 9 14
OH&S assessments conducted
8 5 10 4
Free flu vaccination program
2004-2005
2005-2006
2006-2007
2007-2008
Staff participating 78 75 104 130

OFM 2007-08 Annual Report - 83
Action Plan for Women
The Action Plan for Women seeks improved outcomes for women. It focuses on reducing violence promoting safe and equitable
workplaces maximising interest in economic
reforms promoting the position of women
in society improving access for education improving health and quality of
life. OFM continues to be a major contributor to the Lucy Mentoring Program, which provides female university students from non traditional educational backgrounds with access and exposure to women in senior business roles. During 2007-08, OFM Directors mentored four Lucy participants. Two former Lucy Program participants have been appointed to the Fast Track Graduate Program. Two OFM female officers featured on the cover of the NSW Government “Careers that count” brochure to promote accounting careers in Government. The brochure also contains a profile of one of our OFM female officers. Ethnic Affairs Priorities Statement
OFM is a policy based organisation that provides advice to Government and interacts with other government agencies. It does not provide direct services to the ethnic community. In undertaking its activities, OFM supports the objectives of service provision agencies. It has regard for the particular needs of the ethnic community when advised by those agencies. OFM is not a party to any current ethnic affairs agreements.
Disability Strategic Plan
OFM’s Disability Strategic Plan ensures that the needs of people with disabilities are taken into account in the way we go about our business. OFM’s main direct interaction with the community is via its website, which provides information about the State’s finances including the Budget Papers and policy and research papers. The website caters for broad accessibility requirements. It is plainly designed with limited use of images and is easy to navigate. It complies to level 2 of the W3C standards. In late 2007, a content management system was applied to the website to ensure its continuing accessabilty and easy use. All offices occupied by OFM provide access and amenities to visitors with disabilities. Privacy Management Plan
OFM’s privacy management plan complies with the NSW Privacy and Personal Information Protection Act, 1998. It outlines:
policy and practices
details of information held
review procedures. No privacy codes of practice were published and no specific exemptions were sought by OFM during 2007-08. OFM is a policy based organisation and generally does not access personal information in the course of its business dealings. OFM’s access to personal information is limited to its role in overseeing the operation of the Treasury Managed Fund.
Privacy requests 2004-2005
2005-2006
2006-2007
2007-2008
received for review 1* 0 0 0
finalised 1 0 0 0
carried forward 0 0 0 0
* related to TMF activities, now reported separately

84 - OFM 2007-08 Annual Report
Equal Employment Opportunity
Achievements during the year OFM instigated the NSW Indigenous Cadetship Program, which provides financial assistance, work experience and ultimately employment for Aboriginal people currently enrolled in university. OFM is committed to increasing Aboriginal staff numbers within the organisation. OFM continued to promote and offer flexible work practices to all staff, including some senior officers. Staff, including some Directors, were able to avail themselves of job share arrangements and long term paternity leave. Flexible work options continued to assist and provide incentive for participation, particularly for women. OFM continued to take part in the Lucy mentoring program.
Strategies for 2008-09 OFM’s Aboriginal employment strategy will continue to focus on the NSW Indigenous Cadet Program - job support within the program will be extended, and mentoring and tutoring assistance will be provided as required. OFM will continue to play a lead role in the Lucy Mentoring Program. We will participate in forums for participants outside OFM and encourage suitable candidates to apply for the OFM Graduate program and the NSW Government Fast Track program.
OFM continues to provide innovative work arrangements to allow broad participation and a balance between work, family and other outside activities. Enhanced opportunities for part time work are available, and structured use of variable hours of work will be implemented within agreed parameters. To assist work management flexibility, options for broader remote access to in house systems will be explored. Certificate IV training will continue to be offered to administrative staff.
representation of EEO groups - trends
Bench mark/ target
2003 2004 2005 2006 2007 2008
women 50% 45% 43% 43% 43% 44% 43%
Aboriginal people and Torres Strait Islanders 2% 0% 0% 0.5% 0% 0% 0.5%
people whose first language was not English 20% 17% 15% 15% 16% 16% 19%
people with a disability 12% 2% 2% 2% 2% 2% 2%
people with a disability requiring work-related adjustment
7% 1% 0.5% 0.5% 0.4% 0.8% 0.8%
distribution of EEO groups - trends
Bench mark/ target
2003 2004 2005 2006 2007 2008
women 100 83 87 88 88 82 89
Aboriginal people and Torres Strait Islanders 100 0 0 na na na na
people whose first language was not English 100 88 90 89 87 90 89
people with a disability 100 na na na na na na
people with a disability requiring work-related adjustment
100 na na na na na na
The statistics are based on staff numbers as at 30 June, excluding casual staff.
A Distribution Index of 100 indicates that the centre of the distribution of the EEO group across salary levels is equal to that of other staff. Values less than 100 mean that the EEO group tends to be more concentrated at lower salary levels than is the case for other staff. The more pronounced this tendency, the lower the index. An index of more than 100 indicates that the EEO group is less concentrated at lower salary levels.
The Distribution Index is not calculated if EEO group or non-EEO group numbers are less than 20.

OFM 2007-08 Annual Report - 85
Consultants costing $30,000 or more
Finance and Accounting/Tax Project
Amount (ex. GST)
PKF Australia Advice for renegotiation of casino tax and exclusivity agreements. $31,818
EconTech Pty Ltd Review of revenue forecasts. $39,300
Independent Pricing and Regulatory Tribunal (and Warren Ventures Pty Ltd)
Review of state taxation. $154,434
KPMG Corporate Finance (Aust) Pty Ltd Review of lottery licences and product delivery. $115,000
Credit Suisse (Australia) Ltd Advice on potential major electricity supply contract. $79,973
KPMG Corporate Finance (Aust) Pty Ltd Investigation of potential privately financed projects. $30,000
NSW Treasury Corporation Financial advisory services for privately financed project procurement - Royal North Shore Hospital. $174,887
PricewaterhouseCoopers Advisory services on budgeting and accounting for privately financed projects. $50,000
Pacific Road Corporate Finance Pty Ltd
Advisory services on water and other utility infrastructure $90,625
Steer Davies Gleave Review of major transport investments proposed for Metropolitan Sydney. $133,552
Partnerships UK Plc Advisory services on Sydney Transport Review. $85,325
Independent Pricing and Regulatory Tribunal
Examination of improvements in NSW Health's performance management and funding framework. $75,000
NSW Department of Premiers and Cabinet (PricewaterhouseCoopers)
COAG – CIRA review of regulation of ports and port operations to ensure consistency with principles for economic regulation of significant infrastructure.
$67,865
Information Technology
BSR Solutions Developing a business case that outlines and analyses different options for the implementation of a single Government Procurement website.
$30,000
Management Services
KPMG Corporate Finance (Aust) Pty Ltd
Developing updated NSW Government Business Case Guidelines and associated templates. $60,000
PricewaterhouseCoopers Developing a revised Procurement Policy framework for the NSW Public Sector. $70,250
NSW Department of Education and Training (Rorris and Holmes-Smith)
Researching the impact on learning of teachers and resources. $54,545
Organisational Review
The Nous Group Project to improve the evidence base for briefings including establishing data sources. $142,312
Sub-Total $1,484,886
Consultants costing less than $30,000
Finance and Accounting/Tax 16 projects totalling $200,994
Information Technology 6 project totalling $77,185
Management Services 5 project totalling $95,060
Legal 1 project totalling $2,365
Organisational Review 2 projects totalling $33,375
Economic Assessment 1 project totalling $10,000
Sub Total: $418,980
Total cost of OFM consultancies $1,903,866
Expenditure on Consultants during 2007-08
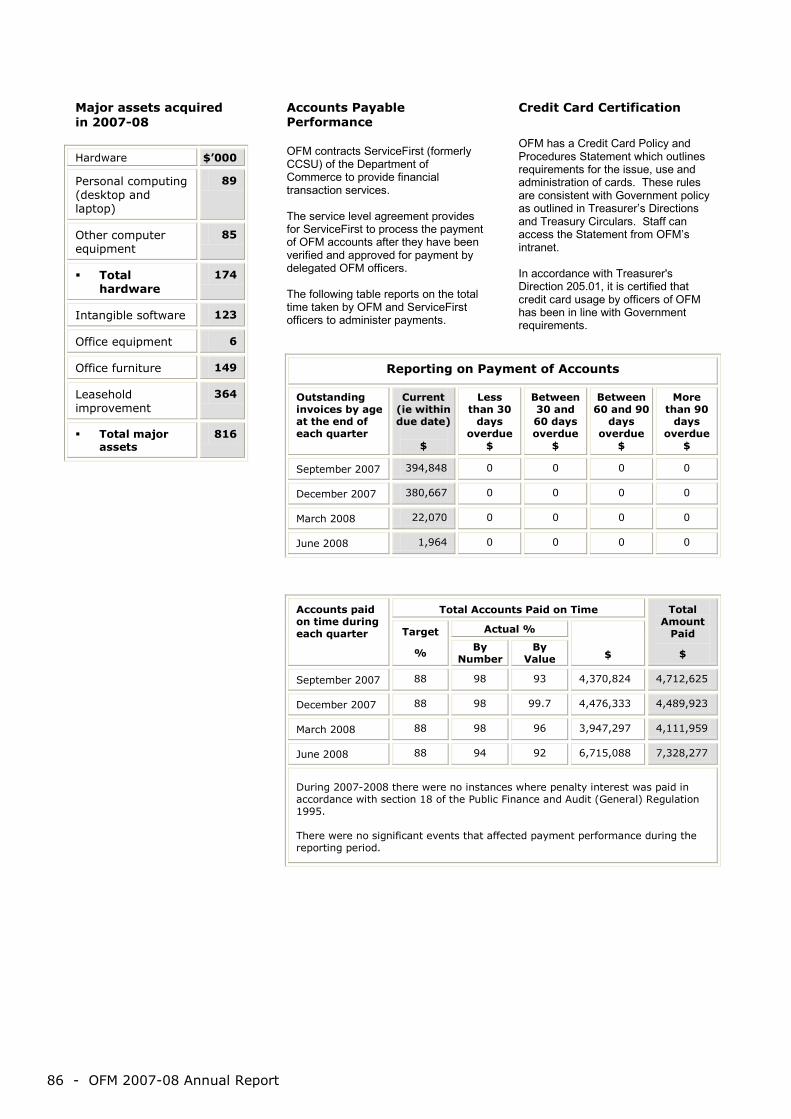
86 - OFM 2007-08 Annual Report
Major assets acquired in 2007-08
Hardware $’000
Personal computing (desktop and laptop)
89
Other computer equipment
85
Total hardware
174
Intangible software 123
Office equipment 6
Office furniture 149
Leasehold improvement
364
Total major assets
816
Accounts Payable Performance OFM contracts ServiceFirst (formerly CCSU) of the Department of Commerce to provide financial transaction services. The service level agreement provides for ServiceFirst to process the payment of OFM accounts after they have been verified and approved for payment by delegated OFM officers. The following table reports on the total time taken by OFM and ServiceFirst officers to administer payments.
Credit Card Certification
OFM has a Credit Card Policy and Procedures Statement which outlines requirements for the issue, use and administration of cards. These rules are consistent with Government policy as outlined in Treasurer’s Directions and Treasury Circulars. Staff can access the Statement from OFM’s intranet. In accordance with Treasurer's Direction 205.01, it is certified that credit card usage by officers of OFM has been in line with Government requirements.
Reporting on Payment of Accounts
Outstanding invoices by age at the end of each quarter
Current (ie within due date)
$
Less than 30
days overdue
$
Between 30 and 60 days overdue
$
Between 60 and 90
days overdue
$
More than 90
days overdue
$
September 2007 394,848 0 0 0 0
December 2007 380,667 0 0 0 0
March 2008 22,070 0 0 0 0
June 2008 1,964 0 0 0 0
Accounts paid on time during each quarter
Total Accounts Paid on Time Total Amount
Paid
$
Target
%
Actual %
$ By
Number By
Value
September 2007 88 98 93 4,370,824 4,712,625
December 2007 88 98 99.7 4,476,333 4,489,923
March 2008 88 98 96 3,947,297 4,111,959
June 2008 88 94 92 6,715,088 7,328,277
During 2007-2008 there were no instances where penalty interest was paid in accordance with section 18 of the Public Finance and Audit (General) Regulation 1995. There were no significant events that affected payment performance during the reporting period.

OFM 2007-08 Annual Report - 87
Overseas visits
United Kingdom, Northern Europe and United States
John Pierce, Secretary of Treasury and Chairman of TCorp, travelled to the United Kingdom, Germany, Switzerland, Holland and the United States from 10 to 21 September 2007. He met with existing and potential institutional investors and intermediaries dealing in TCorp bonds to update them on future issuance plans. TCorp sources approximately 50% of its funding from offshore investors and aims to meet with European and London based investors and intermediaries at least annually. The value of maintaining a well diversified investor base flows directly into a lower average cost of funds for NSW. TCorp covered all costs associated with Mr Pierce’s travel and accommodation. New Zealand
Joshua Shrubb, Principal Advisor, Human and Social Services Directorate, travelled to New Zealand from 27 to 30 November 2007. He attended the final compulsory subject of the Australian and New Zealand School of Government’s (ANZSOG) Executive Master of Public Administration (EMPA) program. The EMPA program is a multi-jurisdictional course with subjects taught in each of the jurisdictions. The final compulsory subject meeting for the 2006 cohort students was held in Wellington. OFM covered the cost of two night’s accommodation and travel to and from the airport. Other expenses were covered by Mr Shrubb or ANZSOG.
Canada
Kyla McCarthy, Principal Policy Advisor, Budget and Financial Management Directorate, was seconded to the Ontario Ministry of Finance, Toronto, Canada from 3 March to 30 May 2008. NSW Treasury and the Ministry of Finance agreed that a staff secondment program would benefit both organisations in terms of information exchange and shared learning. Ms McCarthy evaluated Ontario’s budget system and processes and made comparisons with the approaches undertaken by NSW Treasury. She gained invaluable knowledge of asset management strategies, private financing projects and intergovernmental arrangements. Costs associated with the secondment, including travel and accommodation, were met by NSW Treasury. United Kingdom
Steve Hunt, Director, Self Insurance Corporation, travelled to London from 12 to 23 May 2008. Mr Hunt oversees the NSW Government’s self-insurance arrangements. He met with major international reinsurers in London, which is the traditional financial capital of the world's largest and most influential reinsurers. Reinsurers need to have a good understanding of client business and risk profile when considering cover, premiums, terms and conditions. The trip was successful and all reinsurance arrangements for 2008-09 were in place by 30 June 2008. SiCorp covered all costs associated with Mr Hunt’s travel and accommodation.

88 - OFM 2007-08 Annual Report
Committees and Boards Membership is as at 30 June 2008
Statutory Bodies and Other Corporations Treasury Officer/s
Australian Accounting Standards Board (AASB) R G Williams Australian Statistics Advisory Council P Horn Environmental Trust L Williams Fines Enforcement and Hardship Review Board J George Growth Centres Commission Board M Schur Internal Audit Bureau I Neale (Chair) NSW Fire Brigades Superannuation Pty Ltd P Blunden NSW Innovation Council P Mussared NSW Treasury Corporation J Pierce (Chair), K Cosgriff (Deputy Chair) Parliamentary Contributory Superannuation Scheme Trustee J Pierce (Trustee) Rental Bond Board B Waddington State Contracts Control Board S Brady, S Chong State Property Authority Board M Schur (Chair) Tax Hardship Review Board J George Treasury Committees Treasury Officer/s
Business Information System Project Steering Committee Established in August 2007 to guide development and implementation of improved OFM business information systems.
P Mussared (Chair), M Ronsisvalle, R Williams, M Pellowe, K Lawrence-Haynes, E Sondalini, S Brady, S Power, L Williams, G Morgan, L Locksley
Budget Management Committee P Mussared (Chair), K Cosgriff, M Ronsisvalle, M Schur, I Neale, H Harmstorf, S Brady, C Broad, B Freeland, P Horn, M Pellowe, J-L Charlier (Secretary)
Electricity Steering Committee Established in December 2007 to undertake project governance for the electricity reforms and advising the Government on strategy and implementation issues.
J Pierce (Chair)
Electricity Strategy Working Group Established in January 2008 to prepare strategy and implementation plans for the Steering Committee’s use in advising the Government
J Pierce (Chair)
Evidence Based Advice Project Steering Committee Established in October 2007 to oversee support for improved formulation and clarity of OFM advice.
P Mussared (Chair), M Schur, C McLiesh, R Williams, R Cox, R Sondalini, K Lawrence-Haynes, R Hay
HR Executive Sub Committee I Neale (Chair), R Williams, B Cheney, E Dewar, P Horn, K Lawrence-Haynes, M Pellowe, S Power, I Rosenbaum, D Quinn, A Lester (Secretary)
OFM Audit and Risk Committee J Mitchell (Independent Chair), C Feldmanis (Independent member), I Neale, M Ronsisvalle, M Schur, R Williams, P Blunden, D Graham, M Pellowe, M Roberts, S Lobo (Secretary)
OFM Budget Review Group P Mussared (Chair), M Schur, K Lawrence-Haynes, D Quinn, A Madden (Secretary)
OFM Executive Board P Mussared (Chair), K Cosgriff, M Ronsisvalle, M Schur, I Neale, H Harmstorf, R Williams
OFM IT Steering Committee R Williams (Chair), M Ronsisvalle, A Austin, S Brady, C Broad, P Horn, K Lawrence-Haynes, M Pellowe, S Power, L Steven, M Toohey, E Bishop (Secretary)
OFM Planning Coordination Committee D Quinn (Chair), M Schur, S Brady, G Bullivant, J-L Charlier,M Di Francesco, H Harmstorf, P Horn, B Waddington, K Lawrence-Haynes, Z Lejins, S Power
Suncorp Treasury Risk Management Capability Project M Di Francesco (Chair), L Cueno, D Hogan, R Edwards, S Hunt, K Lawrence-Haynes, R Williams, R Sondalini
Treasury Managed Fund (TMF) – Advisory Board P English, S Hunt

OFM 2007-08 Annual Report - 89
Committees and Boards Membership is as at 30 June 2008
Non Treasury Committees Treasury Officer/s
Executive Committees Barangaroo Steering Committee M Schur, S Power CEO Counter Terrorism Coordinating Committee H Harmstorf Chief Executives Committee J Pierce, P Mussared Department of Water and Energy Budget Review Steering Committee
Established in May 2008 to oversight a review of the Department’s budget. P Mussared
Government Asset Management Committee M Schur, C Campbell, G Vaillant (Secretary)
GST Administration Sub-Committee K Cosgriff Heads of Treasuries Committee J Pierce Heads of Treasuries Sub Committee of Deputies K Cosgriff Heads of Treasuries Accounting and Reporting Advisory Committee M Ronsisvalle Heads of Treasuries Budget and Financial Framework Advisory Committee M Ronsisvalle, M Pellowe,
M Di Francesco Health Efficiency Improvement Task Force
Established in February 2008 to identify opportunities for improved efficiency and resource utilisation by NSW Health.
P Mussared, H Harmstorf, R Sondalini, R Cox
Housing Review Steering Committee Established in January 2008 to oversight an agency performance review of Housing NSW and the Aboriginal Housing Office
P Mussared
Human Services and Justice Chief Executive Officers Committee H Harmstorf Infrastructure Levy Implementation Committee
Established November 2007 to revise the policy for development contributions and to manage the implementation of the levies.
M Schur, A Jackson
Internal Audit Implementation Steering Committee Established in April 2008 to implement recommendations of the Performance Review Unit’s review of Internal Audit Capacity in the NSW Public Sector.
P Mussared (Chair), M Pellowe
Industrial Relations Steering Committee P Mussared, P Horn Land Supply CEO’s Group
Established in July 2007 to resolve issues relating to the supply of land for urban development in Sydney
M Schur
Major Transport Projects Review Steering Committee Established in January 2008 to review and recommend priority major urban projects to be funded over the period 2008-09 to 2017-18
J Pierce (Chair), M Ronsisvalle, M Schur, D Graham, D Thorp
Metropolitan Chief Executive Officers Committee M Schur, S Power Metropolitan Water Chief Executive Officers Committee I Neale, E Dewar North West Metro Steering Committee
Established in April 2008 to oversee the delivery of the North West Metro. M Ronsisvalle, M Schur
NSW Infrastructure Council J Pierce NSW Skills Council P Mussared Police Property Steering Committee M Schur, C Campbell Police Strategic Partnership Board M Schur, C Campbell RailCorp Rollingstock PPP Control Group M Ronsisvalle, M Schur,
D Graham Royal North Shore Hospital PPP Steering Committee M Schur, D Graham Steering Committee for the Review of Government Service Provision M Ronsisvalle Sydney Exhibition and Convention Growth Strategy Implementation Steering
Committee Established in February 2008 to develop an implementation plan to give effect to the Sydney Convention and Exhibition Space Review.
P Mussared, S Power
Transport Planning Infrastructure CEOs’ Cluster M Ronsisvalle, M Schur, D Thorp

90 - OFM 2007-08 Annual Report
Committees and Boards Membership is as at 30 June 2008
Non Treasury Committees (continued) Treasury Officer/s
Budget and Financial Management Heads of Treasuries Uniform Presentation Framework Sub Committee I Rosenbaum Office of the Protective Commission Investment Advisory Committee M McGrath
Infrastructure Management
Infrastructure and Procurement Australian Procurement and Construction Council - Leadership Group S Brady Chief Information Officers Executive Council M Toohey Construction Agencies Coordination Committee S Chong Gateway Regional Forum S Brady, E Williams,
M Toohey Government Licensing Project Steering Committee M Toohey NSW Government Procurement Senior Officers Committee S Brady, S Chong
Major Projects, including Privately Financed Projects Bathurst-Orange Hospital PPP Steering Committee D Graham Desalination Project Control Group D Graham, R Edwards Long Bay Prison/Forensic Hospital Steering Committee D Graham National PPP Forum - Inter-Jurisdictional Working Group D Graham Newcastle Mater Hospital PPP Steering Committee D Graham Social Housing PFP Steering Committee D Graham
Property and Planning Sector Attorney-General’s (Department of the) NSW Audit Committee S Power Bays Precinct Taskforce S Power Government Asset Management Committee – Property Disposal Assessment Panel C Campbell (Chair),
L Courtney, G Vaillant (Secretary)
Government Licensing Program Steering Committee M Clark-Lewis Hunter Estuary Issues Steering Committee S Power Infrastructure Levy Implementation Committee – Senior Officers Group
Established in November 2007 to revise the policy for development levies and to manage the implementation of the levies.
A Jackson
Land Supply Senior Officers Group S Power National Art School Task Force S Power Penrith Lakes Task Force
Established in June 2008 to develop recommendations on the governance, financial and commercial arrangements for Penrith Lakes Parklands
A Jackson
Sydney World Masters Games Finance and Corporate Services Subcommittee S Power Human and Social Services Sector Ambulance Service of NSW Review Working Group
Established in September 2007 to undertake a review of the operational and management systems of the Ambulance Service of NSW.
D Deligiannis
Ambulance Service of NSW Review Steering Committee Established in September 2007 to oversight the review of the operational and management systems of the Ambulance Service of NSW.
R Sondalini
Housing Review Working Group Established in January 2008 to undertake an agency performance review of Housing NSW and the Aboriginal Housing Office
L Kastoun
Human Services and Justice Senior Officers Group R Sondalini Mental Health Senior Officers Group J Shrubb NSW Pre School Investment and Reform Plan Working Group R Bishop

OFM 2007-08 Annual Report - 91
Committees and Boards Membership is as at 30 June 2008
Non Treasury Committees (continued) Treasury Officer/s
Human and Social Services Sector (continued) Interagency Standing Committee on Disability K Riley Hunter and Central Coast Storm Disaster Recovery Executive Group
Established in October 2007 to review the relief and recovery responses to the storms and floods in Newcastle and the central coast in July 2007.
P Blunden
Natural Disaster Mitigation Program Committee P Blunden Natural Disaster Relief Agreement Commonwealth State Working Group P Blunden State Emergency Management Committee P Blunden
Environment and Economic Services Sector Desalination Plant Project Control Group
Established in July 2007 to oversee and review delivery of the Plant. D Graham, R Edwards
Event Liaison Group S Gordon Metropolitan Water Plan Steering Group R Edwards Natural Resources and Environment CEO Cluster L Williams State Fleet Advisory Board M Clark-Lewis Tillegra Dam Project Control Group
Established in July 2007 to oversee and review delivery of the Dam. D Graham, R Edwards
Water Access Regulation Working Group P Miller Fiscal and Economic Policy and Advice Fiscal Strategy and Economic Conditions ABS Economic Statistics User Group J Diller NSW Statistical Co-ordination and User Forum P Horn Population Projection Group M Gadiel Wages Policy Task Force
Established in September 2007 to assist agencies develop negotiating parameters that are consistent with the Government’s wages policy, and offsetting savings measures.
P Horn (Joint Leader)
Economic Strategy and Industry Regulation
Better Regulation CEOs Reference Group R Cox Building Industry Consultation Committee
Established in July 2007 to coordinate the NSW Government’s building industry regulation
R Cox
National IR Review Senior Officers Group Established in May 2008 to coordinate the NSW Government’s input to the Commonwealth Government’s IR reforms
R Cox, N Rejante
Small Business Regulation Review Task Force R Cox Revenue and Intergovernmental Advice
GST State and Territory Industry Partnership Group J George GST State and Territory Policy Group J George Heads of Treasuries Payroll Tax Administration Harmonisation Steering Committee B Freeland Heads of Treasuries National Tax Equivalence Regime Working Group W Stanhope Heads of Treasuries Specific Purpose Payments Working Group B Freeland Limitation of Council Rate Increases – Committee of Advice B Freeland Corporate Management Review of NSW Public Sector Internal Audit Capacity Steering Committee R Williams Review of NSW Public Sector Internal Audit Capacity Working Group H Harmstorf Service First Client Advisory Board R Williams Service First Internal Audit Committee D Quinn Internal Audit HR Committee
Established in May 2008 to develop an Internal Audit HR Strategy for the Chief Executive Committee.
A Lester
NSW Public Sector Accountancy Skills Shortage Strategy Group R Williams (Chair)

92 - OFM 2007-08 Annual Report
Committees and Boards Membership is as at 30 June 2008
Non Treasury Committees (continued) Treasury Officer/s
NRA Committees (up until December 2007) The following working groups and subgroups were formed by COAG to progress the National Reform Agenda (NRA), which was agreed by COAG in February 2006. They ceased operating following the establishment of the new COAG Reform Agenda and its associated Committees and Sub Groups in December 2007.
COAG Best Practice Regulation Sub-Group M Roberts COAG Competition and Regulation Working Group K Cosgriff/ M Roberts COAG Human Capital Working Group P Mussared COAG Human Capital – Literacy and Numeracy Sub-Group R Stanmore COAG Human Capital – Early Childhood Education and Care Sub-Group E Sondalini COAG Human Capital – Diabetes Sub-Group E Sondalini COAG Infrastructure Regulation Sub-Group M Roberts
COAG Reform Agenda Committees (established in December 2007) The following working groups and subgroups were established by COAG in December 2007 to progress the COAG Reform Agenda.
Business Regulation and Competition Working Group K Cosgriff, M Roberts Climate Change and Water Working Group K Cosgriff Complementary Measures Sub Group
Adaptation Sub Group Energy Efficiency Sub Group Renewable Energy Sub Group Water Sub Group
R Cox R Cox R Cox P Connolly, R Edwards
Housing Working Group M Schur, H Harmstorf National Rental Affordability Scheme / Housing Affordability Fund Mechanics
Sub Group National Affordability Housing Agreement Sub Group Indigenous Housing Sub Group
L Kastoun H Harmstorf H Harmstorf
Health and Ageing Working Group - H Harmstorf Commonwealth-State Agreement (AHCA) Aged and Transition Care Sub Group C Mcliesh Indigenous Reform Working Group C McLiesh Building the Evidence Base Sub Group C McLiesh (Chair) Infrastructure Working Group M Schur Public Private Partnerships Sub Group D Graham Productivity Agenda Working Group K Cosgriff Schools Sub Group
Skills and Workforce Development Sub Group Early Childhood Development Sub Group Performance information management Sub Group
B Cheney N Rejante B Cheney C Solomon

OFM 2007-08 Annual Report - 93
Committees and Boards Membership is as at 30 June 2008
Statutory Bodies/Committees abolished in 2007-08 Treasury Officer/s
Ambulance Service of NSW Review Working Group D Deligiannis
Ambulance Service of NSW Review Steering Committee R Sondalini
Aboriginal Affairs Chief Executive Officers Group P Mussared Australian Accounting Standards Board, Interpretations Advisory Panel on
Service Concession Arrangements R G Williams
Climate Change Group K Cosgriff, R Cox COAG Best Practice Regulation Sub-Group M Roberts COAG Competition and Regulation Working Group K Cosgriff/ M Roberts COAG Human Capital Working Group P Mussared COAG Human Capital – Literacy and Numeracy Sub-Group R Stanmore COAG Human Capital – Early Childhood Education and Care Sub-Group E Sondalini COAG Human Capital – Diabetes Sub-Group E Sondalini COAG Infrastructure Regulation Sub-Group M Roberts General Government Liability Management Fund Committee J Pierce (Chair), M Ronsisvalle,
J Ripamonti (Secretary) Government Wireless Senior Officers Steering Committee P Blunden Human Capital Chief Executive Officers Committee H Harmstorf Hunter and Central Coast Storm Disaster Recovery Executive Group P Blunden Inquiry into Electricity Supply in NSW Steering Committee J Pierce, K Cosgriff,
J O’Connell Lane Cove Tunnel Review Panel D Graham National Emissions Trading Taskforce R Cox, M Kaspura NSW Senior Officers Interagency Greenhouse Network M Kaspura Police MRP Core Policing Committee M Toohey Review of NSW Public Sector Internal Audit Capacity Steering Committee R Williams Review of NSW Public Sector Internal Audit Capacity Working Group H Harmstorf TIE and MRP Executive Oversight Group M Toohey Water Industry Structure Interagency Group R Edwards, P Miller

94 - OFM 2007-08 Annual Report
Energy Management and Performance
Corporate Commitment OFM commits to sustainable energy management principles and achieving savings in energy usage. In Governor Macquarie Tower (GMT), OFM occupies levels 24 to 26, and part of levels 15 and 27. The Building purchases electricity on the contestable market via the State Contracts Control Board Electricity Contract - six per cent of electricity used is from renewable sources. Planning and Implementation The NSW Treasury Energy Management Plan establishes accountability and responsibility for energy management. The Plan has been operating for over six years and sets the mechanisms, rationale and strategies for energy management. Effective energy management processes are integrated into ongoing activities. The primary purpose of the Plan is to sustain reductions in energy costs and usage, without adversely affecting OFM’s activities and management, in compliance with the Government’s policy on energy reduction. A reduction in energy usage will contribute to a reduction in greenhouse gas emissions. Performance From July 2007, due to the expansion of its responsibilities, OFM’s accommodation in GMT extended to include part of level 15. This resulted in a 3.5% increase in electricity consumption from 2006-07 to 2007-08. However, the electricity energy performance indicator for 2007-08 reduced to 705 MJ/m2 from 730 MJ/m2 the year before, possibly due to implementation of energy saving strategies by GMT building management. Independent of energy usage, the unit cost of electricity decreased by approximately 4.5% in 2007-08. This was largely due to initial cost savings from levels 24, 25 and 26 moving to a new energy contract. There was an overall decrease in fuel consumption from 11 L/100km in 2006-07 to 10 L/100km in 2007-08. Despite an increase of 10.5% in the unit cost of total vehicular fuel from 2006-07 to 2007-08, there was an overall reduction in total annual fuel cost. Future Direction Where cost effective, OFM will reduce energy consumption.
Waste Reduction and Purchasing Policy
OFM’s supports the principle of waste reduction through its disposal and purchasing policies. Our practices are consistent with the strategies applying across the state government sector. Procurement is undertaken via suppliers registered under NSW Government contracts. Sustainability is an important consideration in purchase decisions, including considerations such as the level of recycled content and the capacity of providers to assist with the management of waste and disposal of surplus equipment. To reduce waste, as far as possible OFM promotes the use of electronic, rather than paper based, communications. A review of major publications and the capacity to reduce hardcopy production in favour of electronic distribution has been earmarked for 2008-09.
OFM Fuel Total Energy Consumed (kWh or L)
Total Energy Consumed
(GJ)
Annual Cost
($)
CO2 Emissions
(Tonnes)
2006-2007
2007-2008
2006-2007
2007-2008
2006-2007
2007-2008
2006-2007
2007-2008
Electricity (Black Coal) 843,466 862,546 3,036 3,105 84,706 79,022 806.5 824.7
Electricity (Green power) 42,821 55,056 154 198 5,674 7,289 0.0 0.0
Vehicular Fuels:
Unleaded 30,194 23,667 1,033 810 33,117 28,636 68.2 53.4
Premium Unleaded 544 0 19 0 694 0 1.2 0
Diesel 0 474 0 18 0 604 0 1.3
Ethanol blend E10 127 1,476 4 50 130 1,904 0.3 3.3
Total Vehicular fuels 30,865 25,627 1,056 878 33,941 31,144 69.7 58.0
TOTAL 4,246 4,181 124,321 117,455 876.2 882.7
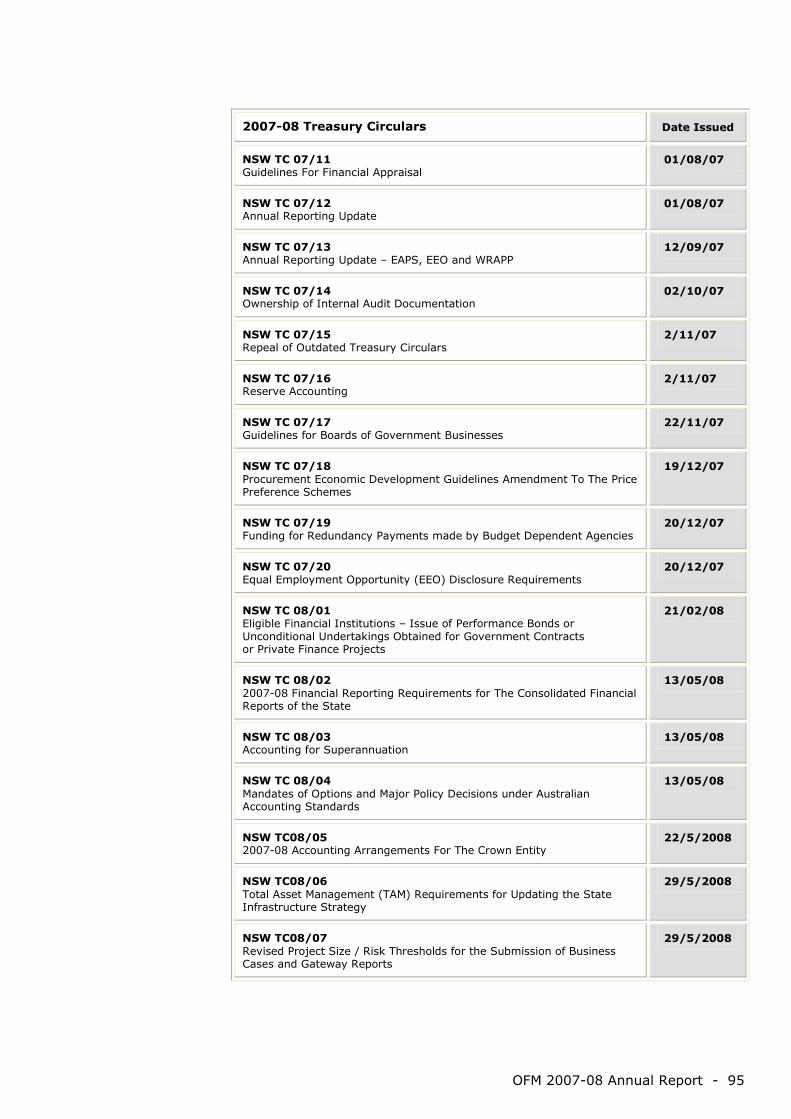
OFM 2007-08 Annual Report - 95
Treasury Circulars can be accessed from the OFM Website [www.treasury.nsw.gov.au]
2007-08 Treasury Circulars Date Issued
NSW TC 07/11 Guidelines For Financial Appraisal
01/08/07
NSW TC 07/12 Annual Reporting Update
01/08/07
NSW TC 07/13 Annual Reporting Update – EAPS, EEO and WRAPP
12/09/07
NSW TC 07/14 Ownership of Internal Audit Documentation
02/10/07
NSW TC 07/15 Repeal of Outdated Treasury Circulars
2/11/07
NSW TC 07/16 Reserve Accounting
2/11/07
NSW TC 07/17 Guidelines for Boards of Government Businesses
22/11/07
NSW TC 07/18 Procurement Economic Development Guidelines Amendment To The Price Preference Schemes
19/12/07
NSW TC 07/19 Funding for Redundancy Payments made by Budget Dependent Agencies
20/12/07
NSW TC 07/20 Equal Employment Opportunity (EEO) Disclosure Requirements
20/12/07
NSW TC 08/01 Eligible Financial Institutions – Issue of Performance Bonds or Unconditional Undertakings Obtained for Government Contracts or Private Finance Projects
21/02/08
NSW TC 08/02 2007-08 Financial Reporting Requirements for The Consolidated Financial Reports of the State
13/05/08
NSW TC 08/03 Accounting for Superannuation
13/05/08
NSW TC 08/04 Mandates of Options and Major Policy Decisions under Australian Accounting Standards
13/05/08
NSW TC08/05 2007-08 Accounting Arrangements For The Crown Entity
22/5/2008
NSW TC08/06 Total Asset Management (TAM) Requirements for Updating the State Infrastructure Strategy
29/5/2008
NSW TC08/07 Revised Project Size / Risk Thresholds for the Submission of Business Cases and Gateway Reports
29/5/2008

96 - OFM 2007-08 Annual Report
All NSW Treasury publications are published on the OFM Website [www.treasury.nsw.gov.au]
2007-08 NSW Treasury Policy & Guidelines Papers
NSW Treasury Policy & Guidelines Papers (TPPs) outline Government policy and/or NSW Treasury procedures for the direction or guidance of Agencies.
TPP07-3 July 2007
Service Costing in General Government Sector Agencies
This Policy & Guidelines Paper will assist General Government agencies better understand their activities and services, and the assumptions underlying current and expected future service costs. It sets out guidelines for better practice and it is expected that agencies and NSW Treasury will use the Results and Services Plan (RSP) process to improve costing, and the quality of costing information over time.
TPP07-4 July 2007
Commercial Policy Framework: Guidelines for Financial Appraisal
This is a component of the NSW Government’s Commercial Policy Framework. The Guidelines outline a consistent approach to the financial assessment of potential projects across all public sector organisations, drawing on best practice methods in the private sector. This publication updates the previous Guidelines for Financial Appraisal (TPP97-4). It reflects the requirements of the Government’s asset management and procurement policies. It identifies situations requiring routine submission of financial appraisals to Treasury and provides greater guidance in ascertaining an appropriate discount rate.
TPP07-5 July 2007
NSW Government Guidelines for Economic Appraisal
These Guidelines promote a consistent approach to undertaking such appraisals for when assessing significant spending proposals, including proposed capital works projects and new programs across all public sector agencies. The Guidelines are subject to ongoing review. This edition incorporates the most recent amendments and supersedes the previous June 1997 NSW Treasury Policy & Guidelines Paper (TPP97-2).
TPP07-6 July 2007
Economic Appraisal Principles and Procedures Simplified
This publication provides a simplified summary of the NSW Government Guidelines for Economic Appraisal (TPP07-5). This edition incorporates the most recent amendments, and supersedes all previous editions.
TPP07-7 July 2007
Commercial Policy Framework: Treasury Management Policy
This is a component of the NSW Government’s Commercial Policy Framework aimed at ensuring that best practice financial management and accountability frameworks are applied in the State sector. The policy strengthens the framework for managing the risks associated with public sector agencies’ treasury functions, including borrowings; investments; derivative transactions; debt and investment management; and structured finance transactions. The framework applies to all public sector agencies but is of greater relevance to Government businesses, given the extent of their involvement in treasury functions. It supersedes the previous NSW Treasury policy document of September 2002 (TPP02-5).
TPP07-8 November 2007
Guidelines for Boards of Government Businesses
This is a component of the NSW Government’s Commercial Policy Framework. The Guidelines outline the key private sector standards of corporate governance which are most appropriate to the practices and procedures for boards of Government businesses. These Guidelines are aimed at Government businesses (and their subsidiaries) with a governing board. Some principles may also be relevant for advisory boards.

OFM 2007-08 Annual Report - 97
2007-08 NSW Treasury Policy & Guidelines Papers (continued)
TPP08-1 May 2008
Accounting Policy: Accounting for Financial Instruments
This Policy provides guidance to NSW public sector agencies for applying AASB 139 Financial Instruments Recognition and Measurement and AASB 132 Financial Instruments Disclosure and Presentation. Guidance given covers classifying instruments, restrictions on using certain instruments, derivatives and hedge accounting, interest free and low interest loans and financial guarantees.
The Policy applies to all NSW public sector agencies (including Statutory State Owned Corporations) for financial years beginning on or after 1 January 2007. It supersedes the previous edition (TPP 07-2).
TPP08-2 May 2008
Total Asset Management requirements for updating the NSW State Infrastructure Strategy
The NSW Government has endorsed a new ten year capital planning process for developing the State Infrastructure Strategy (SIS). Total Asset Management (TAM) submissions are the primary input to the process. New reporting requirements are outlined to support the new SIS/TAM process. The policy applies from 1 June 2008 and supersedes the previous Total Asset Management Policy (TPP 04-3).
TPP08-3 June 2008
Accounting Policy: Contributions by Owners Made to Wholly-Owned Public Sector Entities
This Policy applies to all NSW Public Sector entities for financial years beginning on or after 1 July 2007. It provides guidance to all NSW Public Sector entities and is issued as a Treasurer’s Direction under sections 9 and 45E of the PAFA Act 1983. It supersedes previous policy (TPP06-7).
TPP08-4 June 2008
Accounting Policy: Financial Reporting Code for Budget Dependent General Government Sector Agencies
The Code applies to all Budget dependent agencies for financial years ending on or after 30 June 2008. It sets out the financial reporting framework for Budget Dependent agencies, outlining the form and content of financial reports and the accompanying note disclosures. This edition of the Code supersedes the previous version, issued as TPP 06-5.
2007-08 NSW Treasury Research and Information Papers
NSW Treasury Research & Information Papers are aimed at promoting discussion, educating or providing information on research projects undertaken by OFM officers.
TRP07-2 November 2007
Interstate Comparison of Taxes 2006-07
This paper is produced annually by OFM with the assistance of agencies in NSW and the other States and Territories. Produced after the delivery of State and Territory Budgets, it provides a brief description of each tax to facilitate interstate comparisons.
The publication is not intended as an exhaustive analysis. For a complete operating description of each tax, the relevant Acts of Parliament and/or regulations should be consulted. Some information is based on proposed or announced changes, which at the time of publication may not have been legislated; and OFM takes no responsibility for any errors in the information provided.
Treasury Operational Documents
Triennial Corporate Plan
The Plan outlines OFM's strategic management framework and the values it applies. It is issued every three years following a fundamental planning review. It incorporates the OFM Commitment to Service.
Annual NSW Treasury Annual Report Prepared in accordance with the Annual Reports (Departments) Act 1985.
Periodic Treasury Focus The corporate newsletter of the NSW Treasury - issues via OFM’s web site.

98 - OFM 2007-08 Annual Report
State Financial Reports
Report on State Finances
An annual publication outlining government activities and the overall financial position of the State Public Sector. The report incorporates the Statement of Budget Result; the Outcomes Report; and the Consolidated Financial report of the NSW Total State Sector, including the NSW Public Accounts.
Monthly Financial Statements
Monthly reports on General Government finances for the year to date, published on OFM’s web site.
State Budget Papers
Budget Overview
Provides a brief overview, including clear graphics, of the Budget position, expenditure and revenue and economic context. Outlines the Budget papers and key terms.
Budget Speech BP 1
The printed version of the speech delivered in Parliament by the Treasurer on Budget day. It sets out the Government’s budgetary strategy and financial plans.
Budget Statement BP 2
Presents detailed information on Budget aggregates (i.e. for the General Government Sector) and on State finances more generally. Outlines the State fiscal strategy.
Budget Estimates BP 3 (2 volumes)
Contains detailed revenue and expense information on General Government Sector portfolios and agencies. Information is provided on the net cost of providing services for each Budget Dependent agency.
Infrastructure Statement BP 4
Provides detail of the General Government Sector and Public Trading Enterprise Sector plans for infrastructure expenditure. Information is provided on an accrual basis.
Appropriation Bills BP 5
Bills appropriating money required for the recurrent services and capital works and services of Government during the financial year.
State Infrastructure Strategy The Strategy issues every second year, setting out the Government’s infrastructure plans and priorities for the coming ten years. It links immediate funding with longer term infrastructure planning and identifies the main drivers of infrastructure spending – coastal population growth, increased ageing and the impact of new technology. The inaugural Strategy, which issued in May 2006, covered the ten years from 2006-07 to 2015-16. A revised edition issued in June 2008 covering the ten years to 2017-18.

OFM 2007-08 Annual Report - 99
Freedom of Information
There are no major issues to report on OFM’s compliance with FOI requirements.
From 2006-07, FOI applications concerning personal information that are processed by SICorp are reported separately in SICorp’s own annual report. Data below excludes that information.
New FOI requests
Personal Other Total
2006-2007
2007-2008
2006-2007
2007-2008
2006-2007
2007-2008
New (including transferred in) - - 20 30 20 30
Brought forward - - 1 3 1 3
Total to be processed
- - 21 33 21 33
Completed - - 18 25 18 25
Discontinued - - 1 6 1 6
Total processed - - 19 31 19 31
Unfinished (carried forward)
- - 2 2 2 2
Discontinued applications
Personal Other Total
2006-2007
2007-2008
2006-2007
2007-2008
2006-2007
2007-2008
Transferred - - - 3 - 3
Withdrawn - - 1 1 1 1
Applicant failed to pay
- - - 2 - 2
Unreasonable resources
- - - - - -
Total discontinued
- - 1 6 1 6
Completed applications
Personal Other Total
2006-2007
2007-2008
2006-2007
2007-2008
2006-2007
2007-2008
Granted in full or otherwise available in full
- - 11 6 11 6
Granted in part or otherwise available in part
- - 6 5 6 5
Refused or exempted
- - 1 6 1 6
Deferred - - 0 8 0 8
Total completed - - 18 25 18 25
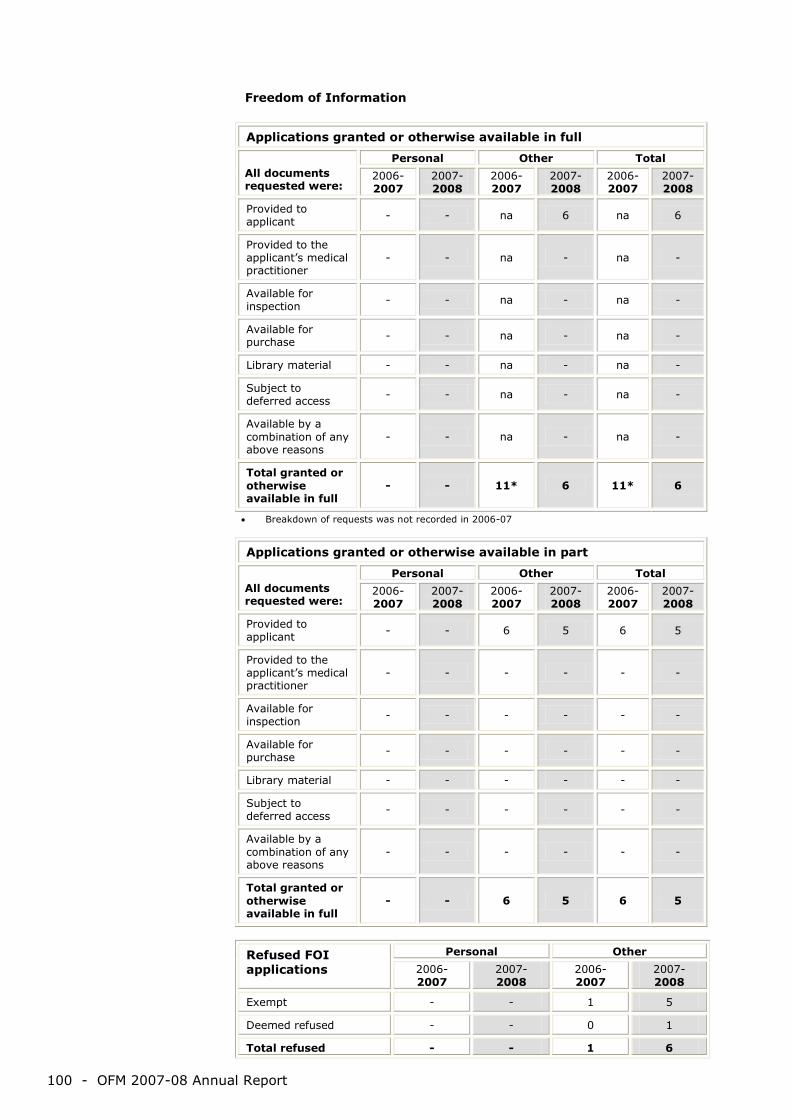
100 - OFM 2007-08 Annual Report
Freedom of Information
Applications granted or otherwise available in full
All documents requested were:
Personal Other Total
2006-2007
2007-2008
2006-2007
2007-2008
2006-2007
2007-2008
Provided to applicant - - na 6 na 6
Provided to the applicant’s medical practitioner
- - na - na -
Available for inspection - - na - na -
Available for purchase - - na - na -
Library material - - na - na -
Subject to deferred access
- - na - na -
Available by a combination of any above reasons
- - na - na -
Total granted or otherwise available in full
- - 11* 6 11* 6
• Breakdown of requests was not recorded in 2006-07
Applications granted or otherwise available in part
All documents requested were:
Personal Other Total
2006-2007
2007-2008
2006-2007
2007-2008
2006-2007
2007-2008
Provided to applicant - - 6 5 6 5
Provided to the applicant’s medical practitioner
- - - - - -
Available for inspection - - - - - -
Available for purchase
- - - - - -
Library material - - - - - -
Subject to deferred access
- - - - - -
Available by a combination of any above reasons
- - - - - -
Total granted or otherwise available in full
- - 6 5 6 5
Refused FOI applications
Personal Other
2006- 2007
2007- 2008
2006- 2007
2007-2008
Exempt - - 1 5
Deemed refused - - 0 1
Total refused - - 1 6

OFM 2007-08 Annual Report - 101
Freedom of Information
Exempt documents
Personal Other
2006-2007
2007-2008
2006-2007
2007-2008
Restricted documents
Cabinet document na - na 9
Executive council documents na - na -
Law enforcement and public safety documents
na - na -
Counter terrorism na - na -
Documents requiring consultation
Intergovernmental relations na - na -
Personal affairs na - na -
Business affairs na - na 1
Conduct of research na - na -
Documents otherwise exempt
Schedule 2 exempt agency na - na -
Information confidential to Olympic Committees
na - na -
Relating to threatened species, Aboriginal objects or Aboriginal places
na - na -
Threatened species conservation na - na -
Plans of management containing information of Aboriginal significance
na - na -
Privacy documents in public library collections
na - na -
Judicial functions na - na -
Subject to contempt na - na -
Arising out of companies or securities legislation
na - na -
Exempt under interstate FOI legislation na - na -
Subject to legal professional privilege na - na -
Containing confidential material na - na -
Subject to secrecy provisions na - na -
Affecting State economy na - na -
Affecting financial or property interests of the State or an agency
na - na -
Concerning operations of agencies na - na -
Internal working documents na - na -
Other exemptions na - na -
Total applications including exempt documents
na
-
7*
10
* Breakdown of requests was not recorded in 2006-07
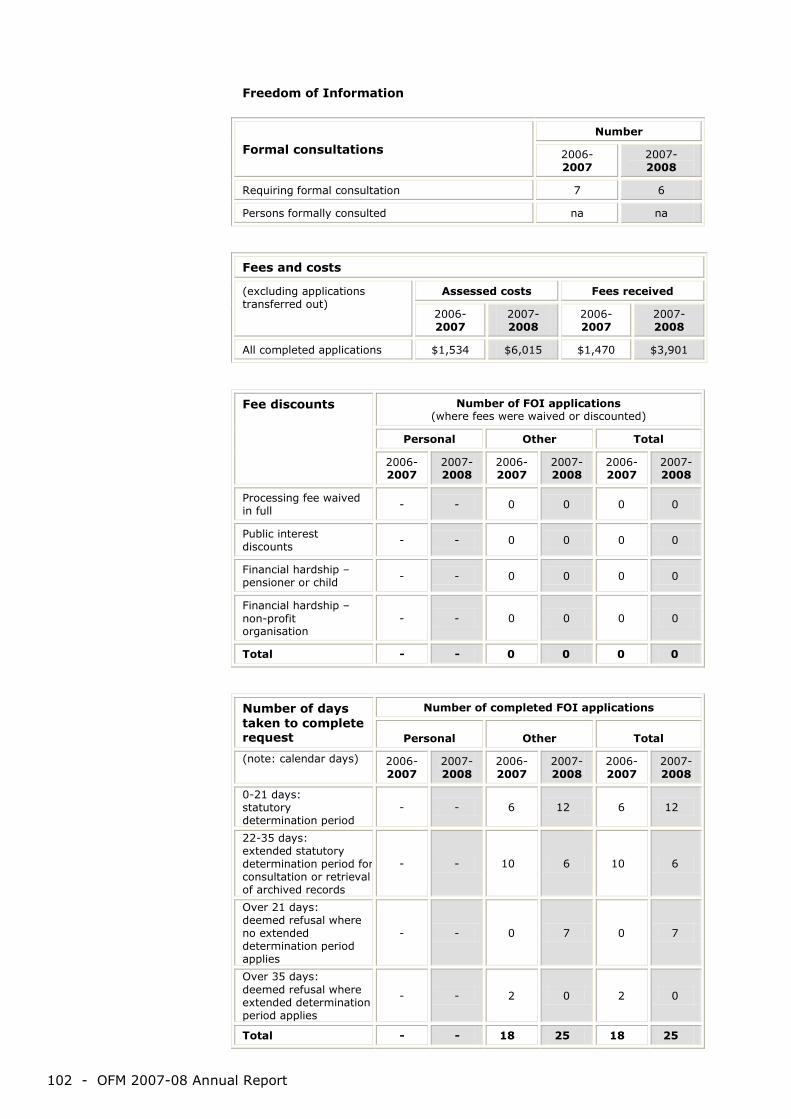
102 - OFM 2007-08 Annual Report
Freedom of Information
Formal consultations Number
2006- 2007
2007- 2008
Requiring formal consultation 7 6
Persons formally consulted na na
Fees and costs
(excluding applications transferred out)
Assessed costs Fees received
2006-2007
2007-2008
2006-2007
2007-2008
All completed applications $1,534 $6,015 $1,470 $3,901
Fee discounts Number of FOI applications (where fees were waived or discounted)
Personal Other Total
2006-2007
2007-2008
2006-2007
2007-2008
2006-2007
2007-2008
Processing fee waived in full - - 0 0 0 0
Public interest discounts
- - 0 0 0 0
Financial hardship – pensioner or child - - 0 0 0 0
Financial hardship – non-profit organisation
- - 0 0 0 0
Total - - 0 0 0 0
Number of days taken to complete request
Number of completed FOI applications
Personal Other Total
(note: calendar days) 2006-2007
2007-2008
2006-2007
2007-2008
2006-2007
2007-2008
0-21 days: statutory determination period
- - 6 12 6 12
22-35 days: extended statutory determination period for consultation or retrieval of archived records
- - 10 6 10 6
Over 21 days: deemed refusal where no extended determination period applies
- - 0 7 0 7
Over 35 days: deemed refusal where extended determination period applies
- - 2 0 2 0
Total - - 18 25 18 25

OFM 2007-08 Annual Report - 103
Freedom of Information
Processing time (hours)
Number of completed FOI applications
Personal Other Total
2006-2007
2007-2008
2006-2007
2007-2008
2006-2007
2007-2008
0-21 hours - - 6 19 6 19
11-20 hours - - 10 4 10 4
21-40 hours - - 2 2 2 2
Over 40 hours - - 0 0 0 0
Total - - 18 25 18 25
Number of reviews Number of reviews completed
2006- 2007
2007- 2008
Internal reviews 2 3
Ombudsman reviews 1 1
ADT reviews 0 1
Results of internal reviews
Number of internal reviews
Personal Other Total
Original agency decision UPHELD
Original agency decision VARIED
Original agency decision UPHELD
Original agency decision VARIED
Original agency decision UPHELD
Original agency decision VARIED
Access refused - - 3 0 3 0
Access deferred - - 0 0 0 0
Exempt matter deleted from documents
- - 0 0 0 0
Unreasonable charges
- - 0 0 0 0
Failure to consult with third parties
- - 0 0 0 0
Third parties views disregarded
- - 0 0 0 0
Amendment of personal records refused
- - 0 0 0 0
Total - - 3 0 3 0

104 - OFM 2007-08 Annual Report
Annual Reports (Departments) Act 1985 No 156
Annual Reports (Statutory Bodies) Act 1984 No 87
Appropriation Act 2007 No 18
Appropriation (Parliament) Act 2007 No 19
Appropriation (Special Offices) Act 2007 No 20
Australia and New Zealand Banking Group Limited (NMRB) Act 1991 No 35
Bank Integration Act 1992 No 80
Bank Mergers Act 1996 No 130
Bank Mergers (Application of Laws) Act 1996 No 64
Banks and Bank Holidays Act 1912 No 43, section 22 (remainder, the Minister for Industrial Relations)
Betting Tax Act 2001 No 43
Canberra Advance Bank Limited (Merger) Act 1992 No 17
Capital Debt Charges Act 1957 No 1
Charter of Budget Honesty (Election Promises Costing) Act 2006 No 89
Commonwealth Places (Mirror Taxes Administration) Act 1998 No 100
Commonwealth Powers (State Banking) Act 1992 No 104
Conversions of Securities Adjustment Act 1931 No 63
Dartmouth Reservoir (Financial Agreement) Act 1970 No 30
Debits Tax Act 1990 No 112
Decimal Currency Act 1965 No 33
Duties Act 1997 No 123
Finances Adjustment Act 1932 No 27
Financial Agreement Act 1944 No 29
Financial Agreement Act 1994 No 71
Financial Agreement (Amendment) Act 1976 No 35
Financial Agreement (Decimal Currency) Act 1966 No 39
Financial Agreement Ratification Act 1928 No 14
Financial Agreement (Returned Soldiers Settlement) Ratification Act 1935 No 1
Financial Sector Reform (New South Wales) Act 1999 No 1
Fines Act 1996 No 99 (except parts, the Attorney General)
First Home Owner Grant Act 2000 No 21
Fiscal Responsibility Act 2005 No 41
Freight Rail Corporation (Sale) Act 2001 No 35
Gaming Machine Tax Act 2001 No 72, Part 3 (remainder, jointly with the Minister for Gaming and Racing, except Part 4 and Schedule 1, the Minister for Gaming and Racing)
General Government Liability Management Fund Act 2002 No 60
Government Guarantees Act 1934 No 57
Treasurer’s Legislation

OFM 2007-08 Annual Report - 105
Government Insurance Office (Privatisation) Act 1991 No 38
Health Insurance Levies Act 1982 No 159
Inscribed Stock Act 1902 No 79
Inscribed Stock (Issue and Renewals) Act 1912 No 51
Insurance Protection Tax Act 2001 No 40
Interest Reduction Act 1931 No 44
Intergovernmental Agreement Implementation (GST) Act 2000 No 44
Internal Audit Bureau Act 1992 No 20
Land Tax Act 1956 No 27
Land Tax Management Act 1956 No 26
NSW Grain Corporation Holdings Limited Act 1992 No 31
NSW Self Insurance Corporation Act 2004 No 106
Pacific Power (Dissolution) Act 2003 No 17
Payroll Tax Act 2007 No 21
Petroleum Products Subsidy Act 1997 No 112
Public Authorities (Financial Arrangements) Act 1987 No 33
Public Finance and Audit Act 1983 No 152 (except parts, the Premier)
Public Loans Act 1902 No 81
Public Sector Employment and Management Act 2002 No 43, Chapter 7 (jointly with the Minister for Commerce; remainder the Premier)
Road Improvement (Special Funding) Act 1989 No 95
Secondary Mortgage Market (State Equity Participation) Act 1985 No 131
Stamp Duties Act 1920 No 47
State Bank (Corporatisation) Act 1989 No 195
State Bank of South Australia (Transfer of Undertaking) Act 1994 No 47
State Bank (Privatisation) Act 1994 No 73
Superannuation Administration Act 1996 No 39
Superannuation (Axiom Funds Management Corporation) Act 1996 No 40
Taxation Administration Act 1996 No 97
Totalizator Act 1997 No 45, section 76 (remainder, the Minister for Gaming and Racing)
Totalizator Agency Board Privatisation Act 1997 No 43
Treasury Corporation Act 1983 No 75
Trustees Protection Act 1931 No 28
Unclaimed Money Act 1995 No 75
Wills, Probate and Administration Act 1898 No 13, section 61B (7) and (8) (remainder, the Attorney General)
Source: http://www.legislation.nsw.gov.au
Treasurer’s Legislation

106 - OFM 2007-08 Annual Report
Treasurer’s Legislation Changes during 2007-08
The Office of State Revenue administers the Treasurer’s taxation and fines legislation. Please refer to the relevant Act or OSR’s annual report if a more detailed explanation of amendments to those Acts is required. There were no amendments to Treasurer’s legislation during the Spring Session 2007.
Budget Session 2008
State Revenue Legislation Amendment Act 2008 (Act 67, assented 2 July 2008)
This Act amends the following Acts. Duties Act 1997
To prevent use of duty concession on partitions of land to avoid duty on exchanges of land that are not genuinely between joint owners.
To extend the circumstances in which a duty concession applies in relation to deceased estates.
To introduce a duty concession for the enlargement of a term in land into a fee simple.
To introduce a duty exemption for pharmacists who incorporate.
To allow the First Home Plus duty concession to be claimed, in certain circumstances, in respect of a purchase of land even if the land constitutes a multiple occupancy
To prevent the avoidance of land rich duty by means of a declaration of trust.
To introduce a concession on the duty payable for registration of a motor vehicle in respect of any motor vehicle that has been modified for the purpose of use by, or transport of, a person with a disability.
To extend the duty exemption for charities to a person who acts as a trustee of a charity when acting in that capacity.
To provide that the stamping of an instrument under the Act is a tax assessment for the purposes of the Taxation Administration Act 1996.
To extend provisions that relate to quoted marketable securities to stapled securities that are quoted on a stock exchange.
To remove obsolete and redundant provisions in the Act and make other changes by way of statute law revision.
First Home Owner Grant Act 2000:
To allow the grant to be claimed (in certain circumstances) if a person builds a home on land owned by another, purchases a manufactured home and installs it on land owned by another or purchases land with the assistance of another person who acquires a small interest in the property.
To extend (from 2 years to 3 years) the period during which proceedings for an offence against the Act must be commenced.
Health Insurance Levies Act 1982
For statute law revision purposes. Land Tax Management Act 1956
To clarify an exemption for non-profit associations.
To clarify the application of the principal place of residence exemption to land comprised of 2 or more lots or strata lots.
To extend a concession to land owned by one person that is comprised of multiple residential occupancies.
For statute law revision purposes. Payroll Tax Act 2007
To clarify an exemption for charitable bodies
To modify grouping provisions. Taxation Administration Act 1996
To allow tax officers to disclose information obtained under taxation laws in connection with the administration of the Fines Act 1996.
To allow information obtained under taxation laws to be disclosed to the Commissioner of NSW Fire Brigades and the Commissioner of the NSW Rural Fire Service.
To extend (from 2 years to 3 years) the period during which proceedings for an offence against a taxation law must be commenced.
For statute law revision purposes. Unclaimed Money Act 1995
As a consequence of changes to Commonwealth law dealing with unclaimed superannuation benefits.
For statute law revision purposes. The Act also repeals the following Acts.
Debits Tax Act 1990 (as the tax under that Act has been abolished).
Stamp Duties Act 1920 (which was replaced by the Duties Act 1997). Provision is made for the final determination of duty payable in respect of leases that are chargeable with duty under that Act.
Taxation Administration Regulation 2003. Remaining provisions of that regulation are transferred to the Taxation Administration Act 1996.
The Act also makes other minor and consequential amendments and includes savings and transitional provisions.

OFM 2007-08 Annual Report - 107
State Revenue and Other Legislation Amendment (Budget) Act 2008 (Act 48, assented 30 June 2008) (Cognate with Appropriation Act 2008)
This Act amends the following Acts. Duties Act 1997
To bring forward the date for abolition of duty on transfers of business assets, statutory licences and permissions and poker machine entitlements, to 1 January 2011.
To provide a duty exemption for certain restructure arrangements known as “top hatting” arrangements.
To ensure that duty on transfers of shares in commercial fisheries is abolished on 1 January 2009 (when duty on transfers of marketable securities is abolished).
Payroll Tax Act 2007
To provide for the current payroll tax rate of 6% to be reduced to 5.5% over 3 years.
To provide for the tax-free threshold to be indexed annually (starting on 1 July 2008) so that it will increase in line with increases in the Consumer Price Index for Sydney.
To provide for special arrangements to apply in the 3 financial years over which the reduction in tax rate will be phased in (including arrangements for the allocation of any unused portion of tax-free threshold for a half-year to the other half of the year).
Public Finance and Audit Act 1983
As a consequence of the introduction of a new Australian Accounting Standard, and for other purposes.
Public Sector Employment and Management Act 2002
To ensure that the prohibition on an executive officer undertaking paid work outside the duties of his or her position without the approval of the officer’s employer extends to paid work of any kind (whether or not employment to which that Act applies).
Fines Amendment Act 2008 (Act 40, assented 25 June 2008)
This Act amends the Fines Act 1996 To make it clear that persons may
pay an amount payable under a penalty notice (or penalty reminder notice) by part payments, so long as the full amount is paid within the time required by the notice concerned.
To provide that a person may elect to
have a matter that is the subject of a penalty notice (or penalty reminder notice) dealt with by a court, even if the whole or part of the amount payable under such a notice has been paid.
To provide that a penalty reminder notice may be issued and a penalty notice enforcement order may be made even if the relevant penalty notice or penalty reminder notice (or both) was returned as being undelivered to its sender after being sent to the person at an address supplied at the time the offence concerned or current in records of the Roads and Traffic Authority.
To clarify the manner in which a person served with a penalty reminder notice may name some other person as the person who was in charge of the vehicle or vessel concerned at the relevant time relating to the offence.
To make amendments consequential to the merging of Infringement Processing Bureau and the State Debt Recovery Office.
To allow the State Debt Recovery Office and its staff to disclose information to certain tax and other officers.
To make other miscellaneous amendments, law revision amendments and amendments of a savings and transitional nature.
The Act also amends the Criminal Procedure Act 1986 to make it clear that in criminal proceedings relating to an offence for which a penalty notice was issued, the prosecutor of the offence may be represented and appear by a police prosecutor. The Act also makes a consequential amendment to the Road Transport (Driver Licensing) Act 1998. Superannuation Administration Amendment Act 2006 (Act 28, assented 11 June 2008)
This Act amends the Superannuation Administration Act 1996 To enable STC Trustee Corporation to
transfer State sector surplus employer reserves to other such reserves and to return non State sector surplus employer reserves to those employers.
To insert a two year time limit to dispute an STC Trustee Corporation decision under the Police Regulation (Superannuation) Act 1906, the State Authorities Non-contributory Superannuation Act 1987, the State Authorities Superannuation Act 1987 or the Superannuation Act 1916 from the date of notification of the right to dispute that decision
To make other statute law revision amendments.

108 - OFM 2007-08 Annual Report
Treasurer’s Legislation Changes during 2007-08
Public Finance and Audit Act 1983 Public Finance and Audit Regulation 2005 Amendments were made to the Act and Regulation, including as a result of the following legislation. Auditor-General (Supplementary Powers) Act 2008 (Act 32, assented 23 June 2008).
To provide for review by the Auditor-General in connection with restructur-ing the State’s electricity industry.
The Auditor-General (Supplementary Powers) Act 2008 was repealed the day following the day on which it commenced. Its repeal did not affect amendments it made to Public Finance and Audit Act. State Revenue and Other Legislation Amendment (Budget) Act 2008 (Act 48, assented 30 June 2008)
To update for the introduction of Australian Accounting Standard 1049, Whole of Government and General Government Sector Financial Reporting which is operative from 1 July 2008.
To update terminology and to assist in focusing the Budget Papers on the outcomes the community desires
Statute Law (Miscellaneous Provisions) Act 2008 (Act 62, assented 1 July 2008).
To provide for the Legal Profession Admission Board to be treated as a statutory body for purposes of the auditing provisions of the Act.
Appropriation (Budget Variations) Act 2008 (Act 25, assented 11June 2008)
The object of this Bill is to appropriate additional amounts from Consolidated Fund for recurrent services and capital works and services for the year 2007–2008 for the purpose of giving effect to certain Budget variations required by exigencies of Government. Annual Reports (Departments) Amendment Regulation 2007 Annual Reports (Statutory Bodies) Amendment Regulation 2007
The following amendments were made. To require annual reports to be
available on the internet.
To provide for small agencies to report triennially (not annually) on EEO, ethnic affairs and waste.
To provide for Department of Education and Training to report on EEO matters for the Teaching Services.
Appropriation Act 2008 (Act 45, assented 30 June 2008)
This Act appropriates out of the Consolidated Fund sums of money required for the recurrent services and capital works and services of the Government during the 2008-09 financial year. The Act for 2008-09 contains an additional appropriation to allocate revenue raised in connection with changes to gaming machine taxes for spending on health related services. The Act also makes additional appropriations for recurrent services and capital works and services for the years 2007-08 and 2006-07 to give effect to certain Budget variations required by the exigencies of Government. Appropriation (Parliament) Act 2008 (Act 46, assented 30 June 2008)
This Act appropriates out of the Consolidated Fund sums for the recurrent services and capital works and services of the Legislature for the year 2008-09. Appropriation (Special Offices) Act 2008 (Act 47, assented 30 June 2008)
This Act appropriates out of the Consolidated Fund sums for the recurrent services and capital works and services for 2008-09 for: Independent Commission Against
Corruption
Ombudsman’s Office
State Electoral Office
Office of the Director of Public Prosecutions

OFM 2007-08 Annual Report - 109
Annual Reporting Legislation
The Treasurer administers the Annual Reports legislation governing departments and statutory bodies. Since the end of 1991 the Treasury has conducted an annual reports review program. This program has two objectives: monitoring compliance
with annual reporting legislation, and
promoting best practice in public sector annual reporting.
The results of the 2006-2007 annual reports review program are summarised in Treasury Circular NSWTC 08/10. Instances of “better” reporting practices are cited.
Exemptions and variations from reporting requirements under Acts and Regulations
Agency Applicable Financial Year
Exemption/Variation Reason(s) for Approval
Pacific Western Pty Limited
2007/08 Extended final financial year and exempted from requirement for preparation and audit of a final financial report.
Entity deregistered.
Dosimetry & Imaging Pty Limited
2007/08 Exemption from requirement for preparation and audit of a final financial report.
Entity no longer controlled.
TheraPPy Pty Ltd 2007 Exemption from requirement for preparation and audit of a final financial report.
Entity deregistered.
UNSW Asia Foundation
2007 Exemption from requirement for preparation and audit of a final financial report.
Foundation liquidated.
UNSW Asia
2007 Extended final financial year from 1 January 2006 to 21 December 2007.
Company liquidated.
Department of Water and Energy
2006/07 Exemption from disclosure of certain budget information.
Agency restructure.
NSW Grains Board 2005-2007 Extended reporting period from 1 October 2005 to 10 October 2007.
Date of termination of the Board’s Scheme of Arrangement.
NSW Grains Board 2007-2009 Financial year extended to cover the period 11 October 2007 to 31 December 2009. Exemption from requirement for preparation and audit of a final financial report.
Dissolution of the entity.
Time extensions granted to reporting dates under Acts and Regulations 1. To Submit Financial Statements
Agency Applicable Financial Year
Exemption/Variation Reason(s) for Approval
Department of Primary Industries (DPI) & Forests NSW
2006/07 Extension to 27 August 2007
Additional time to consolidate accounts of DPI and Forests NSW.
Lake Illawarra Authority
2006/07 Extension to 25 August 2007
Additional information required from Wollongong City Council.
Newcastle Showground & Exhibition Centre
2006/07 Extension to 5 October 2007
Extensive damage to buildings, financial records and equipment.
Department of Commerce
2006/07 Extension to 17 August 2007
Agency restructure.
Department of Water & Energy
2006/07 Extension to 17 August 2007
Agency restructure.
Department of Environment & Climate Change
2006/07 Extension to 17 August 2007
Agency restructure.
Department of Lands
2006/07 Extension to 17 August 2007
Agency restructure.
Catchment Management Authorities
2006/07 Extension to 20 August 2007
Agency restructure.
Rural Lands Protection Board
2007 Extension to 28 March 2008
Employee issues and accounting irregularities.
Aus Health International
2006/07 Extension to 30 September 2007
Abolition of statutory body.
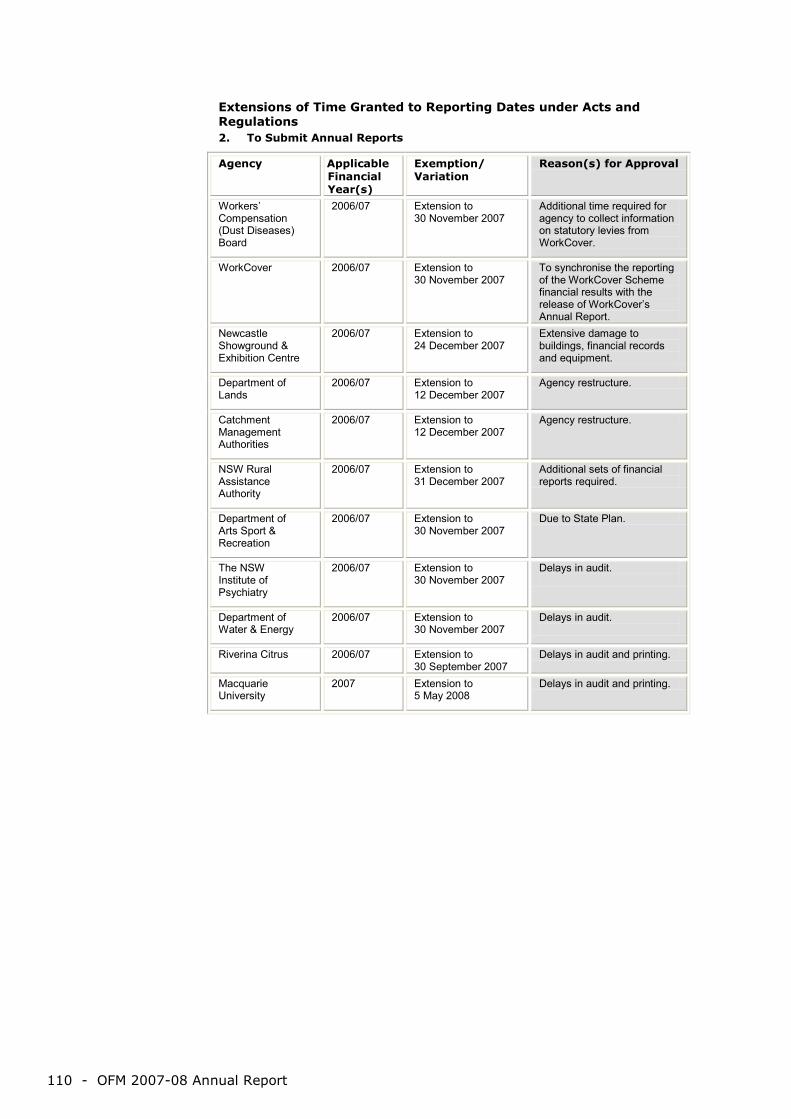
110 - OFM 2007-08 Annual Report
Extensions of Time Granted to Reporting Dates under Acts and Regulations 2. To Submit Annual Reports
Agency Applicable Financial Year(s)
Exemption/ Variation
Reason(s) for Approval
Workers’ Compensation (Dust Diseases) Board
2006/07 Extension to 30 November 2007
Additional time required for agency to collect information on statutory levies from WorkCover.
WorkCover 2006/07 Extension to 30 November 2007
To synchronise the reporting of the WorkCover Scheme financial results with the release of WorkCover’s Annual Report.
Newcastle Showground & Exhibition Centre
2006/07 Extension to 24 December 2007
Extensive damage to buildings, financial records and equipment.
Department of Lands
2006/07 Extension to 12 December 2007
Agency restructure.
Catchment Management Authorities
2006/07 Extension to 12 December 2007
Agency restructure.
NSW Rural Assistance Authority
2006/07 Extension to 31 December 2007
Additional sets of financial reports required.
Department of Arts Sport & Recreation
2006/07 Extension to 30 November 2007
Due to State Plan.
The NSW Institute of Psychiatry
2006/07 Extension to 30 November 2007
Delays in audit.
Department of Water & Energy
2006/07 Extension to 30 November 2007
Delays in audit.
Riverina Citrus 2006/07 Extension to 30 September 2007
Delays in audit and printing.
Macquarie University
2007 Extension to 5 May 2008
Delays in audit and printing.

OFM 2007-08 Annual Report - 111
index
a AAA Rating ................................ 2,3, 5,18, 20 AASB ......................................................... 58 Aboriginal and Torres Straight Islander staff84 Address ............................... Inside front cover Acronyms list ................................................ 1 Access ................................ Inside front cover Accounting Policy and Guidance .............. 101 Accounts Payable Performance .................. 86 Achievements ........................................ 3, 10 Action Plan for Women ............................... 83 Adjustments to OFM structure ...................... 9 Agencies Satisfaction ................................. 19 Agency biennial survey ......................... 19, 33 Agency Commitment .................................. 16 Agency Relations ............................. 7, 33, 38 Aims and Objectives .. 3, 20, 21, 26, 29, 31, 34 Allianz Australia insurance Limited ............. 35 Annual Reporting ..................................... 113 Annual Report Cost ............. Inside front cover Annual Reporting Legislation .................... 109 Appropriation Bills .................................... 112 Asset holdings ........................................ 5, 90 Asset Management and Procurement
Policy ............................... 19, 22, 24, 32, 97 Audit and Risk Committee .......................... 35 Audit Office ................................................ 35 Audit Opinion ............................................. 40 Audited Financial Statements ..................... 43 Australian Accounting Standards .... 14, 23, 32 Australian Accounting Standards
Board ................................................ 88, 93 Australian Energy Regulator ................... 1, 30 Australian New Zealand School of
Government ............................................ 87
b Balance Sheet ............................................ 45 Balance sheet management ......................... 4 Better Resource Allocation and
Management ..................................... 18, 22 Boards ....................................................... 88 Budget 2007-08 ......................................... 14 Budget 2008-09 ....................... 14, 20, 23, 31 Budget estimate .......................................... 6 Budget and Financial Management
Directorate ..................... 8, 9, 11, 20, 21, 22 Budget Management ............................. 5,4,6, Budget Papers, State ................................. 34 Budget process, annual Infrastructure
Review .................................................... 14 Budget (State) ........................................ 5, 18 Budget, (Treasury) ......................... 11, 12, 13 Business Case Gateway Review ................ 25 Business information management system . 15 Business Improvement ........................... 9, 34
c Capital Authorisation Limit .......................... 13 Capital budgeting system ............................. 3 Cash Flow Statement ................................. 46 Certificate IV in Government Program ........ 36 Certificate IV in Records Management ........ 36 Charter of Budget Honesty ............................. Chief and Senior Executive
Officers ................................................... 12 Circulars ..................................................... 38 Clients and Stakeholders ................................ Climate change .......................................... 30 Code of Conduct ........................................ 11 Code of Good Practice with
Agencies ..................................... 15, 16, 38 Commercial Policy Framework ............... 4, 31 Commercial Government Businesses 5, 18, 28 Commercial Policy Framework ............. 4, 100 Commercial Sector Performance Branch ...... 9 Commitment to Agencies/ Stakeholders
Staff/Treasurer ............................ 16, 17, 38 Commitment to Stakeholder ...................... 16 Committees and Boards ............................. 88
Committees established ............................. 88 Committees abolished ................................ 93 Commonwealth Grants Commission ...... 3, 26 Communication Strategies ............................. Commonwealth-State Funding .......14, 18, 31 Commonwealth-State Financial Relations
Framework ............................................. 29 Commonwealth-State Working Groups....... 29 Communication Strategies ......................... 38 Competition and Regulation Working Group29 Consolidated Financial
Statements ........... Inside front cover, 43, 98 Consultants, Expenditure on ................ 34, 85 Consultative Reference Committee ............ 30 Contact Details ................... Inside front cover Content Management System .................... 38 Corporate Management Unit ................... 8, 9 Corporate Plan . Inside front cover, 2, 3, 16, 34 Corporate Governance ...................32, 35, 96 Correspondence ........................................ 35 Council of Australian Governments
(COAG) .... 2, 3, 9, 13, 14, 15, 26, 28, 29, 30 Credit Card Certification ............................. 86 Credit Rating reviews ................................. 20 Cross subsidies ......................................... 26 Crown Entity ............ Inside front cover, 19, 35
d Department of Commerce ........... 9, 12, 13, 24 Department of Education and Training ..... 108 Department of Housing .............................. 27 Department of Lands................................ 110 Department of Premier and
Cabinet ............................ 15, 27, 29, 30, 32 Department of State and Regional
Development .......................................... 27 Department of Water and Energy ............. 110 Deputy Secretary Operations ........ 8, 9, 10, 35 Development Contribution Policies for Sate
and Local Government ............................ 25 Directorate staff ......................................... 11 Directorates and Units ................................ 11 Directorate Work Plans ........................ 34, 35 Disability Strategic Plan ............................. 83
e Economic and Fiscal Environment ............. 14 Economic and Fiscal Strategies ......... 4, 6, 28 Economic Appraisal, Guidelines for ............ 96 Economic Forecasting .................................. 6 EEO Groups, trends in distribution ............. 84 EEO Groups, trends in representation ........ 84 Efficiency and effectiveness of public sector
agencies ................................................... 4 Electricity .................................................. 30 Electricity Project Team................................ 9 Electronic Service Delivery ......................... 38 Emissions Trading Scheme discussion
Paper ..................................................... 30 Employment Basis Staff Categories ........... 12 Energy Branch ............................................. 9 Energy Reform Project ............................... 12 Energy Consumption.................................. 94 Energy Management and
Performance ........................................... 94 Energy Sector Reform ................................ 30 Environment .............................................. 14 Environment and Economic Services
Directorate .................................... 8, 11, 31 Equal Employment Opportunity .................. 84 Ethnic Affairs Priority Statement ................. 83 Executive members, OFM .................... 10, 34 Executive achievements and
performance assessment ........................ 10 Executive remuneration ............................. 10 Exemptions and Variations from Reporting
Requirements under Acts and Regulations ............................ 109
f Finances .................................................... 13 Financial and Annual
Reporting Legislation ............................ 109 Financial Appraisal Guidelines ............ 32, 100 Financial Asset and Liability
Management ........................................ 4, 6 Financial Distribution Policy ....................... 32 Financial information system ...................... 35 Financial Management
Framework ........................................ 15, 22 Financial Reporting Code for Budget
Dependent General Government Sector Agencies ................................................ 97
Financial Statements ............................ 43-84 First Home Owner Grant Act 2000 ........... 106 Fiscal influences ........................................ 14 Fiscal and Economic
Directorate ......... 8, 9, 11, 20, 21, 26, 29, 31 Fiscal Responsibility Act 2005 ............... 20, 27 Fiscal Strategy ...................................... 26, 36 Forests NSW ............................................. 32 Freedom of Information .............................. 97 Fuel Consumption...................................... 98
g Gateway Review ................................... 12, 25 General Government Financial Management
Framework .................................... 4, 19, 22 General Government expenses ................... 6 Government Commercial Activities ............ 32 Government Financial Statistics ............ 18-32 Government Self Insurance ....................... 35 Government Wages Policy ......................... 27 Grading Structure - Staff ............................ 12 Graduate Recruitment................................ 36 Gross State Product ......................... 5, 18, 20 GST Revenue ......................... 3, 5, 18, 26, 31 Guidelines for Boards of Government
Businesses ............................................. 32
h Half-Yearly Budget Review ............. 14, 20, 23 Heads of Treasuries ....................... 89, 90, 91 Horizontal Fiscal Equalisation .................1, 26 Hours Treasury Reception
........................................ Inside front cover Human and Social Services Directorate ..... 11 Human Capital Working Group .................. 29 Human Resource Plan ............................8, 11
i Independent Pricing and Regulatory
Tribunal (IPART) ............................... 16, 30 Index ....................................................... 111 Indigenous cadet .................................. 12, 36 Infrastructure asset management and
procurement ......................................... 4, 6 Infrastructure Development Contributions .. 25 Infrastructure Levy Implementation
committee .............................................. 25 Infrastructure Review, annual Budget
process .................................................. 14 Infrastructure spending ............................ 4, 6 Inquiry into Electricity Supply in NSW
(Owen Report) ........................................ 30 Insurance .................................................. 35 Insurance Protection Tax Act ................... 105 Internal Audit Bureau ................................. 35 Internal Audit Capacity of the NSW Public
Sector ............................................... 27, 35 Internal Government Red Tape Review ..... 30 Intranet/Website ................. inside front cover, Independent Pricing and Review
Tribunal (IPART) ..................... 3, 16, 31, 32 Intergovernmental Financial Arrangements 26 Interstate Comparison of Taxes ................. 97

112 - OFM 2007-08 Annual Report
k Keno .......................................................... 26 Key Achievements........................ 2-3, 5-7, 10
l Leave management ................................... 34 Legislation ......................................... 104-110 Legislative Changes ................................. 106 Legislation under the Treasurer's
Administration ....................................... 104 Letter of Submission to Minister
........................................ Inside front cover Long-Term Fiscal Pressures ...................... 20 Lucy Mentoring Program ...................... 83, 84
m Major Achievements ........................... 1, 3, 10 Major Assets Acquired ................................ 86 Major Capital Projects Reporting System ...... 9 Management and Functions ........... 4, 8, 9, 10 Metropolitan Water Plan ............................. 32 Microeconomic Reform ............... 4, 15, 27, 29 Ministerial Council on Energy ..................... 30 Mission/Charter ...................................... 4, 20 Monitoring Policy ............................................ Moody’s ........................................... 2, 18, 20
n National Electricity Law .............................. 30 National Gas Law ....................................... 30 National Partnership Agreements ............... 27 National Performance Payments .................. 3 National Reform Agenda (NRA) ............ 13, 29 Net cost of Services (NCOS) ................ 13, 20 Notes to Financial Statements .................... 49 NSW Electricity Generation and Retail
Project Team ........................................ 8, 9 NSW Infrastructure Audit submission .......... 29 NSW Self Insurance Corporation Act ........ 105
o Objectives ................................................... 4 Occupational Health and Safety ................. 82 Office of Infrastructure
Management ............................. 8, 9, 11, 20 Office of State Revenue (OSR)
....................... 1Inside front cover, 1, 13, 26 OFM Budget ................................... 11, 12, 13 OFM Corporate Plan .................................. 34 OFM Executive ......................................... 8, 9 OFM Directorate Staff................................. 11 OFM Operations ........................................ 5-7 OFM Planning and Budget Systems ........... 36 OFM Staff Age Profile................................. 12 OFM Style Guide ........................................ 36 OFM Website, top 10 pages ....................... 38 OFM’s Internal Audit Plan ........................... 35 OFM’s People ................................. 8, 11, 12, OFM’s Processes ....................................... 15 OFM’s Strategic Framework ......... 1, 4, 20, 34 OFM’s Tax Policy ................................. 26, 31 Operating Statement .................................. 43 Operational Documents .............................. 97 Operational Efficiency................................... 7 Operational Performance.............................. 3 Organisation Building .................. 3, 15, 33-38 Organisation Chart ....................................... 8 Organisation Structure and Functions ........... 8 Organisational Change ................................. 9 Organisational Efficiency ............................ 34 Organisational Structure Changes ............. 8-9 Overseas Visits by Treasury Officers .......... 97 Overview of Performance .......................... 2-7 Owen Report .......................................... 3, 30
p Payroll Tax Harmonisation .......................... 31 Payroll Tax Act 2007 ................................ 107 Performance Agreements ....................... 2, 34
Performance Appraisal and Review
(PAR) .............................................. 3, 7, 36 Performance Evaluation of Treasury
by Agencies ........................................... 16 Performance Indicators ............................. 5, 6 Performance of Chief and Senior
Executive Officers .................................. 10 Performance and Development Scheme .... 33 Performance Management ..................... 7, 34 Performance Management and
Budgeting System (PMBS) ............ 3, 15, 22 Performance Review and Risk
Management .......................................... 35 Performance Review Unit ................. 3, 27, 35 Priority Delivery Plans ................................ 22 Privacy Management Plan ......................... 84 Private Sector governance standards .......... 3 Privately Financed Projects (PFPs) ............ 25 Procurement Policy .............................. 12, 25 Production Cost, Annual
Report .............................. Inside front cover Program Statement – Expenses and
Revenues ............................................... 47 Project Management.................................... 7 Promotion .................................................. 96 Public Authorities (Financial
Arrangements) Act (PAFA) ..................... 32 Public Finance and Audit Act .................... 108 Public Sector Agencies ................................ 6 Public Sector Financial Management and
Reporting ............................................... 23 Public Sector Industrial Relations ............... 27 Public Sector Management
Systems ................................................ 4, 6 Public Sector Workforce Office .................. 27 Publications .......................................... 38, 96
r Recruitment Effectiveness ......................... 36 Records Management ............................... 82 Recycled content/material .......................... 94 Red Tape Review ................................. 12, 30 Regular Consultation, Openness and
Courtesy ........................................... 16, 30 Reporting and Monitoring Policy .................... Reporting on State Finances ................. 19, 23 Reporting Requirements under Acts
and Regulations, Exemptions ................ 109 Remuneration Levels Staff Categories .. 10, 12 Remuneration, Senior Executives .............. 10 Research and Development....................... 23 Resource Allocation
Branches ................ 9, 20, 22, 24, 31, 32, 34 Results ................................................2-3, 20 Result Indicators ............... 1, 5, 18, 22, 28, 34 Results and Services Plan (RSP) ...................
............... inside front cover, 6, 9, 22, 34, 96 Revenue Strategy ................................. 26, 31 Risk Management ................................ 35, 88
s Secondments ................................. 36, 38, 87 Secretary of NSW
Treasury ....... Inside front cover, 2, 8, 10, 27 Self Insurance Corporation ............... 1, 21, 87 Senior Officers ........................ 8, 9, 10, 12, 84 Services ...................................................... 4 Service Delivery Reviews .......................... 27 Service Measures ........................................ 6 Service level agreement .............................. 4 Services ........................................... 4, 20, 24 SiCorp ........................................ 1, 12, 21, 35 Specific Purpose Payments (SPPs) ...... 26, 29 Staff – Age Profile ...................................... 12 Staff Development ..................................... 36 Staff Feedback ..................................... 33, 36 Staff Numbers and Grading Structure ........ 12 Staff - Remuneration Level ................... 10, 12
Staff Satisfaction/Survey ................... 3, 33, 37 Staff turnover ......................................... 7, 33 Stakeholder Feedback/Satisfaction ... 7, 17, 33 Standard and Poor’s ......................... 2, 18, 20 State Balance Sheet Management ............. 21 State Budget Papers ....................... 34, 38, 98 State Budget Process ................... 2, 3, 19, 35 State Energy supply ................................... 15 State Financial Reports .............................. 98 State Fiscal
Strategy .. 3, 4, 14, 15, 18, 20, 21, 24, 27, 31 State Infrastructure Strategy
(SIS) ................... 2, 3, 4, 15, 24, 25, 38, 98 State Plan ....................... 2, 14, 16, 20, 22, 34 State Resource Management ....................... 4 State Revenue ..................................... 5, 106 State Superannuation ............................ 5, 18 State Taxes ............................................... 18 Statement by Department Head ........... 10, 42 Statement of Corporate or
Business Intent ................................... 6, 28 Statement of Recognised Income and
Expense ................................................. 44 Statement of Performance, Executive
Members ................................................ 10 Statutory Reporting Compliance
List .................................. Inside front cover Strategic Direction ....................................... 3 Strategic Gateway Reviews ....................... 25 Strategic Management Framework ......... 2, 34 Strategies ....................................4, 20-22, 24 Structure, OFM ............................................ 9 Summary of Compliance with Financial
Directives ............................................... 48 Sydney Water ............................................ 32
t Tax Review .................................................. 6 Tax Revenue ......................................... 6, 28 Taxation Policy ................................. 3, 26, 31 Total Asset Management (TAM)
Policy/Plan ........................ 6, 18, 19, 24, 97 Total State Revenue ............................ 26, 28 Training .............................. 34, 36, 37, 82, 84 Training days per officer .................... 7, 33, 36 Transfer duty ....................................... 14, 31 Treasurer
........... Inside front cover, 16, 21, 23, 31, 34 Treasurer’s Legislation ............................. 104 Treasury Circulars .......................... 24, 38, 95 Treasury Expenses .................................... 13 Treasury Financial Information System ...... 38 Treasury Managed Fund ............................ 35 Treasury Management Policy ............... 32, 96 Treasury on a page ................................ 4, 34 Treasury Operational Documents ............... 97 Treasury Policy & Guidelines
Papers .............................................. 24, 96 Treasury Research & Information Papers . 101 Treasury Technical Officer ......................... 12 Treasury’s Budget ...................................... 13 Treasury’s website/intranet ........................ 32 Triple A ................................... 2, 5, 15, 18, 20
v Valuation of Crown Land Reserves ............ 35 Values, OFM’s ........................ 4, 7, 11, 15, 33
w Wages Policy, Commonwealth ............... 3, 15 Wages Policy Task Force ............................ 3 Waste Reduction and Purchasing Policy .... 94 Web Site ............ Inside front cover, 23, 32, 38 Westpac .................................................... 21 WorkCover ................................................ 82 Working with Agencies ................ 6, 16, 17, 19 Working with Government .......................... 38 Writing skills course ................................... 36