office of biostatistics eva lu a ti on sta ti s ti ca l r · 3 1 executive summary study 3006...
TRANSCRIPT

U.S. Department of Health and Human ServicesFood and Drug Administration Center for Drug Evaluation and ResearchOffice of Translational SciencesOffice of Biostatistics
S T A T I S T I C A L R E V I E W A N D E V A L U A T I O N
CLINICAL STUDIES
NDA/Serial Number: 125261 / 138
Drug Name: Stelara (ustekinumab)
Indication(s): Psoriasis (adolescent subjects)
Applicant: Janssen
Dates: Submitted:12/15/2016PDUFA: 10/15/2017
Review Priority: Standard review
Biometrics Division: Division of Biometrics III
Statistics Reviewer: Kathleen Fritsch, Ph.D.
Concurring Reviewer: Mohamed Alosh, Ph.D.
Medical Division: Division of Dermatology and Dental Products
Clinical Team: Brenda Carr, M.D. / Snezana Trajkovic, M.D.
Project Manager: Dawn Williams
Keywords: Pediatric subjects
Reference ID: 4139813

2
Table of Contents
1 EXECUTIVE SUMMARY ..............................................................................4
2 INTRODUCTION...........................................................................................5
2.1 Overview.............................................................................................................52.1.1 Regulatory History.......................................................................................52.1.2 Clinical Studies............................................................................................5
2.2 Data Sources.......................................................................................................6
3 STATISTICAL EVALUATION ......................................................................6
3.1 Data and Analysis Quality ................................................................................6
3.2 Evaluation of Efficacy .......................................................................................73.2.1 Study Design and Statistical Analysis .........................................................73.2.2 Subject Disposition......................................................................................93.2.3 Baseline Characteristics.............................................................................113.2.4 Efficacy Endpoints.....................................................................................123.2.5 Sensitivity Analysis ...................................................................................143.2.6 Efficacy over Time ....................................................................................143.2.7 Other Secondary Endpoints .......................................................................15
3.3 Evaluation of Safety.........................................................................................173.3.1 Extent of Exposure ....................................................................................173.3.2 Adverse Events ..........................................................................................17
4 FINDINGS IN SPECIAL/SUBGROUP POPULATIONS .............................18
4.1 Gender, Race, Age, and Geographic Region.................................................18
4.2 Other Special/Subgroup Populations.............................................................19
5 SUMMARY AND CONCLUSIONS .............................................................20
5.1 Statistical Issues and Collective Evidence .....................................................20
5.2 Conclusions and Recommendations...............................................................20
5.3 Labeling Recommendations............................................................................21
SIGNATURES/DISTRIBUTION LIST..................................................................21
Reference ID: 4139813
3
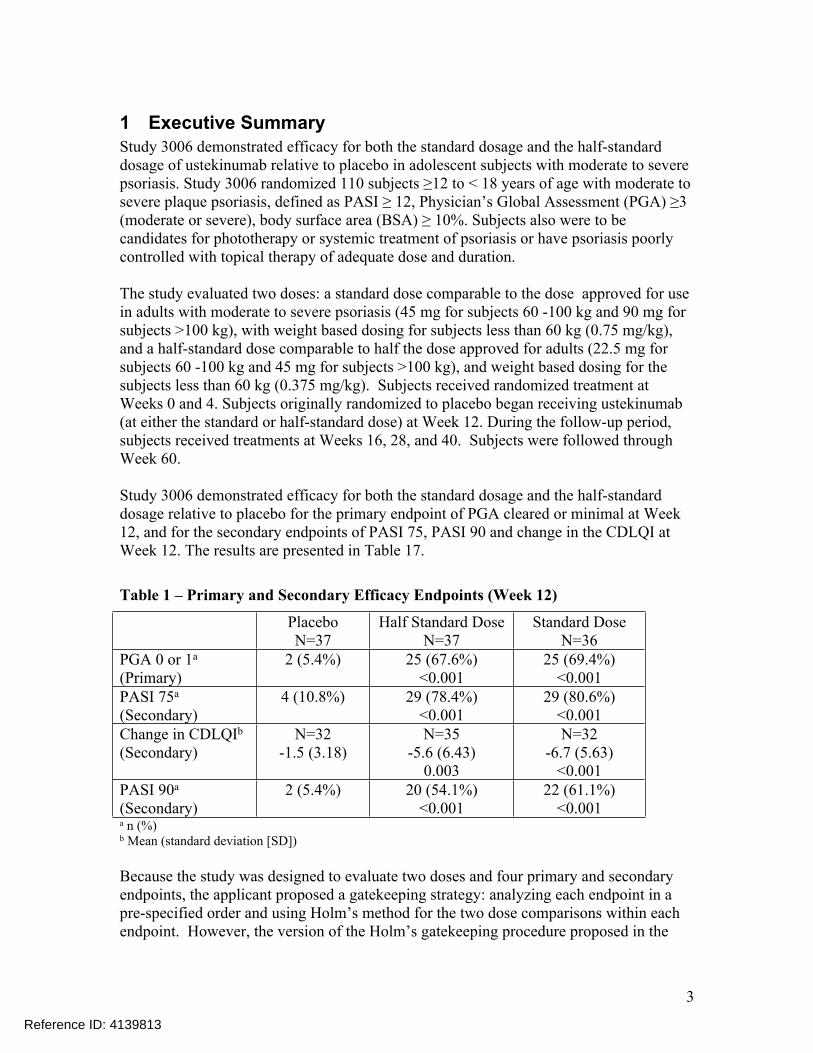
1 Executive SummaryStudy 3006 demonstrated efficacy for both the standard dosage and the half-standard dosage of ustekinumab relative to placebo in adolescent subjects with moderate to severe psoriasis. Study 3006 randomized 110 subjects ≥12 to < 18 years of age with moderate to severe plaque psoriasis, defined as PASI ≥ 12, Physician’s Global Assessment (PGA) ≥3 (moderate or severe), body surface area (BSA) ≥ 10%. Subjects also were to be candidates for phototherapy or systemic treatment of psoriasis or have psoriasis poorly controlled with topical therapy of adequate dose and duration.
The study evaluated two doses: a standard dose comparable to the dose approved for use in adults with moderate to severe psoriasis (45 mg for subjects 60 -100 kg and 90 mg for subjects >100 kg), with weight based dosing for subjects less than 60 kg (0.75 mg/kg), and a half-standard dose comparable to half the dose approved for adults (22.5 mg for subjects 60 -100 kg and 45 mg for subjects >100 kg), and weight based dosing for the subjects less than 60 kg (0.375 mg/kg). Subjects received randomized treatment at Weeks 0 and 4. Subjects originally randomized to placebo began receiving ustekinumab (at either the standard or half-standard dose) at Week 12. During the follow-up period, subjects received treatments at Weeks 16, 28, and 40. Subjects were followed through Week 60.
Study 3006 demonstrated efficacy for both the standard dosage and the half-standard dosage relative to placebo for the primary endpoint of PGA cleared or minimal at Week 12, and for the secondary endpoints of PASI 75, PASI 90 and change in the CDLQI at Week 12. The results are presented in Table 17.
Table 1 – Primary and Secondary Efficacy Endpoints (Week 12)
PlaceboN=37
Half Standard DoseN=37
Standard DoseN=36
PGA 0 or 1a (Primary)
2 (5.4%) 25 (67.6%)<0.001
25 (69.4%)<0.001
PASI 75a (Secondary)
4 (10.8%) 29 (78.4%)<0.001
29 (80.6%)<0.001
Change in CDLQIb (Secondary)
N=32-1.5 (3.18)
N=35-5.6 (6.43)
0.003
N=32-6.7 (5.63)
<0.001PASI 90a (Secondary)
2 (5.4%) 20 (54.1%)<0.001
22 (61.1%)<0.001
a n (%)b Mean (standard deviation [SD])
Because the study was designed to evaluate two doses and four primary and secondary endpoints, the applicant proposed a gatekeeping strategy: analyzing each endpoint in a pre-specified order and using Holm’s method for the two dose comparisons within each endpoint. However, the version of the Holm’s gatekeeping procedure proposed in the
Reference ID: 4139813

4
protocol does not strictly control the type I error rate because the non-separable version of the procedure was specified. Even though the procedure as specified in the protocol did not strictly control the type I error rate, because all of the primary and secondary endpoint comparisons were significant at 0.025, the study would have met the statistical significance criteria on all endpoints for any valid truncation fraction that could have been specified to make the procedure separable.
The applicant used biased-coin minimization to allocate subjects to treatment. A re-randomization test was conducted on the primary endpoint analysis and the results were consistent with the protocol-specified analyses.
In addition to the pre-specified primary and secondary endpoints, the applicant has proposed including in labeling endpoints classified as ‘other’ secondary endpoints in the protocol, including three additional endpoints evaluated at Week 12 (PGA cleared, PASI 100, and change from baseline in PedsQL), and the observed results at Week 52 for all proposed endpoints. As the other secondary endpoints and the Week 52 results were analyzed in an exploratory manner without multiplicity adjustments, they may not be appropriate for labeling.
2 Introduction
2.1 Overview
2.1.1 Regulatory HistoryStelara (ustekinumab) received approval for the treatment of adult patients with moderate to severe plaque psoriasis who are candidates for phototherapy or systemic therapy on 9/25/2009. Subsequently, Stelara has received approval for psoriatic arthritis and Crohn’s disease. With this supplement, the applicant is seeking to expand the psoriasis indication to include adolescent subjects ≥12 to < 18 years of age. The applicant has submitted Study CNTO1275PSO3006 (Study 3006) which evaluated subjects ≥12 to < 18 years of age with moderate to severe psoriasis. Protocol 3006 was designed with input from the European Union Pediatric Committee under a Pediatric Investigation Plan. The study was conducted in Europe and Canada. The applicant did not submit the protocol for Study 3006 to IND 9590 and the FDA did not provide any comments on the protocol. A Pre-Supplemental BLA meeting was held on 5/4/2016.
In the Approval letter issued 9/25/2009 for the psoriasis indication in adults, FDA deferred submission of pediatric protocols until 12/1/2022 because “pediatric studies should be delayed until adult safety and efficacy data have been collected.” In addition to Protocol 3006, the applicant plans to conduct a second study in pediatric subjects ≥6 to <12 years of age.
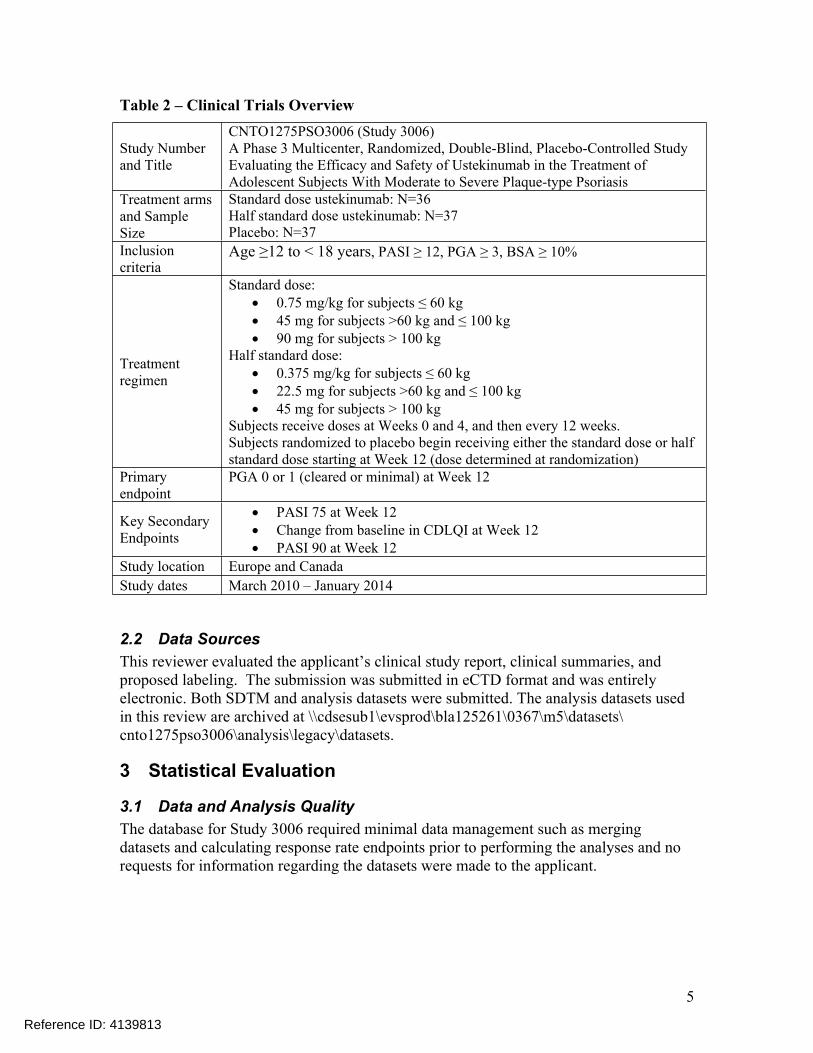
2.1.2 Clinical Studies The applicant has submitted the results of a clinical trial in adolescent subjects with psoriasis. The design details for Study 3006 are summarized in Table 2.
Reference ID: 4139813
5
Table 2 – Clinical Trials Overview
Study Number and Title
CNTO1275PSO3006 (Study 3006)A Phase 3 Multicenter, Randomized, Double-Blind, Placebo-Controlled Study Evaluating the Efficacy and Safety of Ustekinumab in the Treatment of Adolescent Subjects With Moderate to Severe Plaque-type Psoriasis
Treatment arms and Sample Size
Standard dose ustekinumab: N=36Half standard dose ustekinumab: N=37Placebo: N=37
Inclusion criteria
Age ≥12 to < 18 years, PASI ≥ 12, PGA ≥ 3, BSA ≥ 10%
Treatment regimen
Standard dose: 0.75 mg/kg for subjects ≤ 60 kg 45 mg for subjects >60 kg and ≤ 100 kg 90 mg for subjects > 100 kg
Half standard dose: 0.375 mg/kg for subjects ≤ 60 kg 22.5 mg for subjects >60 kg and ≤ 100 kg 45 mg for subjects > 100 kg
Subjects receive doses at Weeks 0 and 4, and then every 12 weeks.Subjects randomized to placebo begin receiving either the standard dose or half standard dose starting at Week 12 (dose determined at randomization)
Primary endpoint
PGA 0 or 1 (cleared or minimal) at Week 12
Key Secondary Endpoints
PASI 75 at Week 12 Change from baseline in CDLQI at Week 12 PASI 90 at Week 12
Study location Europe and CanadaStudy dates March 2010 – January 2014
2.2 Data SourcesThis reviewer evaluated the applicant’s clinical study report, clinical summaries, and proposed labeling. The submission was submitted in eCTD format and was entirely electronic. Both SDTM and analysis datasets were submitted. The analysis datasets used in this review are archived at \\cdsesub1\evsprod\bla125261\0367\m5\datasets\ cnto1275pso3006\analysis\legacy\datasets.
3 Statistical Evaluation
3.1 Data and Analysis QualityThe database for Study 3006 required minimal data management such as merging datasets and calculating response rate endpoints prior to performing the analyses and no requests for information regarding the datasets were made to the applicant.
Reference ID: 4139813

6
3.2 Evaluation of Efficacy
3.2.1 Study Design and Statistical AnalysisStudy 3006 randomized 110 subjects ≥12 to < 18 years of age with moderate to severe plaque psoriasis. Subjects were to have PASI ≥ 12, Physician’s Global Assessment (PGA) ≥3 (moderate or severe), body surface area (BSA) ≥ 10%, and be candidates for phototherapy or systemic treatment of psoriasis or have psoriasis poorly controlled with topical therapy of adequate dose and duration.
The treatment arms were the standard dosage of ustekinumab, half the standard dosage of ustekinumab, or placebo. The standard dosage of ustekinumab was
0.75 mg/kg for subjects ≤ 60 kg 45 mg for subjects > 60 kg but ≤ 100 kg 90 mg for subjects > 100 kg
The half-standard dosage was 0.375 mg/kg for subjects ≤ 60 kg 22.5 mg for subjects > 60 kg but ≤ 100 kg 45 mg for subjects > 100 kg
To maintain the blind, all subjects received two injections (standard dose volume ustekinumab/half-standard dose volume placebo, standard dose volume placebo/half-standard dose volume ustekinumab, or standard dose volume placebo/half-standard dose volume placebo) so that all subjects would be injected with the medication volumes corresponding to the half-standard and standard dosage volumes for their weight.
The study included a 12-week placebo-controlled period, after which subjects on the placebo arm crossed over to either the standard dosage or half-standard dosage (in a 1:1 ratio and determined in the original randomization). Subjects received the last dose of study medication at Week 40 and were followed through Week 52 for efficacy and Week 60 for safety. In the study, 36 subjects were randomized to the standard dosage of ustekinumab, 37 were randomized to the half-standard dosage of ustekinumab, and 37 were randomized to placebo. Treatment allocation was stratified by investigational site and baseline weight (≤ 60 kg vs. > 60 kg) using a biased-coin minimimization algorithm. Subjects on the ustekinumab arms received doses at Weeks 0 and 4 followed by every 12 week dosing with the last dose at Week 40. Subjects on the placebo arm received placebo at Weeks 0 and 4 followed by half-standard or standard doses at Weeks 12 and 16 and every 12 week dosing through Week 40.
At Week 8, subjects whose PASI scores increased by at least 50% from baseline were permitted use of moderate to high potency topical steroids through Week 12. Very high potency steroids were not allowed. After Week 12, subjects were encouraged to decrease and discontinue steroid use by Week 16.
Efficacy was assessed using PGA, PASI, and the Children’s Dermatology Life Quality Index (CDLQI) and Pediatric Quality of Life Inventory (PedsQL). The PGA is a 6-grade scale with levels: cleared, minimal, mild, moderate, marked, and severe. The primary
Reference ID: 4139813

7
efficacy endpoint was the proportion of subjects achieving scores of clear or minimal (≤ 1) on the PGA at Week 12. The key secondary endpoints were
PASI 75 at Week 12 Change in CDLQI at Week 12 PASI 90 at Week 12
The other efficacy endpoints were PGA 0 and PGA ≤ 2 at Week 12 PGA 0, PGA ≤ 1, PGA ≤ 2 over time PASI 50 and PASI score of 0 (PASI 100) at Week 12 PASI 50, PASI 75, PASI 90, PASI 100 over time Change in CDLQI over time Change in CDLQI components at Week 12 CDLQI scores of 0 or 1 at Week 12 Change in PedsQL at Week 12 (total score, psychosocial health summary score,
physical health summary score, and each scale of PedsQL) Change in PedsQL (total score, psychosocial health summary score, and physical
health summary score) over time
The analysis for the primary endpoint of the proportion of subjects achieving PGA scores of clear or minimal at Week 12 compared the standard dosage group versus the placebo group and the half-standard dosage group versus the placebo group. This analysis was conducted on all randomized subjects. The endpoint was analyzed with the Cochran-Mantel-Haenszel (CMH) test stratified on body weight (≤ 60 kg, > 60 kg). Holm’s procedure was used to control multiplicity due to two dosing regimens.
Subjects who entered the early escape arm and used moderate to high potency topical steroids were classified as non-responders at Week 12. In addition, subjects who discontinued study treatment due to lack of efficacy, an adverse event of worsening psoriasis, or who started a prohibited therapy that could affect psoriasis were considered treatment failures from the time of the event onward. The protocol stated that for subjects who did not meet the early escape or treatment failure criteria but had missing data at Week 12, the primary method of handling missing data was to treat these subjects as non-responders. As sensitivity analyses, these subjects were to be handled using (1) LOCF, (2) no imputation (observed cases plus treating early escapes and treatment failures as non-responders), and (3) using a re-randomization test. Note, however, that all subjects in Study 3006 were evaluated at Week 12 and no imputation beyond applying the early escape and treatment failure rules was required for the primary endpoint analysis.
The key secondary endpoints of PASI 75 and PASI 90 were analyzed using the same methods as the primary endpoint. Change in CDLQI was analyzed using ANOVA on the van der Waerden normal scores with baseline weight stratum (≤ 60 kg, > 60 kg) as a covariate. The protocol stated that except for applying treatment failure rules, missing data will not be imputed for the change in CDLQI analyses. In addition, if two or more questions on the CDLQI (out of 10 are left unanswered, the score will be set to missing.
Reference ID: 4139813
8
For the other efficacy endpoints evaluated over time, the protocol also stated that missing data will not be imputed.
To control for multiplicity across dose levels and endpoints, the protocol stated that a gatekeeping strategy will be used to analyze the primary and key secondary endpoints in order (PGA clear or minimal, PASI 75, change in CDLQI, PASI 90), and within each endpoint analysis, the multiplicity due to two doses will be handled using Holm’s method. The protocol stated that the analysis would proceed to the next endpoint as long as at least one of the doses was statistically significant for that endpoint under Holm’s method.
Reviewer DiscussionHolm’s method is not separable (see Dmitrienko, et al, 20081). Type I error is only preserved for a gatekeeping strategy with Holm’s method used within each stage when a truncated version of Holm’s method is used with a truncation fraction strictly less than 1. Alternately, modifying the procedure so that it only moves to the next endpoint in the sequence when both doses meet the significance criteria (rather than at least one dose) would control the type I error rate. Note, however such a procedure that compares the smaller p-value to 0.025 and the larger p-value to 0.05 would be less powerful than just requiring both p-values <0.05 at each stage (which would also control the type I error rate). As the protocol did not specify either of these possibilities, the procedure in the protocol does not strictly control the type I error rate across doses and endpoints. This issue will be further discussed in Section 3.2.4.
The ‘other’ secondary endpoints were analyzed using analogous methods as the primary and key secondary endpoints (CMH test for response rate endpoints or ANOVA on van der Waerden scores for change from baseline endpoints). No multiplicity adjustments were planned in the protocol for the ‘other’ secondary endpoints.
The protocol originally proposed enrolling 150 subjects. Because of challenges with enrolling subjects, the applicant reduced the target enrollment to 105 subjects.
3.2.2 Subject DispositionStudy 3006 enrolled 110 subjects: 36 subjects randomized to the standard dosage of ustekinumab, 37 randomized to the half-standard dosage of ustekinumab, 18 randomized to placebo/standard dosage ustekinumab, and 19 randomized to placebo/half-standard dosage ustekinumab. None of the subjects discontinued study medication during the initial 12 weeks of the study. All subjects were evaluated at the primary efficacy timepoint of Week 12. Two subjects on the placebo arm started prohibited therapies during the initial 12 weeks of the study (one at Week 4 and one at Week 12) and were considered treatment failures through the end of the study. Two additional subjects on the placebo arm met the early escape criteria at Week 8 (PASI scores increased by at least
1 Dmitrienko, A, Tamhane, AC, Wiens, BL, “General multistage gatekeeping procedures,” Biometrical Journal, 50 (2008), 667-677.
Reference ID: 4139813

9
50% from baseline) and began use of moderate to high potency topical steroids per the protocol and were considered treatment failures at Week 12.
During the follow-up stage of the study, 9 subjects discontinued study agent by Week 40 (last scheduled dosing day). The most common reasons for treatment discontinuation were lack of efficacy and adverse events. During the follow-up stage of the study, 17 subjects terminated study participation by Week 60 (last day of follow-up). All subjects remained in the study through at least Week 20. The most common reason for study termination was withdrawal of consent. One subject died during the follow-up stage due to injuries sustained in an automobile accident. A greater proportion of subjects on the placebo/half-standard or half-standard/ half-standard dosage arms met the treatment failure rules during the study than subjects on the placebo/standard or standard/standard dosing regimens. See Table 3.
Table 3 – Subject Disposition
Placebo/ Half Standard
Placebo/ Standard
Half-Std/ Half-Std
Standard/ Standard
Randomized 19 18 37 36Discontinued study medication by Week 12
0 0 0 0
Discontinued study medication by Week 40
2 (10.5%) 0 5 (13.5%) 2 (5.6%)
Adverse event 2 (10.5%) 0 1 (2.7%) 0 Lack of efficacy 0 0 3 (8.1%) 2 (5.6%) Death 0 0 1 (2.7%) 0Met early escape criteria at Week 8
1 (5.3%) 1 (5.6%) 0 0
Met treatment failure rules by Week 12
2 (10.5%) 0 0 0
Met treatment failure rules by Week 60a
5 (26.3%) 1 (5.6%) 8 (21.6%) 2 (5.6%)
Terminated study participation by Week 60
2 (10.5%) 1 (5.6%) 10 (27.0%) 4 (11.1%)
Withdrawal of consent 2 (10.5%) 1 (5.6%) 5 (13.5%) 1 (2.8%) Lost to follow-up 0 0 1 (2.7%) 1 (2.8%) Death 0 0 1 (2.7%) 0 Otherb 0 0 3 (8.1%) 2 (5.6%)a Includes subjects who met treatment failure rules by Week 12b Lack of efficacy (2), adverse event (1), relapse (1), and subject convenience (1) Source: pg 143-144 of \\cdsesub1\evsprod\bla125261\0367\m5\53-clin-stud-rep\535-rep-effic-safety-stud\ped-pso\5351-stud-rep-contr\cnto1275pso3006\csr-full-cnto1275pso3006.pdf and reviewer analysis.
Study 3006 was conducted in 10 countries at 36 centers. Most centers enrolled only a few subjects. The country with the largest number of subjects was Canada with 41 subjects enrolled at 10 centers. See Table 4.
Reference ID: 4139813

10
Table 4 – Number of Subjects by Country
Centers Placebo/ Half Standard
N=19
Placebo/ Standard
N=18
Half-Std/ Half-Std
N=37
Standard/ Standard
N=36Belgium 3 2 2 4 3Canada 10 5 8 14 14Germany 1 0 1 1 0France 2 0 0 3 2UK 3 1 1 2 2Hungary 3 3 0 1 3Portugal 3 3 0 1 4Russia 5 3 4 8 4Sweden 2 1 0 2 0Ukraine 4 1 2 1 4Source: pg 141 of \\cdsesub1\evsprod\bla125261\0367\m5\53-clin-stud-rep\535-rep-effic-safety-stud\ped-pso\5351-stud-rep-contr\cnto1275pso3006\csr-full-cnto1275pso3006.pdf
3.2.3 Baseline CharacteristicsDemographics were generally balanced across the treatment groups. The mean age was 15 years. Approximately half the subjects were male and half were female. About 90% of the subjects were white and 3% were Hispanic or Latino. About 46% of the subjects were ≤ 60 kg, 51% were 60 to 100 kg and 3% were >100 kg. See Table 5 and Table 6.
Table 5 – Subject Demographics (Age, Gender, Race)
PlaceboN=37
Half-Standard Ustekinumab
N=37
Standard Ustekinumab
N=36
TotalN=110
Age (years) Mean 15.6 15.1 14.8 15.2 12 years 1 (3%) 5 (14%) 5 (14%) 11 (10%) 13 years 3 (8%) 3 (8%) 5 (14%) 11 (10%) 14 years 4 (11%) 3 (8%) 4 (11%) 11 (10%) 15 years 7 (19%) 9 (24%) 6 (17%) 22 (20%) 16 years 7 (19%) 8 (22%) 9 (25%) 24 (22%) 17 years 15 (41%) 9 (24%) 7 (19%) 31 (28%)Gender Female 17 (46%) 19 (51%) 20 (56%) 56 (51%) Male 20 (54%) 18 (49%) 16 (44%) 54 (49%)Race White 34 (92%) 30 (81%) 34 (94%) 98 (89%) Black or Afr.-Amer. -- -- -- -- Asian 2 (5%) 3 (8%) 1 (3%) 6 (5%) Am. Ind./ AK Native 1 (3%) 1 (3%) 1 (3%) 3 (3%) Native HI/ Pac. Isl. -- -- -- -- Other/Unknown -- 3 (8%) -- 3 (3%)
Reference ID: 4139813

11
Table 6 – Subject Demographics (Ethnicity, Weight)
PlaceboN=37
Half-Standard UstekinumabN=37
Standard UstekinumabN=36
TotalN=110
Ethnicity Hispanic or Latino 1 (3%) 1 (3%) 1 (3%) 3 (3%) Not Hisp. or Latino 35 (95%) 33 (89%) 35 (97%) 103 (94%) Not Reported 1 (3%) 2 (5%) -- 3 (3%) Unknown -- 1 (3%) -- 1 (1%)Weight (kg) Mean (SD) 64.7 (14.7) 68.2 (24.5) 62.0 (17.1) 65.0 (19.2) ≤ 60 kg 18 (49%) 17 (46%) 16 (44%) 51 (46%) > 60 to ≤ 100 kg 18 (49%) 19 (51%) 19 (53%) 56 (51%) > 100 kg 1 (3%) 1 (3%) 1 (3%) 3 (3%)Source for Table 5 and Table 6: pg 135-136 of \\cdsesub1\evsprod\bla125261\0367\m5\53-clin-stud-rep\535-rep-effic-safety-stud\ped-pso\5351-stud-rep-contr\cnto1275pso3006\csr-full-cnto1275pso3006.pdf and reviewer analysis.
Baseline disease characteristics were balanced across the treatment arms. Approximately 60% of subjects had a score of moderate on the PGA at baseline. The mean PASI score was 20 and mean BSA was 31%. See Table 7.
Table 7 – Baseline Disease Characteristics
PlaceboN=37
Half-Standard Ustekinumab
N=37
Standard Ustekinumab
N=36
TotalN=110
PGA Moderate 22 (59%) 22 (59%) 24 (67%) 68 (62%) Marked 13 (35%) 15 (41%) 10 (28%) 38 (35%) Severe 2 (5%) 0 2 (6%) 4 (4%)PASI Mean (SD) 20.8 (8.0) 21.0 (8.5) 21.7 (10.4) 21.1 (8.9) Range 12-44 12-49 12-51 12-51BSA Mean (SD) 27.4 (16.4) 33.6 (21.4) 31.9 (23.2) 30.9 (20.5) Range 20-79 20-91 10-100 10-100Source: pg 137-138 of \\cdsesub1\evsprod\bla125261\0367\m5\53-clin-stud-rep\535-rep-effic-safety-stud\ped-pso\5351-stud-rep-contr\cnto1275pso3006\csr-full-cnto1275pso3006.pdf.
3.2.4 Efficacy EndpointsThe primary efficacy endpoint was the proportion of subjects achieving a score of clear or minimal (≤ 1) on the PGA at Week 12. The key secondary endpoints were PASI 75 at Week 12, change from baseline in CDLQI at Week 12, and PASI 90 at Week 12. All subjects were evaluated on the PGA and PASI scales at Week 12, so there is no missing data for the primary endpoint and secondary endpoints based on the PASI score. A few
Reference ID: 4139813

12
subjects were not evaluable on the CDLQI and their results were considered missing. The efficacy results are presented in Table 8.
Table 8 – Primary and Secondary Efficacy Endpoints (Week 12)
PlaceboN=37
Half Standard DoseN=37
Standard DoseN=36
PGA 0 or 1a (Primary)
2 (5.4%) 25 (67.6%)<0.001
25 (69.4%)<0.001
PASI 75a (Secondary)
4 (10.8%) 29 (78.4%)<0.001
29 (80.6%)<0.001
Change in CDLQIb (Secondary)
N=32-1.5 (3.18)
N=35-5.6 (6.43)
0.003
N=32-6.7 (5.63)
<0.001PASI 90a (Secondary)
2 (5.4%) 20 (54.1%)<0.001
22 (61.1%)<0.001
a n (%)b Mean (SD) Source: pg 68 70 of \\cdsesub1\evsprod\bla125261\0367\m5\53-clin-stud-rep\535-rep-effic-safety-stud\ped-pso\5351-stud-rep-contr\cnto1275pso3006\csr-full-cnto1275pso3006.pdf.
To control for multiplicity across dose levels and endpoints, the protocol states that the primary and key secondary endpoints will be considered in order (PGA clear or minimal, PASI 75, change in CDLQI, PASI 90), and within each endpoint analysis, the multiplicity due to two doses will be handled using Holm’s method. In particular, the protocol stated that the analysis would proceed to the next endpoint in the sequence as long as at least one of the doses was statistically significant for the previous endpoint under Holm’s method (that is, at least one of the two p-values corresponding to the two dose comparisons was less than 0.025). All of the nominal p-values for the primary and secondary endpoints are ≤ 0.003, and thus all of the primary and secondary endpoint comparisons meet the significance strategy described in the protocol.
However, because Holm’s method is not separable, type I error is only preserved for a gatekeeping strategy with Holm’s method when either the procedure only moves to the next endpoint in the sequence when a truncated version of Holm’s method is used with a truncation fraction (γ) strictly less than 1. The applicant’s proposed procedure is equivalent to using γ =1. To adequately control the type I error, the applicant’s proposal would need to be modified to either proceed to the next step in the gatekeeping strategy when both doses demonstrated statistical significance on an endpoint or to conduct the gatekeeping procedure with Holm’s method using 0 ≤ γ <1.
Because in this study, for each ordered endpoint the smaller p-value between the two dose comparisons is less than 0.025 and the larger p-value is less than 0.05, the full α can be passed from one stage to the next. In addition, because all eight p-values for the primary and secondary endpoint comparisons were less than 0.025, if the applicant had pre-specified a valid truncation fraction, any possible value 0 ≤ γ <1 would have led to statistical significance for all doses and primary and secondary endpoints in this study.
Reference ID: 4139813

13
Thus, even though the procedure specified by the applicant in the protocol does not strictly control the type I error rate, if they had made the adjustments to the procedure that would allow the procedure to strictly control the type I error rate, any of the valid choices for γ would have led to the conclusion of statistical significance for all primary and secondary endpoints for both doses.
All subjects had observed PGA and PASI scores at Week 12. Four subjects on the placebo arm met the early escape criteria at Week 8 or the treatment failure criteria at or before Week 12. All four subjects were to be automatically classified as treatment failures on the PGA and PASI primary and secondary endpoints at Week 12. All four of these subjects also had observed case data of ‘failure’ for PGA ≤ 1, PASI 75 and PASI 90 at Week 12. No additional data imputation beyond applying the treatment failure rules was conducted.
3.2.5 Sensitivity AnalysisTo ensure balance across the treatment arms, the applicant used a biased-coin minimization algorithm to randomize subjects in Study 3006. The applicant did not submit the protocol to the IND and the FDA did not provide any input into the study design or analysis. Only limited details on the allocation procedure were provided in the protocol. However, because the applicant used a biased-coin minimization algorithm rather than stratified randomization, the assumptions based on randomization needed to conduct standard statistical procedures may not be valid. Therefore, this reviewer conducted a permutation/re-randomization test for the primary endpoint as a sensitivity analysis. The re-randomization test used 20,000 simulations, a randomization seed of 12345678, and the CMH analysis stratified on weight group specified in the protocol2. In the 20,000 re-randomized datasets, none of permuted allocation datasets had a p-value as or more extreme as the data observed in the study, so the p-values for both the standard dose and half-standard dose versus placebo comparisons for the primary endpoint in the re-randomization test were <0.001. Thus the results of the re-randomization test are consistent with the primary analysis specified by the applicant and yield the same conclusions.
3.2.6 Efficacy over TimeSubjects were to be followed through Week 52 for efficacy assessments. Subjects originally randomized to placebo began receiving either the half-standard or standard dosage of ustekinumab at Week 12 (dosage determined at original randomization). PGA response rates were relatively constant throughout the follow-up period. Among both the subjects randomized to ustekinumab at baseline and the subjects crossing over to ustekinumab at Week 12, subjects randomized to the standard dosage had higher response rates over time than those randomized to the half-standard dosage. Subjects who met the treatment failure rules were classified as non-responders for the remainder of the study after first meeting the criteria for a treatment failure (discontinued study treatment due to lack of efficacy, an adverse event of worsening psoriasis, or who started a prohibited therapy that could affect psoriasis). See Figure 1.
2 SAS macro codes from Cassell, D. “A Randomization-test wrapper for SAS PROCs,” SUGI 27:Statistics and Data Analysis, Paper 251-27.
Reference ID: 4139813

14
Figure 1 –Response Rates over Time for PGA ≤ 1 (Clear or Minimal)
Source: Reviewer analysis
3.2.7 Other Secondary EndpointsIn addition to the primary (PGA success) and secondary (PASI 75, PASI 90, and change in CDLQI) endpoints, the protocol specified a number of ‘other’ secondary endpoints that were not multiplicity-adjusted. The additional ‘other’ secondary endpoints evaluated at Week 12 include: PGA 0 (cleared), PGA ≤ 2 (cleared, minimal, or mild), PASI 50, PASI 100, change from baseline in CDLQI components, CDLQI score of 0 or 1, and change from baseline in PedsQL (total score, psychosocial heal summary score, physical health summary score, and each scale). The protocol also stated that all of the endpoints would be evaluated over time.
Reference ID: 4139813
(b) (4)

15
Table 10 – Efficacy Endpoints at Week 52 (Observed cases)
Placebo/ Half Standard
N=17
Placebo/ Standard
N=17
Half-Std/ Half-Std
N=34
Standard/ Standard
N=35PGA 0 5 (29.4%) 10 (58.9%) 12 (35.3%) 13 (37.1%)PGA ≤1 9 (52.9%) 16 (94.1%) 20 (58.8%) 20 (57.1%)PGA ≤2 12 (70.6%) 17 (100%) 24 (70.6%) 31 (88.6%)PASI 100 5 (29.4%) 10 (58.8%) 9 (26.5%) 13 (37.1%)PASI 90 9 52.9%) 16 (94.1%) 17 (50.0%) 23 (65.7%)PASI 75 12 (70.6%) 17 (100%) 23 (67.6%) 28 (80.0%)PASI 50 13 (76.5%) 17 (100%) 24 (70.6%) 33 (94.3%)Change from baseline in CDLQI
N=15-5.9 (6.4)
N=15-7.5 (4.4)
N=33-4.9 (6.3)
N=31 -7.6 (7.0)
Change from baselinein PedsQL
N=159.4 (13.3)
N=1713.4 (11.7)
N=33 8.9 (16.4)
N=357.3 (10.9)
Source: pg 78, 193, 202, 211 of \\cdsesub1\evsprod\bla125261\0367\m5\53-clin-stud-rep\535-rep-effic-safety-stud\ped-pso\5351-stud-rep-contr\cnto1275pso3006\csr-full-cnto1275pso3006.pdf.
Reference ID: 4139813
(b) (4)
(b) (4)

16
3.3 Evaluation of Safety
3.3.1 Extent of ExposureThe number of ustekinumab injections was similar on the half-standard and standard dosage arms. Subjects randomized to the half-standard/half-standard and standard/standard dosage arms received an average of 4.8 to 4.9 ustekinumab injections, compared to a full protocol plan of 5 injections. Subjects randomized to the placebo/half-standard and placebo/standard dosage arms received an average of 3.9 ustekinumab injections compared to a full protocol plan of 2 placebo injections and 4 ustekinumab injections. See Table 11.
Table 11 – Extent of Exposure
Placebo/ Half Standard
N=19
Placebo/ Standard
N=18
Half-Std/ Half-Std
N=37
Standard/ Standard
N=36Mean number of ustekinumab injections
3.9 3.9 4.8 4.9
Total ustekinumab dose [Mean (SD)]
83.9 (10.5) 178.6 (47.4) 106.7 (30.1) 207.4 (54.3)
Source: pg 132 of \\cdsesub1\evsprod\bla125261\0367\m5\53-clin-stud-rep\535-rep-effic-safety-stud\ped-pso\5351-stud-rep-contr\cnto1275pso3006\csr-full-cnto1275pso3006.pdf.
3.3.2 Adverse EventsApproximately 57% of subjects experienced adverse events during the placebo-controlled initial 12-week period, with no clear trend across arms. The most common adverse events were headache, nasopharyngitis, and upper respiratory tract infection (Table 12).
Table 12 – Adverse Events through Week 12 (incidence >5% in any arm)
PlaceboN=37
Half Standard DoseN=37
Standard DoseN=36
Any adverse event 21 (57%) 19 (51%) 26 (44%) Headache 2 (5%) 4 (11%) 3 (8%) Nasopharyngitis 10 (27%) 5 (14%) 1 (3%) Upper resp. tr. inf 2 (5%) 1 (3%) 3 (8%) Pharyngitis - 3 (8%) 1 (3%) Fatigue 2 (5%) 1 (3%) 1 (3%) Psoriasis 2 (5%) 1 (3%) - Diarrhea - - 2 (6%) Lymphadenopathy 2 (5%) - -Source: pg 86 of \\cdsesub1\evsprod\bla125261\0367\m5\53-clin-stud-rep\535-rep-effic-safety-stud\ped-pso\5351-stud-rep-contr\cnto1275pso3006\csr-full-cnto1275pso3006.pdf.
During the time that subjects were treated with ustekinumab (baseline through Week 60 for subjects originally randomized to ustekinumab and Week 12 through Week 60 for subjects originally randomized to placebo), approximately 71% of subjects experienced adverse events. The most common adverse events were similar to those seen during the initial 12 weeks of the study. See Table 13.
Reference ID: 4139813

17
Table 13 – Adverse Events through Week 60 (ustekinumab-treated population; incidence >5% overall)
Placebo/ Half Standard
N=19
Placebo/ Standard
N=18
Half-Std/ Half-Std
N=37
Standard/ Standard
N=36Any adverse event 15 (79%) 13 (72%) 25 (68%) 25 (69%) Headache 2 (11%) 3 (17%) 10 (27%) 5 (14%) Nasopharyngitis 5 (26%) 10 (56%) 12 (32%) 11 (31%) Upper resp. tr. inf 2 (11%) 3 (17%) 4 (11%) 5 (14%) Pharyngitis 1 (5%) 1 (6%) 4 (11%) 3 (8%) Psoriasis 1 (5%) 1 (6%) 4 (11%) 1 (3%)Source: pg 250-253 of \\cdsesub1\evsprod\bla125261\0367\m5\53-clin-stud-rep\535-rep-effic-safety-stud\ped-pso\5351-stud-rep-contr\cnto1275pso3006\csr-full-cnto1275pso3006.pdf.
4 Findings in Special/Subgroup Populations
4.1 Gender, Race, Age, and Geographic RegionTreatment effects were generally consistent across age group and gender, though the response rates were slightly higher in females than males on all treatment arms. There were too few subjects who had a race other than white or who identified as Hispanic or Latino to draw conclusions about differences across racial and ethnic groups. See Table 14.
Table 14 – PGA Success at Week 12 by Age, Gender, Race and Ethnicity
PlaceboN=37
Half-Standard Ustekinumab
N=37
Standard Ustekinumab
N=36Age (years) 12-15 years 1/15 (6.7%) 14/20 (70.0%) 13/20 (65.0%) 16-17 years 1/22 (4.6%) 11/17 (64.7%) 12/16 (75.0%)Gender Female 2/17 (11.8%) 15/19 (79.0%) 15/20 (75%) Male 0/20 (0%) 10/18 (55.6%) 10/16 (62.5%)Race White 2/34 (5.9%) 21/30 (70.0%) 24/34 (70.6%) Black or Afric.-Amer. - - - Asian 0/2 (0%) 2/3 (66.7%) 01/ (0%) Am. Ind./ AK Native 0/1 (0%) 0/1 (0%) 1/1 (100%) Native HI/ Pac. Isl. - - - Other/Unknown - 2/3 (66.7%) -Ethnicity Hispanic or Latino 0/1 (0%) 0/1% (0%) 0/1 (0%) Not Hispanic or Latino 2/35 (5.7%) 23/33 (69.7%) 25/35 (71.4%) Not Rep./Unknown 0/1 (0%) 2/3 (66.7%) -
Source: reviewer analysis.
Reference ID: 4139813

18
Subjects were enrolled in 9 European countries and Canada. Response rates in Canada and Europe were similar. Most of the enrollments in the European countries were small. See Table 15.
Table 15 – PGA Success at Week 12 by Country and Region
PlaceboN=37
Half-Standard UstekinumabN=37
Standard UstekinumabN=36
Country Belgium 0/4 (0%) 1/4 (25%) 2/3 (66.7%) Canada 0/13 (0%) 8/14 (57.1%) 10/14 (71.4%) Germany 0/1 (0%) 1/1 (100%) - France - 2/3 (66.7%) 1/2 (50.0%) UK 0/2 (0%) 2/2 (100%) 1/2 (50.0%) Hungary 1/3 (33.3%) 1/1 (100%) 3/3 (100%) Portugal 0/3 (0%) 1/1 (100%) 2/4 (50.0%) Russia 1/7 (14.3%) 6/8 (75.0%) 4/4 (100%) Sweden 0/1 (0%) 2/2 (100%) - Ukraine 0/3 (0%) 1/1 (100%) 2/4 (50.0%)Region Canada 0/13 (0%) 8/14 (57.1%) 10/14 (71.4%) Europe 2/24 (8.3%) 17/23 (73.9%) 15/22 (68.2%)
Source: reviewer analysis.
4.2 Other Special/Subgroup PopulationsIn Study 3006, the randomization was stratified on weight category (≤ 60 kg vs. > 60 kg) and subjects weighing less than 60 kg received weight-based dosing (0.75 mg/kg for standard dosing and 0.325 mg/kg for half-standard dosing). Subjects 60 to 100 kg received 45 mg and subjects over 100 kg received 90 mg. Only 3 subjects weighed over 100 kg. PGA success results were consistent across the two weight categories. See Table 16.
Table 16 – PGA Success by Weight Classification
PlaceboN=37
Half-Standard Ustekinumab
N=37
Standard Ustekinumab
N=36Weight ≤ 60 kg 2/18 (11.1%) 12/17 (70.6%) 10/16 (62.5%) > 60 kg 0/19 (0%) 13/20 (65.0%) 15/20 (75.0%)
Source: reviewer analysis.
Reference ID: 4139813

19
5 Summary and Conclusions
5.1 Statistical Issues and Collective EvidenceThe applicant has evaluated the efficacy and safety of ustekinumab in 110 adolescent subjects age 12 to 17 years with moderate to severe psoriasis. Subjects in Study 3006 were followed for up to 60 weeks with the last scheduled treatment injection at Week 40. Subjects originally randomized to placebo began receiving ustekinumab (at either the standard or half-standard dose) at Week 12. The study evaluated two doses: the standard dose comparable to the dose approved for use in adults with moderate to severe psoriasis (with weight based dosing for subjects less than 60 kg), and half the standard dose comparable to half the dose approved for adults (with weight based dosing for subjects less than 60 kg). Study 3006 demonstrated efficacy for both the standard dosage and the half-standard dosage relative to placebo for the primary endpoint of PGA cleared or minimal at Week 12, and for the secondary endpoints of PASI 75, PASI 90 and change in the CDLQI at Week 12.
Because the study was designed to evaluate two doses and four primary and secondary endpoints, the applicant proposed a gatekeeping strategy: analyzing each endpoint in a pre-specified order and using Holm’s method for the two dose comparisons within each endpoint. However, the version of the Holm’s gatekeeping procedure proposed in the protocol does not strictly control the type I error rate because the non-separable version of the procedure was specified. Even though the procedure as specified in the protocol did not strictly control the type I error rate, because all of the primary and secondary endpoint comparisons were significant at 0.025, the study would have met the statistical significance criteria on all endpoints for any valid truncation fraction that could have been specified to make the procedure separable.
The applicant used biased-coin minimization to allocate subjects to treatment. A re-randomization test was conducted by the reviewer on the primary endpoint analysis and the results were consistent with the protocol-specified analyses.
5.2 Conclusions and RecommendationsStudy 3006 demonstrated efficacy for both the standard dosage and the half-standard dosage relative to placebo for the primary endpoint of PGA cleared or minimal at Week 12, and for the secondary endpoints of PASI 75, PASI 90 and change in the CDLQI at Week 12. The results are presented in Table 17.
Reference ID: 4139813

20
Table 17 – Primary and Secondary Efficacy Endpoints (Week 12)
PlaceboN=37
Half Standard DoseN=37
Standard DoseN=36
PGA 0 or 1a (Primary)
2 (5.4%) 25 (67.6%)<0.001
25 (69.4%)<0.001
PASI 75a (Secondary)
4 (10.8%) 29 (78.4%)<0.001
29 (80.6%)<0.001
Change in CDLQIb (Secondary)
N=32-1.5 (3.18)
N=35-5.6 (6.43)
0.003
N=32-6.7 (5.63)
<0.001PASI 90a (Secondary)
2 (5.4%) 20 (54.1%)<0.001
22 (61.1%)<0.001
a n (%) b Mean (SD)
5.3 Labeling Recommendations
Signatures/Distribution List
Primary Statistical Reviewer: Kathleen Fritsch, Ph.D.Date: 8/15/2017
Statistical Team Leader: Mohamed Alosh, Ph.D.
cc:DDDP/MarcusDDDP/TrajkovicDDDP/CarrDDDP/WilliamsOBIO/PatricianDBIII/JohnsonDBIII/AloshDBIII/Fritsch
Reference ID: 4139813
(b) (4)

---------------------------------------------------------------------------------------------------------This is a representation of an electronic record that was signedelectronically and this page is the manifestation of the electronicsignature.---------------------------------------------------------------------------------------------------------/s/----------------------------------------------------
KATHLEEN S FRITSCH08/15/2017
MOHAMED A ALOSH08/15/2017
Reference ID: 4139813