office of governor kate brown - oregon.gov · pay equity — the governor’s office of diversity,...
TRANSCRIPT
i
The Governor’s O�ce recognizes diversity as the collective mixtures of our di�erences and similarities. These di�erences are viewed as a strength that maximizes the state’s competitive advantage through innovation, e�ectiveness, and adaptability.
Equity is a value and goal, not a process. It allows all individuals to thrive and reach their full potential.
Inclusion is leveraging diversity which builds and sustains a culture in which people are engaged and motivated. Ultimately, inclusion is the environment that people create to allow these di�erences to thrive.
O�ce of Governor Kate BrownDiversity, Equity, and Inclusion/A�rmative Action
DIVERSITY, EQUITY, AND INCLUSION
255 Capitol St NE | Salem, OR 97310
AFFIRMATIVE ACTION
2017-2019
C
M
Y
CM
MY
CY
CMY
K
AAReportCoverHR2.pdf 1 11/20/2017 1:28:10 PM

OFFICE OF GOVERNOR KATE BROWNDiversity, Equity, and Inclusion/Affirmative Action
900 Capitol StSalem, OR 97301
2017-2019 Biennium
Completed December 2017
iii
TABLE OF CONTENTSA MESSAGE FROM GOVERNOR KATE BROWN ............................................. iv
INTRODUCTION ......................................................................................................1The Governor’s Office of Diversity, Equity, and Inclusion’s duties as it relates to protected classes, and Oregon’s commitment to nondiscrimination.
EXECUTIVE SUMMARY .........................................................................................2Findings ............................................................................................................................2Recommendations ........................................................................................................3
GOVERNOR’S OFFICE OF DIVERSITY, EQUITY, AND INCLUSION OVERVIEW ...............................................................................................................4
Diversity and Inclusion .................................................................................................4Mission and Objectives ...............................................................................................5Executive Order 17-11 ....................................................................................................7State of Affirmative Action ......................................................................................... 11Demographic Data ...................................................................................................... 12Trial Service Retention FY 2013-2016 ....................................................................17Claims .............................................................................................................................. 18
OFFICE OF DIVERSITY, EQUITY, AND INCLUSION FINDINGS .................. 22Oregon State Government Employment ............................................................22
OREGON STATE GOVERNMENT CONTRACTING ........................................ 26Contracting ...................................................................................................................26Diversity, Equity, and Inclusion Initiative.............................................................. 27Acknowledgments .....................................................................................................29Citations/Appendices ................................................................................................29

iv
A MESSAGE FROM GOVERNOR KATE BROWNThe greatness of Oregon is reflected in the diversity of our people and the distinct experiences, backgrounds, and perspectives of all who call our state home. Oregon stands as a welcoming place for all, regardless of national origin, race, ethnicity, gender, ability, or sexual orientation. What truly defines us as Oregonians is our tradition of coming together and working collaboratively toward the shared vision of a thriving Oregon where we all have opportunities to fulfill our greatest potential.
Oregon’s demographics are changing and the diversity of our communities is increasingly better represented in our robust workforce across the state. Overall, the State of Oregon has
hired and retained more diverse employees, promoted racially and linguistically diverse employees at the highest rate in a decade, and significantly increased racially diverse female employees this biennium.
We are closer to achieving a state workforce that reflects the diversity of our communities with every advancement in diversity, equity, inclusion, and Affirmative Action. We’ve made progress in several areas and, as you will read in this report, there is more work to do. Every bridge we build with a community and our community members brings us that much closer to this goal.
Achieving this goal requires state government to work diligently to ensure equity is incorporated into every aspect of employment, from hiring to retention, promotion, and succession planning. Making equity a reality in state government requires intentionality in customer service, leadership development, and community engagement. And relies on ensuring equity is in all pillars of government: healthy and safe communities; responsible environmental stewardship; a seamless system of education; and a thriving statewide economy.
I thank all diligent and dedicated state employees who strive for excellence in service through innovative ideas, policies, and practices. The work you do in communities throughout our state contributes to the wellbeing of all Oregonians and helps expand opportunities for future generations.

1
INTRODUCTIONThe Governor’s Office of Diversity, Equity, and Inclusion/Affirmative Action (DEI/AA), is dedicated to ensuring that Oregon’s government develops, maintains, and embeds a diverse and inclusive culture throughout state systems, institutions, and deliverables. The DEI/AA office ensures all Oregonians, regardless of gender, age, race, national origin, ethnicity, religion, disability, sexual orientation, or veteran status, have equal and equitable opportunities in state government.
DEI/AA collaborates in all areas of state government, partnering with state agency executives, human resources, and staff, along with community-based organizations and the general public. This partnership not only identifies systemic barriers and weaknesses that hinder progress toward a diverse and inclusive workforce, but also develops and implements solutions to address those barriers and improve the performance and service delivery by state organizations.
Recently, Governor Brown issued Executive Order 17-04 Renewing Oregon’s Commitment to Protecting its Immigrant, Refugee, and Religious-Minority Residents, thereby reaffirming Oregon’s declaration of honoring and celebrating diversity, safeguarding the rights of immigrants and rejecting bigotry and hatred wherever it exists. The State of Oregon is positioned to continue to carry the banner of inclusion, diversity, equity, and equality by upholding state and federal law, and providing support to those most under-served.
Under the leadership of Governor Brown, Oregon will continue working to enhance diversity, equity, inclusion, Affirmative Action, and equal employment opportunity across all agencies, regions, and industries.
2
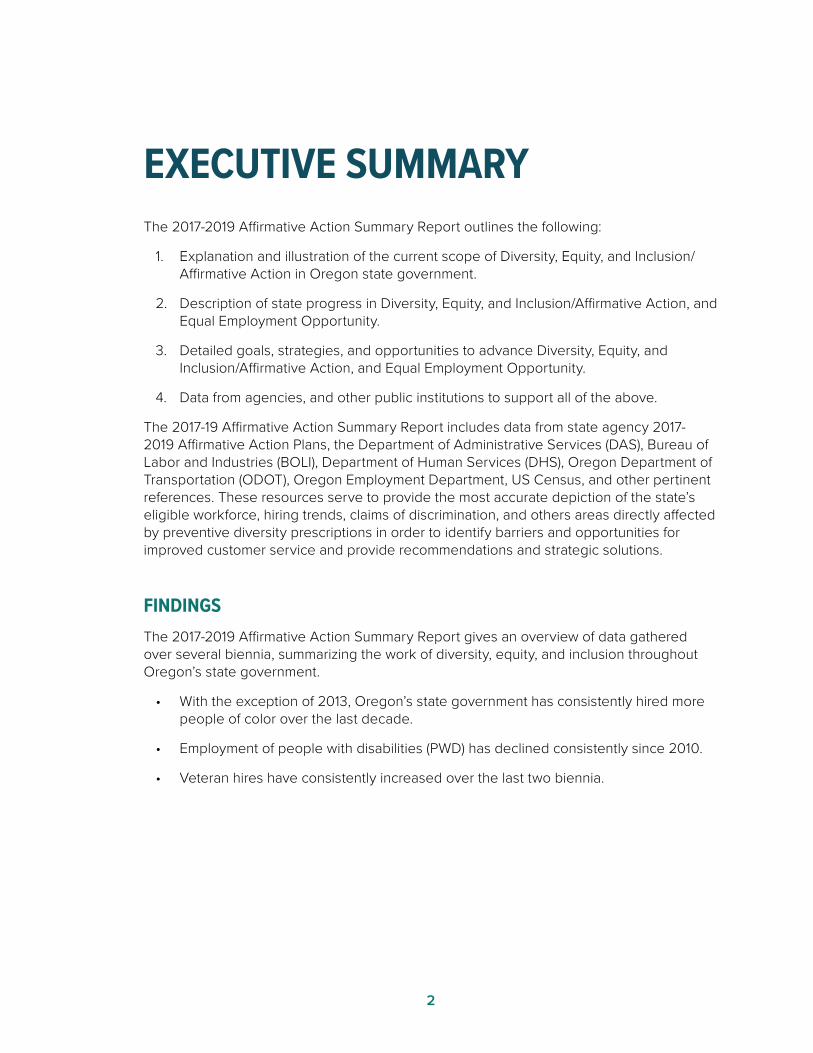
EXECUTIVE SUMMARYThe 2017-2019 Affirmative Action Summary Report outlines the following:
1. Explanation and illustration of the current scope of Diversity, Equity, and Inclusion/ Affirmative Action in Oregon state government.
2. Description of state progress in Diversity, Equity, and Inclusion/Affirmative Action, and Equal Employment Opportunity.
3. Detailed goals, strategies, and opportunities to advance Diversity, Equity, and Inclusion/Affirmative Action, and Equal Employment Opportunity.
4. Data from agencies, and other public institutions to support all of the above.
The 2017-19 Affirmative Action Summary Report includes data from state agency 2017- 2019 Affirmative Action Plans, the Department of Administrative Services (DAS), Bureau of Labor and Industries (BOLI), Department of Human Services (DHS), Oregon Department of Transportation (ODOT), Oregon Employment Department, US Census, and other pertinent references. These resources serve to provide the most accurate depiction of the state’s eligible workforce, hiring trends, claims of discrimination, and others areas directly affected by preventive diversity prescriptions in order to identify barriers and opportunities for improved customer service and provide recommendations and strategic solutions.
FINDINGSThe 2017-2019 Affirmative Action Summary Report gives an overview of data gathered over several biennia, summarizing the work of diversity, equity, and inclusion throughout Oregon’s state government.
• With the exception of 2013, Oregon’s state government has consistently hired more people of color over the last decade.
• Employment of people with disabilities (PWD) has declined consistently since 2010.
• Veteran hires have consistently increased over the last two biennia.
3
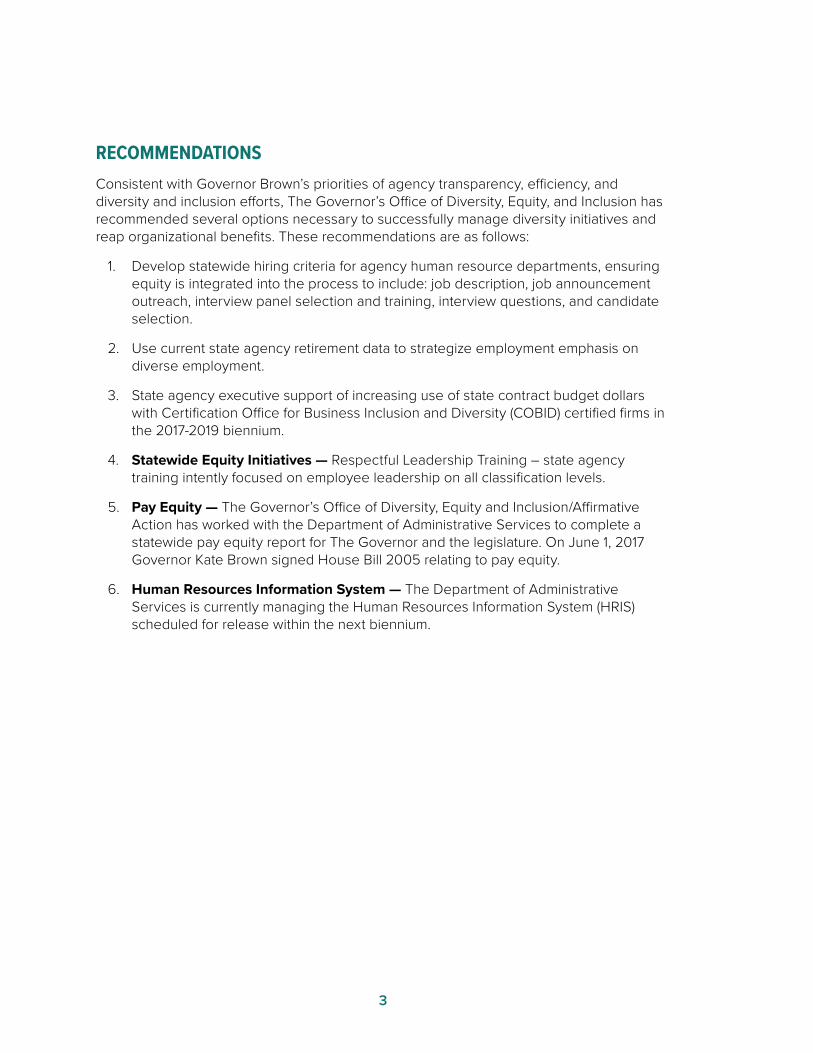
RECOMMENDATIONSConsistent with Governor Brown’s priorities of agency transparency, efficiency, and diversity and inclusion efforts, The Governor’s Office of Diversity, Equity, and Inclusion has recommended several options necessary to successfully manage diversity initiatives and reap organizational benefits. These recommendations are as follows:
1. Develop statewide hiring criteria for agency human resource departments, ensuring equity is integrated into the process to include: job description, job announcement outreach, interview panel selection and training, interview questions, and candidate selection.
2. Use current state agency retirement data to strategize employment emphasis on diverse employment.
3. State agency executive support of increasing use of state contract budget dollars with Certification Office for Business Inclusion and Diversity (COBID) certified firms in the 2017-2019 biennium.
4. Statewide Equity Initiatives — Respectful Leadership Training – state agency training intently focused on employee leadership on all classification levels.
5. Pay Equity — The Governor’s Office of Diversity, Equity and Inclusion/Affirmative Action has worked with the Department of Administrative Services to complete a statewide pay equity report for The Governor and the legislature. On June 1, 2017 Governor Kate Brown signed House Bill 2005 relating to pay equity.
6. Human Resources Information System — The Department of Administrative Services is currently managing the Human Resources Information System (HRIS) scheduled for release within the next biennium.

4
GOVERNOR’S OFFICE OF DIVERSITY, EQUITY, AND INCLUSION OVERVIEWThe Governor’s Office of Diversity, Equity and Inclusion/Affirmative Action (DEI/AA) works both inside and outside of state government partnering with agency executives, agency human resources, and on-the-ground staff, community-based organizations and the general public.
While the Office of DEI/AA is supported by federal and state law, we work to build a state government enterprise that uses the concepts of diversity and inclusion, (e.g. problem-solving, innovation, and organizational development), to create workplaces that are stronger, better functioning, more dynamic, and better able to deliver the best possible service to the people of Oregon.
DIVERSITY AND INCLUSIONThe Governor’s Office recognizes diversity as the collective mixtures of people’s differences and similarities. These differences are viewed as strengths that maximize the state’s competitive advantage through innovation, effectiveness, and adaptability.
Typically, people think of diversity in a legal, traditional way, referring primarily to race, gender, sexual orientation, and ethnicity. However, diversity has a global perspective and includes all the ways in which people differ, such as learning styles, communication
styles, interests, languages, values, and beliefs. Diversity is all of the differences we bring into the workplace, including our race, gender, military service, national origin, age, sexual orientation, or disability. Successfully bringing all these differences into the workplace leads to the work of inclusion.
Inclusion is leveraging diversity so as to build and sustain a culture in which people are engaged and motivated. That culture creates an environment which encourages these differences to thrive and be used to their greatest potential.
The way in which inclusion of diverse communities is implemented is critical to building equity in all state agencies. This involves building a base of inter-agency and community partnerships from beginning to end through the use of consistent and intentional
“Human progress is neither automatic nor inevitable...Every step
toward the goal of justice requires sacrifice,
suffering, and struggle; the tireless exertions and
passionate concern of dedicated individuals.
Martin Luther King, Jr.

5
shared resources, outreach and communication. As a result, diversity creates a stronger common ground that includes each individual’s story as an equitable part of state government and Oregon.
MISSION AND OBJECTIVESThe mission of the Governor’s Office of DEI/AA is as follows:
• Enforce the state’s policies on nondiscrimination practices and Affirmative Action.
• Identify agency goals and review their action plans to measure the employment and retention of employees by age, disability, family status, gender, marital status, national origin, race, religion, sexual orientation, and military status.
• Provide program guidance for promoting and encouraging equal employment opportunities.
• Communicate and demonstrate the Governor’s commitment to Equal Employment Opportunity and Affirmative Action principles.
The Governor’s Office of DEI/AA assists agencies with compliance with mandates on equal employment opportunities, diversity, and internal and external public relations strategies. Desired results of this work include:
• Compliance with federal, state, and local mandates.
• Significant reduction in the number of claims and lawsuits filed against state government through training, early intervention and problem solving.
• Safe and supportive work environment for all employees.
• Emergence of the State of Oregon as a national leader in diversity and inclusion, innovation, efficiency, and effectiveness in government.
• Recruitment, placement, retention, promotion, and monitoring of employment for racial, ethnic and gender diversity, the disabled, underprivileged, and other protected classes.
• Enhancement of trust and credibility with employees.
• Cultivation of a strong relationship with ethnic communities and private, public, academic, and faith-based organizations.
• Growth of public confidence in the State of Oregon.
6
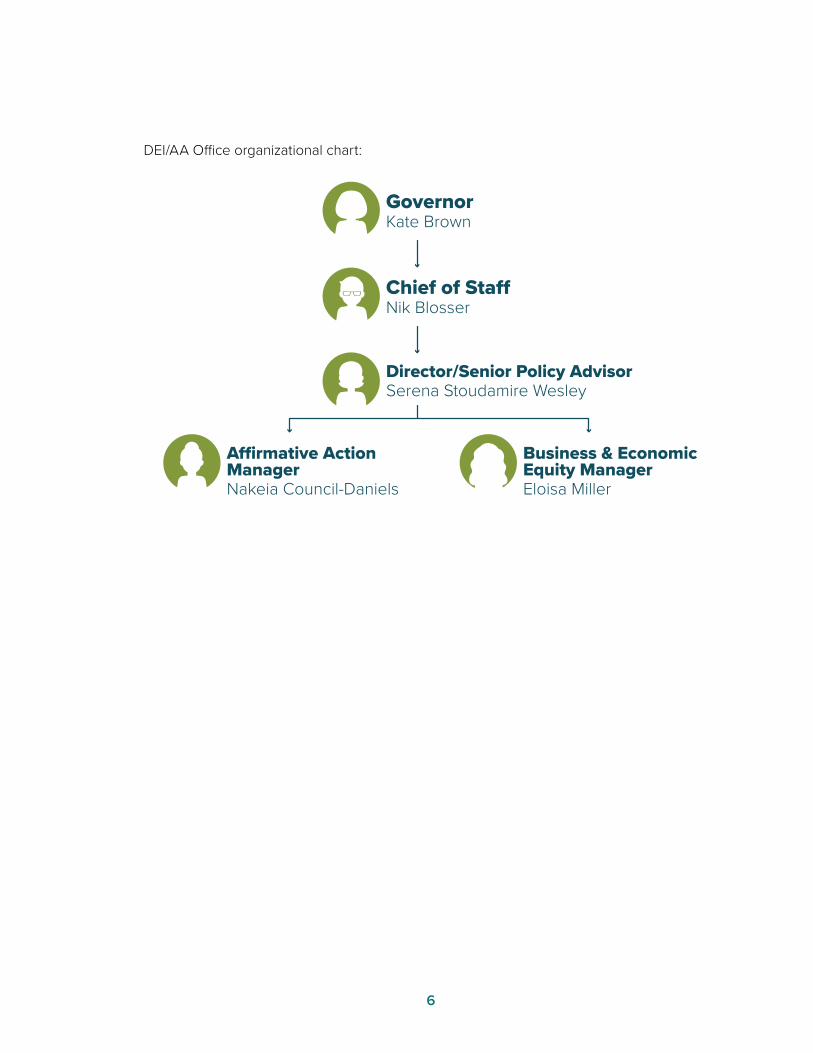
DEI/AA Office organizational chart:
GovernorKate Brown
Chief of Sta�Nik Blosser
Business & Economic Equity ManagerEloisa Miller
A�rmative Action ManagerNakeia Council-Daniels
Director/Senior Policy AdvisorSerena Stoudamire Wesley
7
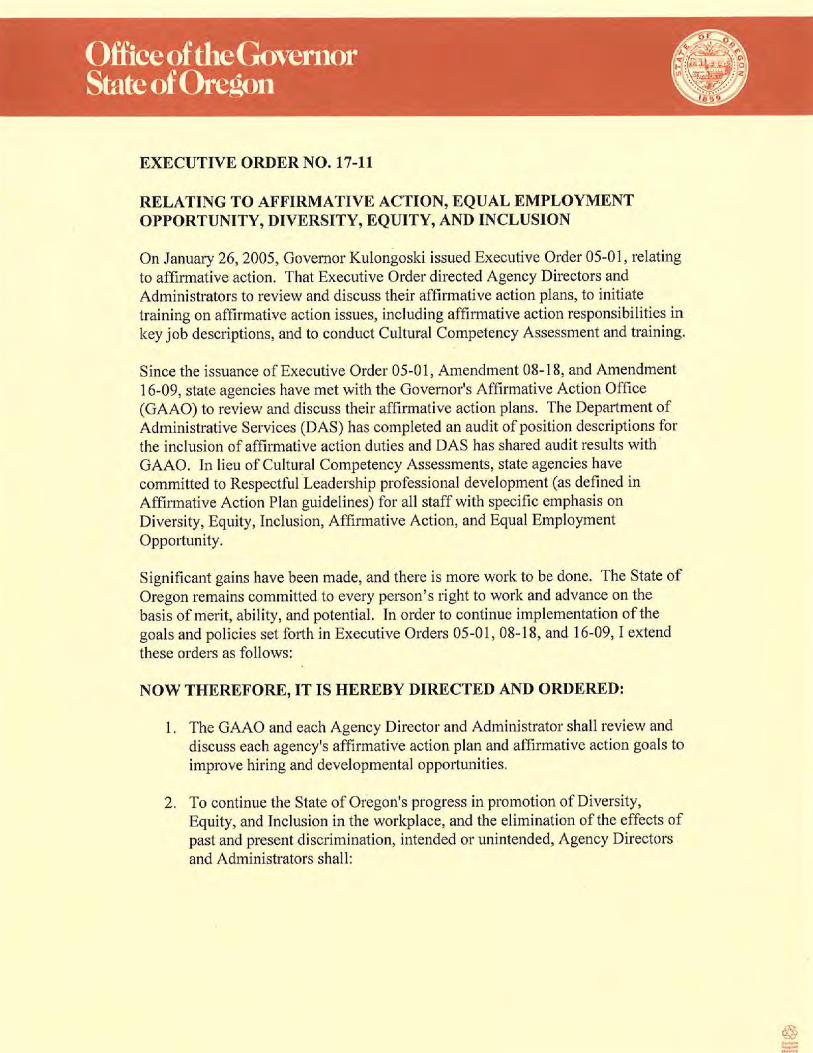
EXECUTIVE ORDER 17-11
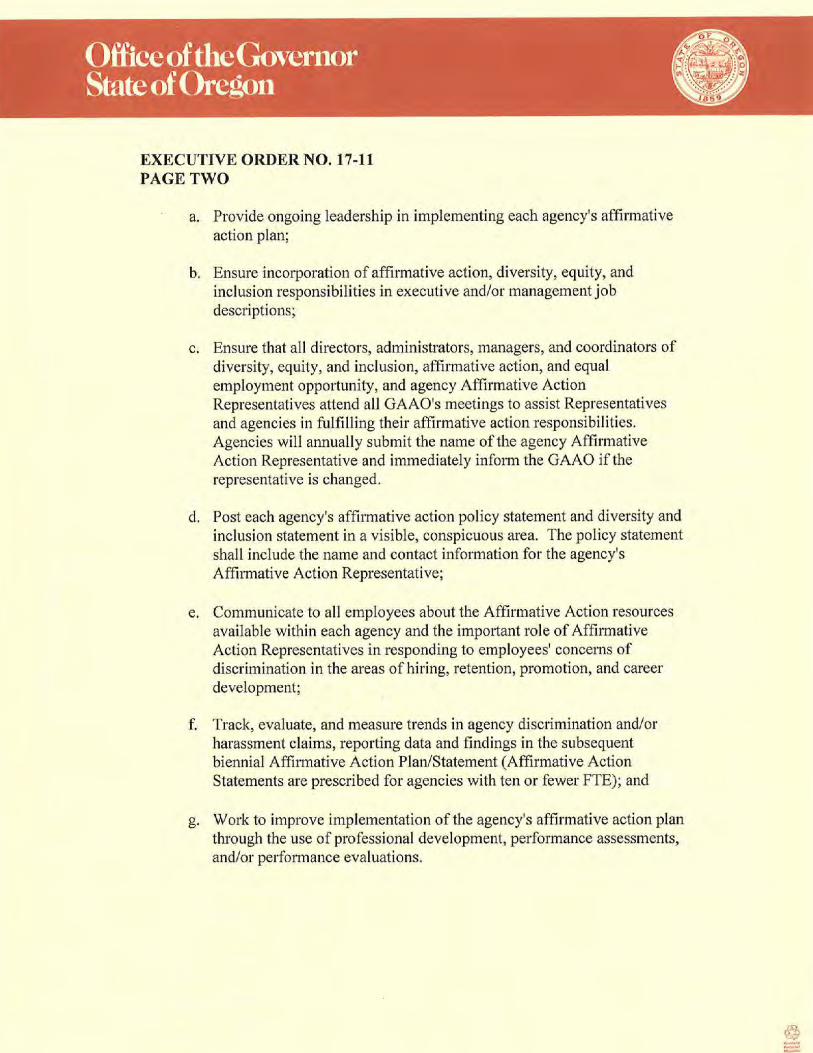
8
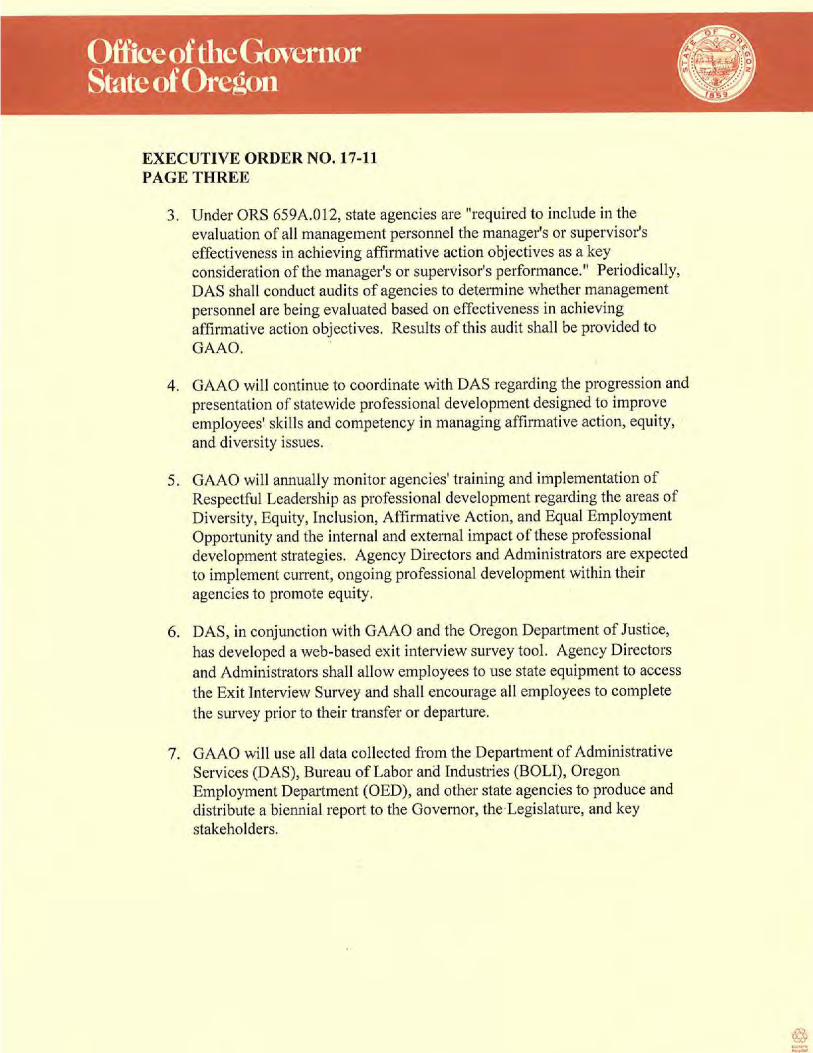
9

10
11
STATE OF AFFIRMATIVE ACTIONA. 2015-2017 RECAP
i. Discontinued Governor’s Diversity and Inclusion Agency Head Kitchen Cabinet; director now attends Executive Leadership Team (ELT) meetings.
ii. Updated agency Affirmative Action reporting guidelines to eliminate full plan reporting for agencies with ten or fewer full time employees (FTEs). These agencies have separate but similar guidelines and can now submit an Affirmative Action Statement.
iii. Reconfigured Affirmative Action Representative (AAR) meetings to incorporate a collaborative, and systemically inclusive work environment. We continue to collect feedback from AARs and have incorporated state agency training, as well as additional best practices training led by the AARs.
iv. Instituted agency visits as a part of the ongoing partnership of The Governor’s Office, state agencies, and boards and commissions. Our team connected with approximately one-third of the state agencies prior to biennial reporting.
v. Reintroduced “The Governor’s Marketplace,” held on March 23, 2017 at the Salem Convention Center. The marketplace had not been held for two years prior.
B. 2017-2019 FORECAST
i. Update Affirmative Action Report guidelines after visiting state agencies and gathering feedback. Agencies to have similar questions and suggestions regarding varying sections of the guidelines. The gathering and analyzing of this information is necessary to continually improve our internal reporting structure. We will review and incorporate these updates into the 2019-2021 guidelines as feasible.
ii. The 2017-2019 goal is to visit all state agencies and Oregon’s boards and commissions to provide support, technical assistance, and share best practices.
iii. Implement 100% agency presence at every Diversity and Inclusion, Affirmative Action, and Equal Employment Opportunity (DI/AA/EEO) meeting. Executive Order 16-09 directs that each agency, including state boards and commissions, have an Affirmative Action Representative, and that AARs be in attendance at each DI/AA/EEO meeting.
iv. Develop and partner with agencies regarding Respectful Leadership training. Respectful Leadership training is any training based on, or merged with, diversity, equity, inclusion, Affirmative Action, equal employment, and other related topics. The idea is to create seamless training, and incorporating leadership skills that transform professional work environments, where all employees are aware of and trained to evolve with Oregon’s changing demographic.
v. Empower Affirmative Action Representatives by giving them the opportunity to engage in peer-to-peer training. Also, by creating an atmosphere of awareness by way of expert presenters on pertinent topics during the DI/AA/EEO meetings.
12
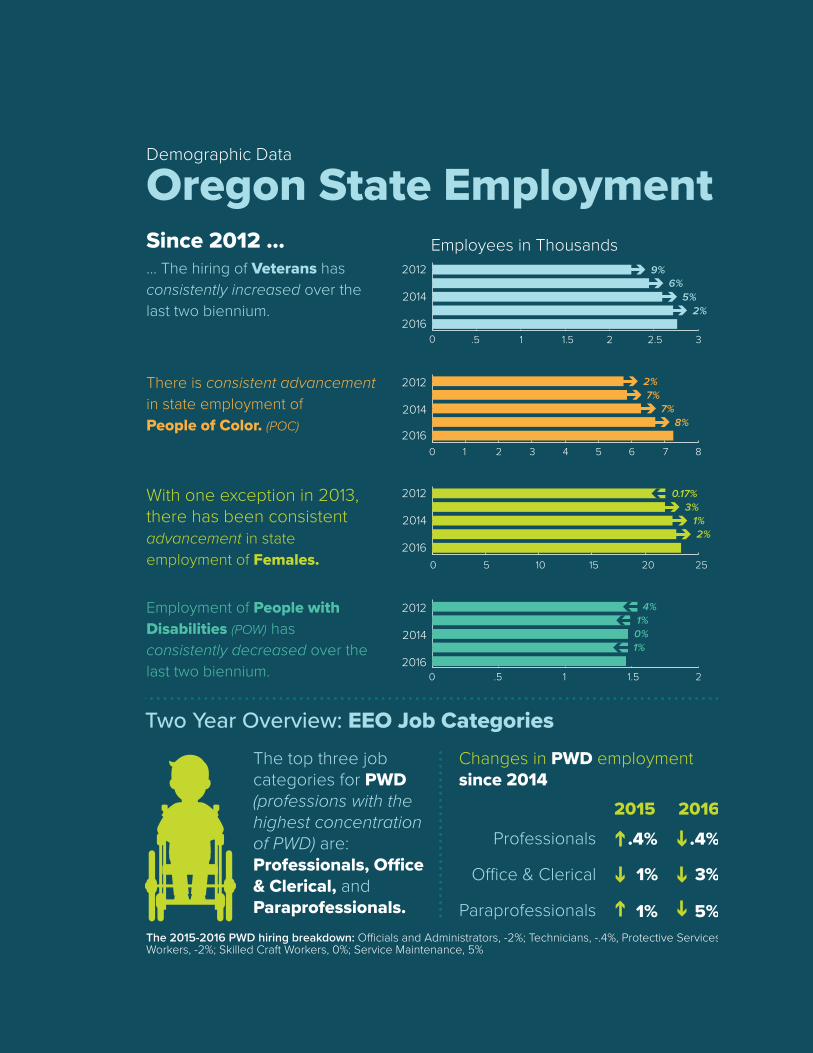
Since 2012 ...
Demographic Data
Oregon State Employment
Two Year Overview: EEO Job CategoriesThe top three job categories for PWD (professions with the highest concentration of PWD) are: Professionals, O�ce & Clerical, and Paraprofessionals.
... The hiring of Veterans has consistently increased over the last two biennium.
There is consistent advancement in state employment of People of Color. (POC)
With one exception in 2013, there has been consistent advancement in state employment of Females.
Employment of People with Disabilities (POW) has consistently decreased over the last two biennium.
Professionals
O ce & Clerical
Paraprofessionals
2015 2016
.4% .4%
1% 3%
1% 5%
Changes in PWD employment since 2014
Female State Employees by Race and Ethnicity
436
815
18,371
1,533
283
17
267
21,722
20131%
2%
5%
3%
9%
30%
6%
2014456
832
18,789
1,655
285
20
479
22,516
5%
2%
2%
8%
1%
18%
31%
2015443
865
18,922
1,669
276
20
691
22,886
2%
4%
1%
8%
3%
0%
44%
2016470
880
19,033
1,748
270
27
905
23,333
6%
2%
1%
5%
2%
35%
31%
Shows the total number of female state employees, and the percentage change from the previous year.
African American
Asian
Caucasian
Hispanic
Native American
Paci�c Islander
Two or More Races
African American
Asian
Caucasian
Hispanic
Native American
Paci�c Islander
Two or More Races
All State Employees by Race and EthnicityShows the total number of state employees by race and ethnicity, and the percentage change from the previous year.
The 2015-2016 PWD hiring breakdown: O cials and Administrators, -2%; Technicians, -.4%, Protective Services Workers, -2%; Skilled Craft Workers, 0%; Service Maintenance, 5%
0.1%1%2%8%6%3%12.5%
2013
34,6491,3588265835162,55027
2015
1%4%4%46%6%2%0%
35,2391,4468971,0934802,76430
2014
1%2%5%28%2%7%11%
34,9461,3908657475082,72030
Employees in Thousands
2016
2014
2012
0 .5 1 1.5 2 2.5 3
6%5%
2%
9%
0 .5 1 1.5 22016
2014
2012 4%
0%1%
1%
0 5 10 15 20 252016
2014
2012 0.17%3%1%2%
0 1 2 3 4 5 6 7 82016
2014
2012 2%7%
7%8%
of 40,509 in of 41,206 in
of 41,949 in of 42,634 in
2016
0.4%2%4%33%1%4%27%
35,3821,4759311,4544742,88038

13
Since 2012 ...
Demographic Data
Oregon State Employment
Two Year Overview: EEO Job CategoriesThe top three job categories for PWD (professions with the highest concentration of PWD) are: Professionals, O�ce & Clerical, and Paraprofessionals.
... The hiring of Veterans has consistently increased over the last two biennium.
There is consistent advancement in state employment of People of Color. (POC)
With one exception in 2013, there has been consistent advancement in state employment of Females.
Employment of People with Disabilities (POW) has consistently decreased over the last two biennium.
Professionals
O ce & Clerical
Paraprofessionals
2015 2016
.4% .4%
1% 3%
1% 5%
Changes in PWD employment since 2014
Female State Employees by Race and Ethnicity
436
815
18,371
1,533
283
17
267
21,722
20131%
2%
5%
3%
9%
30%
6%
2014456
832
18,789
1,655
285
20
479
22,516
5%
2%
2%
8%
1%
18%
31%
2015443
865
18,922
1,669
276
20
691
22,886
2%
4%
1%
8%
3%
0%
44%
2016470
880
19,033
1,748
270
27
905
23,333
6%
2%
1%
5%
2%
35%
31%
Shows the total number of female state employees, and the percentage change from the previous year.
African American
Asian
Caucasian
Hispanic
Native American
Paci�c Islander
Two or More Races
African American
Asian
Caucasian
Hispanic
Native American
Paci�c Islander
Two or More Races
All State Employees by Race and EthnicityShows the total number of state employees by race and ethnicity, and the percentage change from the previous year.
The 2015-2016 PWD hiring breakdown: O cials and Administrators, -2%; Technicians, -.4%, Protective Services Workers, -2%; Skilled Craft Workers, 0%; Service Maintenance, 5%
0.1%1%2%8%6%3%12.5%
2013
34,6491,3588265835162,55027
2015
1%4%4%46%6%2%0%
35,2391,4468971,0934802,76430
2014
1%2%5%28%2%7%11%
34,9461,3908657475082,72030
Employees in Thousands
2016
2014
2012
0 .5 1 1.5 2 2.5 3
6%5%
2%
9%
0 .5 1 1.5 22016
2014
2012 4%
0%1%
1%
0 5 10 15 20 252016
2014
2012 0.17%3%1%2%
0 1 2 3 4 5 6 7 82016
2014
2012 2%7%
7%8%
of 40,509 in of 41,206 in
of 41,949 in of 42,634 in
2016
0.4%2%4%33%1%4%27%
35,3821,4759311,4544742,88038

14
Female 534 in 2015267 in 2016
Male 592 in 2015296 in 2016
POC 266 in 2015133 in 2016
Disabled 50 in 201525 in 2016
by Category
1%
8%
3%
8%
1%
0%
11%
7%
10%
1%
2%
5%
14%
19%
African AmericanAsianCaucasianHispanicNative AmericanPacific IslanderTwo or More Races
2015 2016Management Postions by Race and Ethnicity
State of Oregon: Direct AppointmentExcludes: Lottery, OUS, Semi-Independent, Temporary Employees, Board Members and Contractors.
by Exec. Appointment 2011 - 2016
592 Men,averaging
296each year
534 Women,averaging
267each year
2015 - 20161,274 Men,averaging
255each year
1,000 Women,averaging
200each year
2011 - 2015
119
151
4,958
227
807
114
127
166
5,024
232
848
136
Di�erencefrom 2014
Di�erencefrom 2015
July 1, 2011 - February 14, 2015February 15, 2015 - December 31, 2016
On average, the direct appointments of people
of color and women have increased.
Between 2015-2016 there were direct appointments,an average of1,129 565
each year.
15
A. COMMUNITY ENGAGEMENT 2015-2017
State agency collaboration: Career Fairs, Conferences, Outreach
a. The Bureau of Labor and Industries and the Oregon Department of Education (BOLI, and ODOT) collaborated on the Heavy Highway Supportive Services Program which initiated funding for and development of a Bystanders Harassment Intervention Training Program for employees and supervisors and a Cultural Competency Training Program for registered apprentices.
b. The Department of Administrative Services (DAS) 2015 attended the Hispanic Metro Chamber Job Fair; Hire our Hero’s, and the Diversity Employment Fair. Additionally, DAS partners with the NAACP Salem-Keizer Chapter, Oregon Native American Chamber, and Oregon Association of Minority Entrepreneurs to continue to build strong community relationships.
c. Department of Consumer and Business Services (DCBS) hosted first agency Career Fair in 2016 with 250 job applicants in attendance; attended the Demystifying State Application Process event, in conjunction with Chemeketa Community College, Western Oregon University, WorkSource Oregon, Oregon State University, and others in order to promote diverse hiring in Oregon state government.
d. Oregon Department of Forestry (ODF) has increased outreach efforts with veterans, working with the Portland National Guard Base and the Army National Guard Headquarters in Salem to discuss expanding contracts regionally.
e. Department of Human Service’s (DHS) Office of Equity and Multicultural Services (OEMS) has provided individual training to staff and community partners regarding service equity and language access. OEMS has maintained relationships with APANO (Asian Pacific American Network of Oregon), IRCO (Immigrant and Refugee Community Organization), Africa House, AYCO (African Youth and Community Organization), Catholic Charities and other partners.
f. Oregon Advocacy Commission Office (OACO) hosts joint legislative days at the Capitol, conducts voter registration, and holds regular community and business forums. Partners include Asian Pacific American Network of Oregon (APANO), Urban League of Portland, Oregon Latino Health Coalition (OLHC), Oregon Latino Agenda for Action (OLAA), American Association of University Women (AAUW), and Center for Intercultural Organizing (CIO), Women’s Foundation of Oregon, and Partners in Diversity. The OACO oversees five websites, one for each commission, and the OACO site, while managing several social media outlets aiding in their collaboration with and support of diverse community efforts.
g. Oregon Board of Pharmacy (OBP) attends the Oregon State Pharmacy Association’s (OSPA) annual seminar, the 2015, and 2016 Oregon Society of Health-System Pharmacists (OSHP) seminar, the National Association of Boards of Pharmacy (NABP) in 2015, and 2017 (the board has hosted NABP previously). Compliance staff and board members also present at two Oregon colleges and schools of Pharmacy on laws and rules required for licensure.

16
h. Oregon Department of Veteran Affairs (ODVA) seeks to honor veterans and has done so by partnering with tribal veterans throughout Oregon. Native Americans represent 3,403, or 2.2 percent of Oregon’s total veteran population having one of the highest records of military service per capita of any ethnic group. ODVA, seeking to build stronger relations between United States Department of Veterans Affairs (USDVA) and Oregon tribal members, invited Eric Shineski, Secretary of Veterans Affairs to meet with tribal leaders of the Grand Ronde tribe for a town hall meeting.
i. Oregon State Library attended the 2015 Tribal State Government to Government Summit, and the 2016 Government to Government Education Cluster in order to strengthen relations with tribal leaders. The State Librarian attended the 2016 Legislative Commission on Indian Services Spring Gathering and Training for state agencies.
j. Higher Education Coordinating Commission (HECC) partners with community professional groups such as The Ford Family Foundation, Pacific Northwest Association for College Admission Counseling, Incight (for students with disabilities), and Oregon Indian Council for Postsecondary Education. These partnerships have resulted in Oregon having the nation’s highest percent increase in Free Application for Federal Student Aid (FAFSA) completion by high school seniors. Approximately 8.8% more Oregon high school seniors have gained access to federal and state financial aid in 2015.

17
TRIAL SERVICE RETENTION FY 2013-2016Trial service is the final phase of the hiring process and affords employees the opportunity to demonstrate their ability to perform the work, while providing state agencies the opportunity to confirm qualifications and fitness for the position. Oregon State Human Resources Policy 40.065.01.
FY 2012 FY 2013
Trail Service/Retention Hired % Retained # Terminated Retained Hired % Retained # Terminated Retained
Male (Caucasian) 1527 95% 79 1448 1960 97% 67 1893
Female 2337 95% 115 222 2819 96% 113 2706
Race (People of Color) 618 94% 37 581 753 95% 40 713
People w/Diabilities (Self-Identified)
91 93% 6 85 108 96% 4 104
FY 2014 FY 2015
Trail Service/Retention Hired % Retained # Terminated Retained Hired % Retained # Terminated Retained
Male (Caucasian) 2247 96% 97 2150 2194 94% 123 2071
Female 4231 96% 184 4047 3580 94% 197 3383
Race (People of Color) 1155 94% 72 1083 949 94% 61 888
People w/Diabilities (Self-Identified)
161 96% 7 154 166 89% 18 148
FY 2016
Trail Service/Retention Hired % Retained # Terminated Retained
Male (Caucasian) 2388 95% 110 2278
Female 3741 95% 179 3562
Race (People of Color) 964 95% 50 914
People w/Diabilities (Self-Identified)
149 91% 13 136
Between 2015 and 2016 there were fewer people with disabilities hired but a higher percentage of those hired were retained (2% increase). The same is true for Caucasian males. However, with females and people of color, both the actual hires and retention increased over the two years.
18
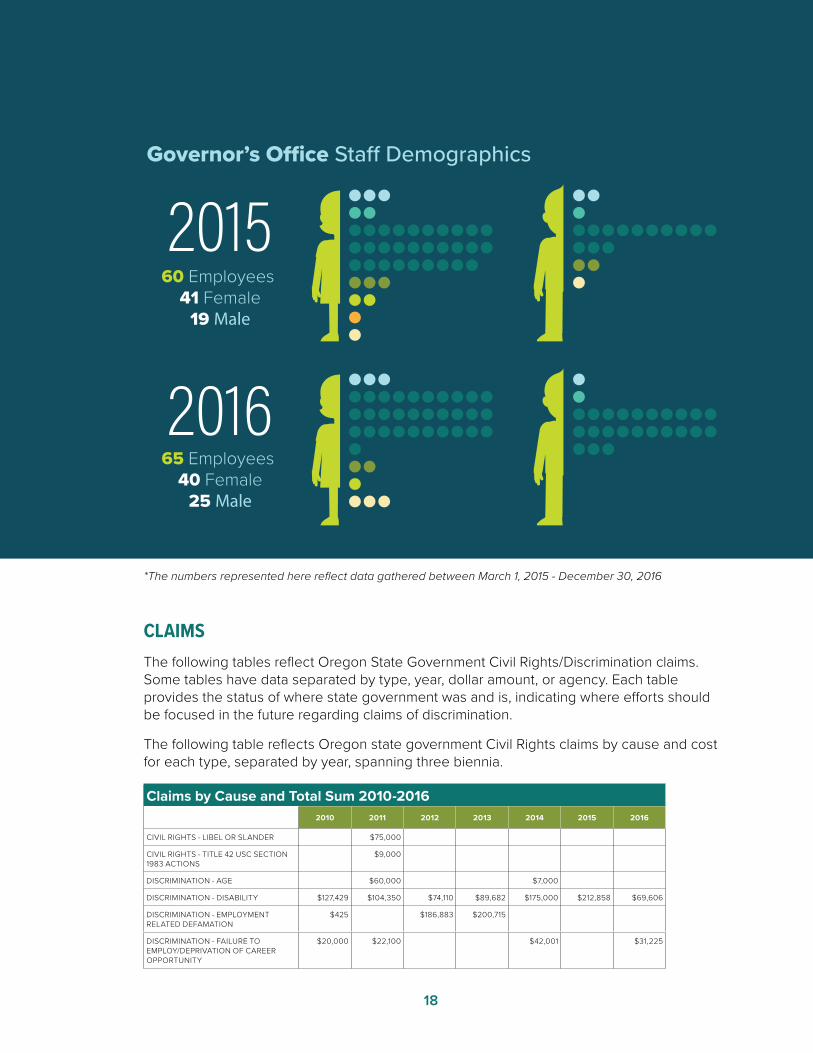
60 Employees 41 Female
19 Male
65 Employees 40 Female
25 Male
2015
2016
Governor’s O�ce Sta� Demographics
*The numbers represented here reflect data gathered between March 1, 2015 - December 30, 2016
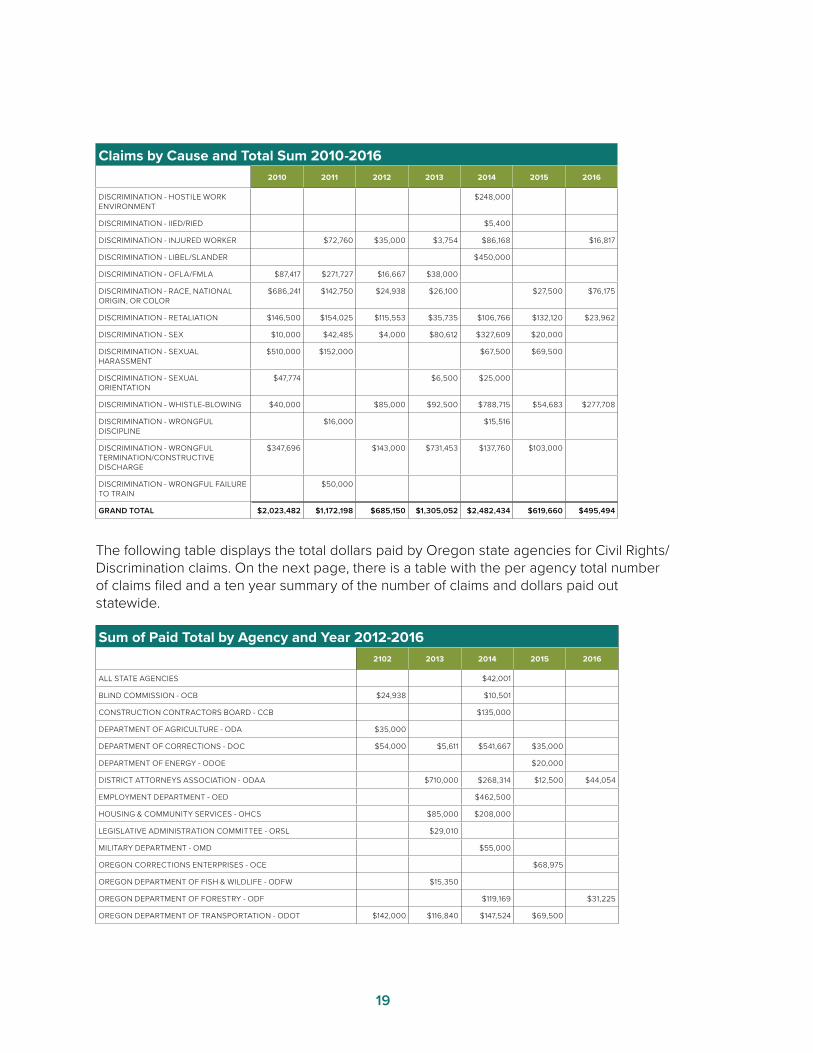
CLAIMSThe following tables reflect Oregon State Government Civil Rights/Discrimination claims. Some tables have data separated by type, year, dollar amount, or agency. Each table provides the status of where state government was and is, indicating where efforts should be focused in the future regarding claims of discrimination.
The following table reflects Oregon state government Civil Rights claims by cause and cost for each type, separated by year, spanning three biennia.
Claims by Cause and Total Sum 2010-20162010 2011 2012 2013 2014 2015 2016
CIVIL RIGHTS - LIBEL OR SLANDER $75,000
CIVIL RIGHTS - TITLE 42 USC SECTION 1983 ACTIONS
$9,000
DISCRIMINATION - AGE $60,000 $7,000
DISCRIMINATION - DISABILITY $127,429 $104,350 $74,110 $89,682 $175,000 $212,858 $69,606
DISCRIMINATION - EMPLOYMENT RELATED DEFAMATION
$425 $186,883 $200,715
DISCRIMINATION - FAILURE TO EMPLOY/DEPRIVATION OF CAREER OPPORTUNITY
$20,000 $22,100 $42,001 $31,225
19
Claims by Cause and Total Sum 2010-20162010 2011 2012 2013 2014 2015 2016
DISCRIMINATION - HOSTILE WORK ENVIRONMENT
$248,000
DISCRIMINATION - IIED/RIED $5,400
DISCRIMINATION - INJURED WORKER $72,760 $35,000 $3,754 $86,168 $16,817
DISCRIMINATION - LIBEL/SLANDER $450,000
DISCRIMINATION - OFLA/FMLA $87,417 $271,727 $16,667 $38,000
DISCRIMINATION - RACE, NATIONAL ORIGIN, OR COLOR
$686,241 $142,750 $24,938 $26,100 $27,500 $76,175
DISCRIMINATION - RETALIATION $146,500 $154,025 $115,553 $35,735 $106,766 $132,120 $23,962
DISCRIMINATION - SEX $10,000 $42,485 $4,000 $80,612 $327,609 $20,000
DISCRIMINATION - SEXUAL HARASSMENT
$510,000 $152,000 $67,500 $69,500
DISCRIMINATION - SEXUAL ORIENTATION
$47,774 $6,500 $25,000
DISCRIMINATION - WHISTLE-BLOWING $40,000 $85,000 $92,500 $788,715 $54,683 $277,708
DISCRIMINATION - WRONGFUL DISCIPLINE
$16,000 $15,516
DISCRIMINATION - WRONGFUL TERMINATION/CONSTRUCTIVE DISCHARGE
$347,696 $143,000 $731,453 $137,760 $103,000
DISCRIMINATION - WRONGFUL FAILURE TO TRAIN
$50,000
GRAND TOTAL $2,023,482 $1,172,198 $685,150 $1,305,052 $2,482,434 $619,660 $495,494
The following table displays the total dollars paid by Oregon state agencies for Civil Rights/ Discrimination claims. On the next page, there is a table with the per agency total number of claims filed and a ten year summary of the number of claims and dollars paid out statewide.
Sum of Paid Total by Agency and Year 2012-20162102 2013 2014 2015 2016
ALL STATE AGENCIES $42,001
BLIND COMMISSION - OCB $24,938 $10,501
CONSTRUCTION CONTRACTORS BOARD - CCB $135,000
DEPARTMENT OF AGRICULTURE - ODA $35,000
DEPARTMENT OF CORRECTIONS - DOC $54,000 $5,611 $541,667 $35,000
DEPARTMENT OF ENERGY - ODOE $20,000
DISTRICT ATTORNEYS ASSOCIATION - ODAA $710,000 $268,314 $12,500 $44,054
EMPLOYMENT DEPARTMENT - OED $462,500
HOUSING & COMMUNITY SERVICES - OHCS $85,000 $208,000
LEGISLATIVE ADMINISTRATION COMMITTEE - ORSL $29,010
MILITARY DEPARTMENT - OMD $55,000
OREGON CORRECTIONS ENTERPRISES - OCE $68,975
OREGON DEPARTMENT OF FISH & WILDLIFE - ODFW $15,350
OREGON DEPARTMENT OF FORESTRY - ODF $119,169 $31,225
OREGON DEPARTMENT OF TRANSPORTATION - ODOT $142,000 $116,840 $147,524 $69,500

20
Sum of Paid Total by Agency and Year 2012-20162102 2013 2014 2015 2016
OREGON HEALTH AUTHORITY - OHA $9,373 $25,000 $143,231 $48,145 $30,000
OREGON LIQUOR CONTROL COMMISSION - OLCC $1,100
OREGON PARKS & RECREATION DEPARTMENT - OPRD $7,500
OREGON STATE LOTTERY - OLOT $30,000
OREGON STATE POLICE - OSP $12,000 $65,000
OREGON UNIVERISTY SYSTEM - OUS $59,681
OREGON YOUTH AUTHORITY - OYA $55,000 $48,000 $16,817
PUBLIC EMPLOYEES RETIREMENT SYSTEM - PERS $30,000
ROLL-UP FOR DEPARTMENT OF ADMINISTRATIVE SERVICES - DAS $18,680 $212,706
ROLL-UP FOR DEPARTMENT OF HUMAN SERVICES - DHS $71,610 $29,754 $254,526 $30,000 $110,554
ROLL-UP FOR DEPARTMENT OF JUSTICE - DOJ $203,550 $261,387 $60,001 $36,003 $3,962
ROLL-UP FOR GOVERNOR'S OFFICE - GOV $95,000
ROLL-UP FOR OREGON BUSINESS DEVELOPMENT DEPARTMENT - OR4BIZ $46,175
SAIF CORPORATION - SAIF $6,500
TEACHER STANDARDS & PRACTICES COMMISSION - TSPC $57,858
TRAVEL INFORMATION COUNCIL - OTE $15,000
WATER RESOURCES DEPARTMENT - WRD $5,000
GRAND TOTAL $685,150 $1,305,052 $2,482,434 $619,660 $495,494
Number of Claims by Agency and Year 2012-20162102 2013 2014 2015 2016
ALL STATE AGENCIES 1
BLIND COMMISSION - OCB 1 1
CONSTRUCTION CONTRACTORS BOARD - CCB 2
DEPARTMENT OF AGRICULTURE - ODA 1
DEPARTMENT OF CORRECTIONS - DOC 1 1 3 2
DEPARTMENT OF ENERGY - ODOE 1
DISTRICT ATTORNEYS ASSOCIATION - ODAA 3 3 1 2
EMPLOYMENT DEPARTMENT - OED 2
HOUSING & COMMUNITY SERVICES - OHCS 1 2
LEGISLATIVE ADMINISTRATION COMMITTEE - ORSL 1
MILITARY DEPARTMENT - OMD 1
OREGON CORRECTIONS ENTERPRISES - OCE 2
OREGON DEPARTMENT OF FISH & WILDLIFE - ODFW 1
OREGON DEPARTMENT OF FORESTRY - ODF 1 1
OREGON DEPARTMENT OF TRANSPORTATION - ODOT 5 4 5 1
OREGON HEALTH AUTHORITY - OHA 2 1 3 2 1
OREGON LIQUOR CONTROL COMMISSION - OLCC 1
OREGON PARKS & RECREATION DEPARTMENT - OPRD 1
OREGON STATE LOTTERY - OLOT 1

21
Number of Claims by Agency and Year 2012-20162102 2013 2014 2015 2016
OREGON STATE POLICE - OSP 1 1
OREGON UNIVERISTY SYSTEM - OUS 2
OREGON YOUTH AUTHORITY - OYA 2 3 2
PUBLIC EMPLOYEES RETIREMENT SYSTEM - PERS 2
ROLL-UP FOR DEPARTMENT OF ADMINISTRATIVE SERVICES - DAS 2 2
ROLL-UP FOR DEPARTMENT OF HUMAN SERVICES - DHS 5 4 6 3 1
ROLL-UP FOR DEPARTMENT OF JUSTICE - DOJ 4 2 2 2 1
ROLL-UP FOR GOVERNOR'S OFFICE - GOV 1
ROLL-UP FOR OREGON BUSINESS DEVELOPMENT DEPARTMENT - OR4BIZ 1
SAIF CORPORATION - SAIF 1
TEACHER STANDARDS & PRACTICES COMMISSION - TSPC 2
TRAVEL INFORMATION COUNCIL - OTE 1
WATER RESOURCES DEPARTMENT - WRD 1
Grand Total 24 22 35 24 11
Claim Year: Total Cost and Total NumberTotal Cost Total Number
2006 $1,043,162 19
2007 $2,002,237 38
2008 $2,209,398 36
2009 $2,890,407 34
2010 $2,023,482 37
2011 $1,172,198 36
2012 $685,150 24
2013 $1,305,052 22
2014 $2,482,434 35
2015 $619,660 24
2016 $495,494 11
Grand Total $16,928,673 316
22
OFFICE OF DIVERSITY, EQUITY, AND INCLUSION FINDINGS
OREGON STATE GOVERNMENT EMPLOYMENTHIRING
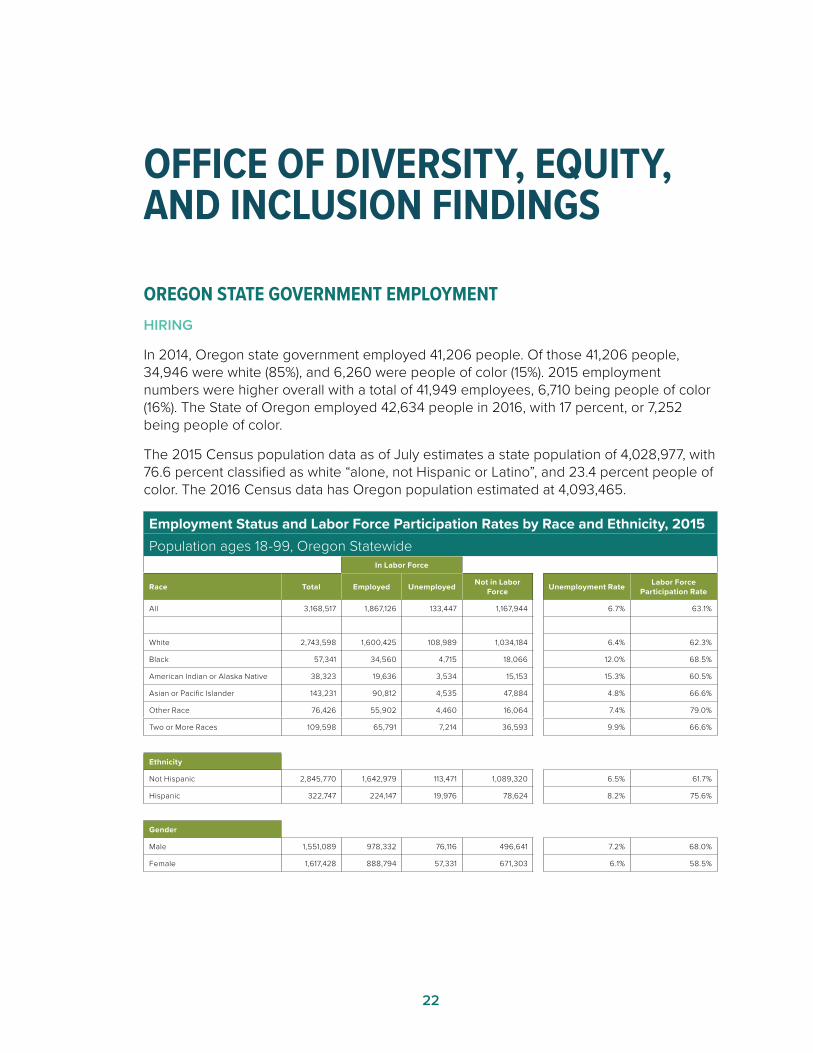
In 2014, Oregon state government employed 41,206 people. Of those 41,206 people, 34,946 were white (85%), and 6,260 were people of color (15%). 2015 employment numbers were higher overall with a total of 41,949 employees, 6,710 being people of color (16%). The State of Oregon employed 42,634 people in 2016, with 17 percent, or 7,252 being people of color.
The 2015 Census population data as of July estimates a state population of 4,028,977, with 76.6 percent classified as white “alone, not Hispanic or Latino”, and 23.4 percent people of color. The 2016 Census data has Oregon population estimated at 4,093,465.
Employment Status and Labor Force Participation Rates by Race and Ethnicity, 2015Population ages 18-99, Oregon Statewide
In Labor Force
Race Total Employed Unemployed Not in Labor Force Unemployment Rate Labor Force
Participation Rate
All 3,168,517 1,867,126 133,447 1,167,944 6.7% 63.1%
White 2,743,598 1,600,425 108,989 1,034,184 6.4% 62.3%
Black 57,341 34,560 4,715 18,066 12.0% 68.5%
American Indian or Alaska Native 38,323 19,636 3,534 15,153 15.3% 60.5%
Asian or Pacific Islander 143,231 90,812 4,535 47,884 4.8% 66.6%
Other Race 76,426 55,902 4,460 16,064 7.4% 79.0%
Two or More Races 109,598 65,791 7,214 36,593 9.9% 66.6%
Ethnicity
Not Hispanic 2,845,770 1,642,979 113,471 1,089,320 6.5% 61.7%
Hispanic 322,747 224,147 19,976 78,624 8.2% 75.6%
Gender
Male 1,551,089 978,332 76,116 496,641 7.2% 68.0%
Female 1,617,428 888,794 57,331 671,303 6.1% 58.5%
23
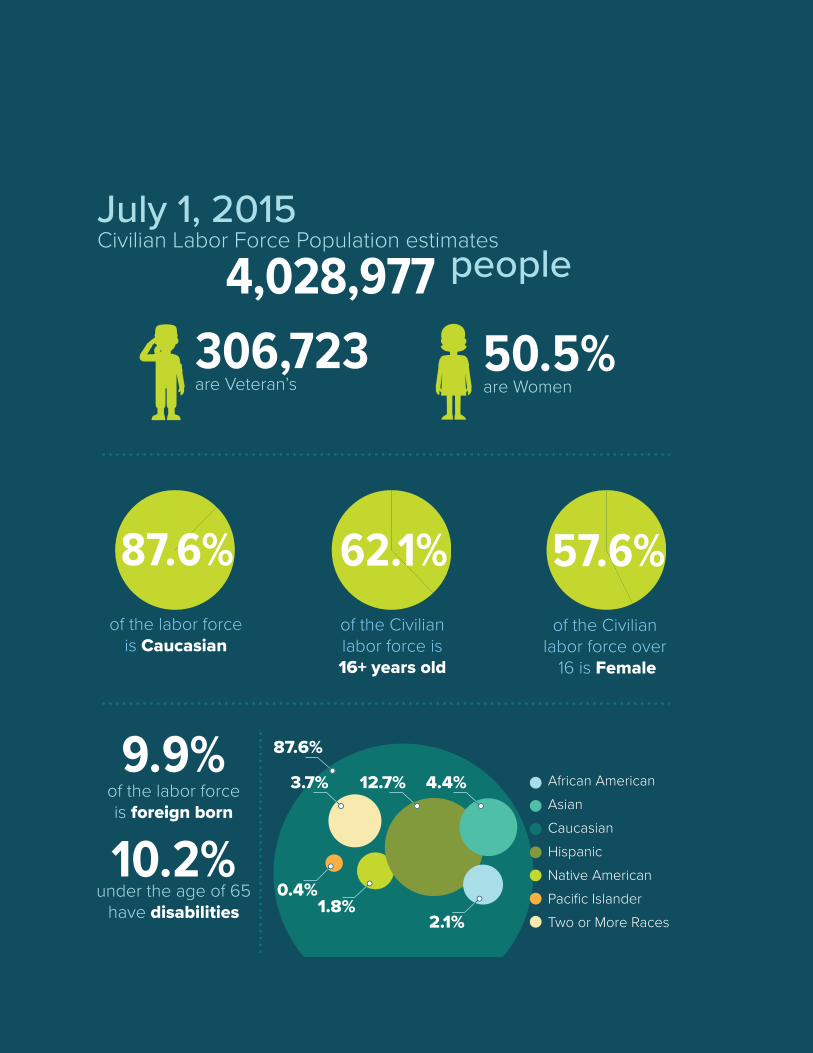
306,723are Veteran’s
50.5%are Women
87.6%of the labor force
is Caucasian
62.1%of the Civilianlabor force is16+ years old
57.6%of the Civilian
labor force over 16 is Female
9.9%
10.2%of the labor forceis foreign born
under the age of 65have disabilities
Civilian Labor Force Population estimates
4,028,977 peopleJuly 1, 2015
African AmericanAsianCaucasianHispanicNative AmericanPacific IslanderTwo or More Races2.1%
1.8%
4.4%
0.4%
3.7% 12.7%
87.6%
24
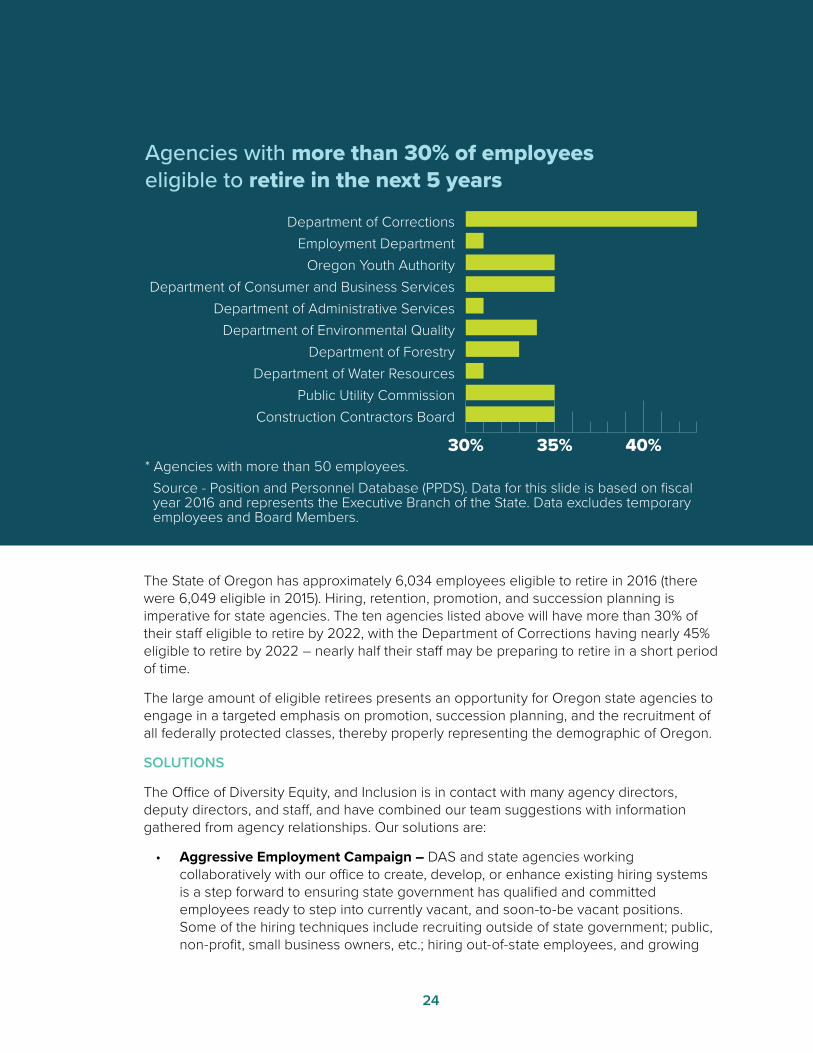
Agencies with more than 30% of employees eligible to retire in the next 5 years
30% 40%35%
Construction Contractors BoardPublic Utility Commission
Department of Water ResourcesDepartment of Forestry
Department of Environmental QualityDepartment of Administrative Services
Department of Consumer and Business ServicesOregon Youth Authority
Employment DepartmentDepartment of Corrections
Source - Position and Personnel Database (PPDS). Data for this slide is based on fiscal year 2016 and represents the Executive Branch of the State. Data excludes temporary employees and Board Members.
* Agencies with more than 50 employees.
The State of Oregon has approximately 6,034 employees eligible to retire in 2016 (there were 6,049 eligible in 2015). Hiring, retention, promotion, and succession planning is imperative for state agencies. The ten agencies listed above will have more than 30% of their staff eligible to retire by 2022, with the Department of Corrections having nearly 45% eligible to retire by 2022 – nearly half their staff may be preparing to retire in a short period of time.
The large amount of eligible retirees presents an opportunity for Oregon state agencies to engage in a targeted emphasis on promotion, succession planning, and the recruitment of all federally protected classes, thereby properly representing the demographic of Oregon.
SOLUTIONS
The Office of Diversity Equity, and Inclusion is in contact with many agency directors, deputy directors, and staff, and have combined our team suggestions with information gathered from agency relationships. Our solutions are:
• Aggressive Employment Campaign – DAS and state agencies working collaboratively with our office to create, develop, or enhance existing hiring systems is a step forward to ensuring state government has qualified and committed employees ready to step into currently vacant, and soon-to-be vacant positions. Some of the hiring techniques include recruiting outside of state government; public, non-profit, small business owners, etc.; hiring out-of-state employees, and growing
25
our own, investing in the leadership capabilities of current state employees to prepare them for career advancement.
• Interview Skills Training – The Office of DEI/AA is currently partnering with DAS to create interview skills training for statewide dissemination. The goal of interview skills training is to equip current and potential employees with cutting-edge tools to use before, during, and after the interview process. These skills include, but are not limited to resume writing, panel questions, navigating the state government application process. The training is set to launch in the 2017-2019 biennium.
• Retain and Promote State Employees Campaign – Agencies experiencing high turnover and/or high numbers of retirees in the near future will receive an action plan catered specifically to agency needs. The Office of DEI/AA will work closely with directors and administrators in this process. Areas covered will include departmental structure, salary, work flexibility, job rotations, leadership training, management training, and overall organizational culture. This campaign is scheduled to begin during the 2017-2019 biennium.

26
OREGON STATE GOVERNMENT CONTRACTING
CONTRACTINGThe Certification Office for Business Inclusion and Diversity (COBID) is the sole certification authority for the State of Oregon. Certification is designed to give government agencies increased opportunities to locate and contract with minority-owned, women-owned, emerging small, and service-disabled veteran owned businesses, (referred to collectively as COBID certified firms). While the certification program exists to provide access to public contracting opportunities, it also increases awareness of resources available to assist new and growing businesses, encourage prompt payment by a prime contractor or public agency, and strengthen Oregon’s small business economy.
The Office of Diversity, Equity, Inclusion and Affirmative Action (DEI/AA) works on two fronts toward success of businesses through the COBID program. Internally, the office works with all state agencies to increase inclusion of COBID certified firms on state contracts. As a result, a revised Economic and Business Equity Executive Order (EO) has been issued, directing all state agencies to work collaboratively with COBID, Department of Administrative Services (DAS), and the Office of DEI/AA. The EO addresses training of procurement professionals, quarterly reporting for accountability, and utilization targets for all contracts and purchases by state agencies. State agencies will be reviewing their processes with an ‘equity lens’, engaging with small business organizations, creating outreach plans, and further participating in training as suggested or requested by our office to increase inclusion of COBID certified firms.
Externally, the DEI/AA office engages with the small businesses through conferences, networking events and listening forums. In March of 2017, the Governor’s Marketplace Conference (GMP) in Salem, Oregon, brought together over 500 attendees, including
“Simple justice requires that public funds, to which all taxpayers of all races [colors, and national origins] contribute, not be
spent in any fashion which encourages, entrenches, subsidizes or results in racial [color or national origin] discrimination.
President John F. Kennedy
TITLE VI OF THE 1964 CIVIL RIGHTS ACT
27
business owners, COBID certified firms, state agencies, lending resources, government resources, and other private firms. The conference informed and educated business owners of available contracting opportunities and resources. And government agencies learned about more ways their procurement processes could better utilize COBID certified businesses.
The Governor’s Office of DEI/AA is expanding the ways in which it can facilitate innovative engagement in state government contracting opportunities with a more diverse roster of COBID firms. During the 2017-2019 biennium, this office will track GMP attendance and return on investment for all participants.
STATE AGENCY CONTRACTING SUMMARY
Oregon state agencies reported 2015-2017 biennial contracting dollars totaling $16,250,226,040.831. Of that, $168,268,841.772 was paid to COBID firms or unregistered firms owned by minorities, women, emerging small businesses, or service disabled veterans.
DIVERSITY, EQUITY, AND INCLUSION INITIATIVE The Affirmative Action Manager will:
1. Thoroughly read each agency Affirmative Action Plan and Statement, assess the needs of the agency, and work with agency leaders to develop a goal-implementation strategy every biennium;
2. The Affirmative Action Manager will visit each agency (at least annually), to develop rapport with leaders and staff, and to assist in sharing best practices among agencies;
3. Actively engage each agency Affirmative Action Representative, holding them accountable to share and deliver DI/AA/EEO meeting information with their respective agency leaders.
1 This number reflects the total budget dollars as reported by the agencies required to submit Affirmative Action Plans each biennium. The following agencies either reported $0 or did not submit their budget total in time for this reporting period: Oregon Department of Agriculture, Higher Education Coordinating Commission, Oregon Racing Commission, Appraiser Certification and Licensure, Oregon Commission for the Blind, Employment Relations Board, Oregon Housing and Community Services, Oregon Medical Board, Real Estate Agency Commission, Secretary of State, Oregon State Board of Nursing, Teacher Standards and Practices Commission.
2 This number reflects the contract budget dollars used for COBID certified firms as reported by the agencies required to submit Affirmative Action Plans each biennium. The following agencies either reported $0 or did not submit their budget total in time for this reporting period: Examiners for Engineering and Land Surveying, Psychiatric Security Review Board, Construction Contractors Board, Criminal Justice Commission, Chief Education Office, Oregon Department of Education, Oregon Public Employees Retirement System, Department of State Lands, Oregon State Police, Oregon Department of Veterans Affairs, Oregon Racing Commission, Appraiser Certification and Licensure, Oregon Commission for the Blind, Employment Relations Board, Oregon Housing and Community Services, Oregon Medical Board, Real Estate Agency Commission, Secretary of State, Oregon Racing Commission, Oregon State Board of Nursing, and Teacher Standards and Practices Commission.
28
AGENCY GOALS
Each agency identified goal and strategy is essential for advancing Affirmative Action and employment equity. Agencies had a variety of strategies for reaching those goals, which emphasized how creative this work needs to be. Large and small, the goals encompassed five major themes:
1. Recruitment strategies need to deeply and intentionally engage with communities, education, trades and cultural sector groups.
2. Training needs to equip employees and management on an ongoing basis to be increasingly equitable in policies, workplace environment, promotional opportunities, etc. The training needs to be both practical and conceptual.
3. Diversity, equity, inclusion, Affirmative Action, and Equal Employment Opportunity should be at the core of how state agencies engage employees, potential employees, communities, and the public.
4. Ensure that policies and procedures surrounding retention and promotion of employees through training, open and equitable hiring processes, education, and internships are accessible and equitable.
5. Relevant professional development and inclusive workplace culture are themes that are repeated throughout many agency Affirmative Action Plans. Together they indicate needs of the agencies and the values driving strategies, outreach, engagement, and planning necessary to fulfill the goals of strategic development and inclusive culture of state agencies.

29
ACKNOWLEDGMENTSThe 2017-2019 Affirmative Action Summary Report made possible by:
OFFICE OF GOVERNOR KATE BROWNSerena Stoudamire Wesley, Director – Office of Diversity, Equity, and InclusionNakeia Daniels, Affirmative Action ManagerMelissa Navas (former Press Secretary)Bryan Hockaday, Press SecretaryKarmen Fore, Senior Director of Federal Affairs and Transportation
DEPARTMENT OF ADMINISTRATIVE S ERVICESMadeline Zike, Chief Human Resources OfficerBrandon Dolquist, Human Resources Systems AnalystLindsay Baker, Director of Government RelationsShelly Hoffman, Claims ManagerOnyemaechi Odoemelam, Risk Finance AnalystAmy Velez, Operations Policy Analyst
OREGON DEPARTMENT OF TRANSPORTATIONChris Warden, Business Services ManagerShelley Crick, Reprographic & Design Services
OREGON EMPLOYMENT DEPARTMENTSharon Teitsort, Human Resources ManagerDavid Yamaka, Research Division DirectorNick Beleicks, State Employment EconomistGail Krumenauer, Senior Economic Analyst
OREGON STATE LIBRARYJessica Rondema, State Librarian Executive Assistant
CITATIONS/APPENDIXESUS Census data 2015; www.census.gov/quickfacts/OROregon Revised Statute; www.oregonlegislature.gov/bills_laws/Pages/ORS.aspx Oregon Executive Orders; www.oregon.gov/gov/admin/Pages/executive-orders.aspx

30
NOTES

31
NOTES
32
The Governor’s O�ce recognizes diversity as the collective mixtures of our di�erences and similarities. These di�erences are viewed as a strength that maximizes the state’s competitive advantage through innovation, e�ectiveness, and adaptability.
Equity is a value and goal, not a process. It allows all individuals to thrive and reach their full potential.
Inclusion is leveraging diversity which builds and sustains a culture in which people are engaged and motivated. Ultimately, inclusion is the environment that people create to allow these di�erences to thrive.
O�ce of Governor Kate BrownDiversity, Equity, and Inclusion/A�rmative Action
DIVERSITY, EQUITY, AND INCLUSION
255 Capitol St NE | Salem, OR 97310
AFFIRMATIVE ACTION
2017-2019
C
M
Y
CM
MY
CY
CMY
K
AAReportCoverHR2.pdf 1 11/20/2017 1:28:10 PM
Office of Governor Kate BrownDiversity, Equity, and Inclusion/Affirmative Action900 Court St. NE 254 | Salem, OR 97301