office of integrated medical education (oime)documents/kpis+report.pdf · ke erf ator 2 oct 213...
TRANSCRIPT
© Office of Integrated Medical Education (OIME)Office of the Dean, Faculty of MedicineUniversity of TorontoOctober 2013


Key Performance Indicators for IME October 20131
Executive Summary . . . . . . . . . . . . . . . . . . . . . . . . . . . . . . . . . . . . . . . . . . . . . . . . . . . . . . . . . 2
Introduction: Integrated Medical Education at the University of Toronto . . . . . . . . . . . . . 3
Definitions . . . . . . . . . . . . . . . . . . . . . . . . . . . . . . . . . . . . . . . . . . . . . . . . . . . . . . . . . . . . . . . . 4
Key Performance Indicators: Purposes for Integrated Medical Education . . . . . . . . . . . . . 4
Key Performance Indicators: 2011-2012 and 2012-2013 . . . . . . . . . . . . . . . . . . . . . . . . . . . . . 4
1. Community-Affiliated Teaching Sites . . . . . . . . . . . . . . . . . . . . . . . . . . . . . . . . . . . . . . . . . . . 5
2. Learner Days . . . . . . . . . . . . . . . . . . . . . . . . . . . . . . . . . . . . . . . . . . . . . . . . . . . . . . . . . . . . . . 6
2.1 Total Learner Days at our Community Sites . . . . . . . . . . . . . . . . . . . . . . . . . . . . . . . . 6
2.2 Growth in Learner Days at our Community Sites . . . . . . . . . . . . . . . . . . . . . . . . . . . . . 7
2.3 Distribution of Learner Days Across our Community Sites . . . . . . . . . . . . . . . . . . . . 8
2.4 Distribution of Learner Days Across U of T Clinical Departments . . . . . . . . . . . . . 10
3. Funding for Community Preceptor Payments . . . . . . . . . . . . . . . . . . . . . . . . . . . . . . . . . . 11
3.1 Total Payments to Preceptors: FY 2011-2012 and FY 2012-2013 . . . . . . . . . . . . . . . . 11
3.2 Average Payment Processing Times, Preceptor Payments . . . . . . . . . . . . . . . . . . . 12
4. Community-Based Academic Appointments . . . . . . . . . . . . . . . . . . . . . . . . . . . . . . . . . . . 13
4.1 Growth: Total Community-Based Academic Appointments . . . . . . . . . . . . . . . . . . . . 13
4.2 Total Community-Based Academic Appointments: U of T Clinical Departments . .14
4.3 Total Community-Based Academic Appointments: Community-Based Hospitals. .14
4.4 Distribution of Community-Based Academic Appointments . . . . . . . . . . . . . . . . . . . 15
5. Recognition and Supports for our Clinical Preceptors . . . . . . . . . . . . . . . . . . . . . . . . . . . . . 16
5.1 IME Awards to Promote Excellence in Community-Based Teaching . . . . . . . . . . . . . 16
5.2 Faculty Development and Orientation Programs . . . . . . . . . . . . . . . . . . . . . . . . . . . . . 17
5.3 Communications Programs . . . . . . . . . . . . . . . . . . . . . . . . . . . . . . . . . . . . . . . . . . . . . . . 17
6. Evaluation . . . . . . . . . . . . . . . . . . . . . . . . . . . . . . . . . . . . . . . . . . . . . . . . . . . . . . . . . . . . . . . . 18
7. Contribution to Physician Supply in Ontario . . . . . . . . . . . . . . . . . . . . . . . . . . . . . . . . . . . . 18
8. Longer-Term Key Performance Indicators for IME . . . . . . . . . . . . . . . . . . . . . . . . . . . . . . 18
Impact Story . . . . . . . . . . . . . . . . . . . . . . . . . . . . . . . . . . . . . . . . . . . . . . . . . . . . . . . . . . . . . . . 19
Future Challenges and Opportunities . . . . . . . . . . . . . . . . . . . . . . . . . . . . . . . . . . . . . . . . . . . . 19
Contacts . . . . . . . . . . . . . . . . . . . . . . . . . . . . . . . . . . . . . . . . . . . . . . . . . . . . . . . . . . . . . . . . . . . 20TABL
E OF C
ONTE
NTS

Key Performance Indicators for IME October 20132
Executive Summary
The past twelve years have seen unprecedented growth in medical education across Canada in response to societal concerns about access to medical care. This rapid expansion in capacity throughout Canada strained the clinical teaching capacity of the Academic Health Science Centres (AHSCs) where this teaching had historically been concentrated. Distributed medical education (DME) strategies were adopted to find new teaching capacity in non-academic hospitals. The proliferation of teaching sites created new challenges for medical schools in attracting, retaining, training, monitoring and valuing community preceptors. The University of Toronto’s response to these challenges has been realized through the Toronto Integrated Medical Education (T-IME) Project as well as the development of Integrated Medical Education (IME) more generally. IME represents a project of transformational change. Since early 2011, our project has been to change the way that our learners, full and community-affiliated hospitals, faculty members and staff think about – and engage with – the delivery of medical education at the University of Toronto.
Indeed, U of T’s programs and initiatives reflect a health human resources partnership between the university and government, a partnership that aims to align academic responsibility with social responsibility. Integral to that academic mission is the role of our 9 fully affiliated hospitals, 18 community affiliates and 3 non-hospital affiliates as well as the independent community practitioners, public health sites and community centres where our learners attend for hands-on clinical education. The intent of the Toronto Integrated Medical Education (T-IME) model has been to establish a sustainable framework for Integrated Medical Education that puts the University’s programs at the forefront of producing health care professionals who meet the needs of society.
The expansion of learners and new expectations for community-based medical education requires an accountability and performance assessment framework to ensure a consistently high quality of experience for medical learners, regardless of where they are placed. The development of measurable, objective and comparable key performance indicators (KPIs) to monitor the quality of medical education programs, the performance of teaching sites and faculty members, and the sustainability of our funding and infrastructure programs is a critical strategic, operational and decision-making tool. KPIs for IME are needed to fulfill our reporting and accountability requirements; to track the progress of our IME program in relation to the Faculty’s strategic plan and accreditation requirements more broadly; and, to communicate about our performance to our stakeholders and the IME community.
This report will establish definitions and criteria for key performance indicators (KPIs) for IME, introduce our performance indicators for 2011-2012 and 2012-2013, and will conclude with recommendations for longer-term KPIs (outcomes-based evaluation metrics) for Integrated Medical Education.
T-IME Performance Indicators at a Glance…
1. Community Affiliated Teaching Sites2. Learner Days3. Faculty Appointments4. Funding for Preceptor Payments5. Recognition and Supports for Clinical Preceptors

Key Performance Indicators for IME October 20133
Introduction: Integrated Medical Education at the University of TorontoIntegrated Medical Education (IME) is a collaborative endeavor engaging all University of Toronto affiliated teaching sites to deliver a broad range of experiences in settings that are reflective of the potential practice locations of our learners, and maintain the highest level of excellence for accreditation. Senior academic leaders in the Faculty of Medicine view this approach as a critical success factor for the education and training of our learners that will ultimately benefit our patients and society.
Valuing the education of our learners is an investment in the future of healthcare. Valuing the contributions of our faculty who teach at all clinical sites is a necessary part of this investment. By fully recognizing and respecting the teaching and learning cultures of all affiliated sites, we are investing in our teachers, our learners, and our communities. IME at the University of Toronto requires that all of our partners adopt a learner-centred approach that truly values the education of all learners across the full continuum of medical education. This principle is enabled by our clinical academic departments who engage in building respectful and effective relationships with all of our faculty members and look for new and innovative ways to implement new educational models and curricula.
Establish a sustainable framework for IME
Expand MD teaching and set new accreditation
standards for IME
Develop accountability frameworks
for IME
Develop a sustainable
financial plan for IME
Align the Clinical Departments
education programs with the Faculty’s mission and vision
Enhance medical learners’ access to clinical teaching for all programs across
the continuum
Goals: Integrated Medical Education
(IME)

Key Performance Indicators for IME October 20134
DefinitionsThe Association of Universities and Colleges of Canada (AUCC) defines a key performance indicator as “a quantitative or qualitative reading which provides strategic information about the condition, health or functioning of the institution or system”. We define a Key Performance Indicator (KPI) as a quantitative indicator considered key for monitoring the performance of a strategic objective, outcome, or key result area important to the success of the IME program. Of note, key performance indicators make objectives quantifiable, thereby enabling decision-making. KPIs are constructed in terms of inputs, processes and outputs. Outcomes also figure into the KPI equation, however, outcomes typically focus on longer-term results. KPIs measure effectiveness and performance, but must be problem-oriented and policy relevant. Key performance indicators are about signals – not just noise. We differentiate a metric from a performance indicator in that the former is a measure of quantity rather than quality. We define a metric as anything to which a number can be easily attached. Similarly, a benchmark is a term used to define a reference point by which something can be measured and tracked over time.
Key Performance Indicators: Purposes for Integrated Medical EducationKPIs for Integrated Medical Education at the University of Toronto will be used for the following purposes:
• To drive change, integration and innovation;• To demonstrate impact and accountability to our internal and external stakeholders (a summative mechanism);• To facilitate continuous quality improvement internally (a formative mechanism); • To track trends and changes over time; • To clarify and link strategic goals with activities in our affiliated hospitals, clinical academic departments,
academic programs, and administrative units; and, • To facilitate decision-making, monitoring and planning across our multiple community-based hospitals,
clinical academic departments, and across the continuum of medical education (undergraduate programs, postgraduate programs, continuing education and faculty development).
Key Performance Indicators: 2011-2012 and 2012-2013This report demonstrates our KPIs for IME for the years 2011-2012 and 2012-2013. As noted, the KPIs in this report are short-term indicators designed to report to our stakeholders on the return-on-investment of funds to support IME activities through the preceptor payment program. In the long-term, KPIs for IME will demonstrate social accountability through the utilization of diverse clinical learning environments. Thus, the key performance indicators in this report will show: • The increase in teaching and learning capacity at our community-based teaching sites; • The impact and sustainability of our funding programs; and, • New faculty development and recognition programs for new faculty members.
Key Performance Indicators for IME October 20135
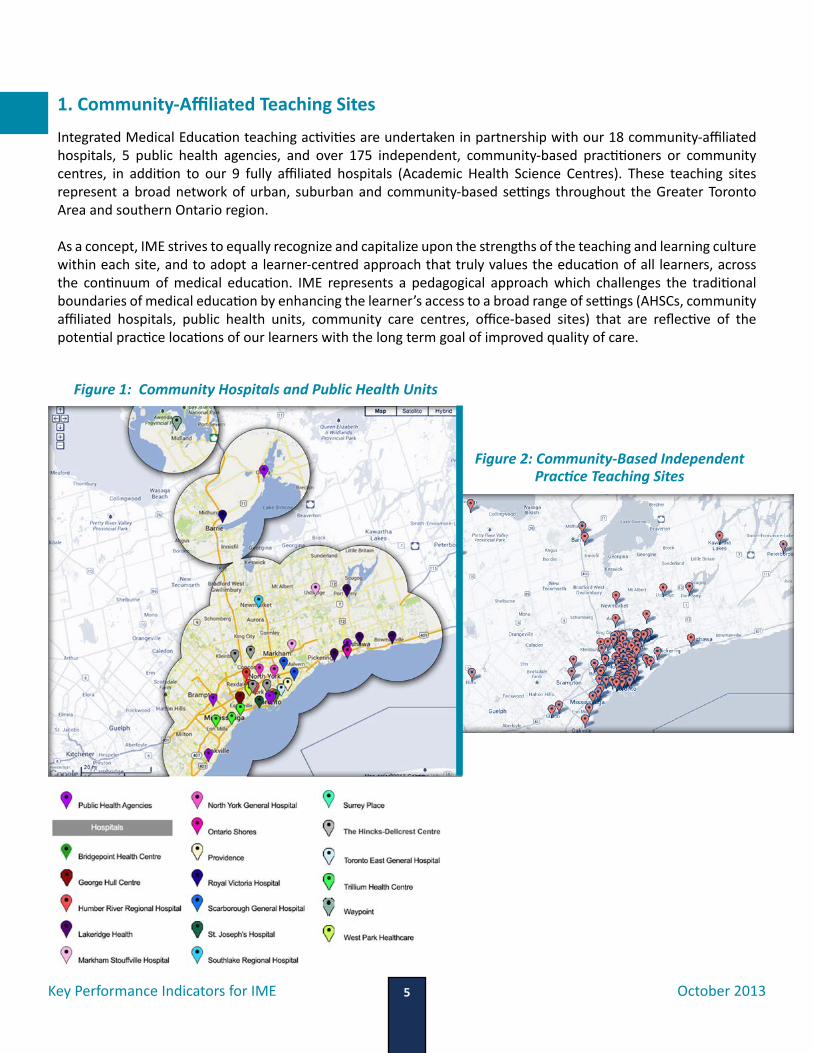
1. Community-Affiliated Teaching SitesIntegrated Medical Education teaching activities are undertaken in partnership with our 18 community-affiliated hospitals, 5 public health agencies, and over 175 independent, community-based practitioners or community centres, in addition to our 9 fully affiliated hospitals (Academic Health Science Centres). These teaching sites represent a broad network of urban, suburban and community-based settings throughout the Greater Toronto Area and southern Ontario region.
As a concept, IME strives to equally recognize and capitalize upon the strengths of the teaching and learning culture within each site, and to adopt a learner-centred approach that truly values the education of all learners, across the continuum of medical education. IME represents a pedagogical approach which challenges the traditional boundaries of medical education by enhancing the learner’s access to a broad range of settings (AHSCs, community affiliated hospitals, public health units, community care centres, office-based sites) that are reflective of the potential practice locations of our learners with the long term goal of improved quality of care.
Figure 1: Community Hospitals and Public Health Units
Figure 2: Community-Based Independent Practice Teaching Sites

Key Performance Indicators for IME October 20136
2. Learner Days
2.1 Total Learner Days at our Community Sites
Since the inception of funds to support community preceptors, over 231,000 learner days have been funded between April 1, 2011 and March 31, 2013 through the community-preceptor funding program. In our first year of operations (fiscal year 2011-2012), the total number of learner days in the community sites was almost 107,000, with overall growth of 16% to over 124,000 learner days in only our second year of operation (fiscal year 2012-2013).
Growth is a reflection of the evolution of medical education in Canada around three key developments. First, IME is intended to place learners in clinical settings that are more reflective of their eventual practice location, which echoes the recommendations provided in several key reports such as the Future of Medical Education in Canada (FMEC) Postgraduate Project (March 2012) and the Global Independent Commission on the Education of Health Professionals for the 21st Century (Health Professionals for a New Century: Transforming Education to Strengthen Health Systems in an Interdependent World, The Lancet, 376, 2010). Further, the World Health Organization’s 2010 report on “Increasing Access to Health Workers in Remote and Rural Areas through Improved Retention: Global Policy Recommendations” recommended that undergraduate students in all health disciplines be exposed “to rural community experiences and clinical rotations, as these can have a positive influence on attracting and recruiting health workers to rural areas” (World Health Organization, Geneva, 2010). Indeed, recommendation one of the FMEC Postgraduate report states that the “PGME system must continuously adjust its training programs to produce the right mix, distribution, and number of generalist and specialist physicians – including clinician scientists, educators and leaders – to serve and be accountable to the Canadian population” (FMEC 2012: 3). Further, recommendation two indicates that “PGME programs should provide learning and work experience in diverse environments to cultivate social accountability in residents and guide their choice of future practice” (Ibid: 3). Second, shifts in learner placements also reflect new accreditation standards for medical education. Recent changes in the definition for the Royal College of Physicians and Surgeons of Canada (RCPSC) specialties in their B standards of accreditation of ‘electives’ and ‘selectives’ will have a major impact on the way time is counted and credentialed in residency programs (RCPSC Modification of “B” Standards, Memo to Postgraduate Deans September 16, 2013). Third, general expansion in the number of trainee positions has occurred at both the undergraduate and postgraduate levels. In part, IME was introduced to meet increased needs for clinical placements for our learners. In 2013-2014, we expect to see a marked increase in the number of clerkship rotations at our community-based sites, particularly in Mississauga, as our first class of medical learners at the Mississauga Academy of Medicine enters the clerkship phase of medical training.
Key Performance Indicators for IME October 20137
2.2 Growth in Learner Days at our Community Sites
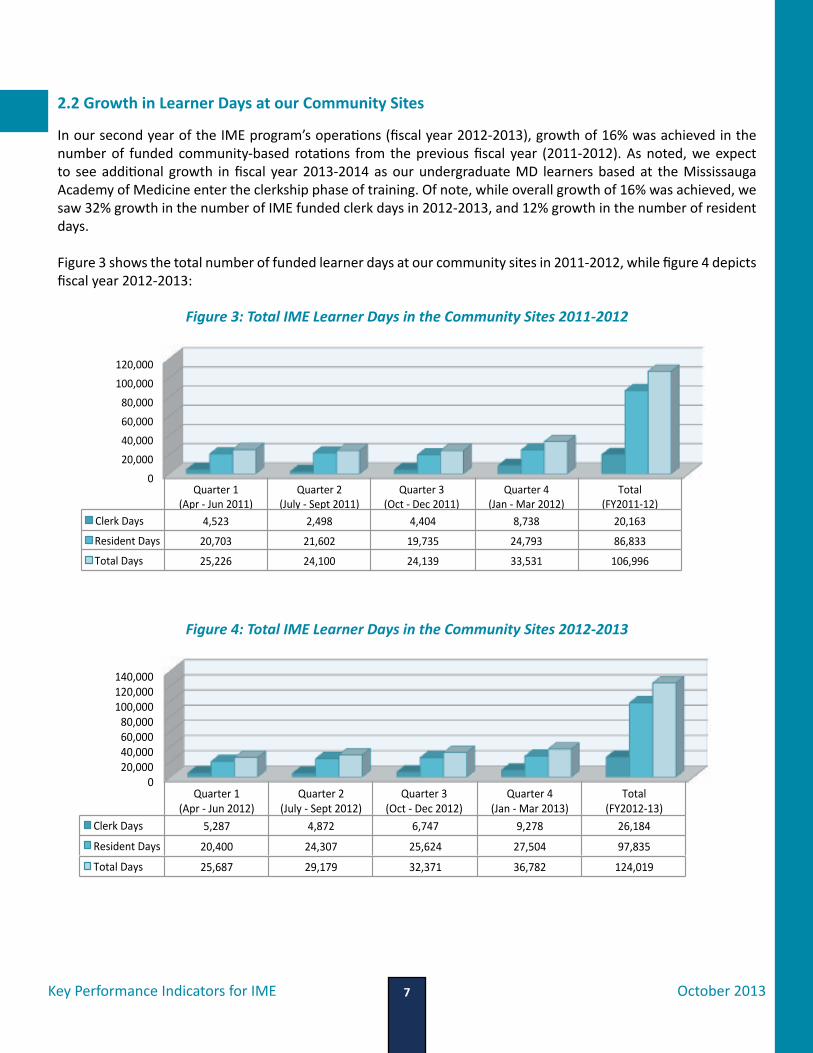
In our second year of the IME program’s operations (fiscal year 2012-2013), growth of 16% was achieved in the number of funded community-based rotations from the previous fiscal year (2011-2012). As noted, we expect to see additional growth in fiscal year 2013-2014 as our undergraduate MD learners based at the Mississauga Academy of Medicine enter the clerkship phase of training. Of note, while overall growth of 16% was achieved, we saw 32% growth in the number of IME funded clerk days in 2012-2013, and 12% growth in the number of resident days.
Figure 3 shows the total number of funded learner days at our community sites in 2011-2012, while figure 4 depicts fiscal year 2012-2013:
0 20,000 40,000 60,000 80,000
100,000 120,000
Quarter 1 (Apr -‐ Jun 2011)
Quarter 2 (July -‐ Sept 2011)
Quarter 3 (Oct -‐ Dec 2011)
Quarter 4 (Jan -‐ Mar 2012)
Total (FY2011-‐12)
Clerk Days 4,523 2,498 4,404 8,738 20,163
Resident Days 20,703 21,602 19,735 24,793 86,833
Total Days 25,226 24,100 24,139 33,531 106,996
0 20,000 40,000 60,000 80,000
100,000 120,000 140,000
Quarter 1 (Apr -‐ Jun 2012)
Quarter 2 (July -‐ Sept 2012)
Quarter 3 (Oct -‐ Dec 2012)
Quarter 4 (Jan -‐ Mar 2013)
Total (FY2012-‐13)
Clerk Days 5,287 4,872 6,747 9,278 26,184
Resident Days 20,400 24,307 25,624 27,504 97,835
Total Days 25,687 29,179 32,371 36,782 124,019
Figure 3: Total IME Learner Days in the Community Sites 2011-2012
Figure 4: Total IME Learner Days in the Community Sites 2012-2013

Key Performance Indicators for IME October 20138
Growth in the number of learner days at our community sites demonstrates changes in the curricular plans for several clinical programs; increasing integration and partnership between the University of Toronto and our community-affiliated sites along the continuum of medical education; and, the availability of high quality, community-based ambulatory learning in regions that constitute the U of T’s “community”. Growth in community-based activities also demonstrates engagement with diverse learning contexts which provide access to patient populations and clinical learning opportunities that differ from those in the Academic Health Science Centre (AHSC) context. Figure 5 (below) depicts rates of growth in IME funded learner days from fiscal year 2011-2012 to fiscal year 2012-2013. The data includes growth during each fiscal year quarter, and is further broken down to include data on resident days, clerk days, and total learner days.
2.3 Distribution of Learner Days Across our Community Sites
The U of T’s community hospitals deliver exemplary patient care and are viewed as excellent places to learn. Integrated Medical Education – as a distinct model of educational delivery and transformation – requires full integration of the various stakeholders into the overall mission of the Faculty of Medicine. Mechanisms to ensure inclusive, collaborative and efficient partnerships with all stakeholders (UGME, PGME, CE, FD, U of T clinical departments, fully affiliated hospitals, community-based hospitals, and community-based office sites) are a strong component of IME. The importance of integration with our partners – to promote new collaborative thinking and
Figure 5: Growth in IME Funded Learner Days: FY 2011-2012 and FY 2012-2013
0% 10% 20% 30% 40% 50% 60% 70% 80% 90%
100%
Q1 Q2 Q3 Q4 Total Clerk Days Growth/Decline 17% 95% 53% 10% 32% Resident Days Growth/Decline -‐1% 13% 30% 10% 12% Total Learner Days Growth/Decline 2% 21% 34% 10% 16%
Percen
tage Growth
Key Performance Indicators for IME October 20139
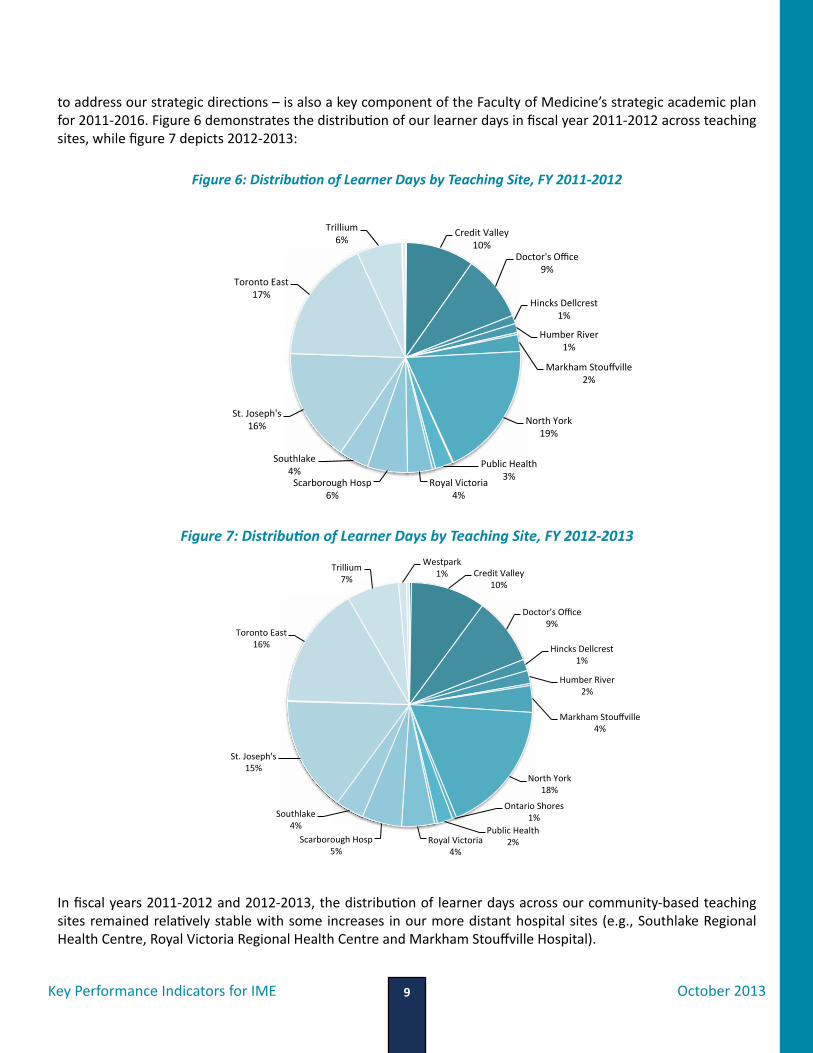
to address our strategic directions – is also a key component of the Faculty of Medicine’s strategic academic plan for 2011-2016. Figure 6 demonstrates the distribution of our learner days in fiscal year 2011-2012 across teaching sites, while figure 7 depicts 2012-2013:
In fiscal years 2011-2012 and 2012-2013, the distribution of learner days across our community-based teaching sites remained relatively stable with some increases in our more distant hospital sites (e.g., Southlake Regional Health Centre, Royal Victoria Regional Health Centre and Markham Stouffville Hospital).
Credit Valley 10%
Doctor's Office 9%
Hincks Dellcrest 1%
Humber River 2%
Markham Stouffville 4%
North York 18%
Ontario Shores 1%
Public Health 2% Royal Victoria
4% Scarborough Hosp
5%
Southlake 4%
St. Joseph's 15%
Toronto East 16%
Trillium 7%
Westpark 1%
Credit Valley 10%
Doctor's Office 9%
Hincks Dellcrest 1%
Humber River 1%
Markham Stouffville 2%
North York 19%
Public Health 3% Royal Victoria
4% Scarborough Hosp
6%
Southlake 4%
St. Joseph's 16%
Toronto East 17%
Trillium 6%
Figure 7: Distribution of Learner Days by Teaching Site, FY 2012-2013
Figure 6: Distribution of Learner Days by Teaching Site, FY 2011-2012
Key Performance Indicators for IME October 201310
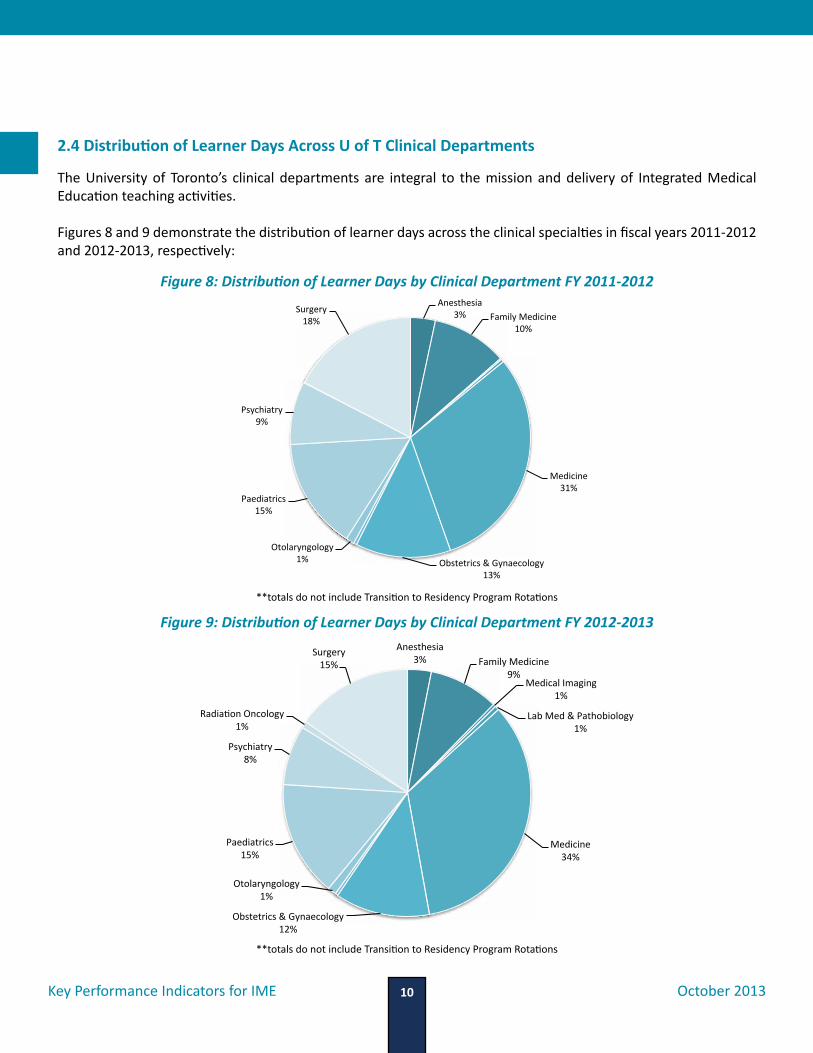
2.4 Distribution of Learner Days Across U of T Clinical Departments
The University of Toronto’s clinical departments are integral to the mission and delivery of Integrated Medical Education teaching activities.
Figures 8 and 9 demonstrate the distribution of learner days across the clinical specialties in fiscal years 2011-2012 and 2012-2013, respectively:
Anesthesia 3% Family Medicine
10%
Medicine 31%
Obstetrics & Gynaecology 13%
Otolaryngology 1%
Paediatrics 15%
Psychiatry 9%
Surgery 18%
Anesthesia 3% Family Medicine
9% Medical Imaging
1%
Lab Med & Pathobiology 1%
Medicine 34%
Obstetrics & Gynaecology 12%
Otolaryngology 1%
Paediatrics 15%
Psychiatry 8%
RadiaDon Oncology 1%
Surgery 15%
Figure 8: Distribution of Learner Days by Clinical Department FY 2011-2012
Figure 9: Distribution of Learner Days by Clinical Department FY 2012-2013
**totals do not include Transition to Residency Program Rotations
**totals do not include Transition to Residency Program Rotations
Key Performance Indicators for IME October 201311
3. Funding for Community Preceptor PaymentsIn January of 2011, the University of Toronto received funding from the Ministry of Health and Long-Term Care to support our community-based preceptors for eligible, previously unfunded learner rotations. The funding for this program follows the learner and only U of T learners engaged in community-based, core mandatory experiences in clinical specialty rotations are eligible (clerks and residents). In order to receive payment, MD preceptors must have a current U of T academic appointment. The learner’s rotation or the preceptor cannot be funded through any other source (e.g., Rural Ontario Medicine Program, Distributed Medical Education programs, Alternative Funding Plans, salary contracts through the Ministry of Health and Long-Term Care, etc.).
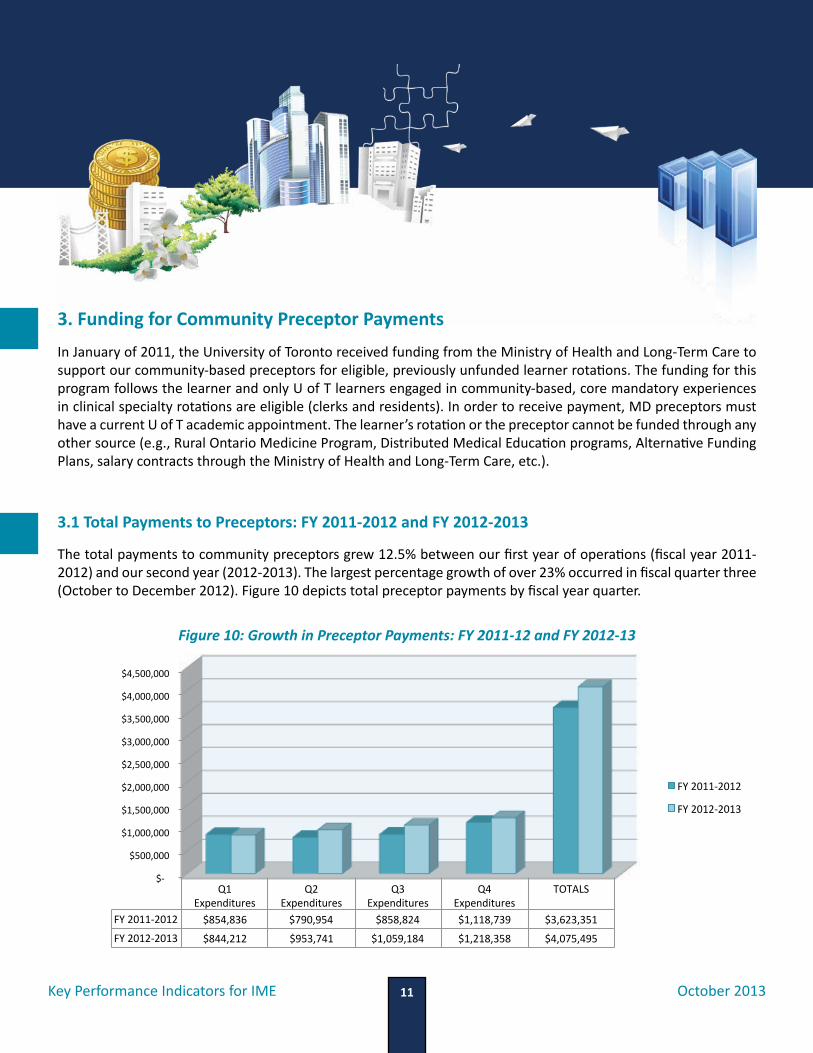
3.1 Total Payments to Preceptors: FY 2011-2012 and FY 2012-2013
The total payments to community preceptors grew 12.5% between our first year of operations (fiscal year 2011-2012) and our second year (2012-2013). The largest percentage growth of over 23% occurred in fiscal quarter three (October to December 2012). Figure 10 depicts total preceptor payments by fiscal year quarter.
$-‐
$500,000
$1,000,000
$1,500,000
$2,000,000
$2,500,000
$3,000,000
$3,500,000
$4,000,000
$4,500,000
Q1 Expenditures
Q2 Expenditures
Q3 Expenditures
Q4 Expenditures
TOTALS
FY 2011-‐2012 $854,836 $790,954 $858,824 $1,118,739 $3,623,351
FY 2012-‐2013 $844,212 $953,741 $1,059,184 $1,218,358 $4,075,495
FY 2011-‐2012
FY 2012-‐2013
Figure 10: Growth in Preceptor Payments: FY 2011-12 and FY 2012-13
Key Performance Indicators for IME October 201312
Ninety-five percent of our budget for preceptor payments was utilized in our second year of operation, 2012-2013. Driven by changing pedagogical and curricular practices, new accreditation standards, our social responsibility mission, and growth and expansion to meet the provinces health human resources mandate, additional growth at our community-based clinical training programs is expected in fiscal year 2013-2014. The impact and sustainability of our funding programs requires continuous review, engagement with our partners and stakeholders as well as strong relationships with provincial funding agencies. We would posit that community-based, IME rotations constitute the “new norm” in the delivery of medical education.
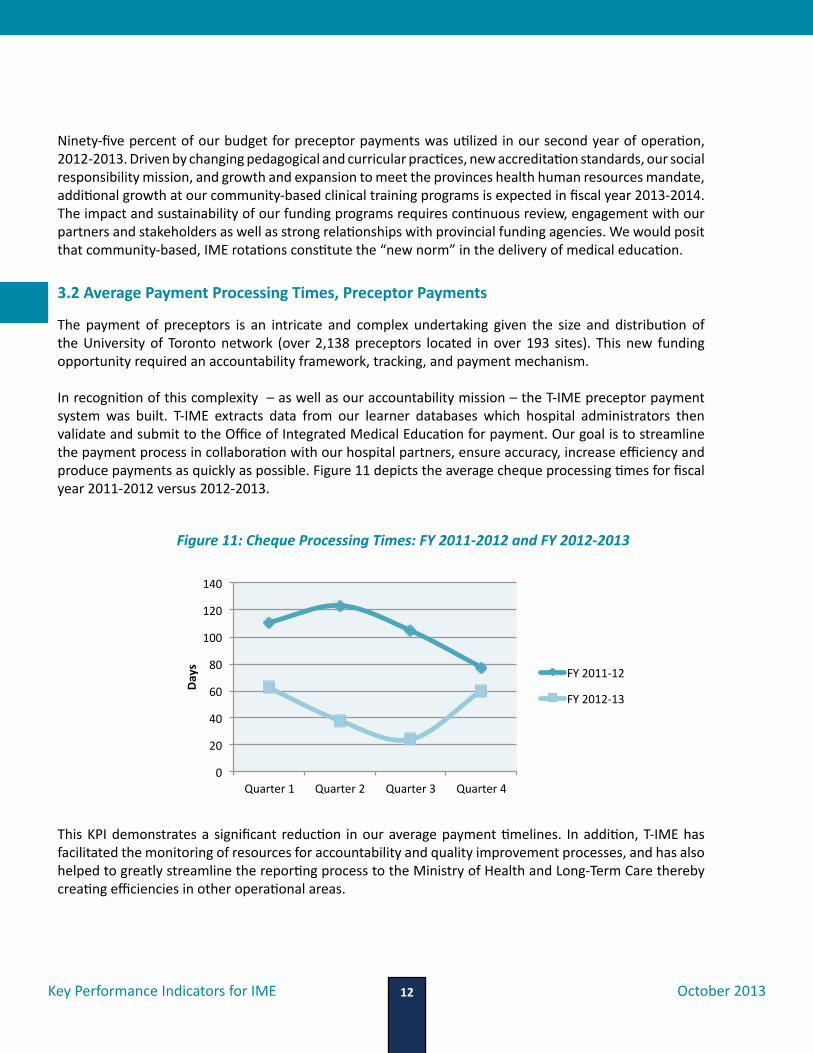
3.2 Average Payment Processing Times, Preceptor Payments
The payment of preceptors is an intricate and complex undertaking given the size and distribution of the University of Toronto network (over 2,138 preceptors located in over 193 sites). This new funding opportunity required an accountability framework, tracking, and payment mechanism. In recognition of this complexity – as well as our accountability mission – the T-IME preceptor payment system was built. T-IME extracts data from our learner databases which hospital administrators then validate and submit to the Office of Integrated Medical Education for payment. Our goal is to streamline the payment process in collaboration with our hospital partners, ensure accuracy, increase efficiency and produce payments as quickly as possible. Figure 11 depicts the average cheque processing times for fiscal year 2011-2012 versus 2012-2013.
This KPI demonstrates a significant reduction in our average payment timelines. In addition, T-IME has facilitated the monitoring of resources for accountability and quality improvement processes, and has also helped to greatly streamline the reporting process to the Ministry of Health and Long-Term Care thereby creating efficiencies in other operational areas.
0
20
40
60
80
100
120
140
Quarter 1 Quarter 2 Quarter 3 Quarter 4
Days FY 2011-‐12
FY 2012-‐13
Figure 11: Cheque Processing Times: FY 2011-2012 and FY 2012-2013
Key Performance Indicators for IME October 201313
4. Community-Based Academic AppointmentsValuing the education of our learners and the contributions of our faculty is an investment in the future of healthcare. The commitment of our clinical faculty members to lifelong learning and the development of young professionals is the lifeblood of Integrated Medical Education.
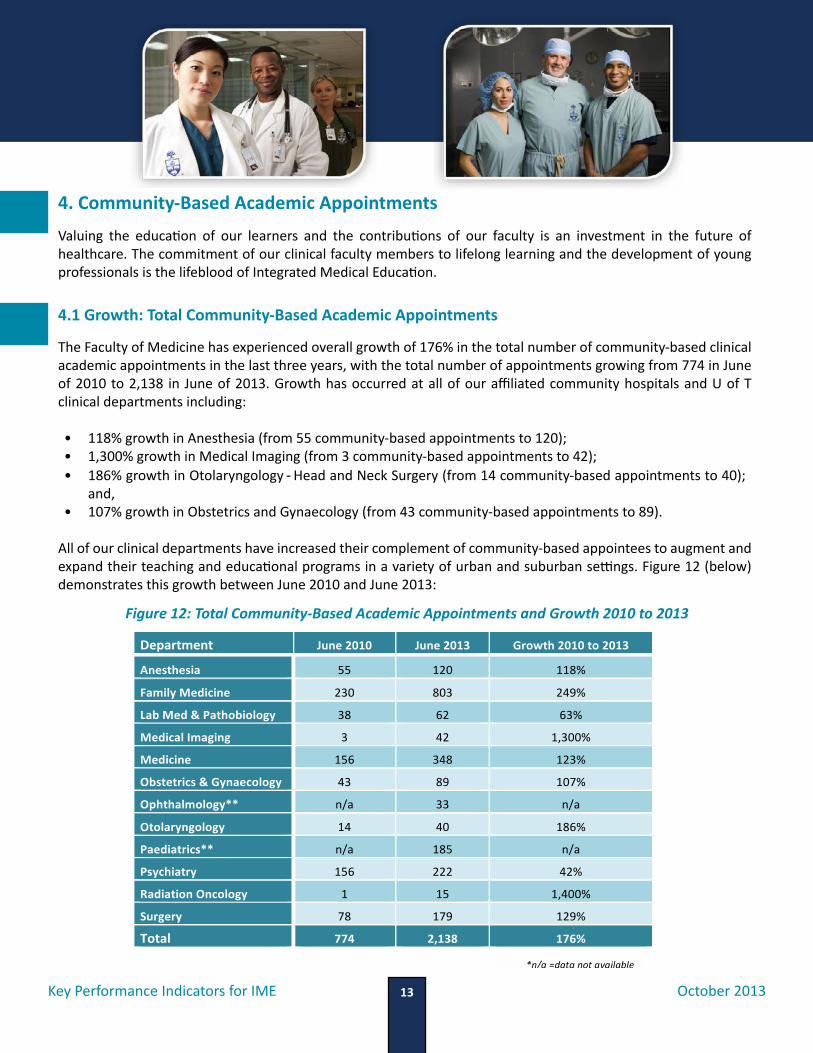
4.1 Growth: Total Community-Based Academic Appointments
The Faculty of Medicine has experienced overall growth of 176% in the total number of community-based clinical academic appointments in the last three years, with the total number of appointments growing from 774 in June of 2010 to 2,138 in June of 2013. Growth has occurred at all of our affiliated community hospitals and U of T clinical departments including:
• 118% growth in Anesthesia (from 55 community-based appointments to 120);• 1,300% growth in Medical Imaging (from 3 community-based appointments to 42); • 186% growth in Otolaryngology - Head and Neck Surgery (from 14 community-based appointments to 40);
and, • 107% growth in Obstetrics and Gynaecology (from 43 community-based appointments to 89).
All of our clinical departments have increased their complement of community-based appointees to augment and expand their teaching and educational programs in a variety of urban and suburban settings. Figure 12 (below) demonstrates this growth between June 2010 and June 2013:
15
growing from 1,318 in June of 2010 to 2,045 in June of 2013. Growth has occurred at all of our affiliated community hospitals and UofT clinical departments including:
• 122% growth in Anesthesia (from 54 community-‐based appointments to 120); • 950% growth in Medical Imaging (from 4 community-‐based appointments to 42); • 1,900% growth in Otolaryngology-‐Head and Neck Surgery (from 2 community-‐based
appointments to 40); and, • 152% growth in Obstetrics and Gynecology (from 16 community-‐based appointments to 89).
Other clinical departments have also significantly increased their complement of community-‐based appointees as well to augment and expand their teaching and educational programs in a variety of urban and suburban settings. Figure 12 (below) demonstrates this growth between June 2010 and June 2013:
Figure 12: Total Academic Appointments and Growth FY 2010-‐2013:
Department June 2010 June 2013 Growth 2010 to 2013
Anesthesia 55 120 118%
Family Medicine 230 803 249%
Lab Med & Pathobiology 38 62 63%
Medical Imaging 3 42 1,300%
Medicine 156 348 123%
Obstetrics & Gynaecology 43 89 107%
Ophthalmology** n/a 33 n/a
Otolaryngology 14 40 186%
Paediatrics** n/a 185 n/a
Psychiatry 156 222 42%
Radiation Oncology 1 15 1,400%
Surgery 78 179 129%
Total 774 2,138 176%
*n/a =data not available
Figure 12: Total Community-Based Academic Appointments and Growth 2010 to 2013

Key Performance Indicators for IME October 201314
4.2 Total Community-Based Academic Appointments: U of T Clinical Departments
As noted, the total number of clinical academic appointments grew significantly between 2010 and 2013. Figure 13 demonstrates the total number of community based academic appointments within each U of T clinical department.
4.3 Total Community Based Academic Appointments: Community-Based Hospitals
The total number of academic appointments at our community-based hospitals has simultaneously increased in the past three years. In future years, we would expect to see a “leveling-off” of new appointments in our larger affiliates, with additional attention paid to retention, recognition, promotions and faculty development efforts. Figures 14 and 15 demonstrate growth at our community-affiliated teaching hospitals:
Figure 13: Total Academic Appointments: 2010 and 2013
0 50
100 150 200 250 300 350 400 450
North York St. Joseph's Toronto East Trillium Scarborough June 2010 144 99 101 92 59 June 2013 269 178 205 441 154
Figure 14: Community-Based Academic Appointments 2010 and 2013(North York, St. Joseph’s, Toronto East General, Trillium Health Partners and Scarborough)
** based on growth from 2012 to 2013
Department June 2010 June 2013 Growth FY2010 to FY2013Surgery 78 179 129%Radiation Oncology 1 15 1400%Psychiatry 156 222 42%Paediatrics** 179 185 n/aOtolaryngology 14 40 186%Ophthalmology** 24 33 n/aObstetrics & Gynaecology 43 89 107%Medicine 156 348 123%Medical Imaging 3 42 1300%Lab Med & Pathobiology 38 62 63%Family Medicine 230 803 249%Anesthesia 55 120 118%Total 977 2138 119%** based on growth from 2012 to 2013
0 100 200 300 400 500 600 700 800 900
Surgery RadiaRon Oncology
Psychiatry Paediatrics**
Otolaryngology Ophthalmology**
Obstetrics & Gynaecology Medicine
Medical Imaging Lab Med & Pathobiology
Family Medicine Anesthesia
June 2010
June 2013

Key Performance Indicators for IME October 201315
0102030405060708090
100
June 2010June 2013
4.4 Distribution of Community-Based Academic Appointments
Figure 16 below demonstrates the distribution of community-based faculty appointments across our U of T clinical departments as of June 2013:
Figure 15: Community-Based Academic Appointments Continued: 2010 and 2013
Anesthesia 6%
Family Medicine 38%
Lab Med & Pathobiology
3% Medical Imaging 2%
Medicine 16%
Obstetrics & Gynaecology
4%
RadiaCon Oncology 1%
Ophthalmology 1%
Otolaryngology 2%
Paediatrics 9%
Psychiatry 10%
Surgery 8%
Figure 16: Distribution of Academic Appointments U of T Departments (June 2013)
Key Performance Indicators for IME October 201316
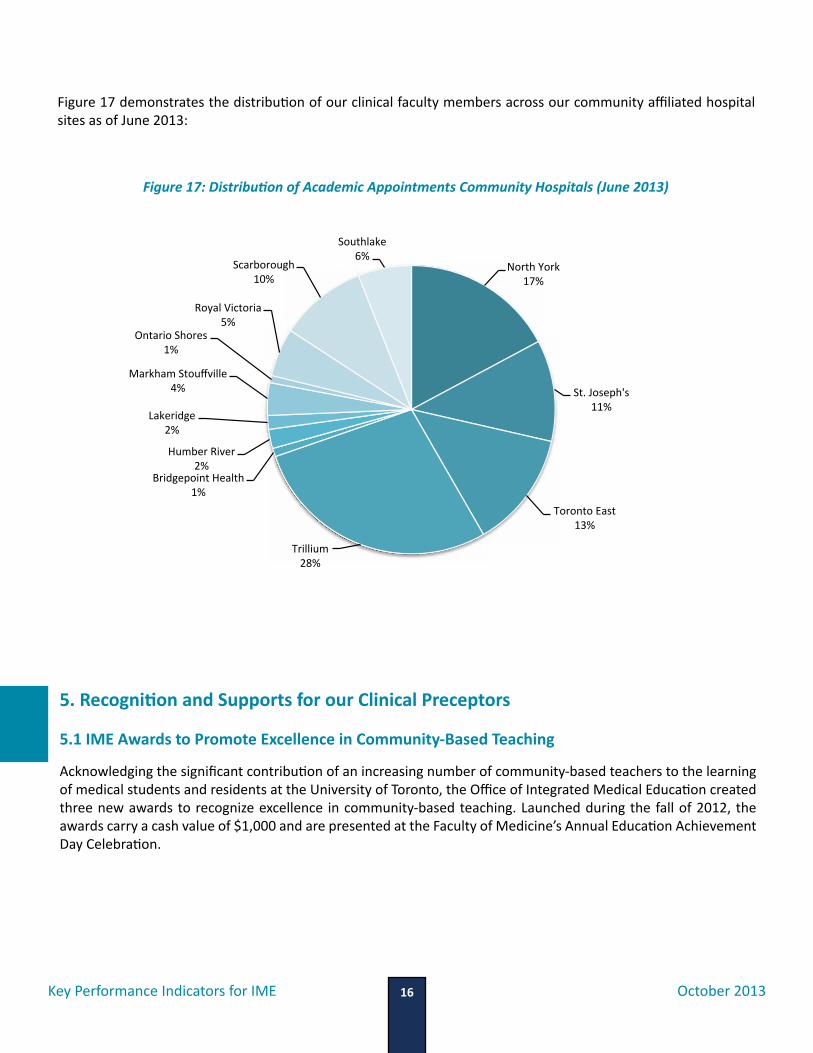
North York 17%
St. Joseph's 11%
Toronto East 13%
Trillium 28%
Bridgepoint Health 1%
Humber River 2%
Lakeridge 2%
Markham Stouffville 4%
Ontario Shores 1%
Royal Victoria 5%
Scarborough 10%
Southlake 6%
Figure 17: Distribution of Academic Appointments Community Hospitals (June 2013)
Figure 17 demonstrates the distribution of our clinical faculty members across our community affiliated hospital sites as of June 2013:
5. Recognition and Supports for our Clinical Preceptors
5.1 IME Awards to Promote Excellence in Community-Based Teaching
Acknowledging the significant contribution of an increasing number of community-based teachers to the learning of medical students and residents at the University of Toronto, the Office of Integrated Medical Education created three new awards to recognize excellence in community-based teaching. Launched during the fall of 2012, the awards carry a cash value of $1,000 and are presented at the Faculty of Medicine’s Annual Education Achievement Day Celebration.
Key Performance Indicators for IME October 201317
In our inaugural year, we received twenty-two nominations. A wide range of clinical specialties and community-based hospitals were represented through these stellar nominees. Although the committee intended to provide three awards in 2013, a total of five awards were given across the three categories. The categories are as follows:
• Excellence in Community-Based Teaching (Community Hospital)• Excellence in Community-Based Teaching (Clinic/Office/Practice)• Sustained Excellence in Community-Based Teaching
5.2 Faculty Development and Orientation Programs
In partnership with the Centre for Faculty Development and the T-IME Continuing Education & Faculty Development working group, the OIME launched an orientation for new clinical faculty members in late 2012. The goal of the program is to orient new and existing faculty members to teaching, learning and academic promotion. Each session is offered within a community-based hospital, and together with the Director or Vice President of Medical Education, is tailored to meet the unique needs of each site. By the end of each session, participants are able to:
1. Describe the opportunities to be involved in teaching; 2. Identify their own learning needs related to their professional roles; 3. Identify resources (including people) at their hospital, department and university that support teaching and
learning; and, 4. Reflect on the ways in which they can document their academic work.
To date, the orientation program has been attended by 50 new faculty members at St. Joseph’s Health Centre and North York General Hospital. The program will be offered at additional sites in 2013-2014.
5.3 Communications Programs
During the spring of 2012, the Office of Integrated Medical Education launched a website which acts as a centralized repository for our community-based physicians and learners engaging in community-based learning (www.oime.utoronto.ca). Links to various resources and units can easily be accessed from this website. In late 2012, the OIME also launched the e-Learning website (http://oime.utoronto.ca/Faculty/E-Learning_Resources.htm) which is also designed to serve as a centralized resource, connecting faculty to existing or developmental initiatives on e-Learning.
In addition to the OIME website, the OIME published a quarterly Newsletter. The Newsletter is circulated to a list serve of over 2,200 subscribers.
Key Performance Indicators for IME October 201318
6. EvaluationTeaching effectiveness scores (TES) and rotation effectiveness scores (RES) are completed by clerks and residents at the end of each clinical rotation. RES are collected and presented by hospital service divisions/service for all of our affiliated teaching sites. All questions utilize a 5-point rating scale (5 being the highest possible rating available and 1 being the poorest). In 2011-2012, the aggregated TES and RES for clerks and residents in each of the community sites produced scores that were consistently high across all specialties and all community-affiliated sites. As an example, the mean teaching effectiveness score for Family Medicine resident learners in our larger community-based hospitals was 4.69, higher than the average TES for all sites of 4.49.
7. Contribution to Physician Supply in Ontario Diverse learning contexts have become embedded in medical education and across all health professions. The goal of diverse learning contexts is to facilitate learning and training in a range of urban, suburban and rural settings to better prepare – and encourage - graduates to practice in a wide range of practice locations.
Some of the earlier results observed from the Department of Family Medicine show significant increases in the number of U of T trained Family Physicians practicing in rapidly growing areas outside of the City of Toronto over the last 10 years such as: Clarington (83%); Markham (154%); Barrie (129%) and Scugog (300%).
In future, the practice location of all UofT graduates who have spent a specific amount of time engaged in IME-based training will be tracked and we will endeavor to measure their impact on population health.
8. Longer-Term Key Performance Indicators for IMEIntegrated medical education at the University of Toronto is an evolving and comparatively new concept. As such, our KPIs for IME will develop over time from those that are primarily focused on education-related outcomes and measures, to those that reflect health, social and economic outcomes as well. Longer-term KPIs may include learner, preceptor and stakeholder satisfaction and impacts; the perceived impact of sustained community-based clinical rotations on CaRMS matches; comparability of the learner experience and performance across different sites; evaluation of faculty development programs; the impact of the presence of learners in hospital or independent community-based sites on clinical practice models; and socioeconomic impact studies.

Key Performance Indicators for IME October 201319
Impact StoryIn just two years, Integrated Medical Education has had a significant positive impact on the delivery of medical education – across the continuum – at the University of Toronto and across our affiliated sites. Recognized as a key strength of our postgraduate education programs during the 2013 RCPSC and CFPC accreditation survey, our KPIs provide a platform upon which we can demonstrate our impact, accountability, and return-on-investment to our stakeholders and funding partners and buttress the results produced through accreditation or program evaluation techniques.
The KPIs presented in this report will be collected annually and were collected on the basis of criteria which includes comparability with other DME programs in Ontario; cost-effectiveness; relevance to our overall mission and strategic goals for IME; reliability; and, validity. Thus, the key performance indicators presented in this report provide evidence of:
Future Challenges and OpportunitiesIME represents a fundamental change in the delivery of medical education at the University of Toronto. Given the expansion, size, depth and breadth of our educational programs and clinical opportunities, IME presents both major challenges and opportunities for future integration, innovation and impact. To meet the needs of our learners, faculty preceptors and health-related needs of Ontarians, sustained funding will be required on the part of our government and funding agencies. Communications across our sites will require persistent and continuous attention. New faculty development models – and modes of delivery – will be required to enhance the experience of our over 2,000 community-based preceptors. Methods to enhance the learner experience across multiple teaching sites will need to incorporate e-registration and e-orientation processes as our learners traverse through our network of sites. E-Learning – as a podium upon which to build new pedagogical methods, curricular innovations and future faculty development and learner experience initiatives – will require further development and investment.
Engagement
Quality: Learner days in the
community sites, evidence-based
practice
Safety
Reform
Positive community-based,
ambulatory learning in regions
that constitute the University
of Toronto’s “community”

Key Performance Indicators for IME October 201320
Contacts
Sarita VermaProfessor of Family MedicineDeputy Dean, Faculty of MedicineAssociate Vice Provost, Health Professions EducationUniversity of [email protected]
Wendy KubasikManager, Office of Integrated Medical EducationUniversity of [email protected](416) 978-3762
Mubin MerchantFinancial Officer, Office of Integrated Medical [email protected](416) 978-3748
Maria WowkProject Assistant, Office of Integrated Medical [email protected](416) 978-3757
© Office of Integrated Medical Education (OIME)Office of the Dean, Faculty of MedicineUniversity of Toronto500 University Ave, 5th Floor Postgraduate Medical EducationToronto, Ontario M5G 1V7www.oime.utoronto.ca


© Office of Integrated Medical Education (OIME)Office of the Dean, Faculty of MedicineUniversity of TorontoOctober 2013