official statistics in the context of the referendum on ... · official statistics in the context...
TRANSCRIPT

MonitoringReport
Official Statistics in the Context
of the Referendum on Scottish
Independence


Contents
FOREWORD .................................................................................................................................. 1
SECTION 1: DEFINING SCOTLAND .............................................................................................. 6
SECTION 2: POPULATION ............................................................................................................ 9
SECTION 3: NATIONAL ACCOUNTS .......................................................................................... 14
SECTION 4: PUBLIC EXPENDITURE .......................................................................................... 21
SECTION 5: TRADE ..................................................................................................................... 24
SECTION 6: OIL AND GAS .......................................................................................................... 30
SECTION 7: TAXATION ............................................................................................................... 33
SECTION 8: DEFICIT AND DEBT ................................................................................................ 37
SECTION 9: EMPLOYMENT AND EARNINGS ............................................................................ 41
SECTION 10: HOUSEHOLD INCOME AND EXPENDITURE ....................................................... 45
SECTION 11: SOCIAL PROTECTION .......................................................................................... 51
SECTION 12: HEALTH ................................................................................................................. 54
SECTION 13: EDUCATION .......................................................................................................... 63
LIST OF ABBREVIATIONS ........................................................................................................... 68
GLOSSARY .................................................................................................................................. 70
Editorial note: Whilst the UK Statistics Authority has taken the advice of many experts in preparing this report, the guidance we offer is necessarily selective and may need to be extended or revised in the light of changes to the availability of statistics or feedback on the report itself. We may, therefore, update and re-issue the report in the coming months if we think it would be helpful to do so.

Official Statistics in the Context of the Referendum on Scottish Independence MR 6-2013
UK Statistics Authority 1
FOREWORD
“The people of Scotland will vote in a referendum on Thursday 18 September, 2014. They will be asked the question: Should Scotland be an independent country? Yes or No. Scottish Ministers support independence1.”
“The UK Government ...believes that both Scotland and the UK are better served by maintaining their partnership.” 2
Those are the stated positions of the elected administrations in Scotland and London. In the months ahead, we can expect to see these positions developed and promoted by politicians and commentators, and many will quote official statistics in support of their arguments. Inevitably, statistical comparisons will be drawn between Scotland and the rest of the UK.
Whether you are seeking to cite official statistics in support of your views or simply observing them being so used, it is important to keep in mind that whilst statistical comparisons between administrations can be illuminating and valuable, they can also be problematic and uncertain. Official statistics should always be the best estimates that can be made but are not always available on a consistent or comparable basis.
The UK Statistics Authority is entirely neutral on the substantive question of independence for Scotland, but we do care about the safe and effective use of official statistics in public debate. If those statistics are misrepresented or misinterpreted, not only does that lessen the integrity of the debate, it undermines confidence in the statistical system; and that in turn undermines confidence in the vast range of economic and social policies shaped by the statistics.
The intelligent and informed use of statistics is fundamental to modern democratic debate and the Statistics Authority wants to see official statistics widely used both before and after the 2014 referendum. But that use needs to be informed and guided by expert advice.
This report, prepared by Sandy Stewart and Richard Alldritt for the UK Statistics Authority, does not seek to present all the relevant figures but offers a wide range of advice for reference on sources and comparability. The Office for National Statistics will complement this with a compendium of comparable statistics for the four UK administrations ahead of the referendum. We will draw on all this material in responding publicly to any concerns about the use of official statistics.
Sir Andrew Dilnot Chair of the UK Statistics Authority October 2013
1 http://www.scotreferendum.com/
2 Scotland analysis: Devolution and the implications for Scottish independence, CM8554, February 2013,
paragraph ii.
Official Statistics in the Context of the Referendum on Scottish Independence MR 6-2013
UK Statistics Authority 2
OFFICIAL STATISTICS IN THE CONTEXT OF THE REFERENDUM ON SCOTTISH INDEPENDENCE
The 2014 referendum is likely to prompt wide interest in patterns and trends in social and economic conditions in Scotland, viewed both as a distinct country and also in comparison with the rest of the UK. Long-standing differences in law and public administration, and the more recent devolution of powers to Scotland, Wales and Northern Ireland, have led to differences in the availability and definition, and hence comparability, of official statistics between the four UK administrations. Some of these technical obstacles can be avoided or overcome, allowing meaningful comparisons to be made. Sometimes the comparisons are useful but only if their limitations are well understood. And sometimes it is best just to acknowledge that comparisons are unlikely to be valid. The UK Statistics Authority has a statutory responsibility to monitor official statistics produced by all four UK administrations and to draw attention to any concerns it may have about their quality or comprehensiveness, or the observance of good practice. As part of this monitoring role, we will seek to ensure that sound advice is offered in relation to official statistics relevant to the referendum debate and that public statements which ignore this advice are challenged as appropriate. If, in the months leading up to the referendum, the Statistics Authority is approached about the use of official statistics, we will objectively and publicly point out whether we think the guidance in this report, or readily available elsewhere, has been observed. The field of official statistics is very wide and we do not seek to present a comprehensive guide to all the relevant sources. However, in this report we have selected 13 areas of economic and social statistics in relation to which we are able to offer some advice, complementing and emphasising advice already available in official statistics publications. This report is designed to serve as an impartial reference document of use both to those who wish to make statistical comparisons in the course of public discourse, and to those who read such comparisons and want to know about their validity. A companion report, currently being prepared by the Office for National Statistics, will bring together a wide range of relevant statistics. That is not the main focus of the current report although we do include some tables and charts for illustrative purposes. Some summary points Each of the 13 sections of this report ends with a short summary. Below, we offer some more general observations and a brief introduction to the different sections.
All UK official statistics are expected to conform to the Code of Practice for Official Statistics which requires, in essence, that they be the best statistics that can reasonably be produced on the topic, be free from any inappropriate interference, and that their strengths and weaknesses be well explained when they are published. However, being the best available does not necessarily mean they are ideal for every purpose and every comparison, a point well illustrated by this report.

Official Statistics in the Context of the Referendum on Scottish Independence MR 6-2013
UK Statistics Authority 3
All statistics, whether official or not, are subject to a degree of uncertainty. This can be due to the figures being derived from sample surveys or it can be due to incomplete records, approximation methods or ambiguity in concepts and definitions. We have sought in this report to draw attention to where this is likely to be an important consideration and to provide links to the original sources of the figures. The official source is usually the best place to find out more about the nature, extent and reasons for uncertainty associated with the estimates.
Expressing expenditure on a per capita basis allows comparisons to be made between countries or regions, and we quote such statistics extensively in this report. However, bear in mind that the per capita cost is the average cost to the whole population in an area, not the average cost per recipient of a particular service. So, for example, an area with more elderly people will likely have higher per capita expenditure on care for the elderly even if the cost per elderly person is the same.
Official statistics, by their nature, normally relate to the recent or historical past. However, commentators are also likely to seek information about how the outcome of the referendum might affect future trends. So the construction by economists and researchers of statistical models, and the production of estimates and projections based on them, will add to the mix of statistical data being quoted in debate. We offer some observations on forecasts and projections at appropriate points in this report. There are some statistics from non-official sources quoted in debate and repeated in the news media. These can develop a life of their own, with the original source and all associated caveats and assumptions lost in the trail of repetition. We do not quote statistics of that kind in this report, and we do not normally comment on their validity. Our advice is to ask questions about where such statistics come from and on what assumptions they are based. If those questions are not answered, then the statistics should be regarded as suspect.
It is perhaps uncommon for reports about official statistics to expend a lot of words on statistics that do not currently exist. However, one purpose of this report is to contribute to ongoing discussions about priorities for improvement to the statistical infrastructure across the UK, and several sections of the report draw attention to the need for new or better data. Few of these developments are likely to be completed before the September 2014 referendum but it is nonetheless relevant to the debate that there are statistical gaps and that they are acknowledged as such. Mostly, where we present statistics in this report, we do so for illustrative purposes and we compare figures for Scotland with the corresponding UK figures rather than with the „rest of the UK‟. In part this is because the „rest of the UK‟ is not a standard statistical area but also because per capita rates for the UK will mostly be very close to per capita rates for the „rest of the UK‟. In some cases – where comparable data are available – we illustrate a point by tabulating data for each country of the UK.
Section 1 of the report explains the concept of the UK‟s Extra-Regio territory. How this is treated in the economic statistics will often substantially affect the conclusions that are drawn. Anyone wishing to compare Scotland‟s economic statistics with those for the UK as a whole should ensure they take account of this.
Official Statistics in the Context of the Referendum on Scottish Independence MR 6-2013
UK Statistics Authority 4
Section 2 provides some basic demographic data. Scotland has a slightly higher proportion of working age and older people than the UK average but a lower proportion of young people (under 16). Consequently the dependency ratio in respect of children is lower, and projected to remain so, whilst the dependency ratio in respect of elderly people is projected to increase faster than for the UK.
Section 3 deals with National Accounts. Very few of the main National Accounts statistics for the UK are consistently available for the devolved administrations – for good technical reasons. However, the Regional Gross Value Added statistics offer a starting point. If the Extra-Regio component is excluded, GVA per capita is not greatly different between Scotland and the UK. However, the picture is different if a geographical share of the Extra-Regio component is added for Scotland. The Scottish National Accounts Project (SNAP) provides this and other related analyses. Section 4 is about how to approach comparisons of public expenditure for Scotland and the UK. The Treasury‟s Public Expenditure Statistical Analysis (PESA) publication sets out comparative data for „identifiable‟ expenditure. For an analysis including an apportioned share of other elements of public expenditure, the Scottish Government‟s publication Government Expenditure and Revenue Scotland (GERS) is a valuable source. Section 5 on trade statistics discusses the problems associated with measuring the flows of goods and services into and out of Scotland. The concept of Scottish trade statistics depends on whether and how to record flows of goods and services between Scotland and other parts of the UK. Whilst this is a complex question there are nonetheless some relevant and useful official statistics. Section 6 discusses the importance of the treatment of oil revenues in relation to Scotland‟s economic statistics. Whilst at the UK level, oil revenues constitute about 1.5% of tax revenues, if a geographical share of those revenues is apportioned to Scotland, they would amount to between 10% and 20% of Scotland‟s tax revenues (under various assumptions), and thus markedly affect the fiscal balance. Section 7 looks at taxation more generally. Whilst there are many sources of official statistics on UK taxes, few offer a breakdown for the devolved administrations. However, the Government Expenditure and Revenue Scotland (GERS) report uses apportionment methods to offer an insight into Scotland‟s tax base. Given the nature of the statistical methods employed, the figures should be treated as having wide margins of uncertainty. Section 8 is about statistics on deficit and debt. Under current constitutional arrangements, Scotland does not have a specific level of deficit or debt but there are some official statistics relevant to analysis of the historical balance of tax revenue and public expenditure and we consider the most relevant sources. Section 9 covers employment and earnings, two areas for which good comparative statistics are readily available. We offer some advice on comparing the size of the public sector in Scotland with the UK average. Section 10 looks at household income and expenditure. Again there is a good range of comparative statistics available. This section includes some statistics on both the levels of
Official Statistics in the Context of the Referendum on Scottish Independence MR 6-2013
UK Statistics Authority 5
household income and what it is spent on, comparing Scotland with the other countries and regions of the UK. Section 11 gathers together information from statistical sources relevant to social protection – a collective term used internationally to cover personal social services, publicly funded benefits and pensions. Currently, many social protection programmes are managed on a Great Britain basis which means, in effect, that expenditure in Scotland is driven by need (or entitlement) rather than by budget allocation, and we compare patterns of spending between the four UK countries. Section 12 is about public health and expenditure on health services. We draw together some comparative statistical data which shows that Scotland faces some particular public health challenges, spends more per head of population on healthcare than the UK average, and has relatively more NHS staff. Section 13 looks at the available statistics on education and explains some of the constraints on making meaningful comparisons. The OECD statistics from the Programme for International Student Assessment provide some direct comparisons for school age children.
Official Statistics in the Context of the Referendum on Scottish Independence MR 6-2013
UK Statistics Authority 6
SECTION 1: DEFINING SCOTLAND
1.1 Comparisons of economic statistics between Scotland and other parts of the UK are
substantially affected by the territorial concepts adopted. Land-based territory (the
country as it appears on a conventional map) and economic territory are the two main
options. The economic territory is defined in European guidelines3 as being the land-
based territory plus the Scottish element of the UK Extra-Regio territory. Extra-Regio is a
National Accounting concept, used in Regional Accounts, where economic activity that
cannot be assigned to any specific region is treated as the thirteenth region of the UK. This
consists mainly of offshore oil and gas extraction along with the activities of UK embassies
and forces overseas and other overseas activities.
1.2 For brevity, these two concepts are also referred to as the „onshore‟ and „total‟ definitions;
with „offshore‟ as the difference between them. Currently there is no agreed definition of
offshore economic activity for Scotland and that would only be given a formal definition in
the event of independence. So, ahead of the referendum, any statistics for Scotland that
purport to be on a total economy basis will involve some speculative assumptions, and this
needs to be kept in mind.
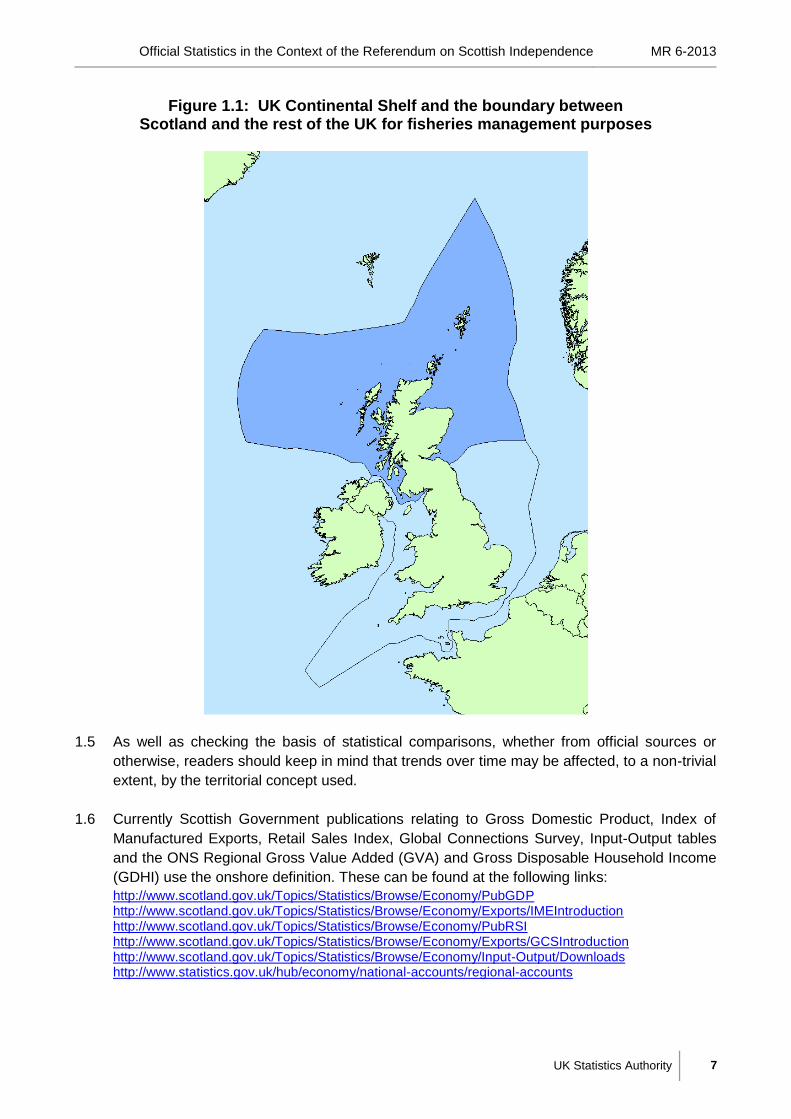
1.3 In official statistics publications, a widely-adopted convention is to use the boundary
definition established for the purposes of the demarcation of Fisheries Management
responsibilities between the Scottish and UK Governments, where a median line extending
the boundary between Scotland and England, to the north of Berwick-upon-Tweed, is used
– see figure 1.1. This convention has also been used widely for analytical purposes and is
the „illustrative geographical‟ apportionment adopted in the Government Expenditure and
Revenue Scotland (GERS) publication4 since it was reviewed in 2008. GERS is a National
Statistics publication and has been the subject of formal assessment by the UK Statistics
Authority5.
1.4 Official statistical publications and analyses do not always make clear whether they are on
the basis of onshore or total economic activity. It is important that they should do so and
the UK Statistics Authority will be asking the government departments and other bodies
that produce the statistics to pay close attention to this point. Where it remains unclear,
users should seek clarification before drawing conclusions. Ideally, all comparisons should
be on the same basis, either onshore or total activity but with the proviso that „total‟ is not
uniquely defined for Scotland.
3 http://circa.europa.eu/irc/dsis/nfaccount/info/data/esa95/en/een00485.htm (relevant part of European
System of Accounts 1995) and http://www.ons.gov.uk/ons/guide-method/method-quality/specific/economy/regional-accounts/index.html (Regional Accounts methodology guide). 4 http://www.scotland.gov.uk/Topics/Statistics/Browse/Economy/GERS
5 http://www.statisticsauthority.gov.uk/assessment/assessment/assessment-reports/index.html (see Report
98)
Official Statistics in the Context of the Referendum on Scottish Independence MR 6-2013
UK Statistics Authority 7
Figure 1.1: UK Continental Shelf and the boundary between Scotland and the rest of the UK for fisheries management purposes
1.5 As well as checking the basis of statistical comparisons, whether from official sources or
otherwise, readers should keep in mind that trends over time may be affected, to a non-trivial
extent, by the territorial concept used.
1.6 Currently Scottish Government publications relating to Gross Domestic Product, Index of
Manufactured Exports, Retail Sales Index, Global Connections Survey, Input-Output tables
and the ONS Regional Gross Value Added (GVA) and Gross Disposable Household Income
(GDHI) use the onshore definition. These can be found at the following links:
http://www.scotland.gov.uk/Topics/Statistics/Browse/Economy/PubGDP http://www.scotland.gov.uk/Topics/Statistics/Browse/Economy/Exports/IMEIntroduction http://www.scotland.gov.uk/Topics/Statistics/Browse/Economy/PubRSI http://www.scotland.gov.uk/Topics/Statistics/Browse/Economy/Exports/GCSIntroduction http://www.scotland.gov.uk/Topics/Statistics/Browse/Economy/Input-Output/Downloads http://www.statistics.gov.uk/hub/economy/national-accounts/regional-accounts
Official Statistics in the Context of the Referendum on Scottish Independence MR 6-2013
UK Statistics Authority 8
1.7 The Government Expenditure and Revenue Scotland (GERS) reports and experimental
Scottish National Accounts Project (SNAP) provide estimates for Scotland on both the
onshore and total economy definitions, for a range of statistics including Gross Value Added
(GVA), Gross Domestic Product (GDP) and Tax revenues. These can be found at
http://www.scotland.gov.uk/Topics/Statistics/Browse/Economy/GERS http://www.scotland.gov.uk/Topics/Statistics/Browse/Economy/SNAP
1.8 In these publications the offshore elements of the UK economy are allocated pro-rata to
Scotland using, a) a population share basis and b) an illustrative geographic basis, to give
two alternative sets of figures. Either may reasonably be used to make comparisons with the
UK total economy figures as long as a consistent basis is adopted and clearly stated.
1.9 In practice, commentators often end up comparing Scottish real-terms GDP (produced by the Scottish Government on a quarterly basis) with the latest UK series (published quarterly and updated monthly by the Office of National Statistics). This means that Scotland without oil revenues is compared to the UK with oil revenues. The ONS publication does, however, contain a series „UK GDP less oil and gas‟ which is a close approximation to an Onshore UK GDP series (excluding Extra-Regio). At present, this UK less Extra-Regio GDP statistic is not published in real terms and so there is no direct UK counterpart to the Scottish real-terms GDP figures.
1.10 An alternative approach would be to compile a real-terms GDP statistic for Scotland including
an estimated share of Extra-Regio. However, this would require a decision at a political level on the appropriate share of the Extra-Regio components to be associated with Scotland. While this would not replace the headline Onshore GDP estimate, it would be a useful additional statistic for understanding the Scottish economy.
Summary of advice
Before comparing economic statistics between countries or regions it is important to be
clear about how each economy has been defined.
The concept of Extra-Regio in the UK National Accounts only appears explicitly in the
annual Regional Gross Value Added (GVA) and Gross Disposable Household Income
(GDHI) analysis.
Advice to the statistical service It would be helpful for comparative purposes to have official statistics relating to real-terms
GDP on a „UK less Extra-Regio‟ definition.
Whilst nominal quarterly estimates of Scottish GDP including a share of Extra-Regio are
available, real-terms estimates are not. This could be a consideration for future
development of the SNAP statistics.
Official Statistics in the Context of the Referendum on Scottish Independence MR 6-2013
UK Statistics Authority 9
SECTION 2: POPULATION
2.1 Scotland‟s population was 5.3 million in mid-2012 (the latest available estimate), accounting
for 8.3 per cent of the UK total. Scotland‟s total area is nearly 78,000 square kilometres,
giving a population density of 68 people per sq km, compared to the UK average of 263 per
sq km. Scotland has the lowest population density of any of the UK countries or English
regions.
2.2 The populations of Scotland and the other UK countries are measured definitively in the
Census: a 10-yearly UK-wide household survey, last conducted in 20116. Annual Mid-Year
Estimates (MYEs) are then produced by applying annual births, deaths and migration
estimates cumulatively. MYEs are available on a consistent basis for Scotland and the rest of
the UK. The latest are for 2012 and are based on the 2011 Census7.
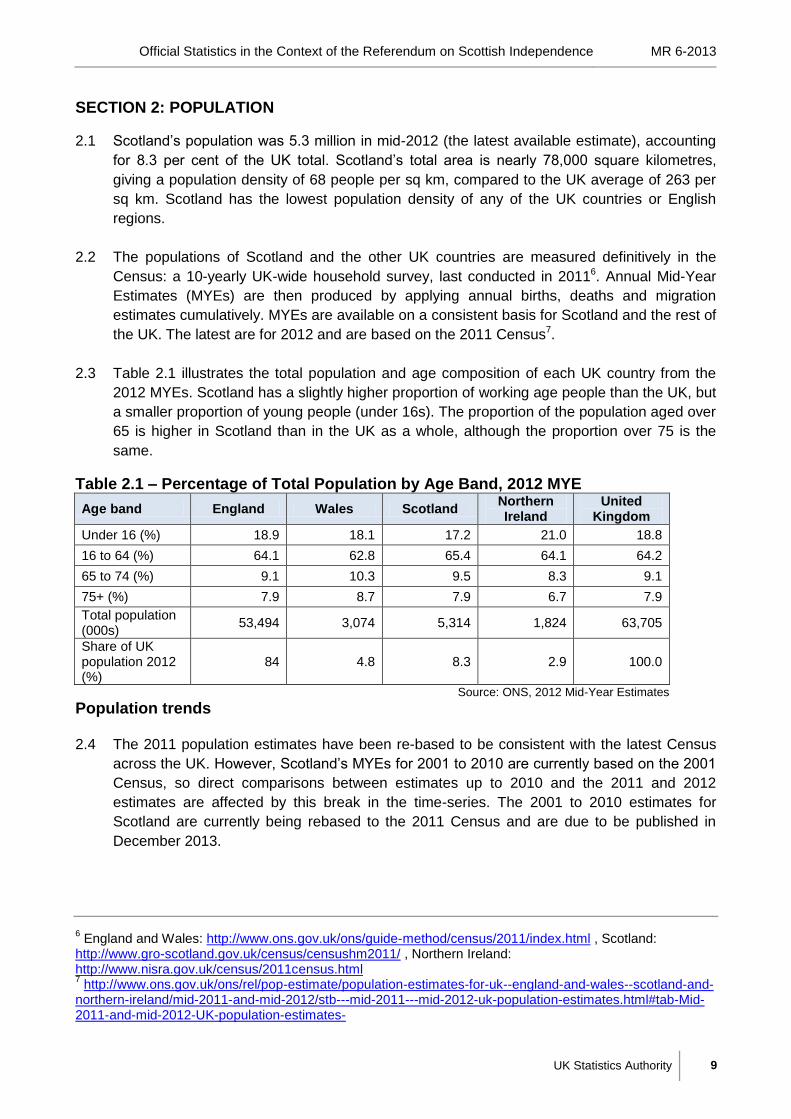
2.3 Table 2.1 illustrates the total population and age composition of each UK country from the
2012 MYEs. Scotland has a slightly higher proportion of working age people than the UK, but
a smaller proportion of young people (under 16s). The proportion of the population aged over
65 is higher in Scotland than in the UK as a whole, although the proportion over 75 is the
same.
Table 2.1 – Percentage of Total Population by Age Band, 2012 MYE
Age band England Wales Scotland Northern Ireland
United Kingdom
Under 16 (%) 18.9 18.1 17.2 21.0 18.8
16 to 64 (%) 64.1 62.8 65.4 64.1 64.2
65 to 74 (%) 9.1 10.3 9.5 8.3 9.1
75+ (%) 7.9 8.7 7.9 6.7 7.9
Total population (000s)
53,494 3,074 5,314 1,824 63,705
Share of UK population 2012 (%)
84 4.8 8.3 2.9 100.0
Source: ONS, 2012 Mid-Year Estimates
Population trends 2.4 The 2011 population estimates have been re-based to be consistent with the latest Census
across the UK. However, Scotland‟s MYEs for 2001 to 2010 are currently based on the 2001
Census, so direct comparisons between estimates up to 2010 and the 2011 and 2012
estimates are affected by this break in the time-series. The 2001 to 2010 estimates for
Scotland are currently being rebased to the 2011 Census and are due to be published in
December 2013.
6 England and Wales: http://www.ons.gov.uk/ons/guide-method/census/2011/index.html , Scotland:
http://www.gro-scotland.gov.uk/census/censushm2011/ , Northern Ireland: http://www.nisra.gov.uk/census/2011census.html 7 http://www.ons.gov.uk/ons/rel/pop-estimate/population-estimates-for-uk--england-and-wales--scotland-and-
northern-ireland/mid-2011-and-mid-2012/stb---mid-2011---mid-2012-uk-population-estimates.html#tab-Mid-2011-and-mid-2012-UK-population-estimates-
Official Statistics in the Context of the Referendum on Scottish Independence MR 6-2013
UK Statistics Authority 10
2.5 There are three key components that are adjusted in the mid-year estimates between
Census years: births, deaths and migration. Data on births and deaths are provided by local
Registration Offices and the National Records for Scotland (NRS). Migration within the UK is
estimated from the NHS Central Register and the Community Health Index, with some
further adjustments for certain groups including armed forces, prisoners and students.
International migration estimates are primarily taken from the International Passenger Survey
(IPS)8, with some adjustments derived from Home Office (asylum seekers), Labour Force
Survey (LFS) data and Northern Ireland international migration estimates. The IPS produces
a relatively small sample of migrants and people do not always register with local health
services, so the full extent of local migration may not always be well measured.
Population projections 2.6 The Office for National Statistics (ONS) produces UK National Population Projections every
two years. Sub-national projections are then produced by ONS for England, the Welsh
Government for Wales, National Records for Scotland (NRS) for Scotland and the Northern
Ireland Statistics and Research Agency (NISRA) for Northern Ireland. Population projections
are relevant to the referendum debate in that projections of the working age population will
affect estimates of the available labour force and hence potential tax revenue. And
projections of the number of children and retired people will affect assumptions about the
dependency ratios and hence benefits calculations. The latest available projections are
based on the 2010 population estimates9, which have not yet been rebased to the 2011
Census. The 2010-based projections are therefore not directly comparable to the 2011
Census or 2012 population estimates. This position is the same for Scotland and rest of the
UK. Projections based on the 2012 population estimates, and rebased to the 2011 Census,
are due to be published on 6 November 2013.
2.7 All statistical projections are based on an assumption of the continuation of current
demographic trends. However, ONS also produces variant projections which adopt a range
of plausible alternative scenarios: these include combinations of high and low trends for
fertility, life expectancy and migration. The latest available variant projections are 2010-
based and are consistently available for Scotland and the other UK administrations10.
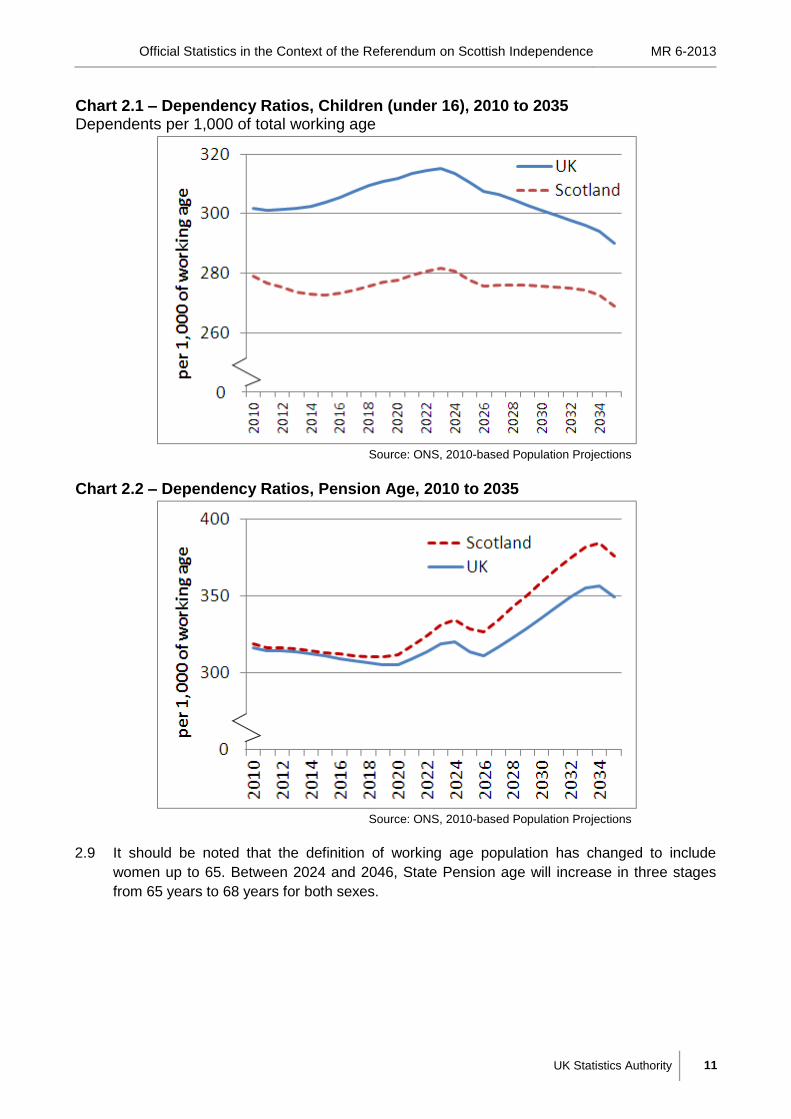
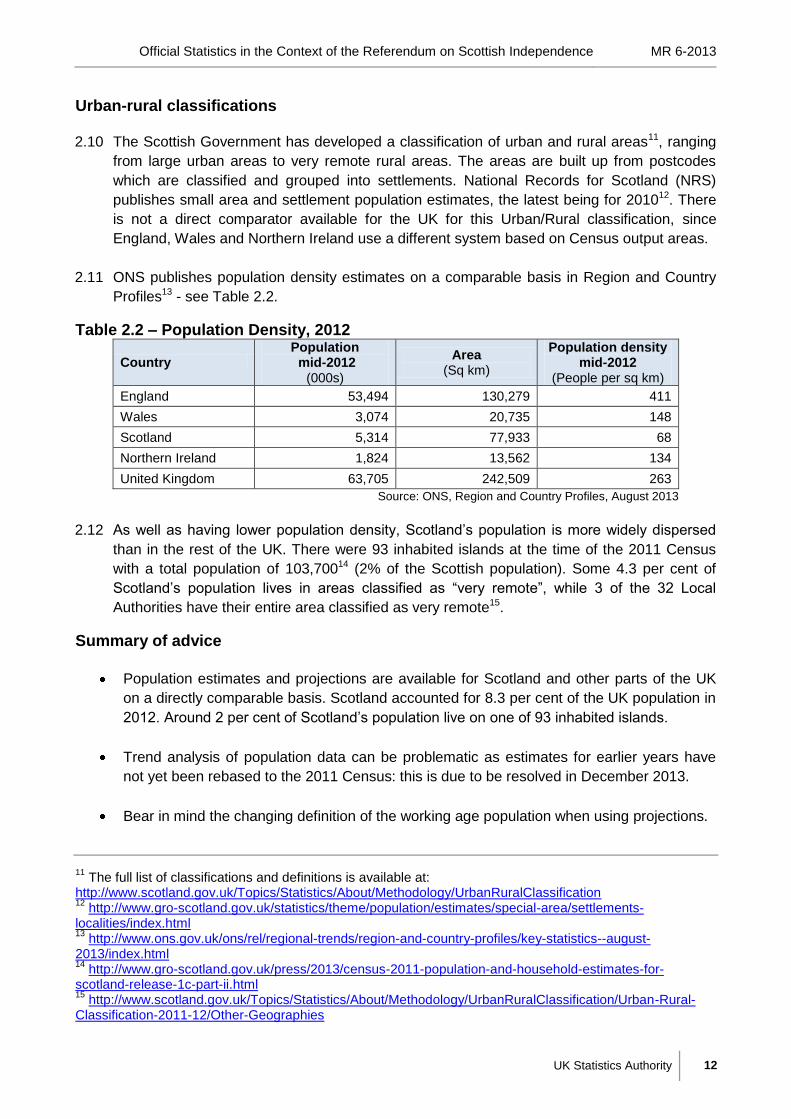
2.8 Charts 2.1 and 2.2 present the projected dependency ratios (based on the total working age
populations) for children and those of pension age in Scotland and the UK to 2035. Scotland
is projected to have a consistently lower dependency ratio amongst children, but a higher
and increasing dependency ratio amongst those of pension age.
8 http://www.ons.gov.uk/ons/guide-method/surveys/respondents/household/international-passenger-
survey/index.html 9 http://www.ons.gov.uk/ons/publications/re-reference-tables.html?edition=tcm%3A77-229866
10 http://www.ons.gov.uk/ons/rel/npp/national-population-projections/2010-based-extra-variants/index.html
Official Statistics in the Context of the Referendum on Scottish Independence MR 6-2013
UK Statistics Authority 11
Chart 2.1 – Dependency Ratios, Children (under 16), 2010 to 2035 Dependents per 1,000 of total working age
Source: ONS, 2010-based Population Projections
Chart 2.2 – Dependency Ratios, Pension Age, 2010 to 2035
Source: ONS, 2010-based Population Projections
2.9 It should be noted that the definition of working age population has changed to include
women up to 65. Between 2024 and 2046, State Pension age will increase in three stages
from 65 years to 68 years for both sexes.
Official Statistics in the Context of the Referendum on Scottish Independence MR 6-2013
UK Statistics Authority 12
Urban-rural classifications 2.10 The Scottish Government has developed a classification of urban and rural areas11, ranging
from large urban areas to very remote rural areas. The areas are built up from postcodes
which are classified and grouped into settlements. National Records for Scotland (NRS)
publishes small area and settlement population estimates, the latest being for 201012. There
is not a direct comparator available for the UK for this Urban/Rural classification, since
England, Wales and Northern Ireland use a different system based on Census output areas.
2.11 ONS publishes population density estimates on a comparable basis in Region and Country
Profiles13 - see Table 2.2.
Table 2.2 – Population Density, 2012
Country Population mid-2012
(000s)
Area (Sq km)
Population density mid-2012
(People per sq km)
England 53,494 130,279 411
Wales 3,074 20,735 148
Scotland 5,314 77,933 68
Northern Ireland 1,824 13,562 134
United Kingdom 63,705 242,509 263
Source: ONS, Region and Country Profiles, August 2013
2.12 As well as having lower population density, Scotland‟s population is more widely dispersed
than in the rest of the UK. There were 93 inhabited islands at the time of the 2011 Census
with a total population of 103,70014 (2% of the Scottish population). Some 4.3 per cent of
Scotland‟s population lives in areas classified as “very remote”, while 3 of the 32 Local
Authorities have their entire area classified as very remote15.
Summary of advice
Population estimates and projections are available for Scotland and other parts of the UK
on a directly comparable basis. Scotland accounted for 8.3 per cent of the UK population in
2012. Around 2 per cent of Scotland‟s population live on one of 93 inhabited islands.
Trend analysis of population data can be problematic as estimates for earlier years have
not yet been rebased to the 2011 Census: this is due to be resolved in December 2013.
Bear in mind the changing definition of the working age population when using projections.
11
The full list of classifications and definitions is available at: http://www.scotland.gov.uk/Topics/Statistics/About/Methodology/UrbanRuralClassification 12
http://www.gro-scotland.gov.uk/statistics/theme/population/estimates/special-area/settlements-localities/index.html 13
http://www.ons.gov.uk/ons/rel/regional-trends/region-and-country-profiles/key-statistics--august-2013/index.html 14
http://www.gro-scotland.gov.uk/press/2013/census-2011-population-and-household-estimates-for-scotland-release-1c-part-ii.html 15
http://www.scotland.gov.uk/Topics/Statistics/About/Methodology/UrbanRuralClassification/Urban-Rural-Classification-2011-12/Other-Geographies
Official Statistics in the Context of the Referendum on Scottish Independence MR 6-2013
UK Statistics Authority 13
The available definitions of urban and rural areas for Scotland and the other UK
administrations are not consistent. However, ONS publishes comparable population density
estimates for the UK countries and English regions.
Official Statistics in the Context of the Referendum on Scottish Independence MR 6-2013
UK Statistics Authority 14
SECTION 3: NATIONAL ACCOUNTS
3.1 The Office for National Statistics (ONS) produces detailed National Accounts for the UK.
These include estimates of nominal GDP using an output, expenditure and income approach,
balanced using the Input-Output framework, on an annual basis, together with real and
nominal estimates of GVA and GDP on a quarterly basis16. GDP is augmented with net
income from abroad to estimate the UK Gross National Income (GNI) which is used to
calculate the largest part of the UK‟s financial contribution to the EU budget.
3.2 Very little of this analysis is consistently available for the devolved administrations or English
regions. ONS does however produce GVA in annual nominal terms for Scotland and the
other devolved administrations and regions, but with Extra-Regio (the offshore elements, see
Section 1) treated as a separate region.
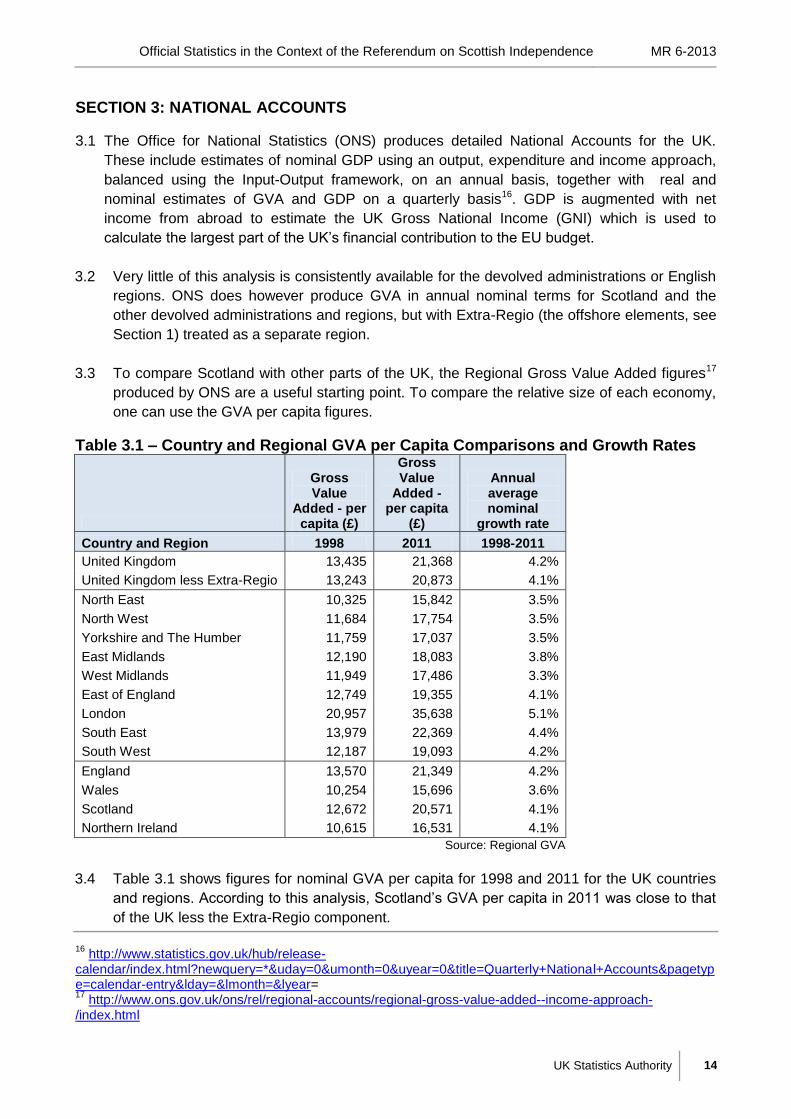
3.3 To compare Scotland with other parts of the UK, the Regional Gross Value Added figures17
produced by ONS are a useful starting point. To compare the relative size of each economy,
one can use the GVA per capita figures.
Table 3.1 – Country and Regional GVA per Capita Comparisons and Growth Rates
Gross Value
Added - per capita (£)
Gross Value
Added - per capita
(£)
Annual average nominal
growth rate
Country and Region 1998 2011 1998-2011
United Kingdom 13,435 21,368 4.2%
United Kingdom less Extra-Regio 13,243 20,873 4.1%
North East 10,325 15,842 3.5%
North West 11,684 17,754 3.5%
Yorkshire and The Humber 11,759 17,037 3.5%
East Midlands 12,190 18,083 3.8%
West Midlands 11,949 17,486 3.3%
East of England 12,749 19,355 4.1%
London 20,957 35,638 5.1%
South East 13,979 22,369 4.4%
South West 12,187 19,093 4.2%
England 13,570 21,349 4.2%
Wales 10,254 15,696 3.6%
Scotland 12,672 20,571 4.1%
Northern Ireland 10,615 16,531 4.1%
Source: Regional GVA
3.4 Table 3.1 shows figures for nominal GVA per capita for 1998 and 2011 for the UK countries
and regions. According to this analysis, Scotland‟s GVA per capita in 2011 was close to that
of the UK less the Extra-Regio component.
16
http://www.statistics.gov.uk/hub/release-calendar/index.html?newquery=*&uday=0&umonth=0&uyear=0&title=Quarterly+National+Accounts&pagetype=calendar-entry&lday=&lmonth=&lyear= 17
http://www.ons.gov.uk/ons/rel/regional-accounts/regional-gross-value-added--income-approach-/index.html
Official Statistics in the Context of the Referendum on Scottish Independence MR 6-2013
UK Statistics Authority 15
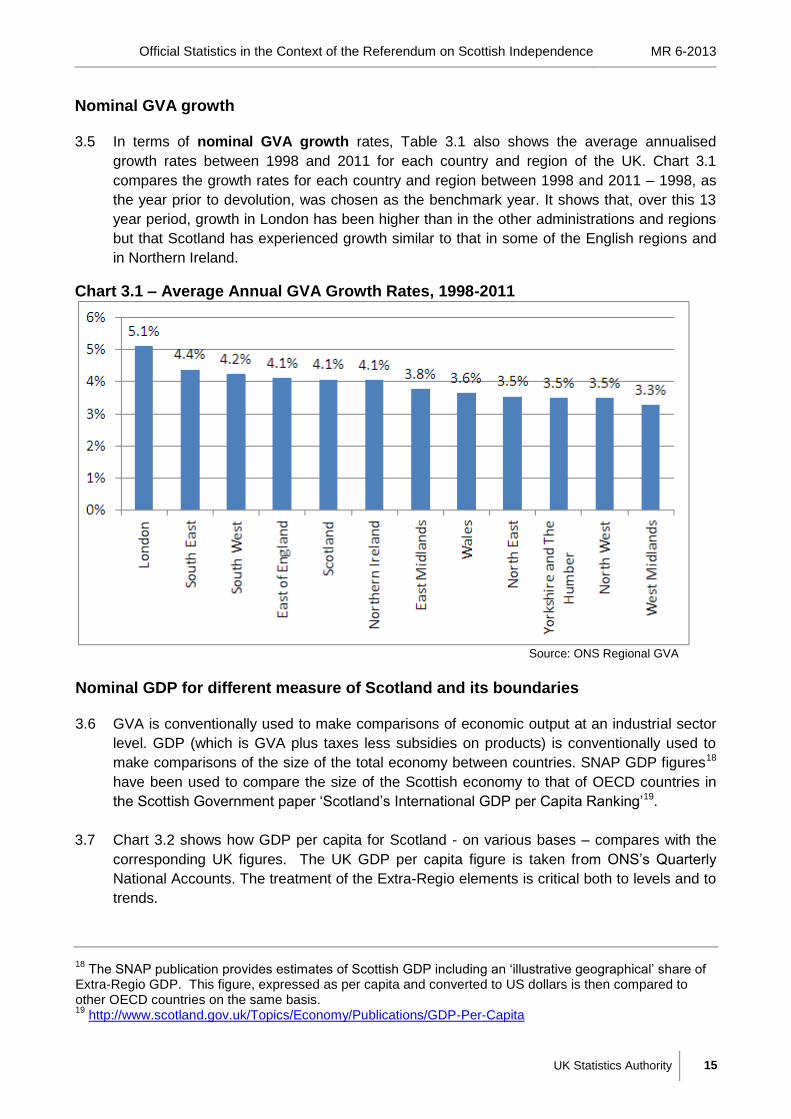
Nominal GVA growth 3.5 In terms of nominal GVA growth rates, Table 3.1 also shows the average annualised
growth rates between 1998 and 2011 for each country and region of the UK. Chart 3.1
compares the growth rates for each country and region between 1998 and 2011 – 1998, as
the year prior to devolution, was chosen as the benchmark year. It shows that, over this 13
year period, growth in London has been higher than in the other administrations and regions
but that Scotland has experienced growth similar to that in some of the English regions and
in Northern Ireland.
Chart 3.1 – Average Annual GVA Growth Rates, 1998-2011
Source: ONS Regional GVA
Nominal GDP for different measure of Scotland and its boundaries 3.6 GVA is conventionally used to make comparisons of economic output at an industrial sector
level. GDP (which is GVA plus taxes less subsidies on products) is conventionally used to
make comparisons of the size of the total economy between countries. SNAP GDP figures18
have been used to compare the size of the Scottish economy to that of OECD countries in
the Scottish Government paper „Scotland‟s International GDP per Capita Ranking‟19.
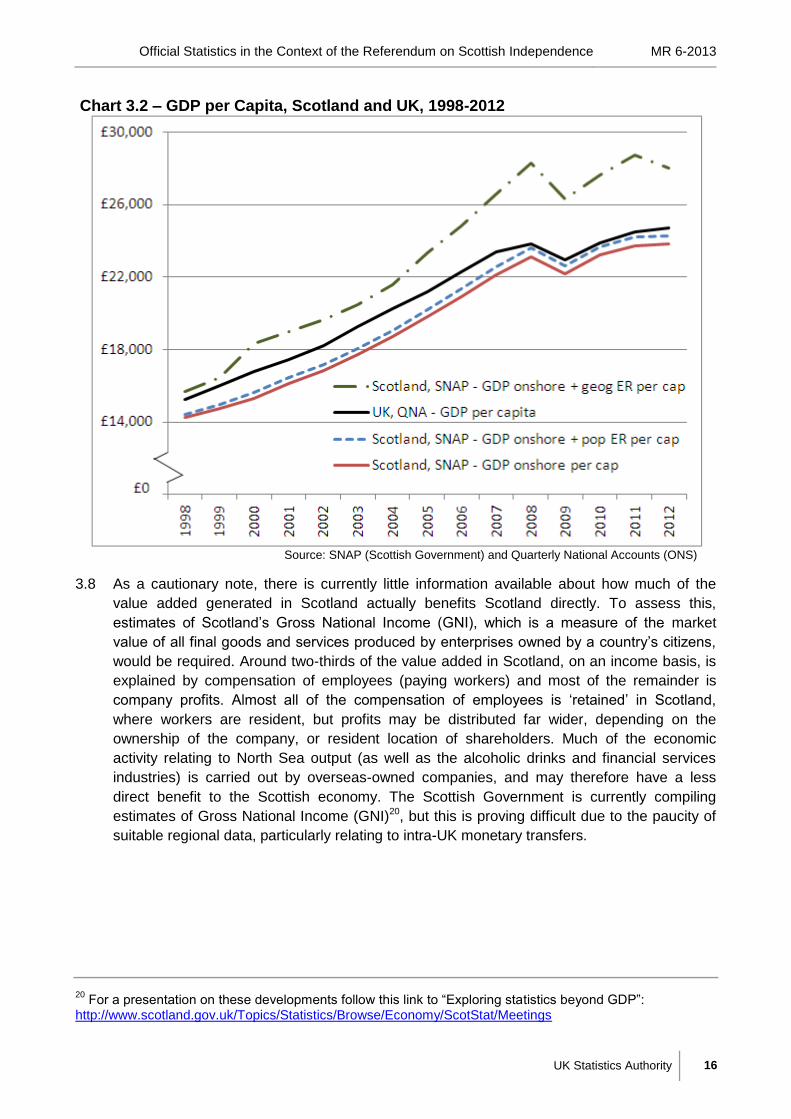
3.7 Chart 3.2 shows how GDP per capita for Scotland - on various bases – compares with the
corresponding UK figures. The UK GDP per capita figure is taken from ONS‟s Quarterly
National Accounts. The treatment of the Extra-Regio elements is critical both to levels and to
trends.
18
The SNAP publication provides estimates of Scottish GDP including an „illustrative geographical‟ share of Extra-Regio GDP. This figure, expressed as per capita and converted to US dollars is then compared to other OECD countries on the same basis. 19
http://www.scotland.gov.uk/Topics/Economy/Publications/GDP-Per-Capita
Official Statistics in the Context of the Referendum on Scottish Independence MR 6-2013
UK Statistics Authority 16
Chart 3.2 – GDP per Capita, Scotland and UK, 1998-2012
Source: SNAP (Scottish Government) and Quarterly National Accounts (ONS)
3.8 As a cautionary note, there is currently little information available about how much of the
value added generated in Scotland actually benefits Scotland directly. To assess this,
estimates of Scotland‟s Gross National Income (GNI), which is a measure of the market
value of all final goods and services produced by enterprises owned by a country‟s citizens,
would be required. Around two-thirds of the value added in Scotland, on an income basis, is
explained by compensation of employees (paying workers) and most of the remainder is
company profits. Almost all of the compensation of employees is „retained‟ in Scotland,
where workers are resident, but profits may be distributed far wider, depending on the
ownership of the company, or resident location of shareholders. Much of the economic
activity relating to North Sea output (as well as the alcoholic drinks and financial services
industries) is carried out by overseas-owned companies, and may therefore have a less
direct benefit to the Scottish economy. The Scottish Government is currently compiling
estimates of Gross National Income (GNI)20, but this is proving difficult due to the paucity of
suitable regional data, particularly relating to intra-UK monetary transfers.
20
For a presentation on these developments follow this link to “Exploring statistics beyond GDP”: http://www.scotland.gov.uk/Topics/Statistics/Browse/Economy/ScotStat/Meetings
Official Statistics in the Context of the Referendum on Scottish Independence MR 6-2013
UK Statistics Authority 17
Real-terms growth 3.9 For real-terms GDP growth (i.e. after removing inflation), statistics for the UK as a whole
are published in successive monthly releases each quarter (the GDP Preliminary Estimate,
the Second estimate of GDP, and the Quarterly National Accounts) and corresponding
statistics for Scotland are published in the Scottish Gross Domestic Product21 publication on
a quarterly basis. Strictly-speaking the latter figures are real-terms GVA estimates because
regional deflators for taxes and subsidies on products are not available; however, the
difference is likely to be minimal. Full sets of comparative statistics are not produced for other
devolved administrations or regions, although some experimental figures are available on a
quarterly basis for Northern Ireland22.
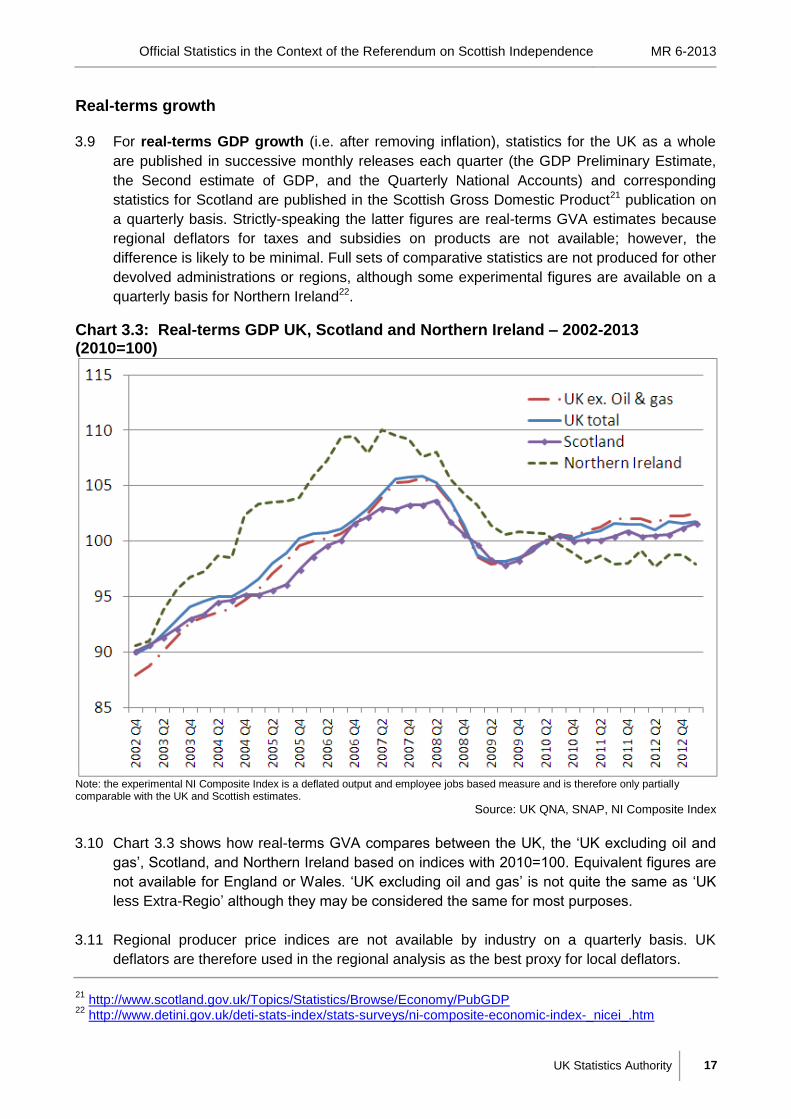
Chart 3.3: Real-terms GDP UK, Scotland and Northern Ireland – 2002-2013 (2010=100)
Note: the experimental NI Composite Index is a deflated output and employee jobs based measure and is therefore only partially comparable with the UK and Scottish estimates.
Source: UK QNA, SNAP, NI Composite Index
3.10 Chart 3.3 shows how real-terms GVA compares between the UK, the „UK excluding oil and
gas‟, Scotland, and Northern Ireland based on indices with 2010=100. Equivalent figures are
not available for England or Wales. „UK excluding oil and gas‟ is not quite the same as „UK
less Extra-Regio‟ although they may be considered the same for most purposes.
3.11 Regional producer price indices are not available by industry on a quarterly basis. UK
deflators are therefore used in the regional analysis as the best proxy for local deflators.
21
http://www.scotland.gov.uk/Topics/Statistics/Browse/Economy/PubGDP 22
http://www.detini.gov.uk/deti-stats-index/stats-surveys/ni-composite-economic-index-_nicei_.htm
Official Statistics in the Context of the Referendum on Scottish Independence MR 6-2013
UK Statistics Authority 18
3.12 We recognise that users23 would like to have two alternative sets of real-terms growth rates
for Scotland. First, as at present, for onshore activity only; and second, including the Extra-
Regio activity. The latter would enable direct comparisons to be made with the UK as a
whole but, in the absence of an agreed definition, any such statistics would require
speculative assumptions. Currently, commentators frequently quote growth rates on the
onshore basis alongside statements about the size of the economy on the total basis, which
can be misleading. Making both sets of data available as official statistics would enable users
to make valid comparisons on a consistent basis.
3.13 We were told by expert users that there was a demand for more information on Scotland‟s
economic and business cycles. Analysts would need to estimate these on both onshore and
total bases to fully understand the cycles. This would be of relevance if in future it was
proposed to set fiscal rules for Scotland (see Section 7). The Scottish Government‟s Fiscal
Commission Working Group has published an analysis of differences between the Scottish
and UK economic cycle24.
Sectoral statistics 3.14 Scotland‟s economic structure differs from the overall UK economy in a number of ways -
both in terms of composition and rates of growth. The relatively larger sectors in Scotland
include mining and quarrying (reflecting the auxiliary services to offshore mining), electricity
and gas supply (where Scotland is a net „exporter‟ to the rest of the UK), construction, and
health and social work activities (where Scotland‟s expenditure is relatively high).
3.15 The relatively smaller sectors include information and communication, professional and
technical services and financial services. Some sectors, such as the drinks industry, are
particularly important with respect to international export markets. Changing circumstances
in the wider world may also affect Scotland in a different way to the UK – positively or
negatively.
3.16 Scotland has a larger public sector in terms of expenditure and employment per capita than
that of the UK as a whole. A recent report by the Scottish Parliament Information Centre
(SPICE) titled “The Size of the Public Sector”25 draws on a range of official statistics. It looks
at three possible measures:
public spending as a percentage of GDP;
government consumption as a proportion of total consumption; and
public sector jobs as a proportion of all jobs.
3.17 All of these measures can be relevant to public debate on the subject. The third measure is
often used as general indicator of the relative size of the public sector and has the advantage
that it is not distorted by transfer payments or revenues.
23
This is mentioned, for example, in an article by the Centre for Public Policy for Regions (CPPR – “Measuring an independent Scotland‟s economic performance”- http://www.gla.ac.uk/media/media_275906_en.pdf 24
FCWG paper - http://www.scotland.gov.uk/Resource/0041/00414366.pdf 25
http://www.scottish.parliament.uk/ResearchBriefingsAndFactsheets/S4/SB_13-36.pdf

Official Statistics in the Context of the Referendum on Scottish Independence MR 6-2013
UK Statistics Authority 19
3.18 There are some differences in the definition of the public sector between Scotland and the
rest of the UK which, whilst small in terms of overall totals, can be relevant to some analyses:
for example, Scottish Water is a public corporation in Scotland whereas the corresponding
services are provided by the private sector elsewhere in the UK. Colleges are classified
within the public sector in Scotland, but not in England. And more health services are
provided by the private sector in the rest of the UK than in Scotland.
3.19 In preparing this report, we were told by experts to whom we spoke that more data on how
the structure of the Scottish economy is changing, and reacting to policy change, would be of
value. An example would be whether there are differences in trends in output and
employment between small, medium and large companies. Users have also identified a need
for more analysis on the location of company head-quarters and where companies have sites
in more than one country and region within the UK.
Geographic variation 3.20 GVA per capita is not greatly different between Scotland and the UK as a whole if the Extra-
Regio economy is excluded. On an index basis, if GVA per capita for the UK (less Extra-
Regio) is set at 100 in 2010 (the most recent year for which data are available from the ONS
Regional GVA estimates) then onshore Scotland is at 98.6. However, GVA per capita varies
substantially within the sub-regions of Scotland, and similarly for the sub-regions of the UK
as a whole26.
Summary of advice
To make broad comparisons between the four UK administrations and between regions,
the ONS publication Regional Gross Value Added (GVA) is a valuable source. It provides
GVA (and GVA per head) figures by region and sub-region and by industrial groups.
However, these statistics do have some limitations, discussed in this section.
For more precise comparisons between Scotland and the UK as a whole, the experimental
estimates from the Scottish National Accounts Project (SNAP) publication may be helpful.
In this publication, the Scottish Government estimates quarterly GVA and GDP figures in
nominal terms. This analysis extends the GVA estimates to full GDP as well as
apportioning Extra-Regio to Scotland on a population and geographical basis. GDP figures,
rather than GVA, are conventionally used for international comparisons. However,
equivalent figures are not available for England, Wales or Northern Ireland separately.
For analysis in real-terms, i.e. after removing inflation, the Scottish Government produces
real Gross Domestic Product (GDP) by industry on a quarterly basis. These figures are
used to measure growth in the economy and are presented in the form of indices. These
estimates are for Scottish onshore activity only, whereas the ONS publishes figures for the
UK including Extra-Regio. The Northern Ireland Executive produces a similar set of figures
on an experimental basis. Separate figures for England or Wales are not available.
26
This can be demonstrated by the ONS Regional GVA estimates which provide sub-national and regional GVA per capita figures at both NUTS2 and NUTS3 levels.
Official Statistics in the Context of the Referendum on Scottish Independence MR 6-2013
UK Statistics Authority 20
Advice to the statistical service In preparing this report, we were told that more data on the structure of the Scottish
economy, and how it is changing, would be of value. Users have also identified a need for
more analysis on ownership, particularly regarding company head-quarters and where
companies have sites in more than one country and region within the UK.
No official Gross National Income (GNI) estimates are currently produced for Scotland.
Users have identified this as an important gap in the range of economic statistics available
for Scotland.
Official Statistics in the Context of the Referendum on Scottish Independence MR 6-2013
UK Statistics Authority 21
SECTION 4: PUBLIC EXPENDITURE
4.1 There are two main sources of official statistics for public sector outturn expenditure for
Scotland. Firstly, HM Treasury‟s publication Public Expenditure Statistical Analysis27
(PESA) incorporates a Country and Regional Analysis (CRA) which provides data on
identifiable expenditure on services – that is expenditure that can be directly related to a
country or region. UK Government Departments and the Devolved Administrations work
closely with HM Treasury in peer reviewing the CRA analysis. And secondly, the Scottish
Government‟s report, Government Expenditure and Revenue Scotland28 (GERS), which
provides additional analysis for Scotland by allocating a share of „non-identifiable
expenditure‟ and „non-cash expenditure‟ to Scotland to produce estimates of Scottish Total
Managed Expenditure.
4.2 It should be noted that:
Non-identifiable expenditure is that which is not allocated by HM Treasury to
countries or regions in the UK because it is considered to benefit everyone equally. It
includes some „collective services‟ such as defence and overseas aid, and some
expenditure made for the benefit of the UK as a whole, such as public sector debt
interest payments.
Non-cash expenditure includes items of expenditure where no money has changed
hands. This includes items such as public sector depreciation.
Total Managed Expenditure refers to the total of all three classes of expenditure. This
is the definition of public expenditure used in the Public Sector Finances29 for the fiscal
balance calculations and is consistent with National Accounting definitions.
4.3 The PESA publication is a good source for making comparisons (between UK
administrations and between regions) of identifiable expenditure and associated per capita
rates. But such comparisons do not take account of the non-identifiable and some non-cash
elements, as defined above. For comparisons of Total Managed Expenditure, the GERS
publication provides estimates for Scotland alongside those for the UK on the same basis.
Both the GERS and PESA publications are fully consistent with public sector finances
definitions but GERS covers the whole of total managed expenditure, including those
elements which are treated as non-identifiable and depreciation. Some historic figures are
available for Northern Ireland using broadly similar methods30.
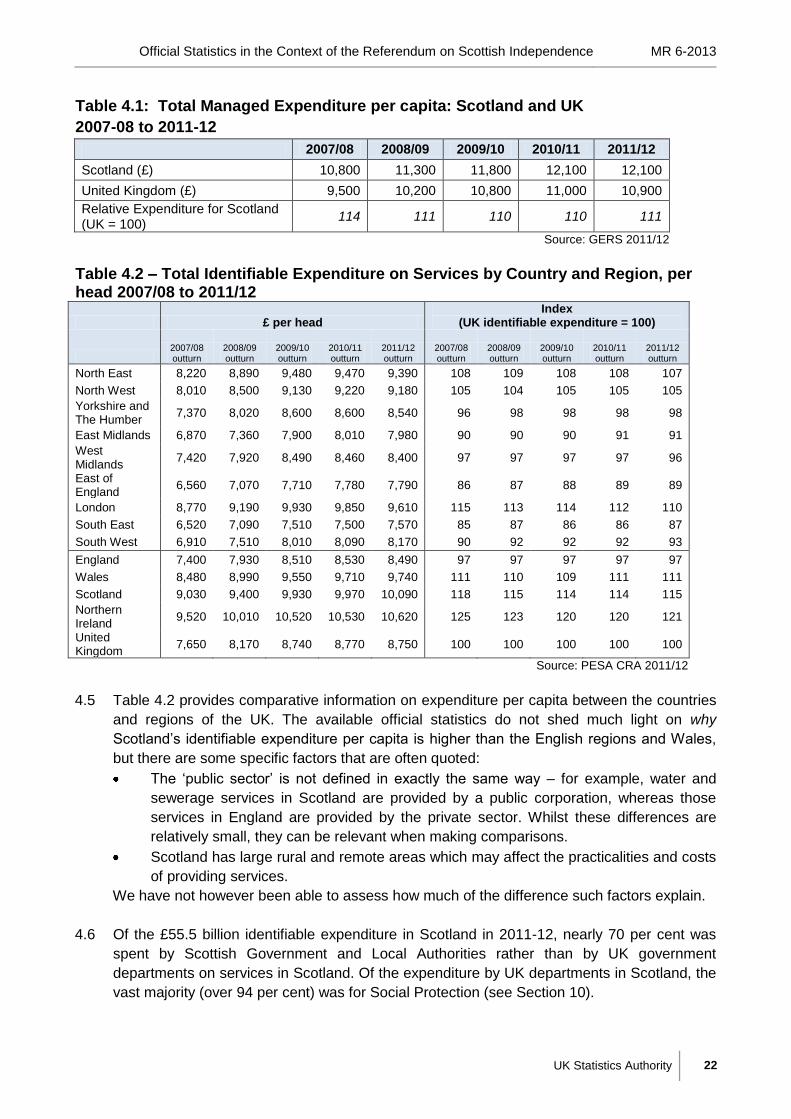
4.4 Looking at the headline figures (Table 4.1), public expenditure per capita in Scotland is
higher than the UK average. Total Managed Expenditure figures are not available for
England and Wales, but historic estimates are available for Northern Ireland.
27
https://www.gov.uk/government/publications?departments%5B%5D=hm-treasury&publication_filter_option=statistics 28
http://www.scotland.gov.uk/Topics/Statistics/Browse/Economy/GERS 29
See for example http://www.ons.gov.uk/ons/rel/psa/public-sector-finances/index.html 30
http://www.dfpni.gov.uk/northern-ireland-net-fiscal-balance-report-09-10-10-11.pdf
Official Statistics in the Context of the Referendum on Scottish Independence MR 6-2013
UK Statistics Authority 22
Table 4.1: Total Managed Expenditure per capita: Scotland and UK
2007-08 to 2011-12
2007/08 2008/09 2009/10 2010/11 2011/12
Scotland (£) 10,800 11,300 11,800 12,100 12,100
United Kingdom (£) 9,500 10,200 10,800 11,000 10,900
Relative Expenditure for Scotland (UK = 100)
114 111 110 110 111
Source: GERS 2011/12
Table 4.2 – Total Identifiable Expenditure on Services by Country and Region, per head 2007/08 to 2011/12
£ per head Index
(UK identifiable expenditure = 100)
2007/08 outturn
2008/09 outturn
2009/10 outturn
2010/11 outturn
2011/12 outturn
2007/08 outturn
2008/09 outturn
2009/10 outturn
2010/11 outturn
2011/12 outturn
North East 8,220 8,890 9,480 9,470 9,390 108 109 108 108 107
North West 8,010 8,500 9,130 9,220 9,180 105 104 105 105 105
Yorkshire and The Humber
7,370 8,020 8,600 8,600 8,540 96 98 98 98 98
East Midlands 6,870 7,360 7,900 8,010 7,980 90 90 90 91 91
West Midlands
7,420 7,920 8,490 8,460 8,400 97 97 97 97 96
East of England
6,560 7,070 7,710 7,780 7,790 86 87 88 89 89
London 8,770 9,190 9,930 9,850 9,610 115 113 114 112 110
South East 6,520 7,090 7,510 7,500 7,570 85 87 86 86 87
South West 6,910 7,510 8,010 8,090 8,170 90 92 92 92 93
England 7,400 7,930 8,510 8,530 8,490 97 97 97 97 97
Wales 8,480 8,990 9,550 9,710 9,740 111 110 109 111 111
Scotland 9,030 9,400 9,930 9,970 10,090 118 115 114 114 115
Northern Ireland
9,520 10,010 10,520 10,530 10,620 125 123 120 120 121
United Kingdom
7,650 8,170 8,740 8,770 8,750 100 100 100 100 100
Source: PESA CRA 2011/12
4.5 Table 4.2 provides comparative information on expenditure per capita between the countries
and regions of the UK. The available official statistics do not shed much light on why
Scotland‟s identifiable expenditure per capita is higher than the English regions and Wales,
but there are some specific factors that are often quoted:
The „public sector‟ is not defined in exactly the same way – for example, water and
sewerage services in Scotland are provided by a public corporation, whereas those
services in England are provided by the private sector. Whilst these differences are
relatively small, they can be relevant when making comparisons.
Scotland has large rural and remote areas which may affect the practicalities and costs
of providing services.
We have not however been able to assess how much of the difference such factors explain.
4.6 Of the £55.5 billion identifiable expenditure in Scotland in 2011-12, nearly 70 per cent was
spent by Scottish Government and Local Authorities rather than by UK government
departments on services in Scotland. Of the expenditure by UK departments in Scotland, the
vast majority (over 94 per cent) was for Social Protection (see Section 10).
Official Statistics in the Context of the Referendum on Scottish Independence MR 6-2013
UK Statistics Authority 23
4.7 In 2011-12, Social Protection accounted for over a third (34 per cent) of public sector total
managed expenditure in Scotland (similar to the UK average); Health accounted for 17 per
cent (and the same proportion in the UK); and Education and Training a further 12 per cent
(again close to the UK average). These three categories which together account for nearly
two-thirds of total managed expenditure in Scotland, are examined further in Sections 10, 11
and 12 below. UK and sub-UK comparisons are made in these sections.
Allocation of budgets to Scotland 4.8 The PESA and GERS publications provide statistics about public expenditure but not about
how Scotland‟s overall budget is determined. The UK Government currently collects the
majority of UK taxes and allocates Scotland a „block grant‟. Annual changes to this grant are
calculated by the Barnett Formula31 under which the Scottish, Welsh and Northern Ireland
administrations receive a population-based proportion of changes in planned spending on
comparable Government services in England (or in Great Britain in some cases)32. It is
important to note that this population-share formula determines the changes to each
devolved administration‟s spending allocation, it does not determine the total allocation.
These funding arrangements have been in place since 1979 and the current allocations
reflect the accumulation of historic changes. Thus in practice official statistics play a small
but specific role in determining Scotland‟s spending allocation – through the population share
of changes.
Summary of advice
For country and regional comparisons of identifiable expenditure on services HM
Treasury‟s Country and Regional Analysis (CRA) from the annual publication Public
Expenditure Statistical Analysis (PESA) gives figures separately for the devolved
administrations and the English regions. This analysis relates only to identifiable
expenditure on services.
The Scottish Government‟s report, Government Expenditure and Revenue Scotland33
(GERS), provides additional analysis for Scotland by allocating a share of „non-identifiable
expenditure‟ and „non-cash expenditure‟ to Scotland to produce estimates of Scottish Total
Managed Expenditure. These are consistent with the UK Public Sector Finance publication.
The GERS publication and the CRA analysis only provide information on outturn
expenditure (i.e. what has actually been spent) and not on how the budget figure was
determined in the first place. Government departments are assigned their budgets by HM
Treasury, and changes to the budgets of the devolved administrations are mostly derived
on the basis of a formula (see paragraph 4.8).
Currently there is no published official analysis of the relative „need‟ or „demand‟ for public
expenditure.
31
HM Treasury‟s Statement of Funding Policy is the authoritative source for how the formula works http://webarchive.nationalarchives.gov.uk/+/http://www.hm-treasury.gov.uk/d/sr2010_fundingpolicy.pdf 32
Paragraph 4.3 of the Statement of Funding Policy, link above. 33
http://www.scotland.gov.uk/Topics/Statistics/Browse/Economy/GERS
Official Statistics in the Context of the Referendum on Scottish Independence MR 6-2013
UK Statistics Authority 24
SECTION 5: TRADE
5.1 There are a number of sets of official statistics available on UK trade, mainly produced by
HM Revenue and Customs (HMRC) and the Office for National Statistics (ONS). These are
used collectively to produce the ONS monthly publication UK Trade34 and in the UK Balance
of Payments. These sources include:
International Trade in Goods data, published by HMRC as the „Overseas Trade
Statistics‟35
Trade in Services data, published by ONS within the National Accounts, collected via
the International Trade in Services survey (ITIS)36
Travel data relating to expenditure on goods and services by UK residents and non-
residents travelling abroad via the International Passenger Survey (IPS)
Estimates for the total value of missing trade
Other sources including the Bank of England and Civil Aviation Authority.
5.2 However, the HMRC Regional Trade in Goods Statistics37 (which only covers goods and not
the services sector), is the only official source of regional trade estimates, covering all
countries and regions of the UK.
5.3 The concept of Scottish trade statistics - as distinct from Scotland‟s share of the UK
overseas trade statistics - raises some complex definitional questions, not least whether and
how to record flows of goods and services between Scotland and other parts of the UK.
Given the complex geographic footprint of many large companies and institutions, there are
real challenges both in defining such flows and then in capturing data about them. There is
thus currently no complete or consistent set of trade statistics, covering both imports and
exports on a consistent basis, available for Scotland. There are, nonetheless, some useful
official statistics relating to trade flows into and out of Scotland in various official statistics
publications, together with some modelled analysis derived from these sources. Some of the
main sources are mentioned elsewhere in this section.
5.4 The problems associated with measuring flows of goods and services into and out of
Scotland need to be recognised by commentators: companies may not keep sub-UK records
for flows of goods – they are under no obligation to do so; export goods may pass through
several hands – and several places - before leaving the UK, so may not leave the UK shore
from Scotland even if that is where they originated; goods produced in Scotland may be used
in the UK in the production of a secondary good prior to export, and the final destination may
not be known by the producer. Whilst tracking trade in goods is complex, trade in services
can be harder still to associate clearly with a geographical footprint, and is becoming more so
with increased use of the internet and other technological developments.
5.5 HM Revenue and Customs publishes estimates of Scottish exports and imports of
manufactured goods on a quarterly basis in its Regional Trade in Goods Statistics reports.
These data are compiled by linking trade data collected by HMRC with postcode data from the
34
http://www.ons.gov.uk/ons/taxonomy/index.html?nscl=Balance+of+Payments 35
http://www.hmrc.gov.uk/statistics/trade-statistics.htm 36
http://www.ons.gov.uk/ons/publications/all-releases.html?definition=tcm%3A77-21578 37
http://www.hmrc.gov.uk/statistics/trade-statistics.htm
Official Statistics in the Context of the Referendum on Scottish Independence MR 6-2013
UK Statistics Authority 25
Office for National Statistics (ONS) to obtain the region in which the VAT registered business
(importer or exporter) is based. Because the trade is regionalised according to the location of
the VAT registered business, some of the trade may be allocated to the region where the head
office of the business is located rather than the place of manufacture. The definition of goods
uses the Standard International Trade Classification, Rev. 4 (SITC), rather than the Standard
Industrial Classification used elsewhere in the National Accounts and Balance of Payments
estimates. The net effect of this is to produce some inconsistency between different sources
(see Chart 5.1).
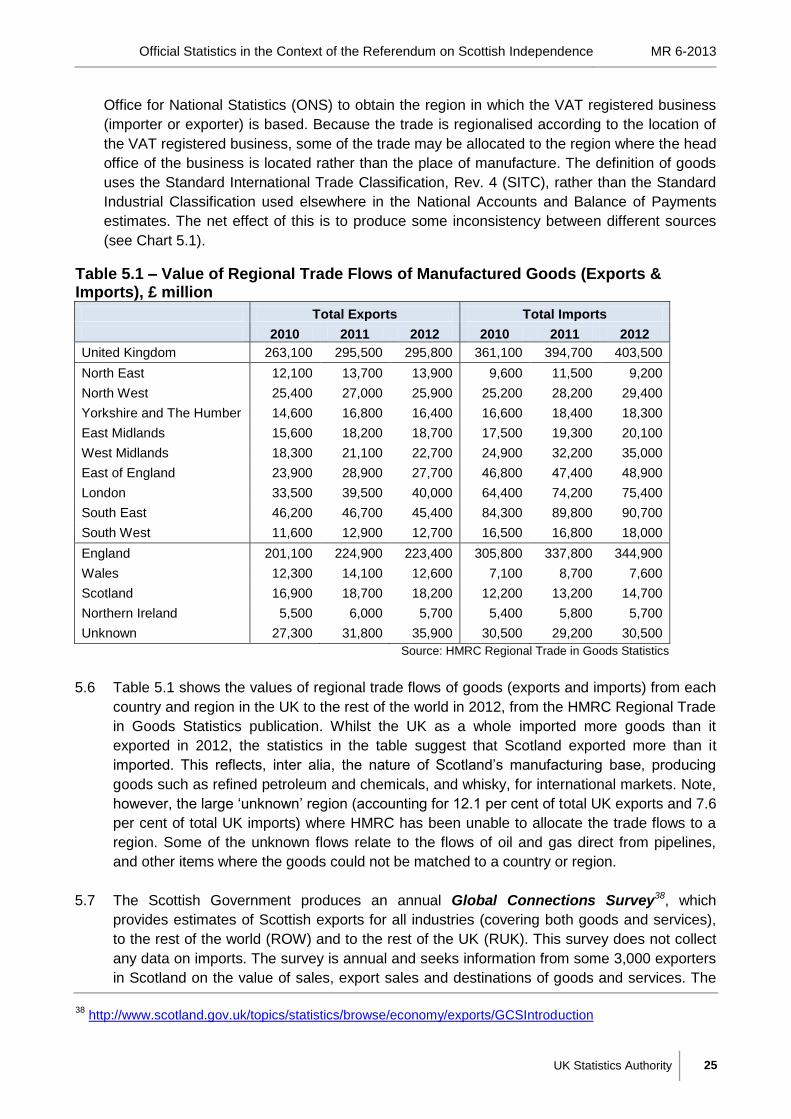
Table 5.1 – Value of Regional Trade Flows of Manufactured Goods (Exports & Imports), £ million
Total Exports Total Imports
2010 2011 2012 2010 2011 2012
United Kingdom 263,100 295,500 295,800 361,100 394,700 403,500
North East 12,100 13,700 13,900 9,600 11,500 9,200
North West 25,400 27,000 25,900 25,200 28,200 29,400
Yorkshire and The Humber 14,600 16,800 16,400 16,600 18,400 18,300
East Midlands 15,600 18,200 18,700 17,500 19,300 20,100
West Midlands 18,300 21,100 22,700 24,900 32,200 35,000
East of England 23,900 28,900 27,700 46,800 47,400 48,900
London 33,500 39,500 40,000 64,400 74,200 75,400
South East 46,200 46,700 45,400 84,300 89,800 90,700
South West 11,600 12,900 12,700 16,500 16,800 18,000
England 201,100 224,900 223,400 305,800 337,800 344,900
Wales 12,300 14,100 12,600 7,100 8,700 7,600
Scotland 16,900 18,700 18,200 12,200 13,200 14,700
Northern Ireland 5,500 6,000 5,700 5,400 5,800 5,700
Unknown 27,300 31,800 35,900 30,500 29,200 30,500
Source: HMRC Regional Trade in Goods Statistics
5.6 Table 5.1 shows the values of regional trade flows of goods (exports and imports) from each
country and region in the UK to the rest of the world in 2012, from the HMRC Regional Trade
in Goods Statistics publication. Whilst the UK as a whole imported more goods than it
exported in 2012, the statistics in the table suggest that Scotland exported more than it
imported. This reflects, inter alia, the nature of Scotland‟s manufacturing base, producing
goods such as refined petroleum and chemicals, and whisky, for international markets. Note,
however, the large „unknown‟ region (accounting for 12.1 per cent of total UK exports and 7.6
per cent of total UK imports) where HMRC has been unable to allocate the trade flows to a
region. Some of the unknown flows relate to the flows of oil and gas direct from pipelines,
and other items where the goods could not be matched to a country or region.
5.7 The Scottish Government produces an annual Global Connections Survey38, which
provides estimates of Scottish exports for all industries (covering both goods and services),
to the rest of the world (ROW) and to the rest of the UK (RUK). This survey does not collect
any data on imports. The survey is annual and seeks information from some 3,000 exporters
in Scotland on the value of sales, export sales and destinations of goods and services. The
38
http://www.scotland.gov.uk/topics/statistics/browse/economy/exports/GCSIntroduction

Official Statistics in the Context of the Referendum on Scottish Independence MR 6-2013
UK Statistics Authority 26
survey results are augmented by data from other sources such as the International Trade in
Services Survey39 (ITIS), and some information directly from trade organisations (such as the
Committee for Scottish Bankers). Oil exported directly by pipeline from the UK Continental
Shelf is not included in these figures.
5.8 The annual Input-Output tables40, produced by the Scottish Government, derive the
estimated value of imports as a balancing item. They are estimated by subtracting domestic
production and domestic exports from total domestic consumption. The credibility of these,
inevitably broad, estimates is then checked by cross-referencing to other imports data
(HMRC and UK Input-Output tables). Imports to Scotland specifically from the rest of the UK
are harder to measure, and the best that is likely to be available is a broad approximation
based on statistical modelling within the Input-Output framework.
Table 5.2 – Comparisons of Official Statistics on Scottish Exports to the Rest of the World, £ billion
2002 2003 2004 2005 2006 2007 2008 2009 2010 2011 2012 Exports to Rest of World - Global Connections Survey
19.5 18.7 18.3 17.9 18.5 19.5 21.3 21.6 22.4 23.9 -
Exports to Rest of World - Scottish Input-Output Tables
16.5 16.0 15.7 15.3 15.7 17.2 19.1 19.2 - - -
Manufactured Exports to Rest of World - Global Connections Survey
14.4 13.3 12.4 11.5 11.6 12.2 13.2 12.8 13.5 14.7 -
Manufactured Exports to Rest of World - Scottish Input-Output Tables
12.2 11.3 10.8 10.0 10.2 11.0 12.2 11.9 - - -
Manufactured Exports to Rest of World - HMRC Regional Trade in Goods
12.7 13.5 13.7 14.3 13.7 16.9 18.7 18.2
Sources: various as detailed
39
http://www.ons.gov.uk/ons/rel/itis/international-trade-in-services/2011/stb-itis-2011.html 40
http://www.scotland.gov.uk/Topics/Statistics/Browse/Economy/input-output

Official Statistics in the Context of the Referendum on Scottish Independence MR 6-2013
UK Statistics Authority 27
Chart 5.1 – Comparison of Official Statistics on Scottish Exports of Goods to the Rest of the World - £ billion
Sources: various as detailed
5.9 Table 5.2 and chart 5.1 show how estimates of Scottish manufactured exports to the rest of
the world differ between publications both in terms of scale and timeliness of provision.
These differences are not explained in official statistics publications. The Input-Output
analysis is shown in basic prices (i.e. with production taxes removed), whereas the GCS
presents exports at market prices i.e. the price paid by the purchaser. The HMRC figures are
generally higher than the Scottish onshore-only estimates as they include some direct
exports of oil and gas where an oil platform is effectively operating as a port. The Global
Connections Survey does not capture these flows.
5.10 The guidance notes41 to companies completing the Global Connections Survey clarify the
position on exports to the rest of the UK including the Continental Shelf (such as goods and
services to oil rigs). “Customers based in the rest of the UK are those that are not normally
resident in Scotland. Direct transactions with companies and individuals in the rest of the UK,
or sales to residents of another part of the UK while they are visiting Scotland are both
counted. Exports to the UK Continental Shelf should be treated as exports to the rest of the
UK as this survey relates to onshore activities.” This is consistent with the Onshore definition
of Scotland as discussed in section 1.
41
http://www.scotland.gov.uk/topics/statistics/browse/economy/exports/GCSIntroduction
Official Statistics in the Context of the Referendum on Scottish Independence MR 6-2013
UK Statistics Authority 28
Scotland’s Balance of Trade and Balance of Payments
5.11 The UK Balance of Payments (BoP) measures the economic transactions between UK
residents and the rest of the world. It also draws a series of balances between inward and
outward transactions, provides an overall net flow of transactions between UK residents and
the rest of the world, and reports on how that flow is funded. These economic flows include:
exports and imports of goods and services; income flows, such as dividends and interest
earned by non-residents on investments and by UK residents investing abroad; financial
flows such as investment in shares, debt securities and loans; and transfers, which are
offsetting entries to any one-sided transaction listed above, such as foreign aid and funds
brought by migrants to the UK.
5.12 Constructing a Balance of Payments for Scotland is complex, and not currently available as
official statistics. Some users to whom we have spoken, have argued that this is a notable
gap in the availability of official economic statistics for Scotland. However, some elements
are available from official sources such as the Balance of Trade, and other elements could
be estimated using suitable apportionment methods.
5.13 The only source of Balance of Trade estimates for Scotland is the Scottish Input-Output
tables, but these relate only to trade in goods and services from onshore Scotland. Flows of
oil and gas, directly from the UK Continental Shelf will not be included. It is clear that care
needs to be taken with the interpretation of these results.
5.14 This highlights a further problem concerning the treatment of the UK Continental Shelf which
is conventionally shown as being within „the rest of the UK‟. To provide reliable estimates of
imports and exports to and from Scotland (including Scottish Extra-Regio) would require the
construction of a “satellite” account for the UK Continental Shelf. We understand that
research in this area is being undertaken by the Scottish Government, but is still at a very
early development stage.
Summary of advice For estimates of trends in exports from Scotland to the rest of the UK and the rest of the
World, the Global Connections Survey42 provides annual estimates back to 2002. This survey
covers exports of both goods and services.
For Scottish Balance of Trade estimates, i.e. for comparing exports and imports between
Scotland and the rest of UK and the rest of the world on the same basis, the Scottish
Government‟s annual Input-Output tables43 provide some data.
For real-terms manufactured exports, the Scottish Government‟s Index of Manufactured
Exports (IME)44 is a valuable source.
The Scottish National Accounts Project (SNAP)45 quarterly national accounts provide up to
date estimates of total imports and exports to and from onshore Scotland in current prices. 42
http://www.scotland.gov.uk/Topics/Statistics/Browse/Economy/Exports/GCSIntroduction 43
http://www.scotland.gov.uk/Topics/Statistics/Browse/Economy/Input-Output/Downloads 44
http://www.scotland.gov.uk/Topics/Statistics/Browse/Economy/Exports/IMEIntroduction
Official Statistics in the Context of the Referendum on Scottish Independence MR 6-2013
UK Statistics Authority 29
These are based on a mix of survey and model-based estimates and are consistent with the
Scottish annual Input-Output tables and multipliers publication.
All these published statistics relate to onshore Scotland. This could lead to some
misunderstanding if not made clear. For example, if an Aberdeen-based company exports
goods or services to a platform in the North Sea, this would be counted as an export to the rest
of the UK in the Global Connections Survey and in the Input-Output tables; and oil piped from
the North Sea to the Scottish mainland would be an import from the rest of the UK. But if an
economic territory concept were employed (see Section 1), there would be neither an import
nor an export recorded.
Advice to the statistical service
In preparing this report, users told us that the lack of good quality inter-regional trade data is a
notable weakness in regional economic statistics, and that regional and inter-regional models
rely too heavily on estimates and not real data. This is a long term challenge for official
statistics but in the shorter term it serves as a warning to users to be cautious in basing
statements on estimates of this kind46.
45
http://www.scotland.gov.uk/Topics/Statistics/Browse/Economy/snap 46
The Scotsman newspaper carried an article in February 2013 called „unreliable numbers don‟t add up‟ which readers may find helpful http://www.scotsman.com/the-scotsman-2-7475/opinion/comment/peter-jones-unreliable-numbers-don-t-add-up-1-2798161
Official Statistics in the Context of the Referendum on Scottish Independence MR 6-2013
UK Statistics Authority 30
SECTION 6: OIL AND GAS
6.1 In the context of the referendum debate, the way oil revenues are handled in official statistics
needs to be understood. Many aspects of the debate have drawn on statistics from the
GERS publication (see 1.7), in particular the analysis of Scotland‟s fiscal balance when a
geographical share of the North Sea revenues is included.
6.2 Official statistics relating to the oil and gas industry are available from various government
departments, reflecting their particular engagement with the sector. However, much of the
existing economic analysis also draws on data directly from companies in the industry and on
academic research. Some of the academic research has also been included or referenced in
the official statistics publications, where information required by users is not currently
available as official statistics. There are thus a lot of unofficial estimates in circulation from
many and mixed sources.
6.3 The various official statistics relating to oil and gas production, value added, and tax
revenues, are produced respectively by the Department of Energy and Climate Change
(DECC), ONS, and HMRC. DECC produces detailed production figures by individual oilfield
on a monthly basis47. ONS produces tax revenue figures48 on a National Accounting basis for
Petroleum Revenue Tax (PRT) and licence fees and royalties on a quarterly basis but does
not publish disaggregated statistics for North Sea Corporation Tax. HMRC publishes North
Sea Corporation Tax on an annual (financial year) basis49, and can supply quarterly data on
request. ONS also produces quarterly profits data from the oil and gas industries as part of
their profitability publication – these data are also available on request.
6.4 There is no single agreed method for allocating oil revenues to the UK administrations. This
means that no official figures are available at a sub-UK level. However, approximation
methods have been used by academic researchers 50 to allocate, for the purposes of
statistical analysis, a share of oil production and tax revenues to Scotland. This allocation
has been reflected in official statistics publications of the Scottish Government.
6.5 The GERS publication has a chapter devoted to oil revenues and contains official estimates
of the Scottish share of tax revenues from the sector. Quarterly estimates from 1998 of the
Scottish share of total oil revenues are available from the SNAP tables (see 1.7). For long
term estimates of GDP51 and how oil-related tax revenues relate to Scotland‟s fiscal balance
calculations52, experimental estimates are available on the SNAP website.
6.6 Many of these oil-related statistics are quoted in the media and in the Scottish and UK
Parliaments. There is increasing demand for more analysis of this kind. The assumptions
used in the SNAP and GERS publications are well documented. But users have indicated to
47
https://www.og.decc.gov.uk/pprs/full_production.htm 48
PSAT analysis – not officially published, but available on request 49
http://www.hmrc.gov.uk/statistics/prt.htm (See table 11.11) 50
See for example papers by Professor Alex Kemp, Aberdeen University, “The Hypothetical Scottish Shares of Revenues and Expenditures from the UK Continental Shelf 2000-2013” http://www.scotland.gov.uk/Resource/0039/00390421.pdf 51
http://www.scotland.gov.uk/Topics/Statistics/Browse/Economy/SNAP/expstats/aggregates/LRGDP2012Q3 52
http://www.scotland.gov.uk/Topics/Statistics/Browse/Economy/GERS/RelatedAreas/LRfiscalbalances2013
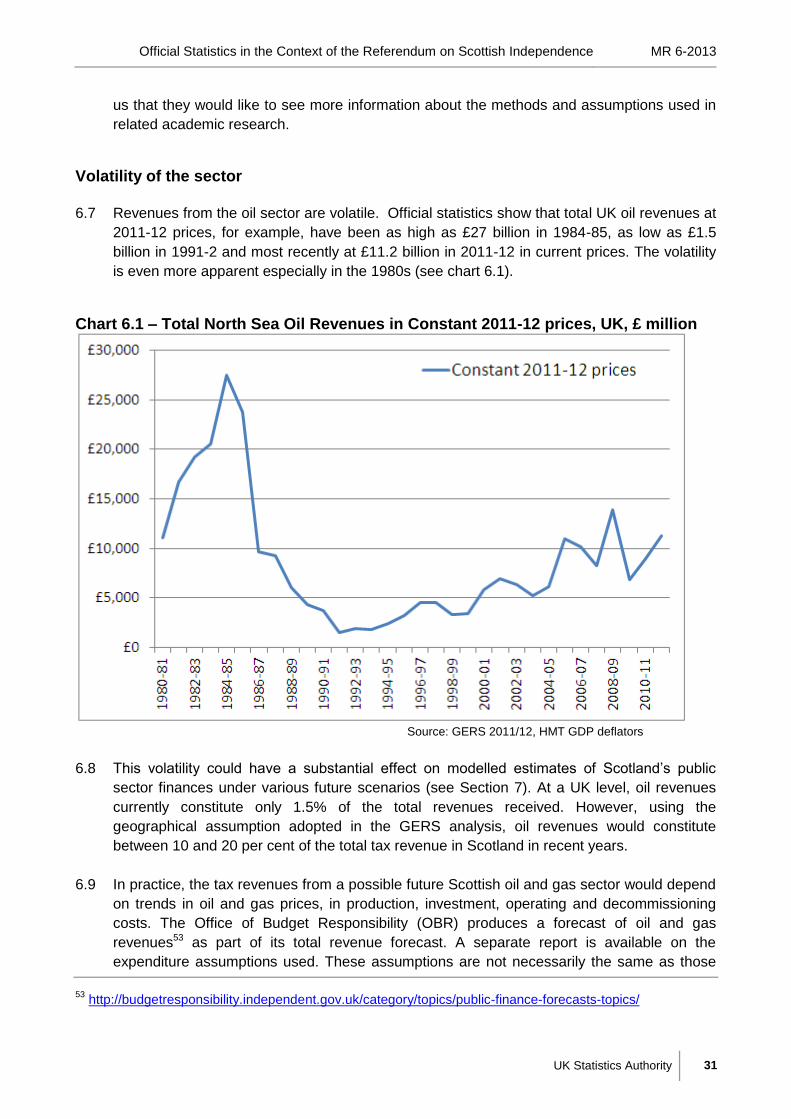
Official Statistics in the Context of the Referendum on Scottish Independence MR 6-2013
UK Statistics Authority 31
us that they would like to see more information about the methods and assumptions used in
related academic research.
Volatility of the sector
6.7 Revenues from the oil sector are volatile. Official statistics show that total UK oil revenues at
2011-12 prices, for example, have been as high as £27 billion in 1984-85, as low as £1.5
billion in 1991-2 and most recently at £11.2 billion in 2011-12 in current prices. The volatility
is even more apparent especially in the 1980s (see chart 6.1).
Chart 6.1 – Total North Sea Oil Revenues in Constant 2011-12 prices, UK, £ million
Source: GERS 2011/12, HMT GDP deflators
6.8 This volatility could have a substantial effect on modelled estimates of Scotland‟s public
sector finances under various future scenarios (see Section 7). At a UK level, oil revenues
currently constitute only 1.5% of the total revenues received. However, using the
geographical assumption adopted in the GERS analysis, oil revenues would constitute
between 10 and 20 per cent of the total tax revenue in Scotland in recent years.
6.9 In practice, the tax revenues from a possible future Scottish oil and gas sector would depend
on trends in oil and gas prices, in production, investment, operating and decommissioning
costs. The Office of Budget Responsibility (OBR) produces a forecast of oil and gas
revenues53 as part of its total revenue forecast. A separate report is available on the
expenditure assumptions used. These assumptions are not necessarily the same as those
53
http://budgetresponsibility.independent.gov.uk/category/topics/public-finance-forecasts-topics/
Official Statistics in the Context of the Referendum on Scottish Independence MR 6-2013
UK Statistics Authority 32
adopted in academic studies and none of these forecasts are official statistics, so the user
will need both to establish what assumptions have been made and be clear about that in
using such forecasts in public debate.
6.10 The Office for National Statistics (ONS) has estimated the monetary value of untapped
reserves to the Treasury in the paper “Monetary Valuation of UK Continental Shelf Oil and
Gas Reserves”54. ONS estimates that this monetary value is around £120 billion. There are
many underpinning assumptions made in such a calculation and we are aware of other
unofficial estimates that put a much higher figure on the value of the remaining reserves. Our
advice to anyone using these figures in public debate is to look closely at the assumptions
before quoting a figure and to be open about the large measure of uncertainty associated
with them.
Summary of advice
The oil sector is complex and official statistics cannot fully provide users with all the
information they require. Academic research and analysis from the industry itself is often
used and quoted in official documents but that should not be taken as official endorsement
of those estimates.
Users of these statistics need to keep in mind that oil revenues are volatile with production
and revenues highly variable from year to year.
Additionally, the future of oil production and related tax revenues is uncertain, and the
estimates of the value of remaining reserves are subject to major assumptions which are
not necessarily robust or agreed between experts.
Advice to the statistical service
Users have indicated that they would like to see more information about the methods and
assumptions used in producing estimates quoted in academic research that are then
quoted in official publications.
54
http://www.ons.gov.uk/ons/guide-method/user-guidance/well-being/publications/monetary-valuation-of-uk-continental-shelf-oil-and-gas-reserves.pdf
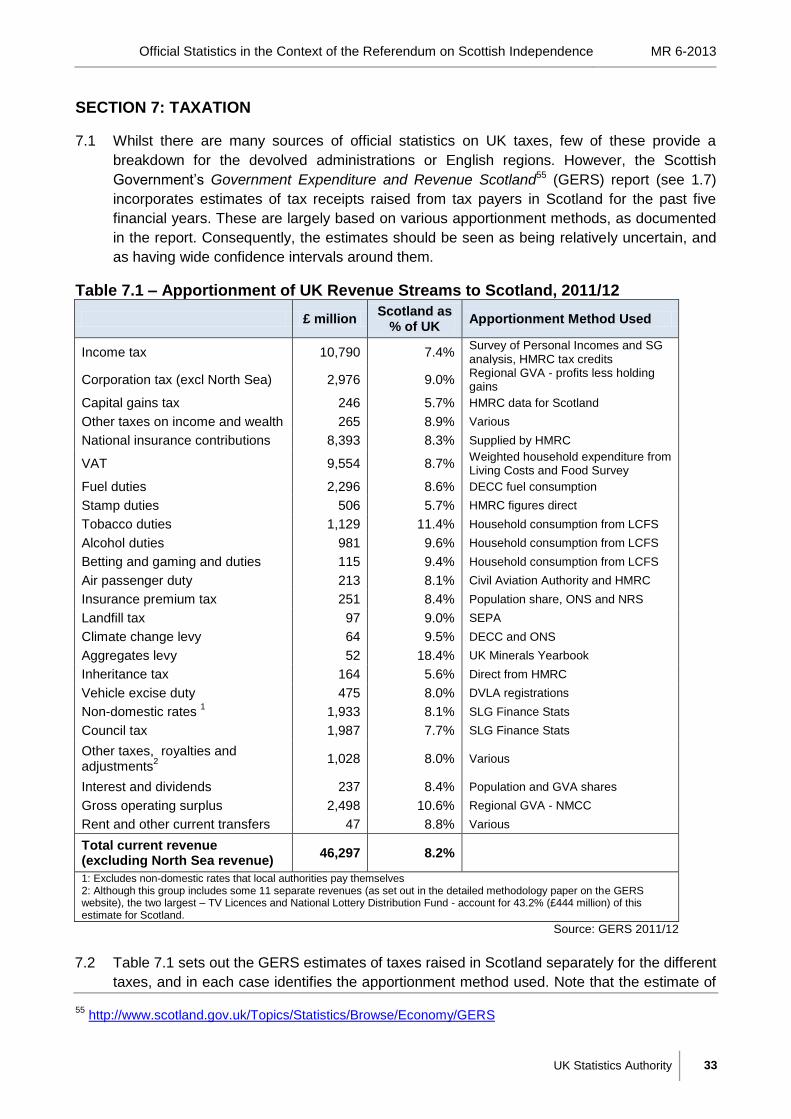
Official Statistics in the Context of the Referendum on Scottish Independence MR 6-2013
UK Statistics Authority 33
SECTION 7: TAXATION
7.1 Whilst there are many sources of official statistics on UK taxes, few of these provide a
breakdown for the devolved administrations or English regions. However, the Scottish
Government‟s Government Expenditure and Revenue Scotland55 (GERS) report (see 1.7)
incorporates estimates of tax receipts raised from tax payers in Scotland for the past five
financial years. These are largely based on various apportionment methods, as documented
in the report. Consequently, the estimates should be seen as being relatively uncertain, and
as having wide confidence intervals around them.
Table 7.1 – Apportionment of UK Revenue Streams to Scotland, 2011/12
£ million Scotland as
% of UK Apportionment Method Used
Income tax 10,790 7.4% Survey of Personal Incomes and SG analysis, HMRC tax credits
Corporation tax (excl North Sea) 2,976 9.0% Regional GVA - profits less holding gains
Capital gains tax 246 5.7% HMRC data for Scotland
Other taxes on income and wealth 265 8.9% Various
National insurance contributions 8,393 8.3% Supplied by HMRC
VAT 9,554 8.7% Weighted household expenditure from Living Costs and Food Survey
Fuel duties 2,296 8.6% DECC fuel consumption
Stamp duties 506 5.7% HMRC figures direct
Tobacco duties 1,129 11.4% Household consumption from LCFS
Alcohol duties 981 9.6% Household consumption from LCFS
Betting and gaming and duties 115 9.4% Household consumption from LCFS
Air passenger duty 213 8.1% Civil Aviation Authority and HMRC
Insurance premium tax 251 8.4% Population share, ONS and NRS
Landfill tax 97 9.0% SEPA
Climate change levy 64 9.5% DECC and ONS
Aggregates levy 52 18.4% UK Minerals Yearbook
Inheritance tax 164 5.6% Direct from HMRC
Vehicle excise duty 475 8.0% DVLA registrations
Non-domestic rates 1 1,933 8.1% SLG Finance Stats
Council tax 1,987 7.7% SLG Finance Stats
Other taxes, royalties and adjustments
2
1,028 8.0% Various
Interest and dividends 237 8.4% Population and GVA shares
Gross operating surplus 2,498 10.6% Regional GVA - NMCC
Rent and other current transfers 47 8.8% Various
Total current revenue (excluding North Sea revenue)
46,297 8.2%
1: Excludes non-domestic rates that local authorities pay themselves 2: Although this group includes some 11 separate revenues (as set out in the detailed methodology paper on the GERS website), the two largest – TV Licences and National Lottery Distribution Fund - account for 43.2% (£444 million) of this estimate for Scotland.
Source: GERS 2011/12
7.2 Table 7.1 sets out the GERS estimates of taxes raised in Scotland separately for the different
taxes, and in each case identifies the apportionment method used. Note that the estimate of
55
http://www.scotland.gov.uk/Topics/Statistics/Browse/Economy/GERS
Official Statistics in the Context of the Referendum on Scottish Independence MR 6-2013
UK Statistics Authority 34
8.2% of Scotland‟s share of the UK onshore tax revenues (see table 7.1) is close to
Scotland‟s population share of 8.3% (see table 2.1).
7.3 As can be seen from Table 7.1, the apportionment metrics are varied. Council tax and non
domestic rates are collected locally and thus the totals are calculated directly. In other cases
where HMRC are able to provide specific Scottish disaggregation (such as inheritance tax)
these figures are used. But, for the majority of revenue streams, an apportionment method is
chosen (e.g. for income tax, Scottish estimates from the HMRC Survey of Personal Incomes
are used; for corporation tax, profits less holding gains from detailed Regional GVA
estimates are used; for fuel duties, estimated fuel consumption is used, and so on).
7.4 The GERS estimates of public expenditure and tax revenues for Scotland are often used in
other reports as a basis for modelling and forecasting56.
7.5 There are inevitably some important limitations associated with the apportionment methods
currently used. The methods used are well documented and have been subject to
consultation with experts and users. However, in some cases, the method might be the best
available but still not be ideal – for example, a population share, as currently used for
insurance premium tax, may overstate or understate what might in reality be collected in
Scotland. The main message here is to use the resulting statistics with an awareness of the
uncertainty that may be attached to them.
7.6 Also, the GERS estimates currently assume equivalence in terms of tax rates etc between
Scotland and the rest of the UK. That assumption would not necessarily hold true in the
future depending on the outcome of the referendum and future developments.
7.7 The Scottish Parliament has responsibility for two main taxes, council tax and non-domestic
rates, as well as the ability, as yet unexercised, to vary the rate of income tax by up to 3p in
the pound. From April 2016, the UK rate of income tax will be reduced by 10 percentage
points for tax payers in Scotland, and the Scottish Parliament will then determine a Scottish
rate of income tax through its own budget. Landfill tax and stamp duty land tax will be
devolved to Scotland in April 2015, and it is expected that the aggregates levy will be
devolved at some future date.
7.8 The current apportionment of total UK corporation tax is based on the Scottish share of
profits of private corporations, with some adjustments, taken from the relevant component of
the Regional GVA estimates. This implies an assumption that corporation tax should be
shared between countries according to the profits accrued in each geographical area.
However, if a different principle of apportionment was adopted then a different share might
be derived. Again, the point for the user of statistics to keep in mind is that there are some
big assumptions below the surface and those assumptions might well prove short-lived in the
event of any constitutional change.
56
See for example the 2012 Institute for Fiscal Studies paper “Scottish independence: the fiscal context”.56
That report notes that “There are real questions about whether the methods used in doing this are the most
appropriate but… we take the figures from GERS and SNAP as given”.
Official Statistics in the Context of the Referendum on Scottish Independence MR 6-2013
UK Statistics Authority 35
7.9 For consumption taxes - such as VAT, tobacco duties, alcohol duties, and the betting and
gaming levy - the apportionment is based on household consumption of the related products.
The data currently used to calculate the shares comes from a relatively small sample of
households from the Living Costs and Food Survey (LCFS), and considerable uncertainty
might therefore be associated with these estimates. A three-year moving average is
therefore used in the apportionment methods consistent with the LCFS country and regional
analysis. The potential effects of this uncertainty may be more than marginal. VAT, for
example, contributes over a fifth of Scottish onshore tax revenue, so uncertainty in the
Scottish share of UK VAT might translate as a substantial amount of revenue either way.
New country revenue analysis
7.10 HMRC has announced its intention to produce a new official statistics publication on UK tax
receipts split by England, Scotland, Wales and Northern Ireland57. This will extend UK-wide
data that HMRC currently produces, and will be provided for all of HMRC‟s taxes plus tax
credits and child benefit expenditure. It is intended to be an annual publication with estimates
initially up to 2012-13. The first publication, to be released on 2 October 2013, will be
classified as experimental. It will not contain breakdowns for the English Regions. The UK
Statistics Authority will assess these new statistics against the Code of Practice for Official
Statistics in due course.
Future revenues
7.11 Whatever the outcome of the referendum, there will be more tax raising powers transferred
to Scotland under the terms of the Scotland Act. The Office for Budget Responsibility (OBR)
provides a bi-annual forecast of the taxes included in the Scotland Act (income tax, landfill
tax, aggregates levy, and stamp duty land tax) for the next five years as part of its economic
and fiscal outlook set of publications58. These are not official statistics publications, but are
the most authoritative forecasts available.
Summary of advice
Many of the revenue stream estimates are derived by applying an apportionment metric to
the UK total, and users should therefore bear in mind that there are potentially substantial
margins of error associated with any one estimate.
The annual Government Expenditure and Revenue Scotland59 (GERS) publication provides
detailed revenue statistics for Scotland for the past five financial years. Users of these
statistics should keep in mind that there are some big assumptions below the surface and
those assumptions might well prove short-lived in the event of any constitutional change.
Users should be aware that the revenue figures are revised each year to take account of
definitional changes as well as developments in data sources and methods. Some of these
revisions have been large in past years.
57
http://www.hmrc.gov.uk/statistics/announcements/22-07-13.htm 58
http://budgetresponsibility.independent.gov.uk/economic-and-fiscal-outlook-march-2013/ 59
http://www.scotland.gov.uk/Topics/Statistics/Browse/Economy/GERS

Official Statistics in the Context of the Referendum on Scottish Independence MR 6-2013
UK Statistics Authority 36
Estimated quarterly figures for total Scottish onshore and offshore revenues are available
on the SNAP website60 from 1998 Q1 to present. These figures are updated quarterly, but
the SNAP figures for the Q2 publication will be equivalent, when aggregated up to financial
years, to figures published in the GERS publication. In the case of the offshore revenues, a
population share and illustrative geographical share are included in the SNAP statistics and
either can reasonably be employed – provided the basis is specified and used consistently.
Historical fiscal balance estimates for Scotland are also available on the SNAP website.
These provide estimates of Scotland‟s onshore and offshore tax revenues for each financial
year since 1980/81. These are produced annually and are consistent with the GERS
release, see caveat above.
60
http://www.scotland.gov.uk/Topics/Statistics/Browse/Economy/snap

Official Statistics in the Context of the Referendum on Scottish Independence MR 6-2013
UK Statistics Authority 37
SECTION 8: DEFICIT AND DEBT
8.1 Under the current constitutional arrangements, Scotland does not have a specific deficit or
debt of its own but, if the referendum led to independence, Scotland might accrue a share
(currently unresolved) of the UK totals. There are some official statistics relevant to analysis
of Scotland‟s possible deficit under different scenarios.
Deficit 8.2 Estimates of Scotland‟s deficit, presented as a net fiscal balance, are included in the annual
GERS publication (see 1.7). This report sets out, for the last five financial years, estimates of
taxes raised, current and capital managed expenditure and public sector depreciation, from
which the Scottish current budget balance and net fiscal balance are derived. The latter is
the difference between the estimated tax revenue (see section 7) and total managed
expenditure (see section 4). Users should keep in mind that this is the difference between
two large and uncertain quantities, and there is thus even more uncertainty associated with
the derived fiscal balance. This uncertainty is not readily quantifiable but it is potentially large
enough to affect the overall picture.
8.3 The SNAP publication provides two additional sets of analysis of the current budget balance
and the net fiscal balance for Scotland and the UK: (i) a long term historic analysis going
back annually to 1980/81 and (ii) quarterly estimates going back to 1998, around the time of
the establishment of the Scottish Parliament.
Chart 8.1 – Current Budget Balance as a % of GDP, UK and Scotland
Source: Scottish National Accounts Project, Scottish Government
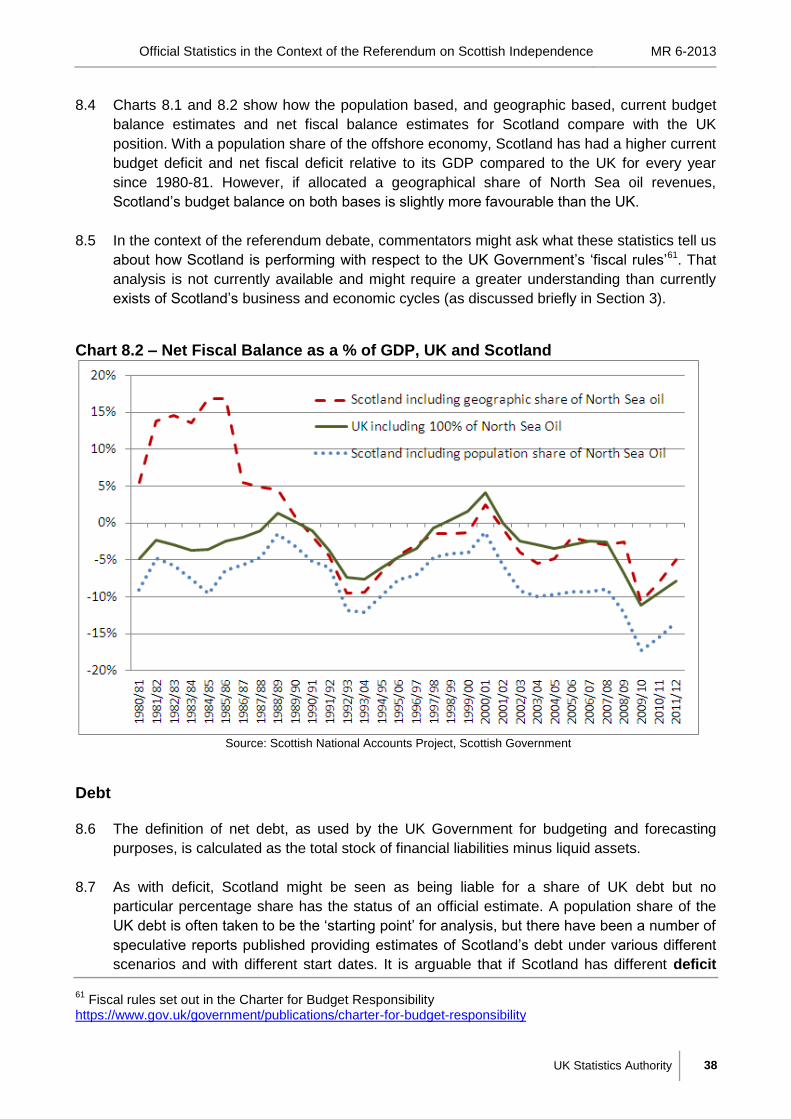
Official Statistics in the Context of the Referendum on Scottish Independence MR 6-2013
UK Statistics Authority 38
8.4 Charts 8.1 and 8.2 show how the population based, and geographic based, current budget
balance estimates and net fiscal balance estimates for Scotland compare with the UK
position. With a population share of the offshore economy, Scotland has had a higher current
budget deficit and net fiscal deficit relative to its GDP compared to the UK for every year
since 1980-81. However, if allocated a geographical share of North Sea oil revenues,
Scotland‟s budget balance on both bases is slightly more favourable than the UK.
8.5 In the context of the referendum debate, commentators might ask what these statistics tell us
about how Scotland is performing with respect to the UK Government‟s „fiscal rules‟61. That
analysis is not currently available and might require a greater understanding than currently
exists of Scotland‟s business and economic cycles (as discussed briefly in Section 3).
Chart 8.2 – Net Fiscal Balance as a % of GDP, UK and Scotland
Source: Scottish National Accounts Project, Scottish Government
Debt 8.6 The definition of net debt, as used by the UK Government for budgeting and forecasting
purposes, is calculated as the total stock of financial liabilities minus liquid assets.
8.7 As with deficit, Scotland might be seen as being liable for a share of UK debt but no
particular percentage share has the status of an official estimate. A population share of the
UK debt is often taken to be the „starting point‟ for analysis, but there have been a number of
speculative reports published providing estimates of Scotland‟s debt under various different
scenarios and with different start dates. It is arguable that if Scotland has different deficit
61
Fiscal rules set out in the Charter for Budget Responsibility https://www.gov.uk/government/publications/charter-for-budget-responsibility

Official Statistics in the Context of the Referendum on Scottish Independence MR 6-2013
UK Statistics Authority 39
patterns to the UK as a whole, then its derived debt position should be different from a
population share, but that is about as far as we can take that line of reasoning.
8.8 The Scottish Government has used the GERS figures to produce an illustrative analysis of
what Scotland‟s debt would be, based on its estimated revenues and expenditure since
1980/81 in its „Scottish Budget”62 publication. This showed that the UK public sector net debt
at the end of 2011-12 stood at £1,100 billion (72% of GDP). It provided two methods of
assigning a notional share of this debt to Scotland in this report. Scotland‟s population share
would have been equivalent to £92 billion (62% of Scottish GDP including a population share
of Extra-Regio value added). And when Scotland‟s notional share of UK debt is estimated by
the Scottish Government based on Scotland‟s historical net fiscal balance (from the SNAP
publication) it is estimated to be worth £56 billion (38 per cent of Scottish GDP including a
geographical share of Extra-Regio value added). Many alternative estimates may be
calculated by making different assumptions.
Debt interest payments 8.9 Debt interest payments are payments to the private sector to cover the interest on
outstanding UK government debt. This is an increasing element of UK total managed
expenditure (TME) having risen from 5.4% of UK TME in 2007-08 to 7.0% in 2011-12, as
shown in the GERS publication. The OBR forecasts63 that UK debt interest payments as a
proportion of GDP will rise each year up to 2017-18, despite a falling TME forecast over that
period. As discussed in Section 4, debt is a UK-wide issue, and Scotland, for the purposes of
the GERS publication, assumes a population share of UK debt interest.
Scotland’s wealth, assets and liabilities 8.10 There are currently no official estimates of Scotland‟s total (public and private sector) wealth,
nor its assets or liabilities. Any future determination of Scottish assets and liabilities would
need to address a number of complex questions, including the apportionment of assets and
liabilities in relation to oil, defence, nuclear decommissioning, state and public sector
pensions, Bank of England assets and liabilities, and Public Corporations (including the
publicly-owned banks) and the Crown Estate.
Summary of advice
The GERS report provides estimates of Scotland‟s net fiscal balance (the Scottish
equivalent to the net borrowing in the UK public sector finances). Users need to be aware
that this estimate is derived by subtracting estimated revenues from total managed
expenditure (both are large in value with wide margins of uncertainty – see earlier
Sections). The estimate for net borrowing is likely to be particularly uncertain for this
reason.
There are no estimates in the GERS publication for Scotland‟s potential debt. Whilst a
population share would be one way to apportion debt, it is not necessarily the case that (in
62
http://www.scotland.gov.uk/Resource/0042/00425599.pdf 63
http://budgetresponsibility.org.uk/economic-and-fiscal-outlook-march-2013/
Official Statistics in the Context of the Referendum on Scottish Independence MR 6-2013
UK Statistics Authority 40
the event of independence) that method would be applied. In the course of the referendum
debate so far, various analyses of Scotland‟s debt, based on GERS data, have been
quoted. These are not official statistics.
The currently available official statistics cannot provide a clear indication of what, in the
event of independence, Scotland‟s debt, wealth, assets and liabilities would be.
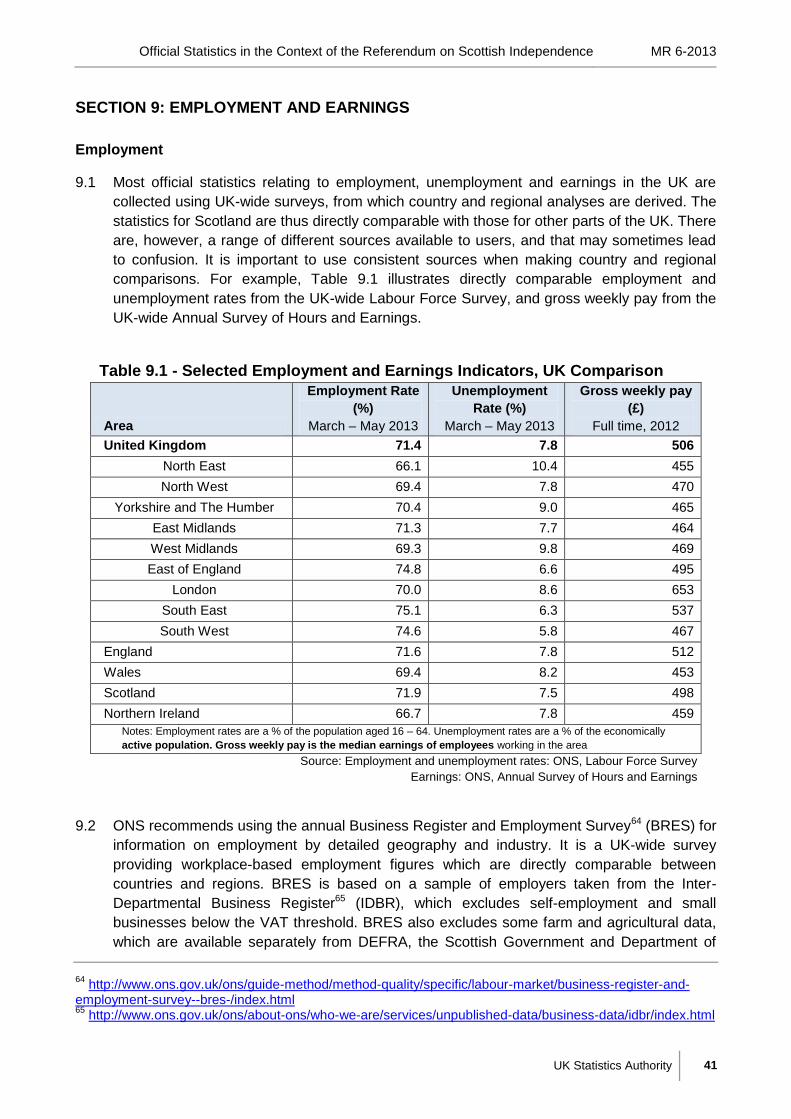
Official Statistics in the Context of the Referendum on Scottish Independence MR 6-2013
UK Statistics Authority 41
SECTION 9: EMPLOYMENT AND EARNINGS
Employment
9.1 Most official statistics relating to employment, unemployment and earnings in the UK are
collected using UK-wide surveys, from which country and regional analyses are derived. The
statistics for Scotland are thus directly comparable with those for other parts of the UK. There
are, however, a range of different sources available to users, and that may sometimes lead
to confusion. It is important to use consistent sources when making country and regional
comparisons. For example, Table 9.1 illustrates directly comparable employment and
unemployment rates from the UK-wide Labour Force Survey, and gross weekly pay from the
UK-wide Annual Survey of Hours and Earnings.
Table 9.1 - Selected Employment and Earnings Indicators, UK Comparison
Area
Employment Rate
(%)
March – May 2013
Unemployment
Rate (%)
March – May 2013
Gross weekly pay
(£)
Full time, 2012
United Kingdom 71.4 7.8 506
North East 66.1 10.4 455
North West 69.4 7.8 470
Yorkshire and The Humber 70.4 9.0 465
East Midlands 71.3 7.7 464
West Midlands 69.3 9.8 469
East of England 74.8 6.6 495
London 70.0 8.6 653
South East 75.1 6.3 537
South West 74.6 5.8 467
England 71.6 7.8 512
Wales 69.4 8.2 453
Scotland 71.9 7.5 498
Northern Ireland 66.7 7.8 459
Notes: Employment rates are a % of the population aged 16 – 64. Unemployment rates are a % of the economically
active population. Gross weekly pay is the median earnings of employees working in the area
Source: Employment and unemployment rates: ONS, Labour Force Survey
Earnings: ONS, Annual Survey of Hours and Earnings
9.2 ONS recommends using the annual Business Register and Employment Survey64 (BRES) for
information on employment by detailed geography and industry. It is a UK-wide survey
providing workplace-based employment figures which are directly comparable between
countries and regions. BRES is based on a sample of employers taken from the Inter-
Departmental Business Register65 (IDBR), which excludes self-employment and small
businesses below the VAT threshold. BRES also excludes some farm and agricultural data,
which are available separately from DEFRA, the Scottish Government and Department of
64
http://www.ons.gov.uk/ons/guide-method/method-quality/specific/labour-market/business-register-and-employment-survey--bres-/index.html 65
http://www.ons.gov.uk/ons/about-ons/who-we-are/services/unpublished-data/business-data/idbr/index.html

Official Statistics in the Context of the Referendum on Scottish Independence MR 6-2013
UK Statistics Authority 42
Agriculture and Rural Development Northern Ireland (DARDNI), and so is not a sufficiently
comprehensive source for measurement or comparisons for this particular sector. For broad
industry groups, Workforce Jobs66 provides quarterly information for countries and regions.
9.3 The Labour Force Survey (LFS) and the Annual Population Survey (APS) (which is based on
data collected for the LFS) is a UK-wide household survey. The LFS sample for Scotland is
boosted in order to provide more reliable residence-based results for Scotland. ONS
considers the LFS to provide the best indicator of total employment and unemployment in the
economy. The Scottish Government produces Local Area Labour Market Statistics67 based
on the results of the LFS and APS. The estimates presented in the Scottish release are
consistent with LFS results for the rest of UK.
9.4 Direct comparisons of the size of the public sector in Scotland and in the rest of the UK can
be problematic. Data collected for Public Sector Employment in Scotland68(PSES) are shared
between ONS and the Scottish Government, with ONS collecting some components
(including employment in the devolved civil service, further education, NDPBs and public
corporations) and the Scottish Government collecting the remainder. It is published quarterly
on the same day and using the same sector definitions as the equivalent ONS publication for
the UK. The Scottish Government notes that valid comparisons with the UK can only be
made using the non-seasonally adjusted UK data.
9.5 Statistical sources covering Great Britain (England, Scotland and Wales) include ONS‟s
Quarterly Public Sector Employment Survey69 (QPSES) for employment counts in central
government departments and public corporations, and DASA (the Defence Analytical
Services Agency) which provides employment counts for defence services. Scotland-only
sources, which are provided to ONS for inclusion in the QPSES release, include the Scottish
Government‟s Joint Staffing Watch70 for employment in Local Authorities and the Police, and
the Information Services Division (part of NHS Scotland) for NHS employment71. Private
sector employment is estimated in PSES as the difference between calculated public sector
employment and the total employment figure from the LFS.
9.6 Some banks and other financial institutions are currently included in the definition of the
public sector72. Total UK public sector employment in financial institutions (eg Lloyds Banking
Group and RBS) is collected in the quarterly ONS public sector survey. This survey does not
distinguish sub-UK employment in this sector. Scotland is allocated a fixed share of this UK
total in each quarter. Scotland‟s share, based on employee numbers, is currently only
revised once per year from employment estimates from the Inter Departmental Business
66
http://www.ons.gov.uk/ons/taxonomy/index.html?nscl=Workforce+Jobs 67
http://www.scotland.gov.uk/Publications/2013/05/6728 68
http://www.scotland.gov.uk/Publications/2013/06/9041 69
http://www.ons.gov.uk/ons/rel/pse/public-sector-employment/q1-2013/stb-pse-2013q1.html#tab-background-notes 70
http://www.scotland.gov.uk/Topics/Statistics/Browse/Labour-Market/PublicSectorEmployment 71
Information Services Division: http://www.isdscotland.org/Health-Topics/Workforce/ For England and Wales the corresponding sources are the ONS quarterly public sector employment survey and the Information Centre for Health and Social Care: http://www.ons.gov.uk/ons/rel/pse/public-sector-employment/q1-2013/stb-pse-2013q1.html#tab-background-notes 72
http://www.scotland.gov.uk/Topics/Statistics/Browse/Labour-Market/PublicSectorEmployment/SourcesDef (see paragraphs 29 to 33)
Official Statistics in the Context of the Referendum on Scottish Independence MR 6-2013
UK Statistics Authority 43
Register (IDBR). This re-weighting happens for the quarter 3 estimate, though we
understand the Scottish Government is currently updating the methodology to update on a
quarterly basis. Under the current system, a change in Scotland‟s share of UK public sector
financial institutions after Q3 2013 may not be accurately reflected in PSES until the Q3 2014
results are available: this would be in January 2015, too late to inform the debate ahead of
the referendum. This may be significant if some public sector financial institutions return to
the private sector during this period.
9.7 The estimates of employment in the education sector differ between PSE and those
published by the Department for Education (DfE) and Scottish Funding Council (SFC) due to
definitional differences. This is mainly due to the treatment of the college sector which has
been removed from the public sector in England, but remains in the sector in Scotland. The
approach is consistent with the National Accounts definitions used in each country. Users
may find the PSES most useful for comparisons of employment within the public sector,
while bearing in mind the definitional differences in the structure of the sector.
Earnings
9.8 Official statistics about earnings are available from various UK-wide surveys, so direct
comparisons can be made between Scotland and the rest of the UK. It is better not to
attempt to make comparisons between results drawn from different surveys, as they are
unlikely to capture the same content.
9.9 The Annual Survey of Hours and Earnings73 (ASHE) is a UK-wide survey managed by ONS,
and includes directly comparable results for Scotland and the rest of the UK. ASHE covers
earnings from employment, but not from other sources of income, so does not provide
estimates of total income, poverty, or reliance on public sector support. ASHE also excludes
the earnings of self-employed workers, so does not give a comprehensive picture. It is
however, based on the largest and most reliable sample available for earnings from
employment across most industrial sectors and geographic areas.
9.10 Like ASHE, the Family Resources Survey74 (FRS) is a UK-wide survey with consistent
results for Scotland and the rest of UK. The FRS includes all sources of income, but does not
offer the same level of industrial detail as ASHE. The LFS also includes earnings figures, but
these are based on self-reported returns, and are therefore likely to be less reliable than the
information from ASHE or FRS. The FRS is the more comprehensive source of incomes
data.
Summary of advice
When making comparisons between countries and regions of employment and earnings
estimates, users are strongly advised always to use data from the same survey, rather than
using a mixture of data sources.
73
http://www.ons.gov.uk/ons/guide-method/method-quality/specific/labour-market/annual-survey-of-hours-and-earnings/index.html 74
http://www.ons.gov.uk/ons/guide-method/surveys/respondents/household/family-resources-survey/index.html
Official Statistics in the Context of the Referendum on Scottish Independence MR 6-2013
UK Statistics Authority 44
The Business Register and Employment Survey (BRES) is a source for employment
analysis by sector and geographic area, but not for the agriculture, fishing and forestry
sector.
The Labour Force Survey (LFS) is good for analyses of total employment.
The Public Sector Employment Survey (PSES) is the most suitable for analysis of the
public sector, although Scotland vs UK comparisons must be treated with caution due to
some differences (see 9.5 and 9.6).
Earnings data for all 4 countries of the UK are available from the ASHE publication75 and
are directly comparable. However, this is based on survey information and can have wide
confidence intervals for some indicators.
NOMIS provides an easy access route to a range of labour market indicators including
BRES, APS, LFS and ASHE. SNAP (see 1.7) includes an estimate of the total quarterly
compensation (earnings) received by Scottish employees. This is derived from the average
earnings data presented in ASHE and the total employment data presented in BRES.
Compensation of employees accounts for some 60 per cent of Scotland‟s GDP when
calculated using the income method: one of the three methods of calculating GDP in SNAP.
SNAP only provides figures for Scotland.
75
http://www.ons.gov.uk/ons/rel/ashe/annual-survey-of-hours-and-earnings/2012-provisional-results/index.html
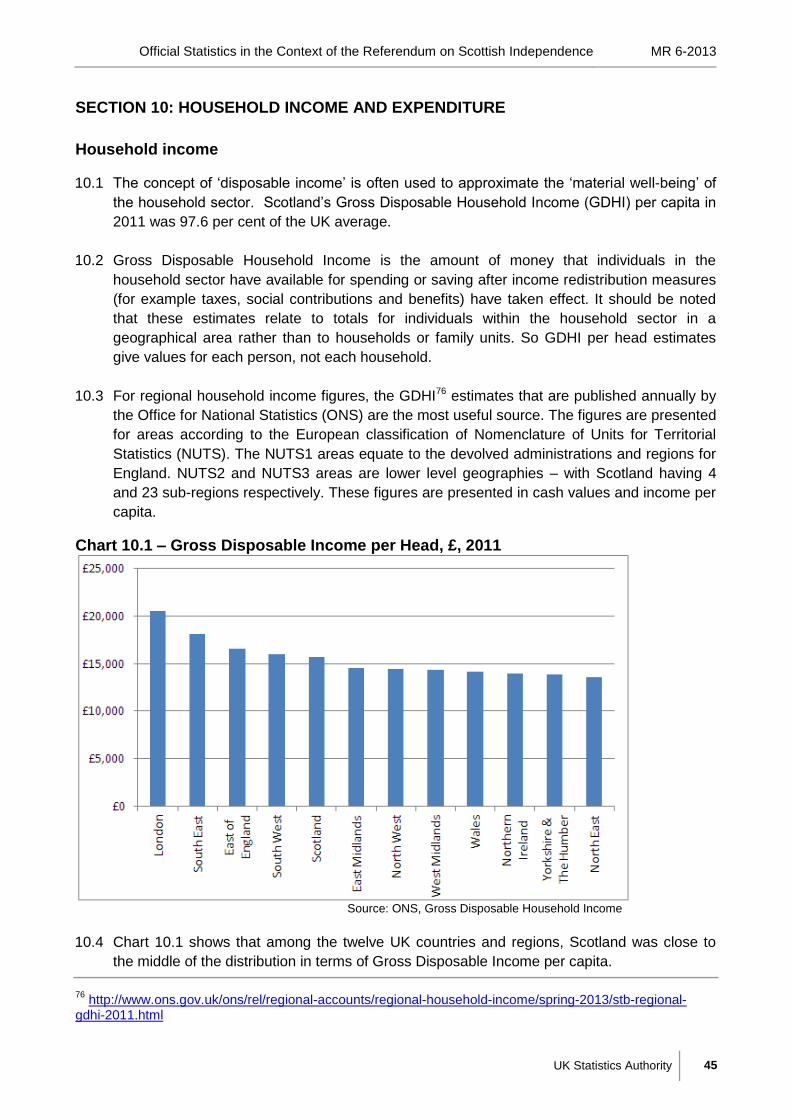
Official Statistics in the Context of the Referendum on Scottish Independence MR 6-2013
UK Statistics Authority 45
SECTION 10: HOUSEHOLD INCOME AND EXPENDITURE
Household income
10.1 The concept of „disposable income‟ is often used to approximate the „material well-being‟ of
the household sector. Scotland‟s Gross Disposable Household Income (GDHI) per capita in
2011 was 97.6 per cent of the UK average.
10.2 Gross Disposable Household Income is the amount of money that individuals in the
household sector have available for spending or saving after income redistribution measures
(for example taxes, social contributions and benefits) have taken effect. It should be noted
that these estimates relate to totals for individuals within the household sector in a
geographical area rather than to households or family units. So GDHI per head estimates
give values for each person, not each household.
10.3 For regional household income figures, the GDHI76 estimates that are published annually by
the Office for National Statistics (ONS) are the most useful source. The figures are presented
for areas according to the European classification of Nomenclature of Units for Territorial
Statistics (NUTS). The NUTS1 areas equate to the devolved administrations and regions for
England. NUTS2 and NUTS3 areas are lower level geographies – with Scotland having 4
and 23 sub-regions respectively. These figures are presented in cash values and income per
capita.
Chart 10.1 – Gross Disposable Income per Head, £, 2011
Source: ONS, Gross Disposable Household Income
10.4 Chart 10.1 shows that among the twelve UK countries and regions, Scotland was close to
the middle of the distribution in terms of Gross Disposable Income per capita.
76
http://www.ons.gov.uk/ons/rel/regional-accounts/regional-household-income/spring-2013/stb-regional-gdhi-2011.html

Official Statistics in the Context of the Referendum on Scottish Independence MR 6-2013
UK Statistics Authority 46
10.5 Within Scotland, of the 23 NUTS 3 areas, there was significant variation in GDHI per capita –
ranging from £13,500 in Glasgow City to £18,000 in the Shetland Isles (partly due to the impact of the oil industry) in 2011. Users should note, however, that the NUTS2 and 3 boundaries do not map directly to more familiar administrative boundaries such as local authorities.
Distribution of household income 10.6 The Family Resources Survey77 (FRS), commissioned by the Department of Work and
Pensions, collects information on the incomes and circumstances of private households in the United Kingdom. The statistics from the survey contain a wealth of important and useful statistics on household income and state support, tenure, disability and carers. Data from the survey are useful for regional analysis of income by household. The FRS sample size is boosted in Scotland to enable analysis at a Scottish level. Some disaggregations are available for Scotland such as age group (children, working age, and pensioners). Table 10.1 shows total average household weekly income for 2011/12 by country and region by income band. Note: these figures have not been adjusted to take into account household composition.
Table 10.1 – Total Weekly Household Income, 2011/12, by Region and Country
Region/ Country
Percentage of households in weekly income bracket
< £100
£100 - £200
£200 - £300
£300 - £400
£400 - £500
£500 - £600
£600 - £700
£700 - £800
£800 - £900
£900 - £1000
£1000 plus
North East 2 9 15 18 12 9 8 7 6 2 12
North West 1 8 17 16 11 10 7 5 5 3 16Yorkshire and The Humber
2 9 15 14 12 9 8 6 5 4 17
East Midlands 1 10 16 14 11 8 9 6 5 4 16
West Midlands 2 9 14 15 11 9 7 7 5 4 17East of England
2 7 11 12 10 8 9 7 5 5 24
London 1 7 13 12 9 7 7 5 5 4 28
Inner London 1 10 16 14 9 5 6 4 6 4 26
Outer London 1 5 10 12 9 9 8 7 5 5 29
South East 1 7 11 10 8 8 8 7 6 5 28
South West 2 9 13 12 11 9 8 7 7 3 19
England 2 8 14 13 10 9 8 6 5 4 21
Wales 2 11 16 14 12 10 6 7 4 4 16
Scotland 2 9 15 14 11 8 8 6 5 4 18Northern Ireland
2 11 15 15 10 10 9 6 5 4 13
United Kingdom
2 8 14 13 10 9 8 6 5 4 20
Source: DWP, Family Resources Survey 2011/12
77 https://www.gov.uk/government/organisations/department-for-work-pensions/series/family-resources-survey--2
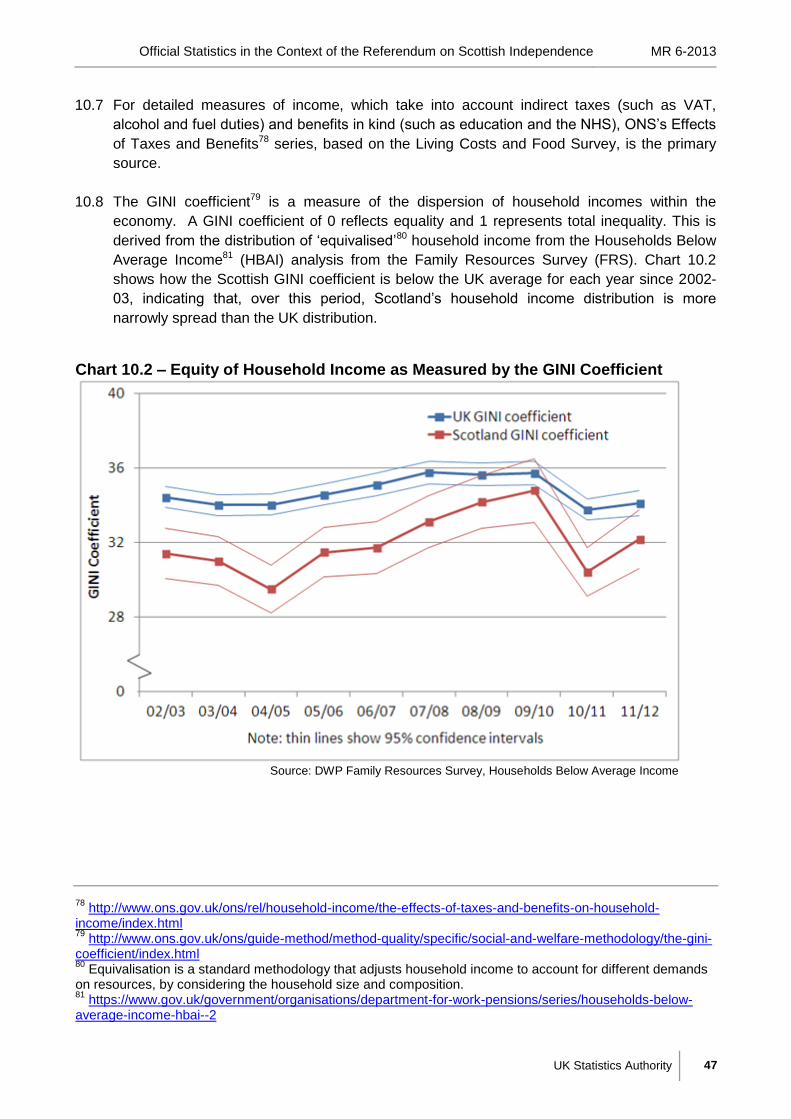
Official Statistics in the Context of the Referendum on Scottish Independence MR 6-2013
UK Statistics Authority 47
10.7 For detailed measures of income, which take into account indirect taxes (such as VAT,
alcohol and fuel duties) and benefits in kind (such as education and the NHS), ONS‟s Effects
of Taxes and Benefits78 series, based on the Living Costs and Food Survey, is the primary
source.
10.8 The GINI coefficient79 is a measure of the dispersion of household incomes within the
economy. A GINI coefficient of 0 reflects equality and 1 represents total inequality. This is
derived from the distribution of „equivalised‟80 household income from the Households Below
Average Income81 (HBAI) analysis from the Family Resources Survey (FRS). Chart 10.2
shows how the Scottish GINI coefficient is below the UK average for each year since 2002-
03, indicating that, over this period, Scotland‟s household income distribution is more
narrowly spread than the UK distribution.
Chart 10.2 – Equity of Household Income as Measured by the GINI Coefficient
Source: DWP Family Resources Survey, Households Below Average Income
78
http://www.ons.gov.uk/ons/rel/household-income/the-effects-of-taxes-and-benefits-on-household-income/index.html 79
http://www.ons.gov.uk/ons/guide-method/method-quality/specific/social-and-welfare-methodology/the-gini-coefficient/index.html 80
Equivalisation is a standard methodology that adjusts household income to account for different demands on resources, by considering the household size and composition. 81
https://www.gov.uk/government/organisations/department-for-work-pensions/series/households-below-average-income-hbai--2

Official Statistics in the Context of the Referendum on Scottish Independence MR 6-2013
UK Statistics Authority 48
Household expenditure and savings 10.9 For household expenditure, the publication Family Spending82 provides a detailed analysis of
the statistics from the Living Costs and Food Survey (LCFS). The LCFS is a voluntary
household survey that collects details about the expenditure of the household and individuals
within the household. It forms part of the Integrated Household Survey (IHS). The sample
does not cover the Scottish inhabited islands or the Isles of Scilly. Achieved sample sizes are
small, though a Scottish boost to the survey is under consideration. Table 10.2 shows the
average weekly expenditure by country and region on a broad range of household
expenditure items.
Table 10.2 – Average Weekly Household Expenditure by Commodity 2009-2011 (3-year average)
Average weekly household expenditure (£)
Nort
h E
ast
Nort
h W
est
York
shire a
nd
The H
um
ber
East M
idla
nds
West M
idla
nds
East of
Engla
nd
Lond
on
South
East
South
West
Eng
land
Wa
les
Scotland
Nort
hern
Ire
land
United K
ingd
om
Food & non-alcoholic drinks
46 51 47 53 51 56 58 58 56 54 53 52 58 53
Alcoholic drinks, tobacco 11 13 11 11 11 11 10 12 11 11 11 13 17 12
Clothing & footwear 22 22 19 19 19 21 27 21 20 21 21 22 41 22
Housing (net)1, fuel &
power 46 56 53 55 54 59 91 63 61 62 54 53 50 60
Household goods & services
24 28 27 26 26 32 34 33 31 30 22 26 27 29
Health 5 4 4 6 4 6 8 9 6 6 3 4 6 6
Transport 50 56 54 64 62 69 67 75 69 64 54 61 63 63
Communication 11 12 11 13 12 14 16 14 13 13 11 12 13 13
Recreation & culture 51 58 57 58 54 65 61 71 62 61 54 55 60 60
Education 3 7 5 9 8 6 16 11 8 8 9 5 8 8
Restaurants & hotels 33 36 35 35 35 39 53 43 37 39 32 37 49 39
Misc. goods & services 28 37 31 36 32 40 43 44 37 37 28 32 38 37
All expenditure groups 330 378 355 385 369 416 484 453 410 406 351 372 429 401
Other expenditure items 54 66 55 62 56 81 91 87 70 71 48 69 60 70
Total expenditure 384 444 410 447 425 497 575 539 480 478 398 441 489 471
Average weekly expenditure per person
174 189 180 193 178 216 226 229 209 203 170 200 197 201
1Excluding mortgage interest payments, council tax and Northern Ireland rates
Source: Living Costs and Food Survey, Family Spending 2011
10.10 Table 10.2 shows that Scottish households on average spend slightly less each week on
food and non-alcoholic drinks than the UK as whole, but more per week on alcoholic drinks
and tobacco. Housing (net) expenditure in Scotland is considerably less than the UK
average, but this comparison is affected by the high figure for London. On the whole, for the
82
http://www.ons.gov.uk/ons/rel/family-spending/family-spending/index.html
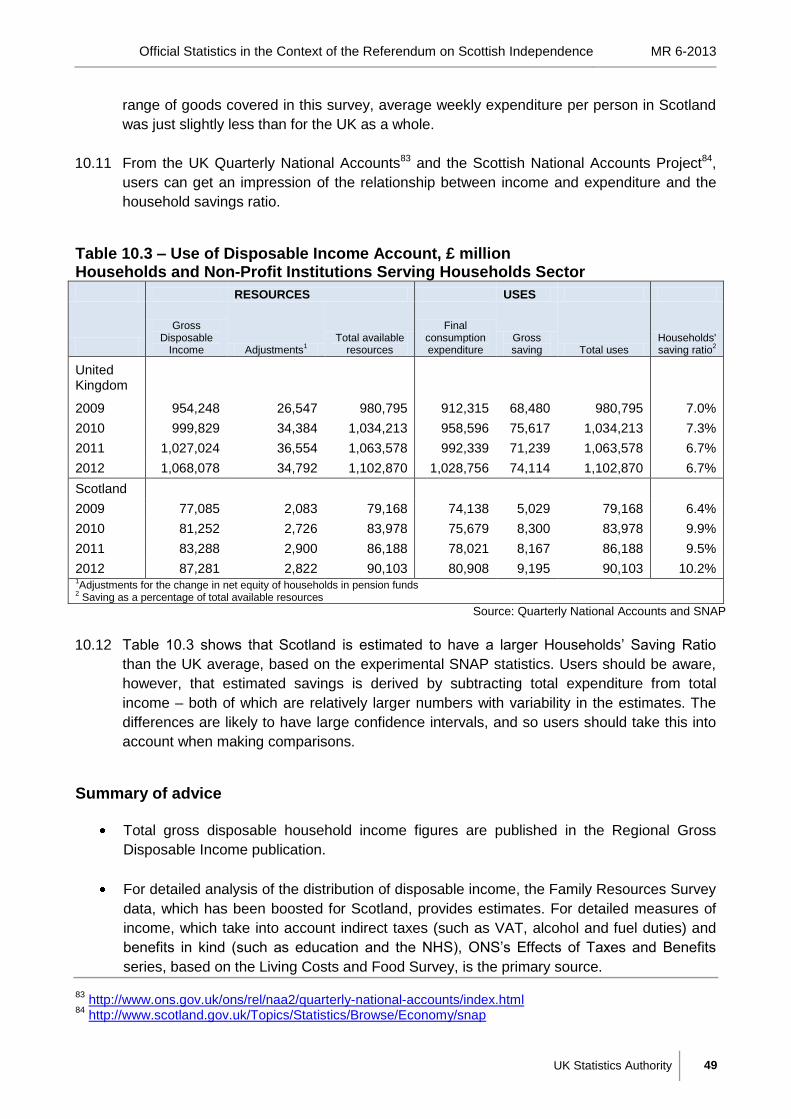
Official Statistics in the Context of the Referendum on Scottish Independence MR 6-2013
UK Statistics Authority 49
range of goods covered in this survey, average weekly expenditure per person in Scotland
was just slightly less than for the UK as a whole.
10.11 From the UK Quarterly National Accounts83 and the Scottish National Accounts Project84,
users can get an impression of the relationship between income and expenditure and the
household savings ratio.
Table 10.3 – Use of Disposable Income Account, £ million Households and Non-Profit Institutions Serving Households Sector
RESOURCES USES
Gross Disposable
Income Adjustments1
Total available resources
Final consumption expenditure
Gross saving Total uses
Households' saving ratio
2
United Kingdom
2009 954,248 26,547 980,795 912,315 68,480 980,795 7.0%
2010 999,829 34,384 1,034,213 958,596 75,617 1,034,213 7.3%
2011 1,027,024 36,554 1,063,578 992,339 71,239 1,063,578 6.7%
2012 1,068,078 34,792 1,102,870 1,028,756 74,114 1,102,870 6.7%
Scotland
2009 77,085 2,083 79,168 74,138 5,029 79,168 6.4%
2010 81,252 2,726 83,978 75,679 8,300 83,978 9.9%
2011 83,288 2,900 86,188 78,021 8,167 86,188 9.5%
2012 87,281 2,822 90,103 80,908 9,195 90,103 10.2% 1Adjustments for the change in net equity of households in pension funds
2 Saving as a percentage of total available resources
Source: Quarterly National Accounts and SNAP
10.12 Table 10.3 shows that Scotland is estimated to have a larger Households‟ Saving Ratio
than the UK average, based on the experimental SNAP statistics. Users should be aware,
however, that estimated savings is derived by subtracting total expenditure from total
income – both of which are relatively larger numbers with variability in the estimates. The
differences are likely to have large confidence intervals, and so users should take this into
account when making comparisons.
Summary of advice
Total gross disposable household income figures are published in the Regional Gross
Disposable Income publication.
For detailed analysis of the distribution of disposable income, the Family Resources Survey
data, which has been boosted for Scotland, provides estimates. For detailed measures of
income, which take into account indirect taxes (such as VAT, alcohol and fuel duties) and
benefits in kind (such as education and the NHS), ONS‟s Effects of Taxes and Benefits
series, based on the Living Costs and Food Survey, is the primary source.
83
http://www.ons.gov.uk/ons/rel/naa2/quarterly-national-accounts/index.html 84
http://www.scotland.gov.uk/Topics/Statistics/Browse/Economy/snap

Official Statistics in the Context of the Referendum on Scottish Independence MR 6-2013
UK Statistics Authority 50
For detailed expenditure by household, users can refer to the Living Costs and Food
Survey.
A households‟ saving ratio is available for Scotland as part of the experimental Scottish
National Accounts Project. Users should be aware that these estimates will have large
confidence intervals, and comparisons should be made with caution.
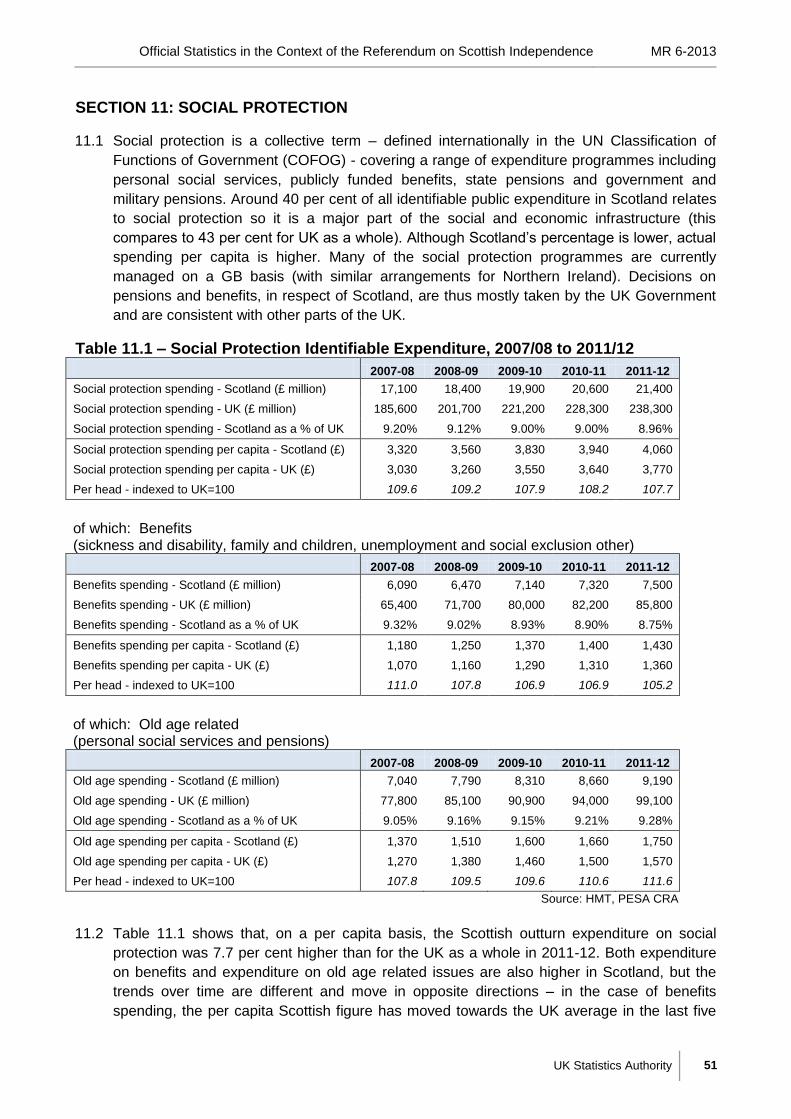
Official Statistics in the Context of the Referendum on Scottish Independence MR 6-2013
UK Statistics Authority 51
SECTION 11: SOCIAL PROTECTION
11.1 Social protection is a collective term – defined internationally in the UN Classification of
Functions of Government (COFOG) - covering a range of expenditure programmes including
personal social services, publicly funded benefits, state pensions and government and
military pensions. Around 40 per cent of all identifiable public expenditure in Scotland relates
to social protection so it is a major part of the social and economic infrastructure (this
compares to 43 per cent for UK as a whole). Although Scotland‟s percentage is lower, actual
spending per capita is higher. Many of the social protection programmes are currently
managed on a GB basis (with similar arrangements for Northern Ireland). Decisions on
pensions and benefits, in respect of Scotland, are thus mostly taken by the UK Government
and are consistent with other parts of the UK.
Table 11.1 – Social Protection Identifiable Expenditure, 2007/08 to 2011/12
2007-08 2008-09 2009-10 2010-11 2011-12
Social protection spending - Scotland (£ million) 17,100 18,400 19,900 20,600 21,400
Social protection spending - UK (£ million) 185,600 201,700 221,200 228,300 238,300
Social protection spending - Scotland as a % of UK 9.20% 9.12% 9.00% 9.00% 8.96%
Social protection spending per capita - Scotland (£) 3,320 3,560 3,830 3,940 4,060
Social protection spending per capita - UK (£) 3,030 3,260 3,550 3,640 3,770
Per head - indexed to UK=100 109.6 109.2 107.9 108.2 107.7
of which: Benefits (sickness and disability, family and children, unemployment and social exclusion other)
2007-08 2008-09 2009-10 2010-11 2011-12
Benefits spending - Scotland (£ million) 6,090 6,470 7,140 7,320 7,500
Benefits spending - UK (£ million) 65,400 71,700 80,000 82,200 85,800
Benefits spending - Scotland as a % of UK 9.32% 9.02% 8.93% 8.90% 8.75%
Benefits spending per capita - Scotland (£) 1,180 1,250 1,370 1,400 1,430
Benefits spending per capita - UK (£) 1,070 1,160 1,290 1,310 1,360
Per head - indexed to UK=100 111.0 107.8 106.9 106.9 105.2
of which: Old age related (personal social services and pensions)
2007-08 2008-09 2009-10 2010-11 2011-12
Old age spending - Scotland (£ million) 7,040 7,790 8,310 8,660 9,190
Old age spending - UK (£ million) 77,800 85,100 90,900 94,000 99,100
Old age spending - Scotland as a % of UK 9.05% 9.16% 9.15% 9.21% 9.28%
Old age spending per capita - Scotland (£) 1,370 1,510 1,600 1,660 1,750
Old age spending per capita - UK (£) 1,270 1,380 1,460 1,500 1,570
Per head - indexed to UK=100 107.8 109.5 109.6 110.6 111.6
Source: HMT, PESA CRA
11.2 Table 11.1 shows that, on a per capita basis, the Scottish outturn expenditure on social
protection was 7.7 per cent higher than for the UK as a whole in 2011-12. Both expenditure
on benefits and expenditure on old age related issues are also higher in Scotland, but the
trends over time are different and move in opposite directions – in the case of benefits
spending, the per capita Scottish figure has moved towards the UK average in the last five
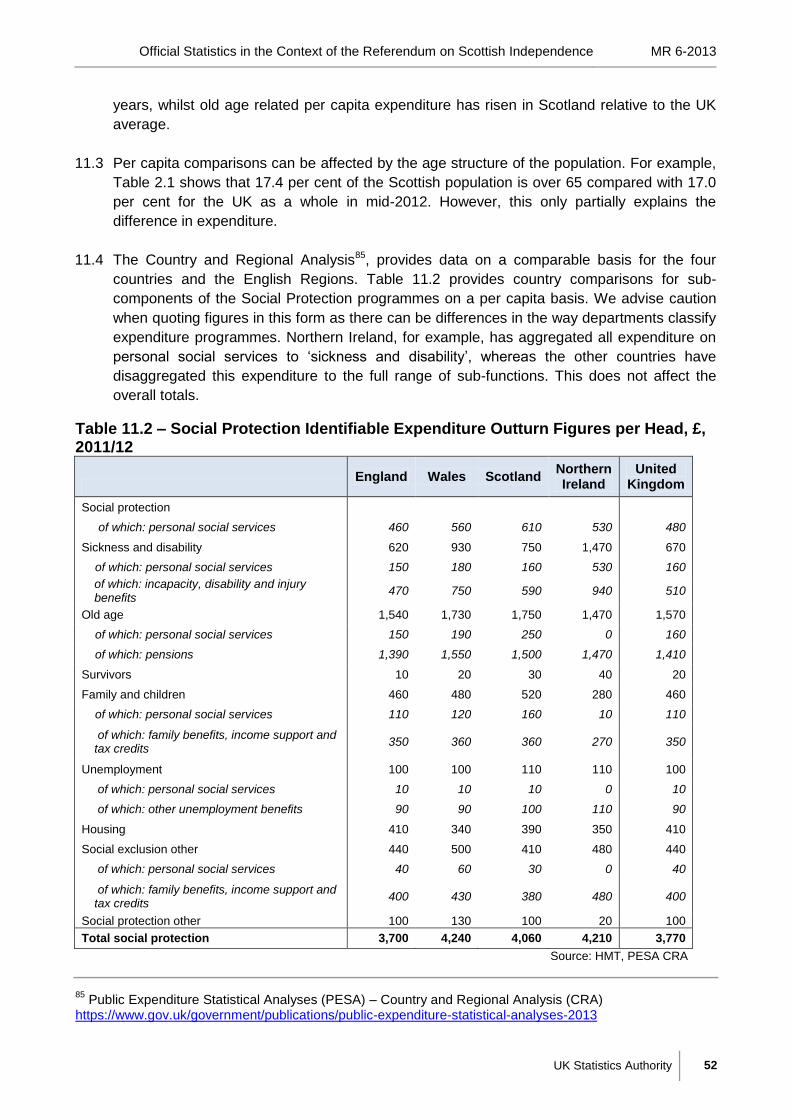
Official Statistics in the Context of the Referendum on Scottish Independence MR 6-2013
UK Statistics Authority 52
years, whilst old age related per capita expenditure has risen in Scotland relative to the UK
average.
11.3 Per capita comparisons can be affected by the age structure of the population. For example,
Table 2.1 shows that 17.4 per cent of the Scottish population is over 65 compared with 17.0
per cent for the UK as a whole in mid-2012. However, this only partially explains the
difference in expenditure.
11.4 The Country and Regional Analysis85, provides data on a comparable basis for the four
countries and the English Regions. Table 11.2 provides country comparisons for sub-
components of the Social Protection programmes on a per capita basis. We advise caution
when quoting figures in this form as there can be differences in the way departments classify
expenditure programmes. Northern Ireland, for example, has aggregated all expenditure on
personal social services to „sickness and disability‟, whereas the other countries have
disaggregated this expenditure to the full range of sub-functions. This does not affect the
overall totals.
Table 11.2 – Social Protection Identifiable Expenditure Outturn Figures per Head, £, 2011/12
England Wales Scotland
Northern Ireland
United Kingdom
Social protection
of which: personal social services 460 560 610 530 480
Sickness and disability 620 930 750 1,470 670
of which: personal social services 150 180 160 530 160
of which: incapacity, disability and injury benefits
470 750 590 940 510
Old age 1,540 1,730 1,750 1,470 1,570
of which: personal social services 150 190 250 0 160
of which: pensions 1,390 1,550 1,500 1,470 1,410
Survivors 10 20 30 40 20
Family and children 460 480 520 280 460
of which: personal social services 110 120 160 10 110
of which: family benefits, income support and tax credits
350 360 360 270 350
Unemployment 100 100 110 110 100
of which: personal social services 10 10 10 0 10
of which: other unemployment benefits 90 90 100 110 90
Housing 410 340 390 350 410
Social exclusion other 440 500 410 480 440
of which: personal social services 40 60 30 0 40
of which: family benefits, income support and tax credits
400 430 380 480 400
Social protection other 100 130 100 20 100
Total social protection 3,700 4,240 4,060 4,210 3,770
Source: HMT, PESA CRA
85
Public Expenditure Statistical Analyses (PESA) – Country and Regional Analysis (CRA) https://www.gov.uk/government/publications/public-expenditure-statistical-analyses-2013
Official Statistics in the Context of the Referendum on Scottish Independence MR 6-2013
UK Statistics Authority 53
11.5 Table 11.2 shows how per capita expenditure in Scotland compares with the other countries
of the UK. It indicates that expenditure on some of the programmes are broadly similar to the
UK as a whole (e.g. unemployment, housing, social exclusion and social protection other).
However, expenditure on sickness and disability, old age and family and children, are
relatively higher in Scotland on a per capita basis. Expenditure per capita on personal social
services, which is aggregated from a range of sub-functions, was 27 per cent higher in
Scotland than in the UK in 2011-12, but lower than in Wales or Northern Ireland.
Summary of advice
Social protection is mainly a reserved function (i.e. managed by a Whitehall department),
and therefore Scotland is – in effect - allocated a share of the UK budget based on relative
need to spend, rather than on the formula allocation for devolved functions.
Official Statistics in the Context of the Referendum on Scottish Independence MR 6-2013
UK Statistics Authority 54
SECTION 12: HEALTH
12.1 The provision of health and social care services is the responsibility of each of the devolved
administrations and there are consequently differences in the way these services operate in
Scotland compared with the other UK countries, and also in the methods used to monitor and
report on them. For example, the ways in which waiting times and patient outcomes are
measured are different. But there are also differences that affect funding requirements -
Scotland does not charge for prescriptions or for some aspects of personal care that would
be charged for in England.
12.2 Health and social care is a large topic. This section covers only some specific aspects –
expenditure on health, the state of public health and factors affecting health.
12.3 Health care is intrinsically linked with the provision of social care, and some services may be
provided in different ways by different providers in different countries and regions. In effect,
some kinds of care could be health care in one place and social care in another. Users of the
statistics need also to be aware that the presentation of this information may differ between
publications – expenditure data, for example, relates to health as defined by the UN
Classification of Function of Government (COFOG)86 definition, whereas economic data are
usually published for health and social care, as defined by the SIC industrial classification.
Expenditure on Health
12.4 Expressing expenditure on a per capita basis allows comparisons to be made between
geographical areas but it should be remembered that the per capita cost is the average cost
to the whole population in the area, but not the average cost per recipient of the service. So,
for example, an area with more elderly people will likely have higher per capita expenditure
on care for the elderly even if the cost per recipient is the same.
12.5 Table 12.1 shows that annual identifiable expenditure on health in Scotland per capita has
been higher than in the UK as a whole for each of the past five years. These figures were
taken from the Country and Regional analysis (CRA)87 from the HM Treasury Public
Expenditure Statistical Analyses (PESA) publication. For a comparison of Total Managed
Expenditure for Scotland and the UK, users should refer to the GERS88 publication, but this
does not contain comparable figures for Wales, Northern Ireland and the English regions.
86
http://unstats.un.org/unsd/iiss/Classification-of-the-Functions-of-Government-COFOG.ashx 87
https://www.gov.uk/government/publications/public-expenditure-statistical-analyses-2013 88
http://www.scotland.gov.uk/Topics/Statistics/Browse/Economy/GERS
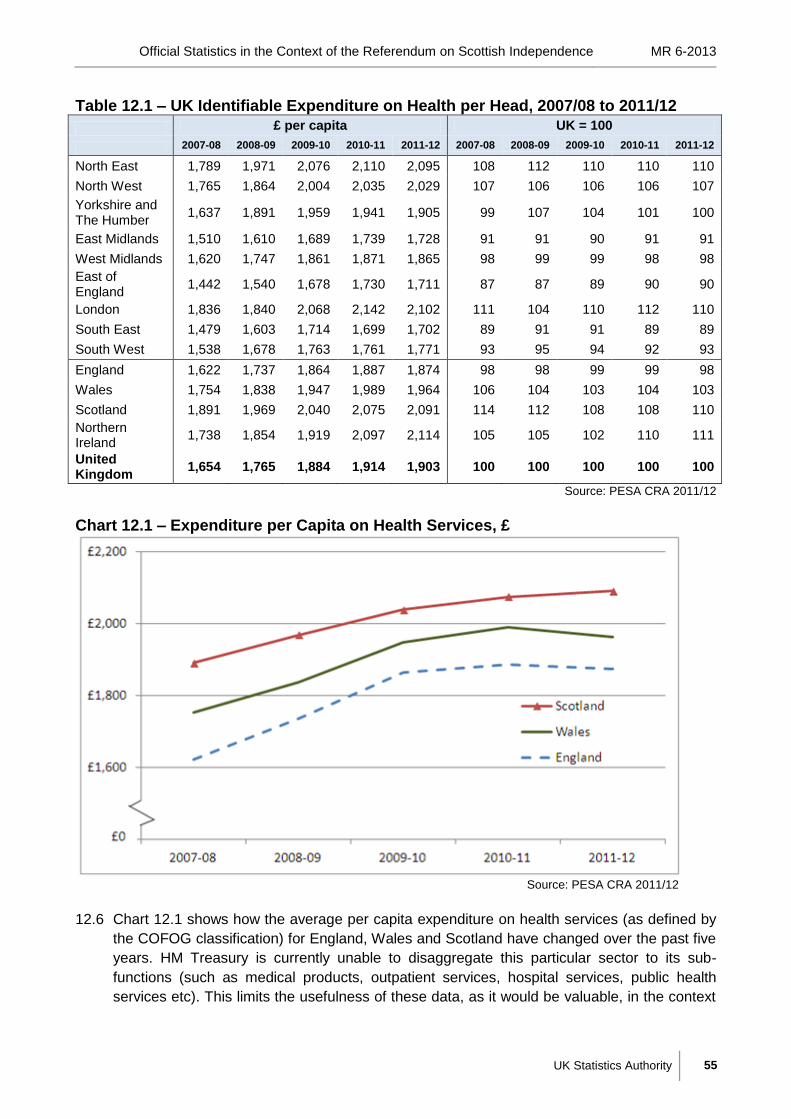
Official Statistics in the Context of the Referendum on Scottish Independence MR 6-2013
UK Statistics Authority 55
Table 12.1 – UK Identifiable Expenditure on Health per Head, 2007/08 to 2011/12
£ per capita UK = 100
2007-08 2008-09 2009-10 2010-11 2011-12 2007-08 2008-09 2009-10 2010-11 2011-12
North East 1,789 1,971 2,076 2,110 2,095 108 112 110 110 110
North West 1,765 1,864 2,004 2,035 2,029 107 106 106 106 107
Yorkshire and The Humber
1,637 1,891 1,959 1,941 1,905 99 107 104 101 100
East Midlands 1,510 1,610 1,689 1,739 1,728 91 91 90 91 91
West Midlands 1,620 1,747 1,861 1,871 1,865 98 99 99 98 98
East of England
1,442 1,540 1,678 1,730 1,711 87 87 89 90 90
London 1,836 1,840 2,068 2,142 2,102 111 104 110 112 110
South East 1,479 1,603 1,714 1,699 1,702 89 91 91 89 89
South West 1,538 1,678 1,763 1,761 1,771 93 95 94 92 93
England 1,622 1,737 1,864 1,887 1,874 98 98 99 99 98
Wales 1,754 1,838 1,947 1,989 1,964 106 104 103 104 103
Scotland 1,891 1,969 2,040 2,075 2,091 114 112 108 108 110
Northern Ireland
1,738 1,854 1,919 2,097 2,114 105 105 102 110 111
United Kingdom
1,654 1,765 1,884 1,914 1,903 100 100 100 100 100
Source: PESA CRA 2011/12
Chart 12.1 – Expenditure per Capita on Health Services, £
Source: PESA CRA 2011/12
12.6 Chart 12.1 shows how the average per capita expenditure on health services (as defined by
the COFOG classification) for England, Wales and Scotland have changed over the past five
years. HM Treasury is currently unable to disaggregate this particular sector to its sub-
functions (such as medical products, outpatient services, hospital services, public health
services etc). This limits the usefulness of these data, as it would be valuable, in the context

Official Statistics in the Context of the Referendum on Scottish Independence MR 6-2013
UK Statistics Authority 56
of the debate, to be able to make comparisons of expenditure in more detail on a consistent
basis. Note: figures for Northern Ireland are not included in this chart as the published figures
are expected to be revised. A National Audit Office (NAO) report89 notes that the published
PESA 2010/11 figures for Northern Ireland were wrong and there is a footnote to explain this.
12.7 Users should also note a technical point - that the CRA analysis is carried out using an
earlier extract of the PESA database than that used for the other analyses in PESA, and data
in tables throughout PESA may not be wholly consistent for this reason. This is not a major
problem but explains occasional anomalies. For the departmental analysis in PESA, NHS
England is identified as a separate department. However, NHS expenditure in Scotland is
contained within the Scottish Government‟s department spend – similarly for Wales and
Northern Ireland.
12.8 Scotland‟s higher relative expenditure may be partly explained by known factors – the high
prevalence of deprived areas with chronic health problems and a much lower population
density than the UK average, both of which tend to increase the per capita cost of services.
But, given the non-comparability of the official Index of Multiple Deprivation for each
country90, the former cannot be proven.
12.9 Chart 12.2 is taken from the publication „Summary of Scottish Health Service Costs‟91 to
illustrate an example of how health services costs (in this case A&E costs) vary between
health boards in Scotland. This shows that costs per patient in the more remote areas (for
example Highlands, Orkney, Western Isles and Shetland) are higher.
89
http://www.nao.org.uk/wp-content/uploads/2012/06/1213192.pdf, page 4 90
England: https://www.gov.uk/government/publications/english-indices-of-deprivation-2010 , Wales: http://new.wales.gov.uk/topics/statistics/theme/wimd/?lang=en , Scotland: http://www.scotland.gov.uk/Topics/Statistics/SIMD , Northern Ireland: http://www.nisra.gov.uk/deprivation/nimdm_2010.htm 91
http://www.isdscotland.org/Health-Topics/Finance/Costs/
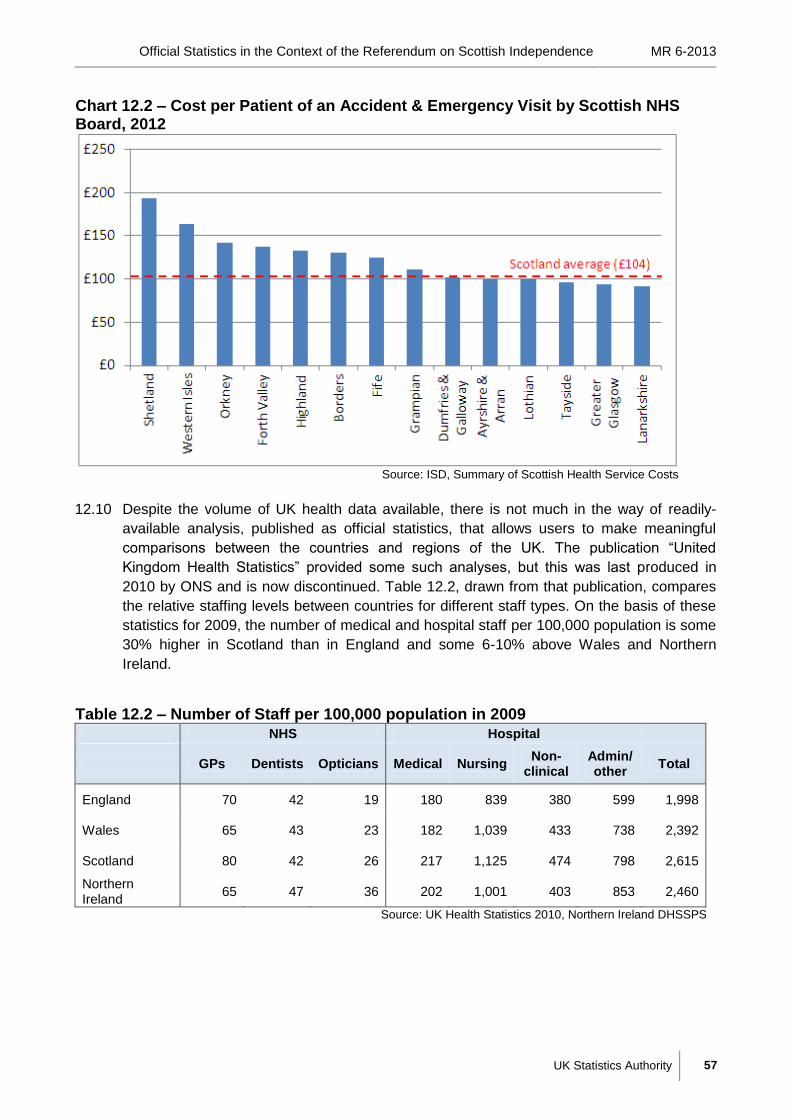
Official Statistics in the Context of the Referendum on Scottish Independence MR 6-2013
UK Statistics Authority 57
Chart 12.2 – Cost per Patient of an Accident & Emergency Visit by Scottish NHS Board, 2012
Source: ISD, Summary of Scottish Health Service Costs
12.10 Despite the volume of UK health data available, there is not much in the way of readily-
available analysis, published as official statistics, that allows users to make meaningful
comparisons between the countries and regions of the UK. The publication “United
Kingdom Health Statistics” provided some such analyses, but this was last produced in
2010 by ONS and is now discontinued. Table 12.2, drawn from that publication, compares
the relative staffing levels between countries for different staff types. On the basis of these
statistics for 2009, the number of medical and hospital staff per 100,000 population is some
30% higher in Scotland than in England and some 6-10% above Wales and Northern
Ireland.
Table 12.2 – Number of Staff per 100,000 population in 2009
NHS Hospital
GPs Dentists Opticians Medical Nursing Non-
clinical Admin/ other
Total
England 70 42 19 180 839 380 599 1,998
Wales 65 43 23 182 1,039 433 738 2,392
Scotland 80 42 26 217 1,125 474 798 2,615
Northern Ireland
65 47 36 202 1,001 403 853 2,460
Source: UK Health Statistics 2010, Northern Ireland DHSSPS
Official Statistics in the Context of the Referendum on Scottish Independence MR 6-2013
UK Statistics Authority 58
Public health
12.11 As indicated above, there is not a great amount of comparable health statistics across the
four UK administrations. The UK Statistics Authority published a Monitoring Review in
October 2012 concerning „The accessibility of official statistics on health”92. It observed that
“It is clear that a wealth of relevant official statistics exists, and that they serve a wide range
of different user needs. But this review also points to the fragmented nature of those
statistics, attributable partly (but only partly) to the devolution of health policy in the UK to
England, Scotland, Wales and Northern Ireland. The statistics are produced by many
different organisations, with different responsibilities and are provided by a range of NHS
bodies but also by the private sector. Some statistics are drawn from surveys, but most are
a by-product of administrative systems, and their quality is described variously.”
12.12 To make some broad comparisons between the UK countries, a few public health examples
have been identified below, where comparable statistics are available. These examples are
intended mainly for illustrative purposes, and this is not an attempt to provide a
comprehensive analysis in any way.
12.13 Official statistics are available from ONS and the Scottish Government on life expectancy
and healthy life expectancy. Life expectancy (LE) predicts the number of years that a
person can expect to live on average, and is used to monitor population mortality and to
measure health trends and inequalities within the population. Healthy life expectancy (HLE)
is a quality of health measure, which combines life expectancy and self-assessed health
from survey data.
92
http://www.statisticsauthority.gov.uk/assessment/monitoring/monitoring-reviews/index.html
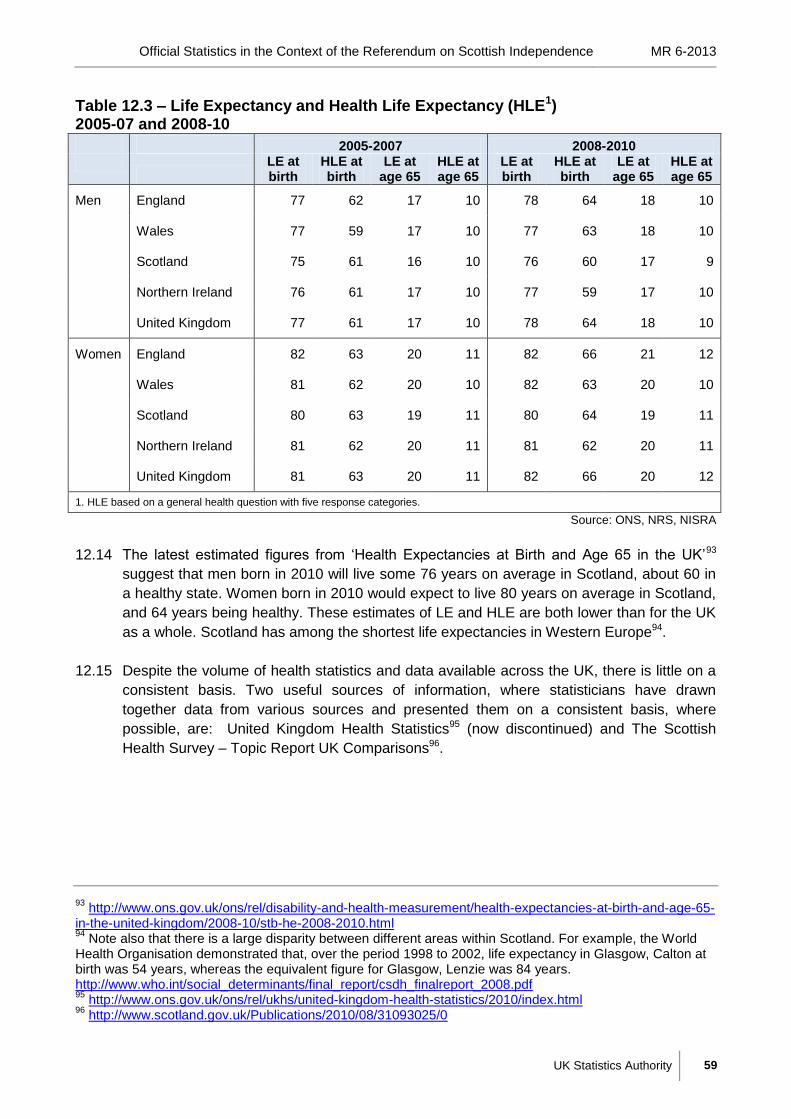
Official Statistics in the Context of the Referendum on Scottish Independence MR 6-2013
UK Statistics Authority 59
Table 12.3 – Life Expectancy and Health Life Expectancy (HLE1) 2005-07 and 2008-10
2005-2007 2008-2010
LE at birth
HLE at birth
LE at age 65
HLE at age 65
LE at birth
HLE at birth
LE at age 65
HLE at age 65
Men England 77 62 17 10 78 64 18 10
Wales 77 59 17 10 77 63 18 10
Scotland 75 61 16 10 76 60 17 9
Northern Ireland 76 61 17 10 77 59 17 10
United Kingdom 77 61 17 10 78 64 18 10
Women England 82 63 20 11 82 66 21 12
Wales 81 62 20 10 82 63 20 10
Scotland 80 63 19 11 80 64 19 11
Northern Ireland 81 62 20 11 81 62 20 11
United Kingdom 81 63 20 11 82 66 20 12
1. HLE based on a general health question with five response categories.
Source: ONS, NRS, NISRA
12.14 The latest estimated figures from „Health Expectancies at Birth and Age 65 in the UK‟93
suggest that men born in 2010 will live some 76 years on average in Scotland, about 60 in
a healthy state. Women born in 2010 would expect to live 80 years on average in Scotland,
and 64 years being healthy. These estimates of LE and HLE are both lower than for the UK
as a whole. Scotland has among the shortest life expectancies in Western Europe94.
12.15 Despite the volume of health statistics and data available across the UK, there is little on a
consistent basis. Two useful sources of information, where statisticians have drawn
together data from various sources and presented them on a consistent basis, where
possible, are: United Kingdom Health Statistics95 (now discontinued) and The Scottish
Health Survey – Topic Report UK Comparisons96.
93
http://www.ons.gov.uk/ons/rel/disability-and-health-measurement/health-expectancies-at-birth-and-age-65-in-the-united-kingdom/2008-10/stb-he-2008-2010.html 94
Note also that there is a large disparity between different areas within Scotland. For example, the World Health Organisation demonstrated that, over the period 1998 to 2002, life expectancy in Glasgow, Calton at birth was 54 years, whereas the equivalent figure for Glasgow, Lenzie was 84 years. http://www.who.int/social_determinants/final_report/csdh_finalreport_2008.pdf 95
http://www.ons.gov.uk/ons/rel/ukhs/united-kingdom-health-statistics/2010/index.html 96
http://www.scotland.gov.uk/Publications/2010/08/31093025/0

Official Statistics in the Context of the Referendum on Scottish Independence MR 6-2013
UK Statistics Authority 60
Table 12.4 – Self Assessed General Health, Proportion as Good or Very Good, 2010
Age
Total 16-24 25-34 35-44 45-54 55-64 65-74 75+
Men England 88% 86% 82% 77% 68% 61% 52% 76%
Scotland 88% 88% 82% 78% 66% 61% 55% 76%
Northern Ireland 85% 87% 78% 64% 60% 60% 45% 72%
Women England 88% 86% 82% 76% 70% 62% 49% 75%
Scotland 86% 85% 82% 75% 69% 64% 51% 75%
Northern Ireland 90% 84% 82% 70% 61% 58% 46% 73%
Note: the Welsh Health Survey‟s method of measuring health conditions is not comparable
Source: The Scottish Health Survey, UK comparisons 2010, NI DHSSPS
12.16 Table 12.4 shows how self assessed general health, by age and sex, differs between the
three UK countries where broadly comparable survey data exist. For both men and women,
there does not appear to be a significant difference between the countries for the adult
population as a whole. In the over 75 population, Scotland has a higher proportion of
people who consider their health to be good or very good than in England. However, self-
assessed general health is not necessarily consistent between different areas and
communities. People in one community may have a different perception of the state of
health they can reasonably expect compared with another community.
Table 12.5 – Prevalence of any Cardio Vascular Disease, by Country, Age and Sex
Age
Total 16-24 25-34 35-44 45-54 55-64 65-74 75+
Men England 3.2% 4.7% 5.6% 10.9% 18.5% 34.1% 44.4% 13.6%
Scotland 4.9% 5.9% 6.8% 10.3% 22.0% 35.8% 45.0% 15.1%
Northern Ireland 4.4% 3.9% 4.7% 12.5% 24.4% 36.3% 43.6% 13.7%
Women England 4.5% 5.7% 7.8% 10.3% 15.2% 21.2% 36.9% 13.0%
Scotland 6.4% 5.7% 8.8% 12.9% 18.9% 30.9% 35.5% 15.5%
Northern Ireland 2.1% 5.1% 7.1% 10.0% 14.8% 27.8% 40.3% 12.8%
Note: the Welsh Health Survey‟s method of measuring health conditions is not comparable
Source: The Scottish Health Survey, UK comparisons 2010
12.17 From table 12.5, for both men and women, Scotland has a higher prevalence of cardio
vascular disease than England. This is the case for all the age-bands reported, but the
difference is particularly noticeable for males aged 55-64 and for females, aged 65-74.
12.18 A recent report by the National Audit Office “Healthcare across the UK: A comparison of the
NHS in England, Scotland, Wales and Northern Ireland”97 sought to compare the four
nations of the UK by setting out comparable data, where available, on health outcomes,
and on the delivery and performance of the health services. It concluded that (paragraphs
22-24): “We found limited availability and consistency of data across the four nations,
restricting the extent to which meaningful comparisons can be made between the health
services of the UK. For this reason, and without a single overarching measure of
97
http://www.nao.org.uk/report/healthcare-across-the-uk-a-comparison-of-the-nhs-in-england-scotland-wales-and-northern-ireland/

Official Statistics in the Context of the Referendum on Scottish Independence MR 6-2013
UK Statistics Authority 61
performance, we cannot draw conclusions about which health service is achieving the best value for money. Where comparative data are available, we found that no one nation has been consistently more economic, efficient or effective across the indicators we considered.”
Factors affecting health 12.19 There are numerous factors that may affect public health. Table 12.6 offers a few
examples, derived from official statistics, to illustrate differences between the UK countries. Again, this is largely for illustrative purposes, and not intended as a comprehensive account.
Table 12.6 – Factors Affecting Health
England Wales Scotland Northern Ireland
United Kingdom
Proportion of population over 75 (2012) 7.9% 8.7% 7.9% 6.7% 7.9%
Proportion of population 16 to 64 (2012) 64.1% 62.8% 65.4% 64.1% 64.2%
Proportion of population under 16 (2012) 18.9% 18.1% 17.2% 21.0% 18.8%
Average Gross Disposable Household Income in 2011 (£ per head)
£16,300 £14,100 £15,700 £14,000 £16,000
Working Age Adults with a disability 14% 17% 15% 15% 14%
Current smokers (men) (E,W,S 2008; NI 2008/09)
21% 20% 23% 26% 21%
Current smokers (women) (E,W,S 2008; NI 2008/09)
20% 21% 24% 23% 20%
Mean alcohol units on heaviest drinking day in past week (men 16+), (2008)
4.3 - 6.2 - -
Mean alcohol units on heaviest drinking day in past week (women 16+), (2008)
2.2 - 3.5 - -
Proportion of adult men with a BMI classed as ‘overweight or obese’ (2008) – E and S only, NI (2011/12)
66% - 69% 67% -
Proportion of adult women with a BMI classed as ‘overweight or obese’ (2008) – E and S only, NI (2011/12)
57% - 62% 53% -
People with a disability (working age) (2008/09)
14% 17% 15% 15% 14%
People with a disability (over 75) (2008/09) 59% 60% 55% 62% 59%
Proportion of adults eating at least five portions of fruit and vegetables per day (men) (2008) – GB only, NI (2011/12)
25% - 20% 27% 25%
Proportion of adults eating at least five portions of fruit and vegetables per day (women) (2008) – GB only, NI (2011/12)
29% - 24% 36% 29%
Source: UK Health Statistics, SHS, ONS Regional GDHI, Health Survey Northern Ireland
12.20 Table 12.6 shows that, while Scotland does not have a significantly different gross
disposable household income from the UK as a whole, there are lifestyle differences which may, in part, explain the nations’ poorer health record. Scotland has a higher proportion of smokers than in the UK as a whole (and they tend to smoke more). Both males and females in Scotland drank more on average, on the heaviest drinking day in the past week, than in England. These two factors contribute to Scotland’s higher relative tax intake for tobacco and alcohol duties (see Section 6). The Scottish population also suffers from relatively high overweight and obesity levels.
Official Statistics in the Context of the Referendum on Scottish Independence MR 6-2013
UK Statistics Authority 62
Summary of advice
HM Treasury‟s Public Expenditure Statistical Analyses (PESA) report indicates that
Scotland spends more per head on health than the UK as a whole. Various contributory
factors, including poorer public health and lower population density (leading to higher per
capita costs) have been cited but a full explanation would be likely to involve many factors.
Comparable statistics exist for a range of health indicators, but not generally in one
publication. Users trying to make comparisons between countries, or to collate data for the
UK as a whole, need to access different web-sites and check carefully whether definitions
are consistent. For many health and NHS indicators, comparable statistics do not currently
exist.
Advice to the statistical service
The analysis in Chapter 10 of PESA is valuable. However, unlike for other public services
such as education and social protection, it does not have a full sub-function analysis. We
note that there are plans to address this and that users are likely to find this valuable.
Official Statistics in the Context of the Referendum on Scottish Independence MR 6-2013
UK Statistics Authority 63
SECTION 13: EDUCATION
13.1 Scotland has its own distinct school education system and it is therefore difficult to make
valid comparisons between Scotland and the other UK countries. There is little in the way of
comparable data available in official statistics publications. This section largely focuses on
expenditure on education and educational attainment, where comparable data do exist.
13.2 Under the Scottish system for primary and secondary education, pupils normally spend
seven years in primary school compared with six in the rest of the UK, and have one fewer
year in secondary school. Pupils who go on to higher education often leave school a year
earlier in Scotland than in the rest of the UK, and then stay at a Scottish university for a four
year course rather than go to a university elsewhere in the UK where, for most disciplines, a
three year course is the norm. Funding arrangements for Scottish students are also different.
Pre-School Education 13.3 Statistics on pre-school children in Scotland are collected by the Care Inspectorate98 and
Scottish Government99. The Care Inspectorate publish annual data on the provision and use
of registered daycare of children and childminding services. The published Care Inspectorate
figures provide service-level information on the full range of care services for children,
including 6,000 childminding services and 4,000 daycare services. The Scottish Government
only collects information from the subset of the 4,000 daycare services that also provide pre-
school education (approximately 2,500 centres). The Scottish Government figures provide
local authority level data on participation in pre-school education as well as some
demographic child and teacher information.
13.4 Pre-school data are not comparable between Scotland and other UK countries. The key
differences which make comparison problematic are:
The age cut-off for children being assigned to a school year in Scotland is the end of
February, rather than September in England and Wales;
Scotland has a more flexible system in terms of when a child starts primary school
(with children born in January or February given the option to defer entry to primary
school by a year); and
There are no key stages in Scotland and no attainment data for pre-school children, as
is the case for England and Wales.
Expenditure on education 13.5 Identifiable expenditure on education for each country of the UK is published in HM
Treasury‟s Public Expenditure Statistical Analyses (PESA) publication in the Country and
Regional Analysis (CRA)100. This provides information on the total identifiable expenditure
disaggregated by sub-function for the past five years and is presented as cash outturn
estimates and outturn per capita of the total population. We are not aware of any readily
98
http://www.scswis.com/index.php?option=com_content&view=article&id=8146&Itemid=756 99
http://www.scotland.gov.uk/Topics/Statistics/Browse/Children/Pubs-Pre-SchoolEducation 100
https://www.gov.uk/government/publications/public-expenditure-statistical-analyses-2013
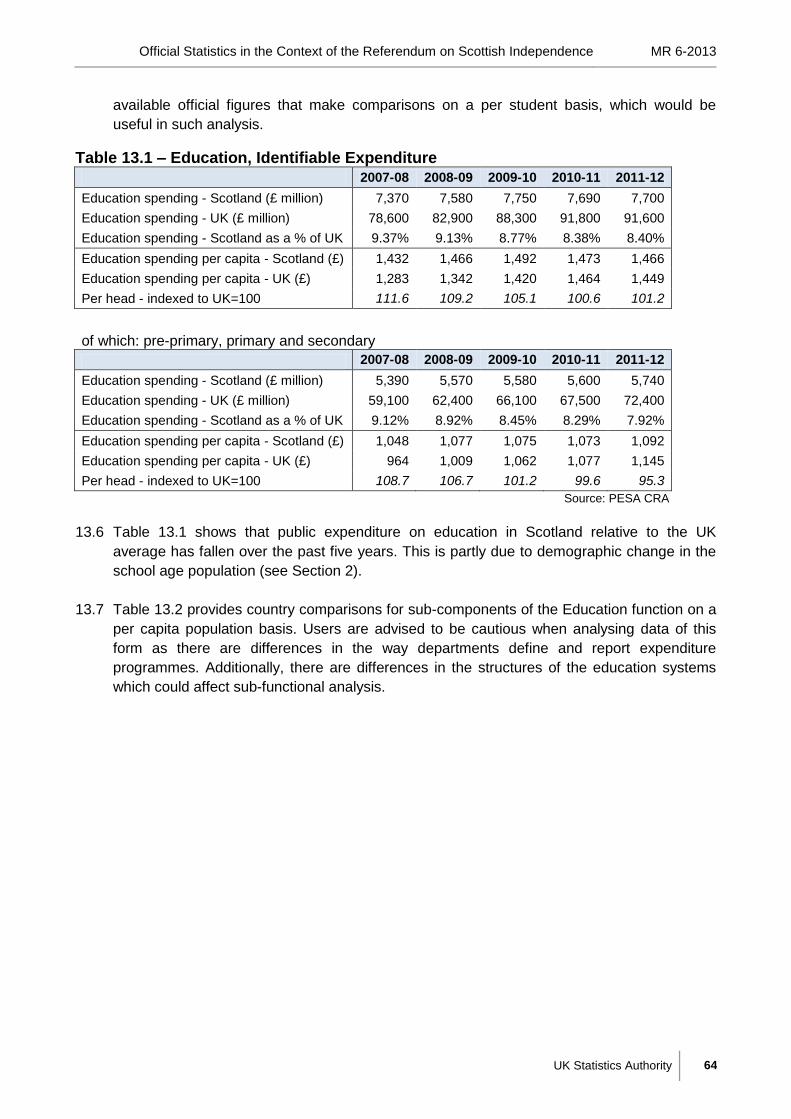
Official Statistics in the Context of the Referendum on Scottish Independence MR 6-2013
UK Statistics Authority 64
available official figures that make comparisons on a per student basis, which would be
useful in such analysis.
Table 13.1 – Education, Identifiable Expenditure
2007-08 2008-09 2009-10 2010-11 2011-12
Education spending - Scotland (£ million) 7,370 7,580 7,750 7,690 7,700
Education spending - UK (£ million) 78,600 82,900 88,300 91,800 91,600
Education spending - Scotland as a % of UK 9.37% 9.13% 8.77% 8.38% 8.40%
Education spending per capita - Scotland (£) 1,432 1,466 1,492 1,473 1,466
Education spending per capita - UK (£) 1,283 1,342 1,420 1,464 1,449
Per head - indexed to UK=100 111.6 109.2 105.1 100.6 101.2
of which: pre-primary, primary and secondary
2007-08 2008-09 2009-10 2010-11 2011-12
Education spending - Scotland (£ million) 5,390 5,570 5,580 5,600 5,740
Education spending - UK (£ million) 59,100 62,400 66,100 67,500 72,400
Education spending - Scotland as a % of UK 9.12% 8.92% 8.45% 8.29% 7.92%
Education spending per capita - Scotland (£) 1,048 1,077 1,075 1,073 1,092
Education spending per capita - UK (£) 964 1,009 1,062 1,077 1,145
Per head - indexed to UK=100 108.7 106.7 101.2 99.6 95.3
Source: PESA CRA
13.6 Table 13.1 shows that public expenditure on education in Scotland relative to the UK
average has fallen over the past five years. This is partly due to demographic change in the
school age population (see Section 2).
13.7 Table 13.2 provides country comparisons for sub-components of the Education function on a
per capita population basis. Users are advised to be cautious when analysing data of this
form as there are differences in the way departments define and report expenditure
programmes. Additionally, there are differences in the structures of the education systems
which could affect sub-functional analysis.
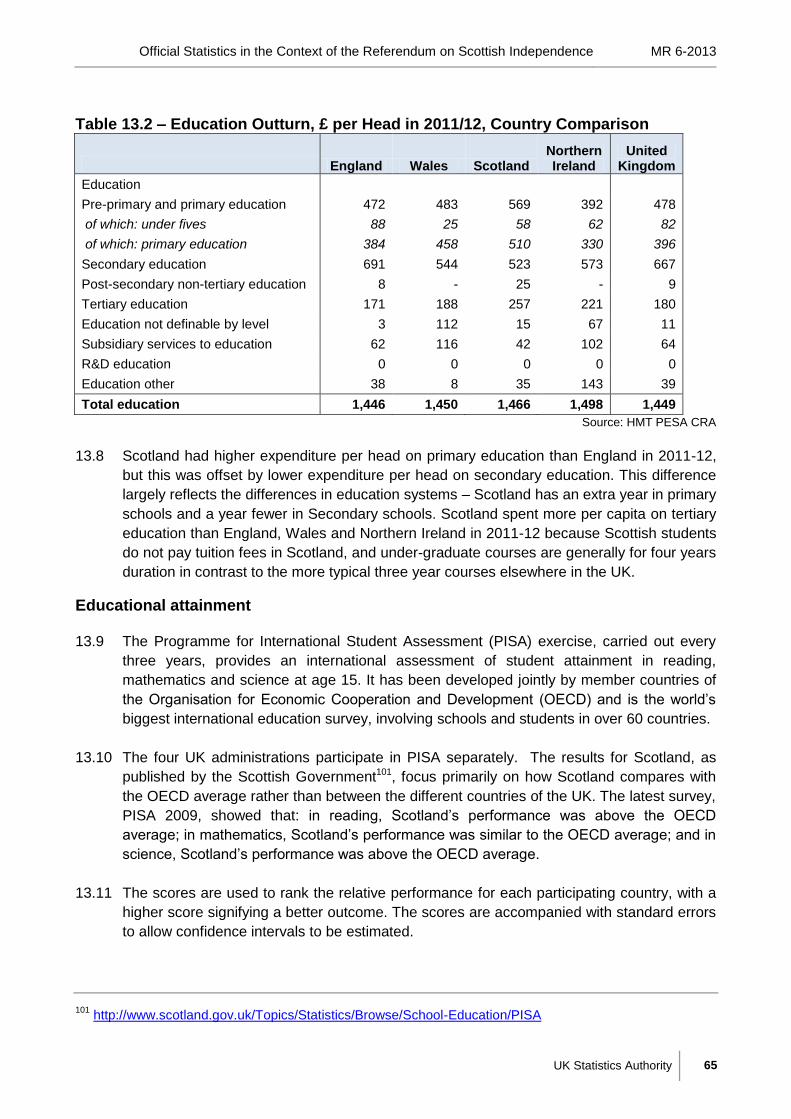
Official Statistics in the Context of the Referendum on Scottish Independence MR 6-2013
UK Statistics Authority 65
Table 13.2 – Education Outturn, £ per Head in 2011/12, Country Comparison
England Wales Scotland Northern Ireland
United Kingdom
Education
Pre-primary and primary education 472 483 569 392 478
of which: under fives 88 25 58 62 82
of which: primary education 384 458 510 330 396
Secondary education 691 544 523 573 667
Post-secondary non-tertiary education 8 - 25 - 9
Tertiary education 171 188 257 221 180
Education not definable by level 3 112 15 67 11
Subsidiary services to education 62 116 42 102 64
R&D education 0 0 0 0 0
Education other 38 8 35 143 39
Total education 1,446 1,450 1,466 1,498 1,449
Source: HMT PESA CRA
13.8 Scotland had higher expenditure per head on primary education than England in 2011-12,
but this was offset by lower expenditure per head on secondary education. This difference
largely reflects the differences in education systems – Scotland has an extra year in primary
schools and a year fewer in Secondary schools. Scotland spent more per capita on tertiary
education than England, Wales and Northern Ireland in 2011-12 because Scottish students
do not pay tuition fees in Scotland, and under-graduate courses are generally for four years
duration in contrast to the more typical three year courses elsewhere in the UK.
Educational attainment 13.9 The Programme for International Student Assessment (PISA) exercise, carried out every
three years, provides an international assessment of student attainment in reading,
mathematics and science at age 15. It has been developed jointly by member countries of
the Organisation for Economic Cooperation and Development (OECD) and is the world‟s
biggest international education survey, involving schools and students in over 60 countries.
13.10 The four UK administrations participate in PISA separately. The results for Scotland, as
published by the Scottish Government101, focus primarily on how Scotland compares with
the OECD average rather than between the different countries of the UK. The latest survey,
PISA 2009, showed that: in reading, Scotland‟s performance was above the OECD
average; in mathematics, Scotland‟s performance was similar to the OECD average; and in
science, Scotland‟s performance was above the OECD average.
13.11 The scores are used to rank the relative performance for each participating country, with a
higher score signifying a better outcome. The scores are accompanied with standard errors
to allow confidence intervals to be estimated.
101
http://www.scotland.gov.uk/Topics/Statistics/Browse/School-Education/PISA
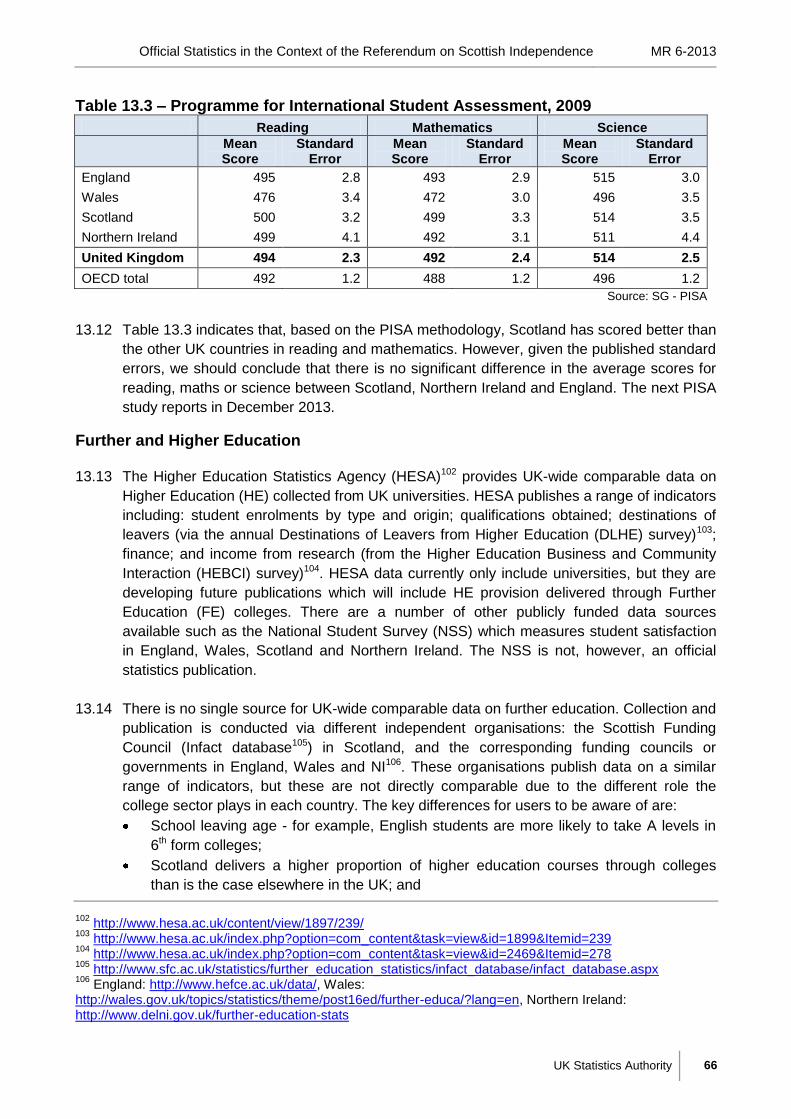
Official Statistics in the Context of the Referendum on Scottish Independence MR 6-2013
UK Statistics Authority 66
Table 13.3 – Programme for International Student Assessment, 2009
Reading Mathematics Science
Mean Score
Standard Error
Mean Score
Standard Error
Mean Score
Standard Error
England 495 2.8 493 2.9 515 3.0
Wales 476 3.4 472 3.0 496 3.5
Scotland 500 3.2 499 3.3 514 3.5
Northern Ireland 499 4.1 492 3.1 511 4.4
United Kingdom 494 2.3 492 2.4 514 2.5
OECD total 492 1.2 488 1.2 496 1.2
Source: SG - PISA
13.12 Table 13.3 indicates that, based on the PISA methodology, Scotland has scored better than
the other UK countries in reading and mathematics. However, given the published standard
errors, we should conclude that there is no significant difference in the average scores for
reading, maths or science between Scotland, Northern Ireland and England. The next PISA
study reports in December 2013.
Further and Higher Education 13.13 The Higher Education Statistics Agency (HESA)102 provides UK-wide comparable data on
Higher Education (HE) collected from UK universities. HESA publishes a range of indicators
including: student enrolments by type and origin; qualifications obtained; destinations of
leavers (via the annual Destinations of Leavers from Higher Education (DLHE) survey)103;
finance; and income from research (from the Higher Education Business and Community
Interaction (HEBCI) survey)104. HESA data currently only include universities, but they are
developing future publications which will include HE provision delivered through Further
Education (FE) colleges. There are a number of other publicly funded data sources
available such as the National Student Survey (NSS) which measures student satisfaction
in England, Wales, Scotland and Northern Ireland. The NSS is not, however, an official
statistics publication.
13.14 There is no single source for UK-wide comparable data on further education. Collection and
publication is conducted via different independent organisations: the Scottish Funding
Council (Infact database105) in Scotland, and the corresponding funding councils or
governments in England, Wales and NI106. These organisations publish data on a similar
range of indicators, but these are not directly comparable due to the different role the
college sector plays in each country. The key differences for users to be aware of are:
School leaving age - for example, English students are more likely to take A levels in
6th form colleges;
Scotland delivers a higher proportion of higher education courses through colleges
than is the case elsewhere in the UK; and
102
http://www.hesa.ac.uk/content/view/1897/239/ 103
http://www.hesa.ac.uk/index.php?option=com_content&task=view&id=1899&Itemid=239 104
http://www.hesa.ac.uk/index.php?option=com_content&task=view&id=2469&Itemid=278 105
http://www.sfc.ac.uk/statistics/further_education_statistics/infact_database/infact_database.aspx 106
England: http://www.hefce.ac.uk/data/, Wales: http://wales.gov.uk/topics/statistics/theme/post16ed/further-educa/?lang=en, Northern Ireland: http://www.delni.gov.uk/further-education-stats

Official Statistics in the Context of the Referendum on Scottish Independence MR 6-2013
UK Statistics Authority 67
Employment in the sector is counted within the public sector in Scotland, but not in
England.
Summary of advice
The education systems for the countries of the UK are different in important respects,
and there are few comparable statistics in official statistics publications.
Public expenditure on education is collected and published by HM Treasury as part the
Public Expenditure Statistical Analyses (PESA) publication. This covers identifiable
expenditure on education expressed in cash terms and as expenditure per capita of the
whole population. No analysis is readily available on expenditure by client group (e.g.
pupil) on a comparable basis.
Scotland‟s relatively higher expenditure per capita on primary education in part reflects
that primary schools in Scotland have an extra year compared to schools in England.
From the PISA survey, last published for 2009, there appear to be no statistically
significant differences in the average scores for reading, mathematics and science
between Scotland, Northern Ireland and England.
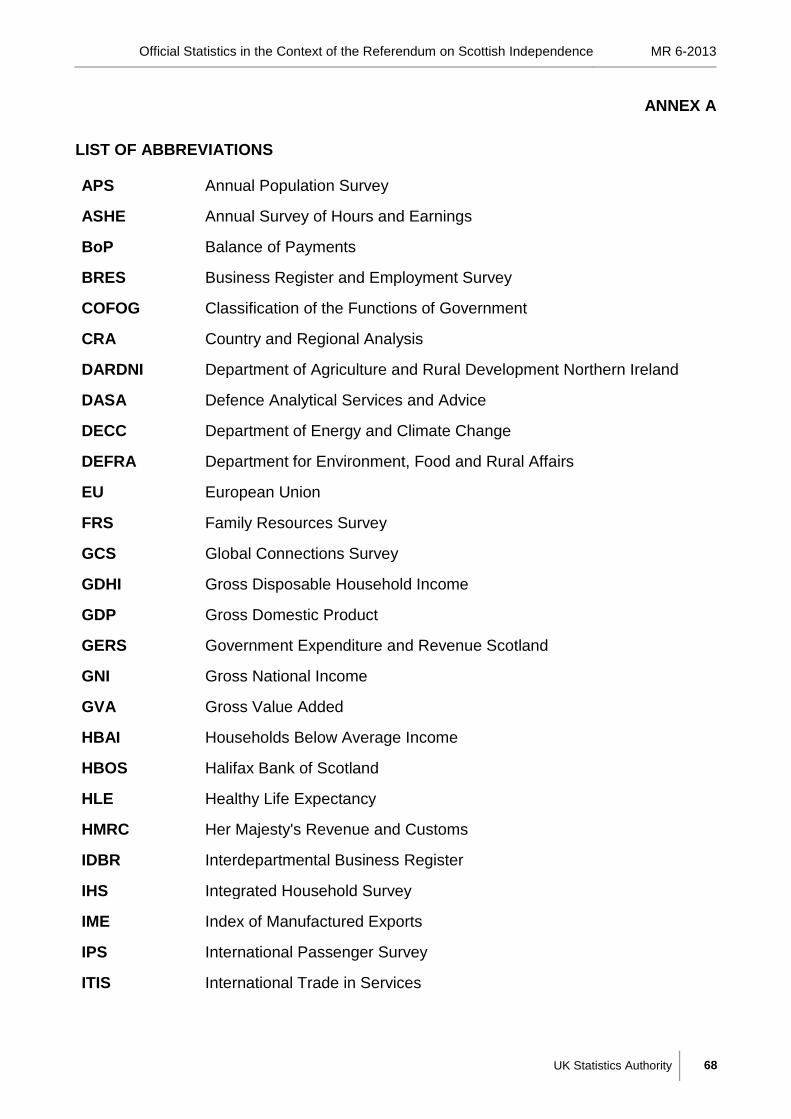
Official Statistics in the Context of the Referendum on Scottish Independence MR 6-2013
UK Statistics Authority 68
ANNEX A
LIST OF ABBREVIATIONS
APS Annual Population Survey
ASHE Annual Survey of Hours and Earnings
BoP Balance of Payments
BRES Business Register and Employment Survey
COFOG Classification of the Functions of Government
CRA Country and Regional Analysis
DARDNI Department of Agriculture and Rural Development Northern Ireland
DASA Defence Analytical Services and Advice
DECC Department of Energy and Climate Change
DEFRA Department for Environment, Food and Rural Affairs
EU European Union
FRS Family Resources Survey
GCS Global Connections Survey
GDHI Gross Disposable Household Income
GDP Gross Domestic Product
GERS Government Expenditure and Revenue Scotland
GNI Gross National Income
GVA Gross Value Added
HBAI Households Below Average Income
HBOS Halifax Bank of Scotland
HLE Healthy Life Expectancy
HMRC Her Majesty's Revenue and Customs
IDBR Interdepartmental Business Register
IHS Integrated Household Survey
IME Index of Manufactured Exports
IPS International Passenger Survey
ITIS International Trade in Services

Official Statistics in the Context of the Referendum on Scottish Independence MR 6-2013
UK Statistics Authority 69
LCFS Labour Cost and Food Survey
LE Life Expectancy
LFS Labour Force Survey
MOD Ministry Of Defence
MYE Mid Year Estimate
NHS National Health Service
ONS Office for National Statistics
PESA Public Expenditure Statistical Analysis
PISA Programme for International Student Attainment
PRT Petroleum Revenue Tax
PSES Public Sector Employment in Scotland
QNA Quarterly National Accounts
QPSES Quarterly Public Sector Employment Survey
RBS Royal Bank of Scotland
ROW Rest of The World
RUK Rest of The United Kingdom
SFC Scottish Funding Council
SG Scottish Government
SHS Scottish Health Survey
SIC Standard Industrial Classification
SITC Standard International Trade Classification
SNAP Scottish National Accounts Project
SPICE Scottish Parliament Information Centre
TME Total Managed Expenditure
UKCS United Kingdom Continental Shelf
UKSA United Kingdom Statistics Authority
UN United Nations
VAT Value Added Tax
Official Statistics in the Context of the Referendum on Scottish Independence MR 6-2013
UK Statistics Authority 70
ANNEX B
GLOSSARY
Balance of Payments: the difference between payments for exports and imports of goods, services, financial capital, and financial transfers.
Balance of Trade: the difference between the monetary value of exports and imports of goods.
Business Cycle / Economic Cycle: refers to the period of expansions and contractions in the level of Gross Domestic Product (GDP) around its long-term growth trend.
Confidence Interval: a confidence interval gives an estimated range of values which is likely to include an unknown population parameter, the estimated range being calculated from a given set of sample data. The width of a confidence interval gives us some idea about how uncertain we are about the unknown parameter.
Debt: the total stock of debt owed by the government.
Deficit: the difference between government receipts and spending in a single year, when spending is greater than receipts.
Dependency Ratio: the number of people receiving benefits or support relative to the number of people of working age or paying taxes.
Depreciation: a decrease in the value of public assets.
Disposable Income: the amount of money that individuals in the household sector have available for spending or saving after income redistribution measures (for example taxes, social contributions and benefits) have taken effect.
Extra-Regio: the part of the UK economic activity that is not allocated to a specific region. Extra-Regio includes „Continental Shelf‟ activity relating to offshore oil and gas extraction, UK embassies overseas and armed forces stationed abroad.
Fiscal Balance: the difference between government receipts and spending in a single year.
GINI Coefficient: a measure of statistical dispersion intended to represent the income distribution of a nation's residents. It measures the inequality among values of an income frequency distribution. A coefficient of zero expresses perfect equality, where all values are the same. A coefficient of one (100 on the percentile scale) expresses maximal inequality among values.

Official Statistics in the Context of the Referendum on Scottish Independence MR 6-2013
UK Statistics Authority 71
Gross Domestic Product: a measure of the value of goods and services produced before providing for capital consumption. It is equal to gross value added at basic prices plus taxes (less subsidies) on products. Alternatively, it is equal to the sum of the final domestic consumption expenditures less imports of goods and services.
Real Terms GDP: GDP adjusted for inflation to give a time series that demonstrates structural growth without the effects of price changes.
Gross National Income: a measure of the market value of all final goods and services produced by enterprises owned by a country‟s citizens.
Gross Value Added: the contribution to the economy of each individual producer, industry or sector.
Real GVA Growth: GVA adjusted for inflation to give a time series that demonstrates structural growth, excluding the effects of price changes.
Healthy Life Expectancy: a quality of health measure which predicts the number of years a person can expect to live on average, without major illnesses or impairments.
Household Savings Ratio: the value of a household‟s saving relative to its total income.
Identifiable Expenditure: expenditure that can be directly identified as having been spent for the benefit of a country or region within the UK.
Input-Output Balancing: a process of adjustments to ensure that estimates of GDP via the income, output and expenditure methods are equal in a given year or quarter.
Life Expectancy: predicts the number of years that a person can expect to live on average, and is used to monitor population mortality and to measure health trends and inequalities within the population.
Liquid Assets: assets that can quickly be turned into cash, including stocks, bonds and gold.
Non-Cash Expenditure: includes items of expenditure where no money has changed hands. This includes items such as public sector depreciation.
Non-Identifiable Expenditure: expenditure which is not allocated by HM Treasury to countries or regions in the UK because it is considered to benefit everyone equally. It includes some „collective services‟ such as defence and overseas aid, and some expenditure made for the benefit of the UK as a whole, such as public sector debt interest payments.
Satellite Account: a framework which can be attached to the national accounts to allow more detailed analysis of a certain area of the economy.
Official Statistics in the Context of the Referendum on Scottish Independence MR 6-2013
UK Statistics Authority 72
Total Managed Expenditure: the total of identifiable, non-identifiable and non-cash expenditure. This is the definition of public expenditure used in the Public Sector Finances for the fiscal balance calculations and is consistent with National Accounting definitions.