offshore wind jobs and economic development impact: … · development impact: four regional...
TRANSCRIPT

NREL is a national laboratory of the U.S. Department of Energy, Office of Energy Efficiency and Renewable Energy, operated by the Alliance for Sustainable Energy, LLC.
Offshore Wind Jobs and Economic Development Impact: Four Regional Scenarios
Suzanne Tegen, NREL
WINDExchange Webinar
November 19, 2014
NREL/PR-5000-61894

2
Overview
• NREL developed the Jobs and Economic Development Impact (JEDI) tool for fixed-bottom offshore wind projects in the United States o JEDI data from a number of sources such as the
Navigant Consortium, IMPLAN, and regional experts o Assumptions verified through peer review
• We performed analyses of potential offshore wind deployment scenarios using the JEDI model – regional case studies o Collaborated with local experts in each region o Verified results with regional experts.

3
Four Regions Analyzed by OSW JEDI Model
• Southeast Atlantic o Georgia, South Carolina, North Carolina, Virginia
• Great Lakes o New York, Pennsylvania, Ohio, Michigan, Indiana,
Illinois, Wisconsin, Minnesota • Mid-Atlantic
o Virginia, District of Columbia, Delaware, Maryland, Pennsylvania, New Jersey
• Gulf of Mexico o Texas, Louisiana, Mississippi, Alabama, Florida

4
Partnerships
• Professor Jonathan Miles, Dane Zammit, and Michelle Kraemer - James Madison University o Southeast o Mid-Atlantic
• Professor David Loomis - Illinois State University, Great Lakes Wind Collaborative o Great Lakes
Photo credit: Gary Norton / NREL PIX #27361

Offshore Wind JEDI

6
JEDI Background
• Defaults are based on real-world projects or input from project owners, developers, engineers, or other experts.
• IMPLAN input-output model is currently used as JEDI “backbone.”
• Please visit www.nrel.gov/analysis/jedi for the model, user guide, caveats, reports, and other details.
7
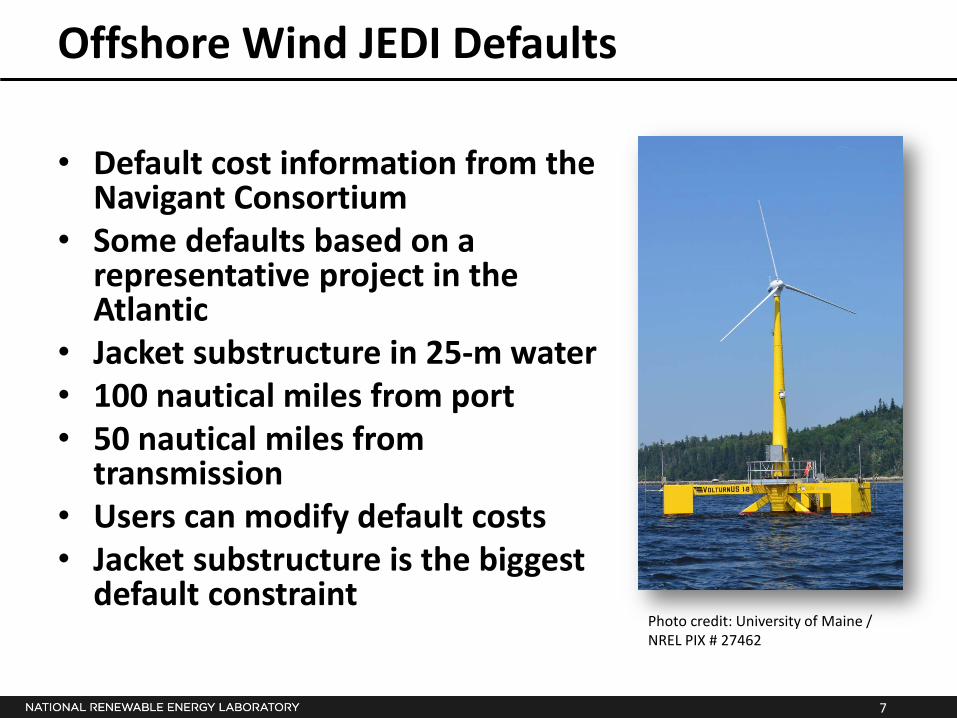
Offshore Wind JEDI Defaults
• Default cost information from the Navigant Consortium
• Some defaults based on a representative project in the Atlantic
• Jacket substructure in 25-m water • 100 nautical miles from port • 50 nautical miles from
transmission • Users can modify default costs • Jacket substructure is the biggest
default constraint Photo credit: University of Maine / NREL PIX # 27462

8
Interpreting Results and Model Limitations
• JEDI results are gross, not net. • JEDI does not factor in far-reaching impacts from
development such as changes in utility rates, greenhouse gas emissions, property values or public health.
• JEDI cannot estimate impacts from supply-side changes such as technological improvements, price changes, or changes in taxes/subsidies.
• JEDI does not evaluate a project’s feasibility or profitability.
• NREL cannot be not responsible for how the model is used, applied, or results interpreted.

9
JEDI Results
• Jobs in full-time equivalents (FTEs) o Number of people working the equivalent of 40-
hour weeks (2,080 hours/year)
• Earnings o Income from work
Photo Credit: Gamesa / NREL PIX #16001
o Includes wages, salaries, employer-provided benefits (retirement, health)
10
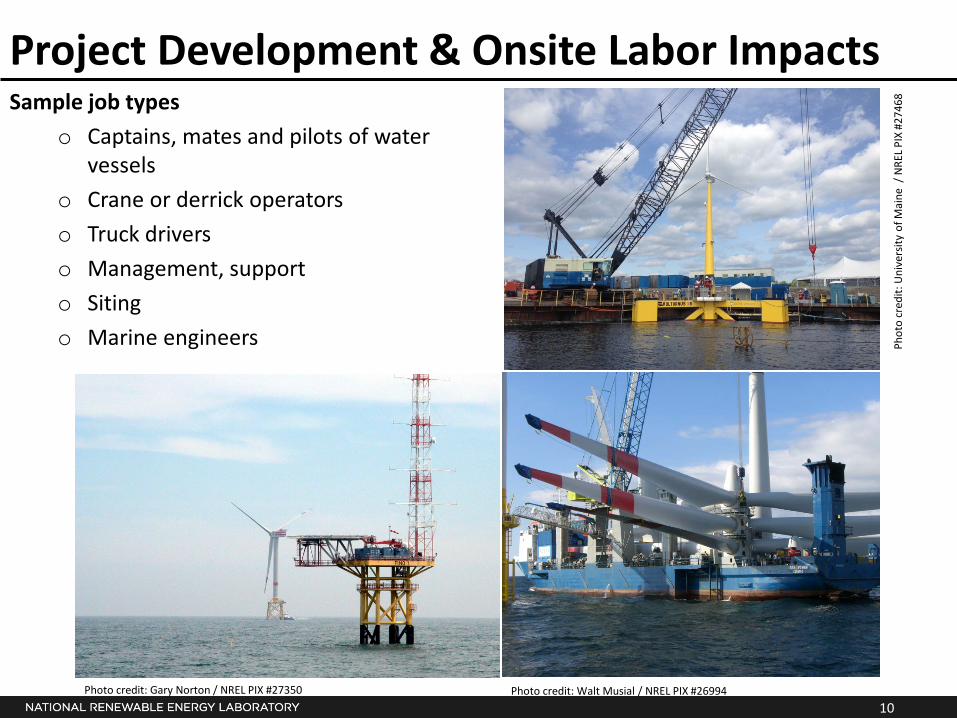
Project Development & Onsite Labor Impacts Sample job types
o Captains, mates and pilots of water vessels
o Crane or derrick operators o Truck drivers o Management, support o Siting o Marine engineers
Phot
o fr
om C
ross
Isla
nd F
arm
s, N
REL/
PIX
1992
3
Phot
o fr
om S
teph
anie
Liv
ely,
Boi
se S
tate
Uni
vers
ity, N
REL/
PIX
1614
7
Phot
o fr
om N
orth
ern
Pow
er S
yste
ms,
NRE
L/PI
X 13
853
Phot
o by
Dav
id P
arso
ns, N
REL/
PIX
0557
2
Phot
o fr
om is
tock
947
687
Photo credit: Walt Musial / NREL PIX #26994 Photo credit: Gary Norton / NREL PIX #27350
Phot
o cr
edit:
Uni
vers
ity o
f Mai
ne /
NRE
L PIX
#27
468

11
Local Revenues, Turbine, Module, & Supply Chain Impacts
• Foundries • Component manufacturers • Equipment sales and financing • Property taxes, banking, accounting
NRE
L/PI
X 11
074
Phot
o fr
om iS
tock
/567
6592
Phot
o fr
om iS
tock
/408
8468
Phot
o fr
om iS
tock
/843
3850
Photo Credit: John De La Rosa / NREL PIX #26513
Photo Credit: Dennis Schroeder / NREL PIX #22569
Photo Credit: Clipper Windpower / NREL PIX #14932
Photo from iStock/4088468
Phot
o Cr
edit:
Wal
t Mus
ial /
NRE
L PIX
#26
982

12
Induced Impacts
Money from increased revenue is spent in the local area on goods and services: sandwich shops, child care, grocery stores, clothing, other retail, public transit, new cars, restaurants, medical services.
Phot
o fr
om iS
tock
/891
3075
Phot
o fr
om iS
tock
/800
7815
Phot
o fr
om iS
tock
/327
5965
Phot
o fr
om iS
tock
/436
3756
Phot
o fr
om iS
tock
/977
4681
Phot
o fr
om iS
tock
/878
3332

Regional Case Studies

14
Southeast Atlantic Regional Findings
• Wages, project costs similar to JEDI defaults
• Several large ports well-suited to become offshore wind manufacturing hubs
• Presence of land-based wind manufacturing despite a lack of significant deployment
• 5 scenarios instead of 3 for Southeast.
Photo credit: Siemens AG / NREL PIX #19097
15
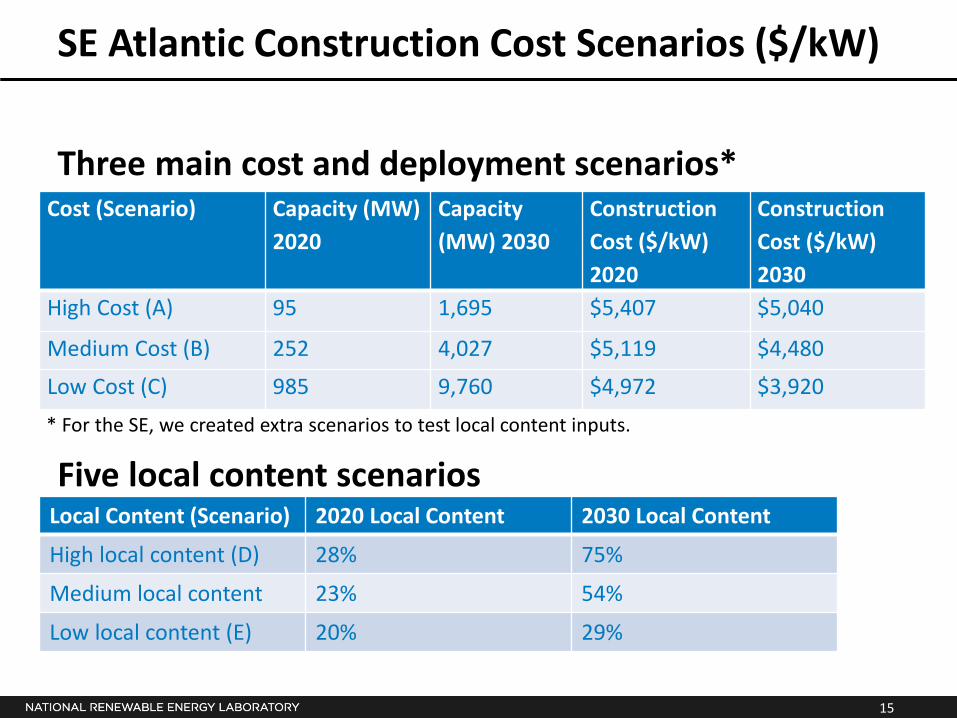
SE Atlantic Construction Cost Scenarios ($/kW)
Three main cost and deployment scenarios*
Cost (Scenario) Capacity (MW) 2020
Capacity (MW) 2030
Construction Cost ($/kW) 2020
Construction Cost ($/kW) 2030
High Cost (A) 95 1,695 $5,407 $5,040
Medium Cost (B) 252 4,027 $5,119 $4,480
Low Cost (C) 985 9,760 $4,972 $3,920
Five local content scenarios Local Content (Scenario) 2020 Local Content 2030 Local Content
High local content (D) 28% 75%
Medium local content 23% 54%
Low local content (E) 20% 29%
* For the SE, we created extra scenarios to test local content inputs.
16
-
10,000
20,000
30,000
40,000
50,000
60,000
70,000
2020 2021 2022 2023 2024 2025 2026 2027 2028 2029 2030
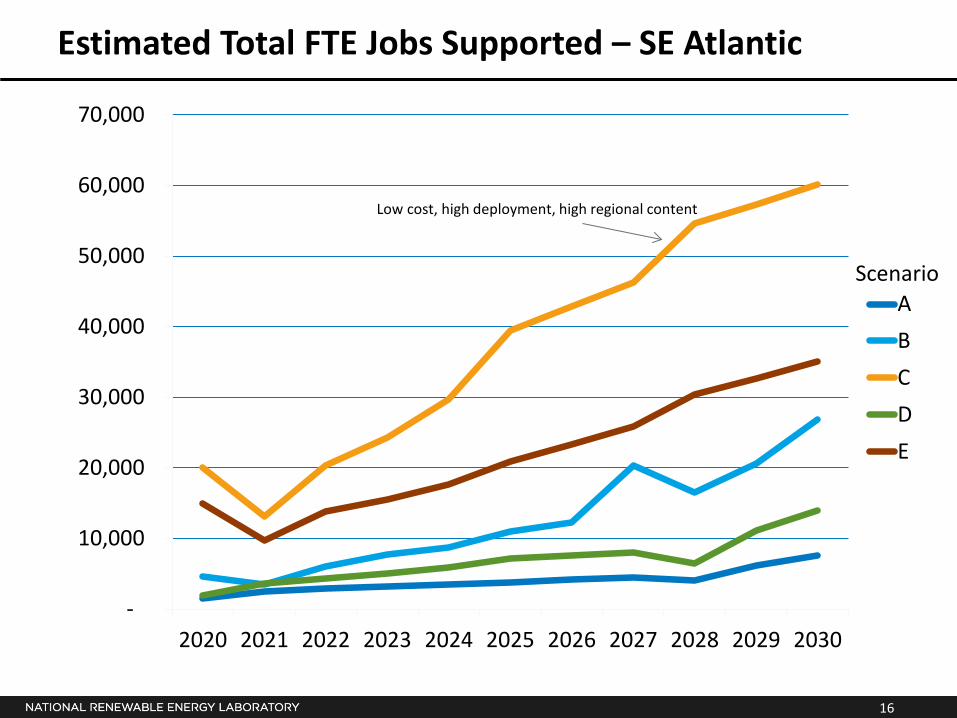
ABCDE
Low cost, high deployment, high regional content
Estimated Total FTE Jobs Supported – SE Atlantic
Scenario

17
Great Lakes Regional Findings • Water depth can vary greatly from site to site. • Lakes are freshwater, prone to freezing, but also is not as
corrosive as the salt water found in the ocean. • Fewer port options exist in the Great Lakes than in the other
regions studied. • Potential wind sites in the Great Lakes are usually further from
shore than potential sites off of the U.S. coast. • Locks that connect the Great Lakes with the Atlantic Ocean
may present logistical challenges. Height and width constraints make transporting large offshore wind equipment difficult.
• Lakes do not experience tides. • Overall: development in the Great Lakes is more expensive
than the Atlantic despite factors that push costs down.

18
Great Lakes Cost and Deployment Scenarios
Deployment (Scenario)
Capacity (MW) 2020
Capacity (MW) 2030
Construction Cost ($/kW) 2020
Construction Cost ($/kW) 2030
Low (A) 250 1,000 $6,632 $5,969
Medium (B) 500 2,000 $6,632 $5,306
High (C) 1,000 5,000 $6,632 $4,642
Three cost and deployment scenarios
Three local content* scenarios Scenario 2020 Local Content 2030 Local Content
Low (A) 17% 21%
Medium (B) 14% 41%
High (C) 28% 57%
*In this case, “local content” means content that is produced within the region.
19
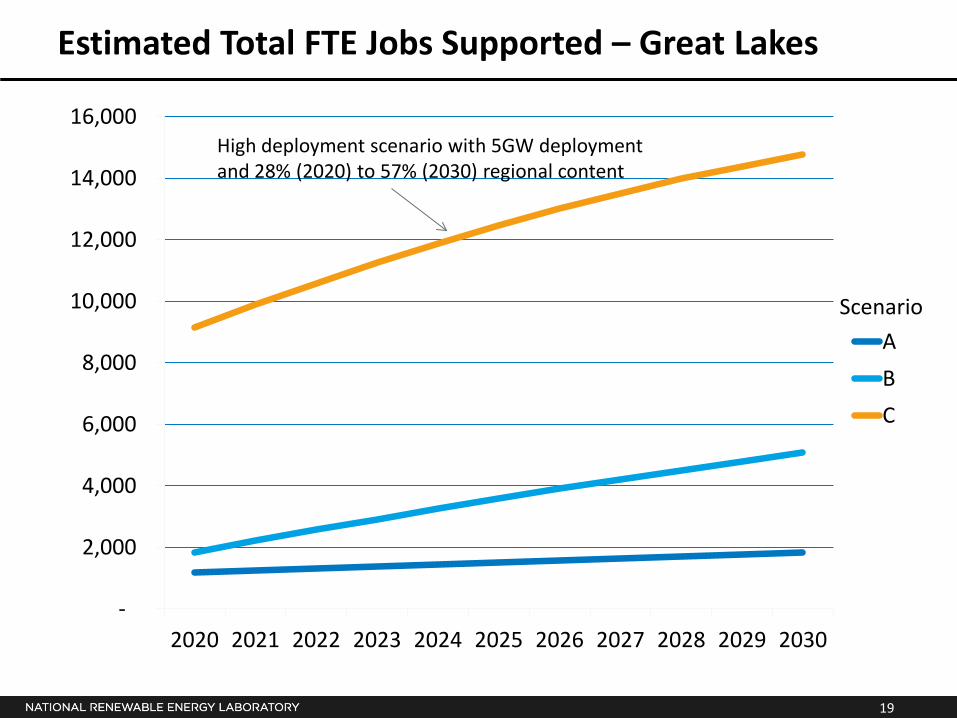
Estimated Total FTE Jobs Supported – Great Lakes
-
2,000
4,000
6,000
8,000
10,000
12,000
14,000
16,000
2020 2021 2022 2023 2024 2025 2026 2027 2028 2029 2030
ABC
Scenario
High deployment scenario with 5GW deployment and 28% (2020) to 57% (2030) regional content

20
Gulf of Mexico Regional Findings
• Existing oil and gas industry o Manufacturing infrastructure o Workforce and skills
• Higher potential in the 30-m depth o 30% of all U.S. potential o Lower construction costs
• Hurricane exposure o Anticipated increase in
equipment costs o Unknown impact on efficiency
Photo credit: Harland & Wolff Heavy Industries / NREL PIX # 20575

21
Gulf of Mexico Scenarios
Three cost and deployment scenarios Capacity (MW) 2020
Capacity (MW) 2030
Construction Cost ($/kW) 2020
Construction Cost ($/kW) 2030
Low (A) 85 1,000 $5,800 $4,930
Medium (B) 250 4,000 $5,500 $4,125
High (C) 600 5,000 $5,500 $3,575
Three local content scenarios 2020 Local Content 2030 Local Content
Low (A) 43% 62%
Medium (B) 47% 72%
High (C) 52% 80%
22
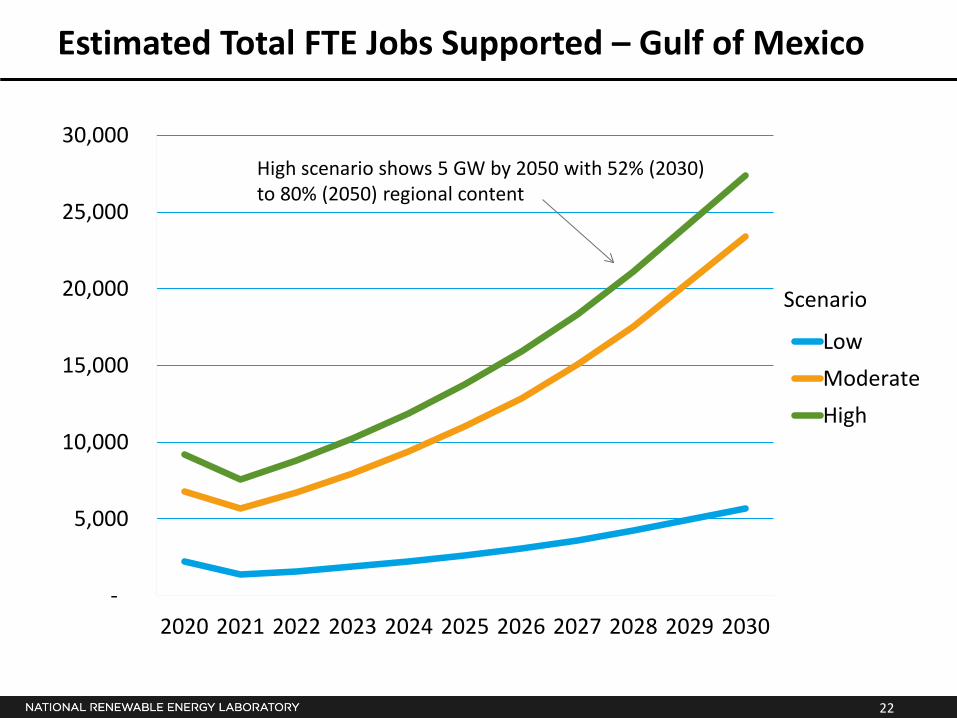
Estimated Total FTE Jobs Supported – Gulf of Mexico
-
5,000
10,000
15,000
20,000
25,000
30,000
2020 2021 2022 2023 2024 2025 2026 2027 2028 2029 2030
LowModerateHigh
Scenario
High scenario shows 5 GW by 2050 with 52% (2030) to 80% (2050) regional content

23
Mid-Atlantic Regional Findings
• Wages, project costs similar to JEDI defaults
• Several large ports well-suited to become offshore wind manufacturing hubs
• States already offering incentives
Credit: Robert Thresher / NREL PIX # 13045

24
Wind Energy Leasing Areas – Atlantic Coast
Source: Bureau of Ocean Energy Management, 2014
25
Mid-Atlantic Deployment Scenarios
Deployment (Scenario)
2020 Capacity (MW)
2030 Capacity (MW)
2020 Cost ($/kW)
2030 Cost ($/kW)
Low (A) 366 3,196 $5,839 $5,460
Medium (B) 1,982 7,802 $5,604 $4,826
High (C) 3,900 16,800 $5,362 $4,228
Three cost and deployment scenarios
Three local content scenarios Local Content (Scenario)
2020 Local Content 2030 Local Content
Low (A) 23% 42%
Medium (B) 29% 69%
High (C) 39% 79%

26
Estimated Total FTE Jobs Supported – Mid-Atlantic
-
10,000
20,000
30,000
40,000
50,000
60,000
70,000
2020 2021 2022 2023 2024 2025 2026 2027 2028 2029 2030
ABC
Scenario
The high scenario shows 16.8 GW deployed by 2050 with 39% (2030) to 79% (2050) regional content.

27
All Scenarios
• Jobs are well-compensated. • On-site earnings around $130,000/yr. in most
regions; $140,000/yr. in the Great Lakes. • Supply chain earnings of approx. $60,000/yr. • Induced earnings of approx. $50,000/yr.
Cred
it: H
C So
rens
un, M
idde
lgru
nden
Win
d Tu
rbin
e Co
oper
ativ
e / N
REL
PIX
# 17
856

28
Summary – JEDI estimates on par with others
Region Estimated Total Construction Period FTE/MW – (Low-Moderate-High)
Southeast 16-24-31
Great Lakes 14-17-25
Gulf of Mexico 27-28-29
Mid-Atlantic 16-23-25
Study Estimated Total Construction Period Ranges of FTE/MW
Global Insight (2003)* 1.4–2.4 Flynn and Carey (2007)* 2.0–3.7 Coad and Antunes (2010) 25–29 Hagerman et al. (2010) 39 Bloomberg New Energy Finance (Global Direct)(2012) 17
Source: Lantz et al. 2013
* Global Insight (2003) and Flynn and Carey (2007) anticipated significantly lower construction costs (including labor payments) than those anticipated in later studies.

29
Report, Technical Assistance, Current Work
This presentation provides information contained in an NREL technical report on the offshore wind JEDI model and regional case studies (Keyser et al, 2014). The report contains additional details including non-proprietary information from industry contacts. NREL will continue to support offshore wind JEDI model use through technical assistance. We are currently working on a floating technology JEDI model, to accommodate other U.S. regional offshore wind resources.
Thank You

31
References
Coad, L.; Antunes, P. (2010). Employment and Economic Impacts of Ontario’s Future Offshore Wind Power Industry. Ottawa, Ontario: The Conference Board of Canada. Bloomberg New Energy Finance (2012). Wind, Solar-Research Note: Solar and Wind Sectors on Course to Employ 2 Million People Worldwide by 2020. March 5. Flynn, R.; Carey, R. (2007). The Potential Economic Impact of an Off-Shore Wind Farm to the State of South Carolina. Clemson, SC: The Strom Thurmond Institute, Clemson University. Global Insight (2003). Economic Impact Analysis of the Cape Wind Off-Shore Renewable Energy Project. A report prepared for Cape Wind Associates. Hagerman, G.; Hatcher, P.; Miles, J.; Newbold, K. (2010). Virginia Offshore Wind Studies, July 2007 to March 2010, Final Report. 67 pp. Accessed March 2013: http://www.vcerc.org/VCERC_Final_Report_Offshore_Wind_Studies_Full_Report_new.pdf. Lantz, E.; Goldberg, M.; Keyser, D. (2013). Jobs and Economic Development Impact (JEDI) Model: Offshore Wind User Reference Guide. 27 pp.; NREL Report No. TP-6A20-58389. National Renewable Energy Laboratory (NREL) (2013). Offshore Wind Resource Characterization. Accessed September, 2013: http://www.nrel.gov/wind/offshore_resource_characterization.html. Fact sheets for each region: Southeast http://www1.eere.energy.gov/wind/pdfs/57565.pdf; Great Lakes http://www1.eere.energy.gov/wind/pdfs/57511.pdf; Gulf Coast http://www.nrel.gov/docs/fy14osti/60418.pdf; Mid-Atlantic http://www.nrel.gov/docs/fy14osti/60445.pdf