offshore wind transmission study comparison of options
TRANSCRIPT

Page 1
Offshore Wind Transmission Study
Comparison of Options
prepared for
New Jersey Board of Public Utilities
December 29, 2020

- i -
Table of Contents
I. Executive Summary ....................................................................................................................1
Recommendation ................................................................................................................................. 4
II. Background ................................................................................................................................5
Radial Export Cables ............................................................................................................................. 5
Ocean Grid ............................................................................................................................................ 6
Hybrid System ....................................................................................................................................... 8
Power Corridor ..................................................................................................................................... 8
III. Information Gathering Process ................................................................................................. 10
July-August 2020 OSW Transmission Stakeholder Meetings ............................................................. 12
IV. European Lessons Learned ........................................................................................................ 16
Study 1: Offshore Wind - A European Perspective, New York Power Authority ................................ 18
Study 2: Market Design for an Efficient Transmission of Offshore Wind Energy, DIW ECON ............ 21
Study 3: Connecting Offshore Wind Farms – A Comparison of Offshore Electricity Grid Development Models in Northwest Europe, Navigant Netherlands B.V. ................................................................. 24
Study 4: Transmission Policy Lessons from Europe’s Offshore Wind Experience, Dr. Deniz Ozkan .. 28
Lessons Learned Findings ................................................................................................................... 29
V. Offshore Transmission for New Jersey ...................................................................................... 33
Early OSW Development ..................................................................................................................... 33
Current OSW Development ................................................................................................................ 34
New Jersey OSW Potential ................................................................................................................. 35
VI. Capital Costs of Offshore Transmission Designs ......................................................................... 38
Stakeholder Positions on Capital Cost ................................................................................................ 38
Competitive Pressures to Minimize Capital Costs .............................................................................. 40
PJM Studies for New Jersey’s State Agreement Approach................................................................. 42
Onshore Capital Costs ......................................................................................................................... 43
VII. Project-on-Project Coordination and Risk .................................................................................. 44
Coordination Challenges ..................................................................................................................... 44
Regulatory Risks .................................................................................................................................. 46
OSW Project Delays ............................................................................................................................ 47
German Project-on-Project Risk Example ........................................................................................... 49
U.S. Examples ...................................................................................................................................... 51
Project-on-Project Risk Impacts on Ratepayers ................................................................................. 52
VIII. Environmental Impacts ............................................................................................................. 53
NY/NJ Ocean Grid ............................................................................................................................... 54
Construction Method.......................................................................................................................... 54
BOEM Environmental Studies ............................................................................................................. 56
Environmental Impacts During Construction ..................................................................................... 57
Environmental Impacts During Operation .......................................................................................... 58
Future Proofing ................................................................................................................................... 61

- ii -
IX. Technology, Redundancy, Reliability, and Losses ....................................................................... 63
Overview ............................................................................................................................................. 63
HVAC and HVDC Technology .............................................................................................................. 64
HVAC and HVDC Common and Differentiating Factors ...................................................................... 65
Cable and Converter Reliability .......................................................................................................... 66
Redundancy ........................................................................................................................................ 67
Performance ....................................................................................................................................... 67
Engineering, Procurement, and Construction .................................................................................... 68
Losses .................................................................................................................................................. 69
Operating and Maintenance Costs ..................................................................................................... 69
Ocean Grid Energy Transfers .............................................................................................................. 70
HVAC and HVDC Applications to Date ................................................................................................ 71
X. Long-Term Planning versus Flexibility ........................................................................................ 74
Long-Term Planning Considerations ................................................................................................... 74
Headroom at Points of Interconnection ............................................................................................. 75
Extrinsic Benefits................................................................................................................................. 76
XI. Business Structure, Financing, and Ratepayer Risk ..................................................................... 77
Offshore Transmission Business Structures........................................................................................ 77
Onshore Transmission Examples ........................................................................................................ 79
Financing ............................................................................................................................................. 79
Cost Recovery and Ratepayer Risk ..................................................................................................... 81
XII. State Benefits and Procurement Process ................................................................................... 83
State Benefits ...................................................................................................................................... 83
Procurement Process .......................................................................................................................... 84
State Agreement Approach ................................................................................................................ 86
Common Concerns.............................................................................................................................. 86
Appendix 1 – Radial Export Cable, Ocean Grid, and Power Corridor Comparison Table ................... A1-1

- 1 -
I. Executive Summary
Levitan & Associates, Inc. (LAI) prepared this Transmission Study for the New Jersey Board of Public
Utilities (Board) to evaluate the range of commercial, technical, environmental, and operational
advantages / disadvantages of offshore wind (OSW) transmission options. LAI’s scope of work was
centered on the evaluation of radial export cable and ocean grid designs. During the course of this analysis,
the initial scope was expanded to include a power corridor design as defined below.
Radial export cables are bundled with OSW generation assets and have been proposed for all
domestic OSW procurements to date. Radial export cables typically utilize high voltage alternating
current (HVAC) technology to transmit power from individual OSW projects to a single point of
interconnection (POI) but can utilize high voltage direct current (HVDC) technology. Radial export
cables are designed to be built in line with the OSW project schedule. European OSW offshore
transmission projects predominantly utilize radial export cables.
An ocean grid would be a separate, independent transmission project connecting multiple OSW
generation projects to multiple onshore POIs. An ocean grid would utilize HVDC technology for
the delivery cables to shore and the cables to connect the OSW projects to one another, along
with HVAC/HVDC converters. A merchant business model in which the independent transmission
owner assumes price risk is not viable. A regulated ocean grid could be built via a transmission-
only procurement by the Board or the State Agreement Approach (SAA) within PJM’s Regional
Transmission Expansion Plan (RTEP) process. In either case, benefited load in New Jersey would
bear the costs. An ocean grid would likely be built in one construction program in advance of the
OSW projects. We are not aware of any European ocean grids that have been built to date.
A “power corridor” has been conceptualized as a result of this Study where multiple OSW projects
could deliver to a single POI via multiple HVDC cables installed in a single right-of-way (ROW). A
power corridor would be built in one construction program in advance of the OSW project
commercial operation dates (CODs) via a Board procurement or the SAA. Each OSW project would
have its own HVDC cable in the power corridor with HVAC/HVDC converters at the cable ends.
Each power corridor would extend from New Jersey’s north-south 500 kV backbone system to the
coast or, preferably, to a new offshore substation. A single construction program in one ROW
would minimize environmental disturbances, particularly along the coastline and through
sensitive on-shore environments. To minimize New Jersey’s upfront costs, converter stations
could be added by the OSW developers when needed as part of the construction scope associated
with each new OSW project.
Hybrid transmission systems have been used in Europe with a single HVDC cable to serve two or
more OSW projects that do not exceed the maximum cable capacity of about 900 MW. Hybrid
systems are not feasible as recent OSW project awards in New Jersey, as well as New York and
New England, are too large to have more than one served by a single cable with existing
technology. The power corridor concept transforms the ability of hybrid systems to interconnect
multiple small OSW projects in light of the current trend towards larger OSW project sizes.
- 2 -
In conducting this Study, LAI has addressed many issues that surround the first two offshore transmission
options: project-on-project risk, cost recovery under PJM’s Open Access Transmission Tariff (OATT),
reliability and redundancy, onshore and offshore environmental impacts, benefits to New Jersey, and
ratepayer risks. Our work has been informed by ongoing consultation with Board Staff as well as input
from PJM and industry participants through interviews and written comments. Technical evaluations were
prepared with the assistance of our transmission sub-contractor, EN Engineering. This Study references
cost estimates prepared by other parties but does not include an independent cost comparison of the
options studied.
LAI’s primary findings and observations are as follows:
Offshore radial export cables and hybrid transmission systems have been utilized in Europe under
two different regulatory paradigms. In the U.K., OSW developers are responsible for radial export
cable design and construction and then sell them to third-parties. In continental Europe, national
Transmission System Operators (TSOs) have more autonomy to plan, construct, own, and operate
the offshore transmission assets as extensions of their onshore network grids. Having centralized
TSO control may have been valuable in the early days of OSW development, but may not be
necessary in the U.S. New Jersey OSW transmission responsibilities are dispersed among many
entities: state agencies, PJM, Transmission Owners (TOs), the Bureau of Ocean Energy
Management (BOEM), state and federal environmental agencies, and local municipalities, thus
rendering a centralized model difficult to implement.
An ocean grid or power corridor (collectively referred to as coordinated transmission projects)
would have to be a regulated PJM asset because the merchant model is not financeable. Available
financial cost information indicates that a coordinated transmission project utilizing HVDC
technology requiring expensive converter stations would likely be significantly more expensive
than radial export cables for New Jersey. Realistic and valuable cost estimates for coordinated
transmission projects would be discovered through the SAA process.
In order to select an offshore transmission option, New Jersey will have to consider cost,
performance, environmental impacts, ratepayer risk, and other unique factors. New Jersey has a
robust 500 kV transmission backbone but limited coastal POIs with adequate headroom for OSW
injections. HVDC-based ocean grids and power corridors could address this limitation and “future-
proof” New Jersey by pre-building transmission for future OSW projects to minimize
environmental disturbances. Ratepayers would face more financial risk with a regulated
coordinated transmission project because it would be a FERC-jurisdictional asset with costs
recoverable on a fixed, non-bypassable basis in advance of OSW development. In contrast, radial
export cable costs would be recovered on a volumetric basis based on energy deliveries, leaving
the cost recovery risk with OSW developers.
Radial export cables bundled with OSW generation are consistent with PJM rules in which
generation developers are responsible for interconnecting to the existing grid. While PJM rules
did not allow an ocean grid to interconnect without firm generation commitments outside of
RTEP, New Jersey could develop a coordinated transmission project through a transmission-only
procurement by the Board or the SAA. The complexities of a transmission-only procurement make
- 3 -
the SAA route preferable. Unless other states participate, New Jersey ratepayers would bear the
full cost of any coordinated transmission project.
We anticipate there will be enough qualified transmission bidders to assure a competitive SAA
process that results in a cost-efficient coordinated transmission design. The winning design may
be more expensive than the radial cable option with project-on-project risks and ratepayer
financial commitments but should have fewer environmental impacts. The SAA process will
identify detailed cost information to determine the incremental cost of any coordinated
transmission design. The Board has the authority to authorize any coordinated transmission
solution through the SAA.
Any offshore transmission project would be designed and constructed consistent with
environmental regulations and an approved BOEM Construction and Operations Plan (COP). An
HVAC radial export system requires more cables, miles of trenches, coastal landings, and
horizontal directional drilling (HDD) boreholes compared to a coordinated transmission project
utilizing HVDC cables for the same OSW capacity buildout. Therefore, radial export cables will
result in greater short-term habitat disturbance and cumulative environmental impacts. Although
cable depth would be monitored and cables reburied or covered if necessary, potential long-term
conflicts with fisheries will remain for all transmission options. Any HVDC transmission project
would also require onshore and offshore converter stations, and an ocean grid would require
additional inter-project cables. These would not significantly change this environmental
comparison.
There appears to be no significant reliability differences among the offshore transmission options.
Radial export cable losses would be about one-half of coordinated transmission project losses
given the relatively short distances between the current BOEM lease areas and the New Jersey
coast. An ocean grid may be able to fine-tune injection quantities at select POIs to minimize
transmission system upgrade costs.
Any coordinated transmission project developed separately from OSW generation would impose
project-on-project risks. Coordinated transmission projects will have an opportunity to
demonstrate it can provide operational, economic, reliability, and other benefits to ratepayers
and OSW developers during the SAA procurement process.
After allowing for in-state versus out-of-state sourcing, there appears to be no significant
differences among the transmission options in New Jersey’s socio-economic benefits of job
training, employment, port investment, supply chain development, and spending.
If the Board pursues a coordinated transmission project, on its own or through the SAA, the
procurement process would be longer and more complicated than for OSW projects with bundled
transmission. PJM’s existing SAA offers a defined but untested path forward that is likely a better
means to achieve Governor Murphy’s 7.5 GW OSW procurement objective by 2035. Certain
ratepayer risk protections exist in the SAA, but this should be explored further before the SAA
transmission proposal window opens.

- 4 -
Proponents claim ocean grids have extrinsic advantages, but they may in fact have shortcomings
and implementation challenges. For example, relying on an ocean grid to improve New Jersey’s
long-term transmission system may have limited benefits and may not be needed in light of PJM’s
RTEP process. Transferring OSW and grid (non-OSW) energy among ocean grid POIs would entail
incremental converter losses and would likely increase energy prices in the withdrawal zones.
Coordinated transmission solutions with this and other potential extrinsic benefits will be
evaluated through the SAA process.
Any offshore transmission option may face legal and siting challenges. The degree to which such
challenges could delay the Board’s 7.5 GW procurement objective has not been evaluated, but
under the Biden Administration it is reasonable to expect an accelerated BOEM permitting
process. OSW projects with radial export cables would be permitted individually while a
coordinated transmission project would go through a single and more complex permitting
process. Cost, performance, environmental impact, and ratepayer risk tradeoffs warrant rigorous
scrutiny before a final Board decision is made.
Recommendation
Each offshore transmission option has advantages and disadvantages. In sum, radial export cables place
all or the supermajority of project risk on the developer. Radial export cables likely have a lower all-in cost
and are paid for volumetrically when OSW energy is delivered. An ocean grid would have fewer
environmental disturbances and ease OSW interconnections, but would likely be more expensive, take
longer to construct, and have higher losses given the closeness of the BOEM lease areas to the coastline.
The cost of a power corridor may be between these two extremes and could have the least environmental
disturbance if the onshore cables are placed in a single ROW and installed in a single construction phase.
We suggest the Board consider the merits of a power corridor design that reflects proximity to existing
BOEM lease sites. Once its capacity is fully subscribed by selected OSW projects, New Jersey could pursue
additional power corridors as needed to achieve Governor Murphy’s 7.5 GW goal. This would minimize
the upfront cost, incorporate new lease areas, and reduce the time that ratepayers pay for unused
corridor capacity. Any coordinated transmission project would entail project-on-project risks, necessitate
multi-party coordination, and obligate ratepayers to incur the fixed costs irrespective of use. A
coordinated transmission project could be pursued through a Board procurement but may be better
through the SAA process. A detailed comparison table of these transmission options is provided as
Appendix I.
In the final analysis, the Board will have to consider the cost, performance, environmental impact,
ratepayer risk, and other characteristics of each offshore transmission option. The Board will benefit from
a competitive SAA procurement that should provide innovative and cost-effective coordinated
transmission solutions to support its ultimate OSW goals. LAI is optimistic there will be enough high-
quality SAA proposals to support a prudent decision in the year or two ahead. The Board will be able to
compare the cost of the coordinated transmission proposals to traditional radial export cable designs
based on commercial information submitted to the Board in the Round 1 and Round 2 OSW solicitations.
- 5 -
II. Background
OSW is progressing rapidly in global markets. In northern Europe, new projects are being announced at a
rate not foreseen even a few years ago. About a dozen domestic OSW projects have been chosen along
the Atlantic coast but they have experienced setbacks attributable to permitting delays and other
challenges affecting fast-track commercialization. The technologies for foundation designs, turbines,
cables, and other equipment and systems are progressing quickly as well. In the last five years, turbine
nameplates have doubled in size and transmission cable capacities and voltages are increasing. OSW
project sizes are also growing to capture economies of scale, lowering bid prices. In performing this
assessment for Board Staff, LAI has relied on data for domestic and European OSW projects as of July 1,
2020.
TSOs in continental Europe have been central to OSW development from the beginning. European TSOs
are generally 100% owned by their respective federal government or by federal government agencies and
power companies. For example, TenneT GmbH, the German TSO with the largest offshore transmission
portfolio, and its affiliate TenneT B.V., the sole Dutch TSO, are 100% owned by the Dutch Ministry of
Finance. The sole Danish TSO, Energinet, is 100% owned by the Government of Denmark under the
Ministry of Climate and Energy. The sole French TSO, Réseau de Transport d'Électricité (RTE), is 100%
owned by Électricité de France (EdF) that in turn is 83.7% owned by the French Government. In contrast,
the U.K. TSO, National Grid, is a private investor-owned corporation. In continental Europe, once a
national policy to develop OSW is finalized, TSOs plan, construct, own, and operate the offshore
transmission assets to deliver that power to their onshore girds. These offshore assets, radial export cable
and hybrid designs, are referred to as network grids. As regulated monopolies, TSOs are entitled to recover
their capital and operating costs.
Radial Export Cables
From a technological standpoint, a radial export cable is a relatively straight-forward option to deliver
power from a single OSW project to a single POI, generally via a set of HVAC delivery cables. An OSW
project of 1,000-1,200 MW would typically utilize three subsea HVAC cables that are analogous to the
radial generator leads built by onshore generators. In both cases, individual generation projects are
responsible for the design, permitting, construction, ownership, and operation of the radial export cables
/ generator leads that interconnect their projects to the PJM transmission grid. Those radial export cables
/ generator leads are part of the generation project, not regulated transmission assets operated by PJM.
In both cases, the generation projects are also responsible for all interconnection costs, i.e., attachment
facilities at the POI and transmission system upgrades necessary for the safe and reliable operation of the
grid.
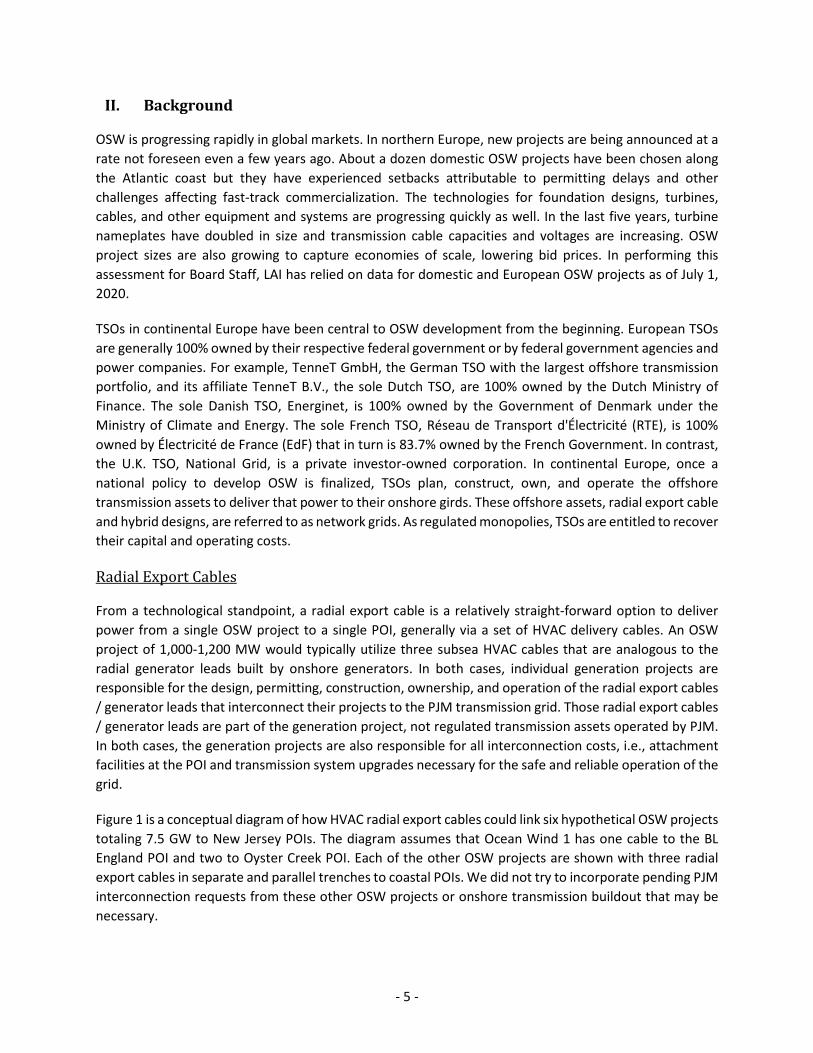
Figure 1 is a conceptual diagram of how HVAC radial export cables could link six hypothetical OSW projects
totaling 7.5 GW to New Jersey POIs. The diagram assumes that Ocean Wind 1 has one cable to the BL
England POI and two to Oyster Creek POI. Each of the other OSW projects are shown with three radial
export cables in separate and parallel trenches to coastal POIs. We did not try to incorporate pending PJM
interconnection requests from these other OSW projects or onshore transmission buildout that may be
necessary.
- 6 -
Figure 1. Hypothetical Radial Export Cable Diagram for New Jersey
Ocean Grid
An ocean grid would connect multiple OSW projects to multiple POIs utilizing HVDC technology for the
delivery cables to shore and the inter-project cables connecting the OSW projects offshore.1 In this Study,
LAI focused on potential POIs in New Jersey. Likewise, our ocean grid assessment is limited to New Jersey
rather than expanding the concept to include other PJM states or inter-regional planning efforts that
would include much more than 7.5 GW. Marine HVDC cables are generally installed as a single bundled
pair of cables (although two separate cables can be installed in a single trench). Proponents of ocean grids
claim they have the potential to reduce costs, minimize environmental impacts, improve delivery
reliability, achieve wholesale energy market efficiencies, and facilitate more rational OSW development.
There are two primary business structures for ocean grids: (i) a rate-based asset in which project capital
and operating costs are recovered under traditional cost-of-service principles under Federal Energy
Regulatory Commission (FERC) jurisdiction and (ii) a merchant model in which an ocean grid developer
designs and builds the system at risk and recovers its costs through negotiated rates with OSW projects.
The merchant model is not viable because developers cannot obtain firm commitments from states or
1 We use the term “ocean grid” (all lower case) in this Study to refer to generic ocean grid designs. We use the term “Ocean Grid” (first letters capitalized) in reference to specific proposals offered by Anbaric Development Partners.

- 7 -
OSW developers, making financing virtually impossible. Therefore, we assume that any ocean grid would
be a FERC-jurisdictional regulated transmission asset with costs recovered through non-bypassable
ratepayer charges.
Figure 2 is a conceptual diagram of how an ocean grid could hypothetically link five hypothetical Round 2-
6 OSW projects totaling 6.4 GW to New Jersey POIs using HVDC cables. The diagram assumes that Ocean
Wind 1 has one HVAC cable to the BL England POI and two HVAC cables to Oyster Creek POI. Our
hypothetical ocean grid has HVDC cables from individual OSW projects in Hudson South, Atlantic Shores,
the remaining portion of Ocean Wind, and Garden State Offshore Energy lease areas to coastal POIs. The
total deliveries of 6.4 GW for this hypothetical ocean grid may require additional onshore transmission
buildout that is not shown.
Figure 2. Hypothetical Ocean Grid Diagram for New Jersey
The New Jersey Offshore Wind Strategic Plan (Strategic Plan), presented to the Board in September 2020,
serves as a roadmap for progressing from the initial 1.1 GW awarded in Round 1 to the 7.5 GW goal by
2035. Section 6.3.1 of the Strategic Plan includes a conceptual diagram and description of an offshore
“backbone” transmission system that could connect four OSW projects along an HVDC backbone with two
- 8 -
cable pathways to coastal POIs at the northern and southern ends. That backbone system is similar to an
ocean grid.2
Hybrid System
Hybrid transmission systems have been utilized in continental Europe to connect multiple OSW projects
to the offshore grid. These OSW projects are generally 250-400 MW, small enough for two or more to
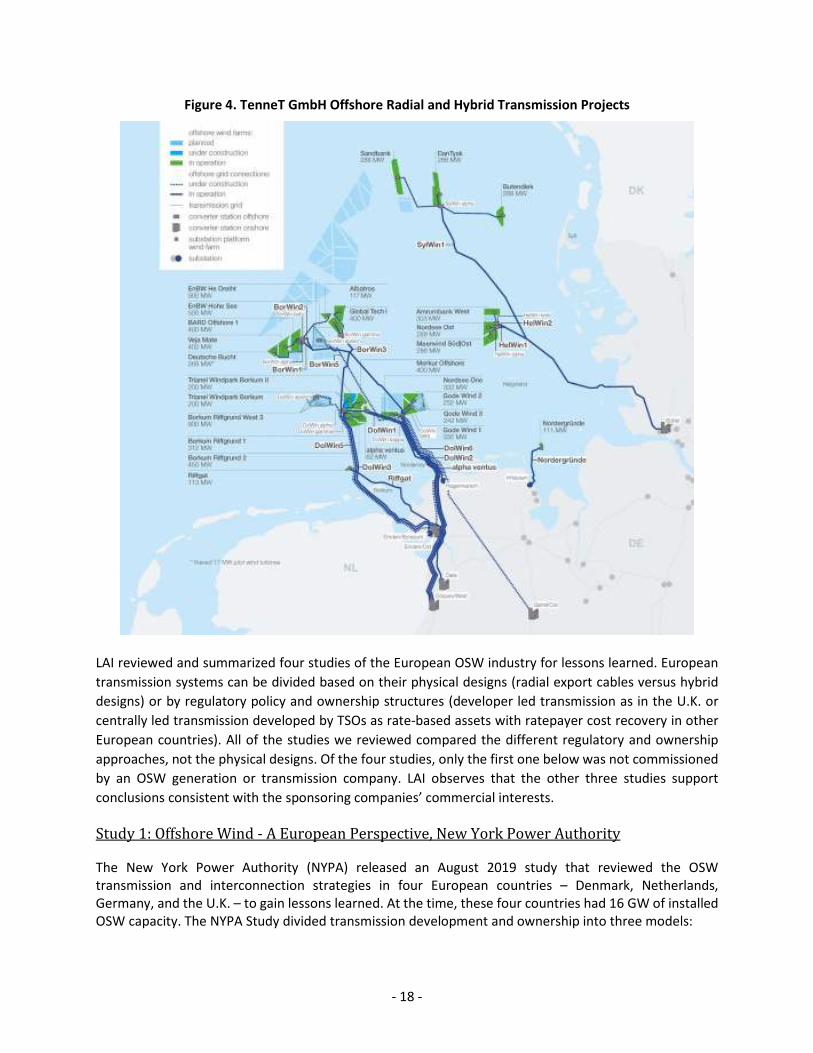
utilize a single transmission cable. Some of those hybrid transmission projects are shown in Figure 4 on
page 118. These European hybrid systems are designed, constructed, owned, and operated by TSOs. The
OSW projects connect to an offshore collector / converter platform using radial export cables. Hybrid
systems share some characteristics with radial export cables and others with ocean grids. Like a radial
export cable design, a hybrid design has a single transmission cable system (either HVAC cables or a
bundled pair of HVDC cables) and a single POI. Like an ocean grid, a hybrid design connects with multiple
OSW generators and splits up the generation and transmission responsibilities. Hybrid systems are not
feasible as recent OSW project awards in New Jersey, New York, and New England are too large to have
more than one project served by a single cable with existing technology. Nevertheless, the key advantage
of interconnecting multiple small OSW projects can be applied to large OSW projects, e.g., 1,000-1,200
MW through the power corridor concept.
Power Corridor
The hybrid system concept can be utilized in New Jersey in the form of one or more high capacity “power
corridors” to link multiple OSW projects to an inland POI that can accommodate a large injection of OSW
energy. For example, a power corridor with multiple HVDC cables could extend from New Jersey’s 500 kV
backbone transmission system to a coastal or offshore location close to the existing BOEM lease sites.
Given the large OSW project capacities anticipated in procurement Rounds 3-6, each OSW project would
require its own HVDC cable. A power corridor for three or more OSW projects could be installed in a single
construction program within one ROW to minimize onshore environmental impacts and other disruptions.
Offshore environmental impacts could also be minimized by extending these power corridors to an
offshore substation. Each OSW project utilizing the power corridor would connect to that offshore
substation. Converter stations, one at each end of the HVDC cable in the power corridor, could be included
in the SAA scope or could be the responsibility of the OSW developer and installed later. If pursued
through PJM’s SAA, a power corridor would be a regulated PJM asset with rate-based cost recovery under
FERC jurisdiction.
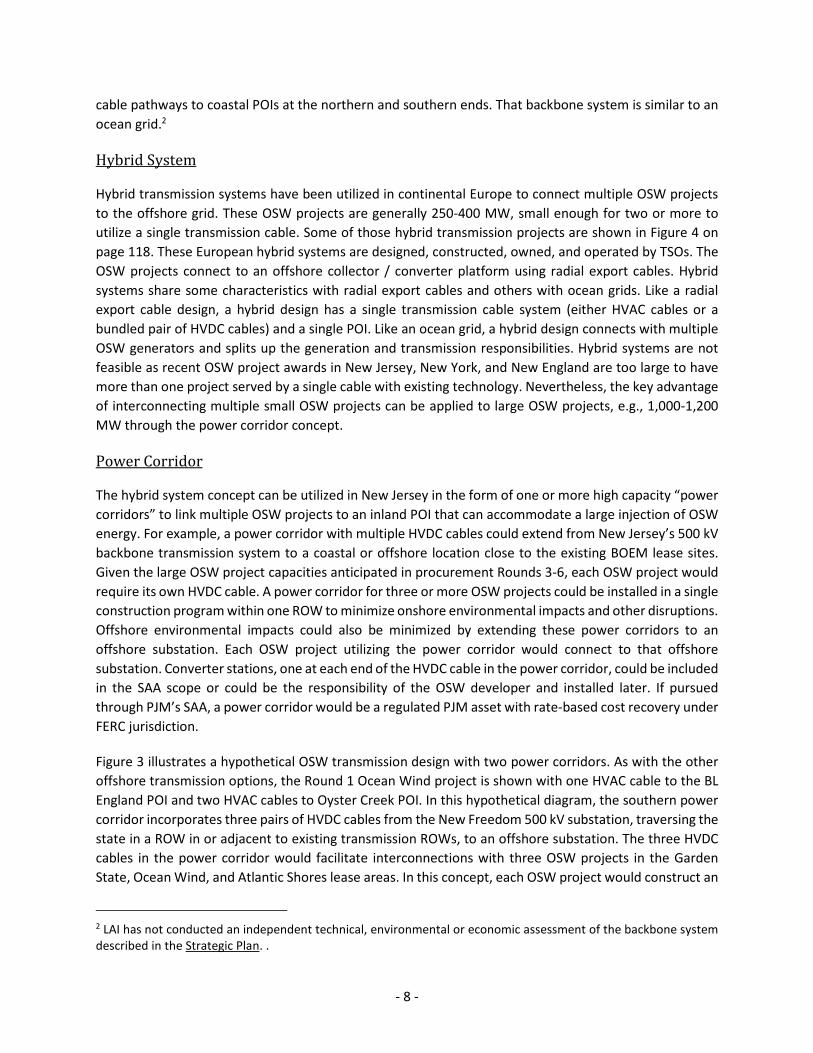
Figure 3 illustrates a hypothetical OSW transmission design with two power corridors. As with the other
offshore transmission options, the Round 1 Ocean Wind project is shown with one HVAC cable to the BL
England POI and two HVAC cables to Oyster Creek POI. In this hypothetical diagram, the southern power
corridor incorporates three pairs of HVDC cables from the New Freedom 500 kV substation, traversing the
state in a ROW in or adjacent to existing transmission ROWs, to an offshore substation. The three HVDC
cables in the power corridor would facilitate interconnections with three OSW projects in the Garden
State, Ocean Wind, and Atlantic Shores lease areas. In this concept, each OSW project would construct an
2 LAI has not conducted an independent technical, environmental or economic assessment of the backbone system described in the Strategic Plan. .
- 9 -
offshore converter platform adjacent to its collector platform and install an HVDC cable to the power
corridor offshore terminus. Each OSW project would also install an onshore converter at the onshore POI.
The northern power corridor in this hypothetical diagram incorporates two pairs of HVDC cables from the
Smithburg 500 kV substation in or adjacent to existing transmission ROWs to a second offshore substation
that would be better suited for more northerly lease areas.
Figure 3. Hypothetical Power Corridor Diagram for New Jersey
- 10 -
III. Information Gathering Process
November 2019 OSW Transmission Stakeholder Meeting
The Board held an OSW Transmission Stakeholder Meeting on November 12, 2019 for interested
stakeholders to “…provide comment on one or more offshore wind transmission solutions that may
further the State’s offshore wind ambitions in a cost-effective manner for New Jersey ratepayers.” The
Board arranged speaker panels to address four key issues and received written comments as well:
Other Efforts to Connect Remote Generation through Shared Transmission Facilities
Optimal OSW Transmission Framework to meet New Jersey’s OSW Goals
Technical Considerations for Offshore Transmission Facilities
Cost Responsibility and Business Model Considerations
Many panelists noted the central role TSOs play in OSW transmission development in Germany, Denmark,
and the Netherlands, as well as third-party offshore transmission ownership in the U.K. Many also pointed
to the Tehachapi Renewable Transmission Project (TRTP) in California and the Competitive Renewable
Energy Zone (CREZ) projects in Texas as examples of ratepayer-supported transmission infrastructure to
support state renewable policy goals. Having the Board conduct an independent study of the technical,
regulatory, legal, and financial issues of procuring planned offshore transmission through a competitive
process specifically designed for New Jersey was widely supported.
Anbaric Development Partners, the leading proponent of ocean grids off New Jersey and other Atlantic
coast states, supported an ocean grid developed through a competitive solicitation to efficiently integrate
remote resources, increase competition among generators, reduce wholesale energy costs, minimize
environmental impacts, and control transmission costs. Anbaric’s Ocean Grid would utilize HVDC
technology, accommodate multiple OSW projects, and have multiple POIs. The capacities of cables and
converter stations up to 2,000 MW are under development and would necessitate upgrades to the
onshore gird. Anbaric confirmed the merchant model is not financially viable and questioned whether a
regional (multi-market) approach is possible given significant planning and cost allocation issues. The
limited POI headroom along New Jersey’s coast and the eventual need for a significant buildout to the
500 kV backbone to achieve the 7.5 GW goal were highlighted.
Anbaric argued that unbundling of generation and transmission can enable transmission to play its
traditional role as the foundation for competition in the commodity sphere. It was suggested that New
Jersey could issue a transmission RFP to support its 7.5 GW OSW goal that would identify available POIs,
minimize environmental impacts, and could be expanded later on. Consistent with onshore transmission,
costs would be estimated, e.g., +/- 50%, with variances and overruns subject to PJM approval. It would
not be feasible to tie an OSW project to an ocean grid after radial export cables are installed. Compared
to Round 1 transmission cost sharing, adequate ocean grid planning could provide more cost certainty.
Costs would be allocated to New Jersey ratepayers or more broadly to other PJM ratepayers.3
3 Cost sharing outside of New Jersey would be very difficult and may be unrealistic.
- 11 -
The Business Network for Offshore Wind is open to all solutions but supported planned transmission. On
page 3 of its November 27, 2019 letter to the Board, it recommended “…New Jersey’s overall objective
should be to create a transmission framework that is tailored to the state’s energy goals…and is consistent
with New Jersey’s unique geography and energy landscape.” Planned transmission would allow the
industry to scale up efficiently without running into transmission roadblocks, would eliminate cost and
timing uncertainty under PJM’s interconnection process, and would improve OSW generation
competition. The Business Network recommended New Jersey fully engage with PJM and try to
coordinate offshore transmission planning with NYISO. Further, they asserted that a competitive
transmission procurement should also permit bundled generation and transmission bids and have a
mechanism to protect OSW generators from project-on-project risks.
Stefanie Brand, Director of the New Jersey Division of Rate Counsel (Rate Counsel), pointed out there is
no U.S. equivalent to European TSOs. As federally regulated transmission monopolies, TSOs do not face
competitive cost pressures. Planned coordinated transmission with fewer cables can minimize New Jersey
environmental impacts but SAA planning, cost, and risk allocation questions have not been resolved.
According to page 19 of Rate Counsel’s December 3, 2019 comments, the Board should “…first enter into
an investigation to explore the issues with these regional / multi-participant OSW transmission projects
and the host of financial, legal, and regulatory issues…” before making any decisions. Rate Counsel also
expressed concern about equity rate adders FERC routinely grants that raise the cost of capital for new
transmission projects. According to Rate Counsel, CREZ was very successful due to being able to roll the
costs into customer transmission charges, the availably of suitable land with few barriers to development,
having large load centers, and having a competitive selection process. Rate Counsel suggested that shared
coordinated transmission can have less environmental impact but can lead to ratepayers bearing stranded
costs.
Ørsted agreed that New Jersey is unique, making it very difficult to apply lessons learned from other
jurisdictions. Ørsted relied on the DIW ECON Study (summarized on pages 21-23 of this Study) to argue
that integrating the generation and transmission scopes has led to synergies and cost savings and has
avoided German ratepayer penalties for delayed offshore transmission completion.4 Ørsted pointed out
that hybrid designs to serve multiple OSW projects is no longer relevant as the size of OSW projects has
grown. Ørsted noted that Denmark has now decided to bundle offshore transmission into the next OSW
tender and that radial export cables may be the no-regrets, least-cost transmission solution. Consistent
with the Business Network, Ørsted recommended that a planned transmission procurement process
permit bundled generation and transmission bids and include a mechanism to protect generators from
project-on-project risk.
Rockland Electric (RECO) highlighted the benefits of coordinating transmission with OSW generation and
thought the State’s current OSW approach may not be scalable and cost-effective to meet the 7.5 GW
goal. It was noted that considering each increment of OSW separately may result in higher costs than an
integrated and comprehensive planning approach. For best outcomes, RECO recommended that planned
offshore transmission should be in a competitive framework. RECO explained the tradeoffs between radial
and networked transmission require further study by the Board with input from PJM and TOs and
4 See pages 53-54 of this Study.
- 12 -
concluded that while the SAA is an appropriate mechanism, inter-regional coordination with New York
should be secondary.
Jersey Central Power & Light (JCP&L) recommended a coordinated and collaborative transmission
planning process driven by the Board, and involving all stakeholders, to integrate OSW. A well-planned,
open access approach was preferred to minimize reliability issues, environmental disturbances, and local
community impacts. JCP&L suggested that TOs have extensive experience in planning, designing, and
building transmission infrastructure and should have a significant role in the design and build-out of the
offshore infrastructure. It was noted that PJM’s SAA lack of details and precedents provides New Jersey
with an opportunity to pursue an appropriate and cost-effective transmission project.
The Maritime Association of the Port of New York & New Jersey supported OSW and urged that
installation of any transmission cables take concrete measures to protect the marine and coastal
environment and the safety of maritime shipping. Most of those recommendations related to the OSW
turbines, not transmission cables.
July-August 2020 OSW Transmission Stakeholder Meetings
The Board issued a Notice of Information Gathering (Docket No. QO20060463) on OSW transmission
options on June 26, 2020.5 The Notice stated “….in order to collect as much useful information as possible
for an evaluation of radial export cable and ocean grid options, NJBPU Staff is seeking information
regarding design, cost, and operational data. Staff is also requesting opinions regarding the relative
advantages and disadvantages of the radial export cable and ocean grid option.”
About 80 representatives from 54 entities (listed below) responded to the Notice. Videoconference
meetings were arranged based on commonality of interests.
Potential OSW Applicants (developers with nearby leases): Atlantic Shores, Equinor, Ørsted
Other OSW Developers (without nearby leases): EDP Renewables, EnBW North America, RWE Renewables Americas, Avangrid
Ocean Grid Developers: Anbaric Development Partners
NJ Transmission Owners: Exelon/ACE, FirstEnergy/JCP&L, Public Service Electric and Gas Company
Transmission Developers: LS Power, Hitachi ABB Power Grids, Transmission Investment, LS Cable America
Fisheries Organizations: Anglers for Offshore Wind, Garden State Seafood Association, NJ Marine Fisheries Council, Recreational Fishing Alliance, Responsible Offshore Development Alliance
Environmental Organizations: Clean Ocean Action, Jersey Renews, NJ Audubon, NJ Conservation Foundation, NJ Sierra Club
Industry Associations: American Wind Energy Association (AWEA), Business Network for Offshore Wind, Maritime Association of the Port of NY/NJ, National Offshore Wind Research and Development Consortium
State Agencies: Massachusetts Department of Energy Resources (MADOER), New York State Energy Research and Development Authority (NYSERDA)
5https://www.nj.gov/bpu/pdf/publicnotice/Notice%20of%20OSW%20Transmission%20Information%20Gathering.pdf

- 13 -
Labor: Eastern Atlantic States Regional Council of Carpenters, International Brotherhood of Electrical Workers
Consultants: 1898 & Co., Center for Renewables Integration, CLEAResult, Energy Strategy Resources, Florio Perrucci Steinhardt Cappelli Topton & Taylor, Guidehouse (formerly Navigant), Lloyd’s Register Energy Americas, McCormick Taylor, Ramboll, Schonfeld Strategic Advisors, Tufts University Power Systems and Markets Research Group, WSP
General: Borough of Point Pleasant Beach, BP Energy Company, Enel North America, Invenergy, MidAmerican Energy Services, NJ Spotlight, City of Ocean City Advisory Committee, Public Power Association of New Jersey, Rutgers University, members of the public
Question sets were distributed to each group prior to the meetings, which were held between July 27 and
August 7, 2020. About 40 entities participated in these meetings and were invited to submit written
responses to Board questions within two weeks of the meetings. The information discussed during the
meetings and the written responses, summarized below, have informed LAI’s analysis of New Jersey’s
offshore transmission options.
Anbaric reiterated the advantages of planned offshore transmission and HVDC technology. It estimated
that HVAC is less expensive for OSW projects less than 70 miles to shore while HVDC is better for distances
greater than 100 miles. Cable burial depths and configurations, installation methods, the number of HDD
boreholes, and the large size of converter stations (4-5 acres) all were confirmed. Radial export cables
would have the lowest cost but an HVDC backbone configuration, very similar to an ocean grid, was
recommended as “[t]he configuration best able to interconnect four OSW projects, each with 1.2 GW to
1.4 GW…” per page 12 of Anbaric’s responses. A confidential high-level transmission planning report was
prepared by Pterra, a transmission consultancy, to support an offshore grid to deliver 7.0 GW of OSW
energy to New Jersey. Anbaric explained on page 14 of its responses that “[t]he final decision will be driven
by the objectives of the system design, economics, as well as the principles mentioned above. However,
it is strongly urged that policy makers and planners focus on the long-term benefits and costs and not
merely on the short-term costs.”
Meetings were held individually with OSW developers – Equinor, Atlantic Shores, and Ørsted – with BOEM
leases off the New Jersey coast in light of confidentiality concerns. A single meeting was held with other
OSW developers – EDP, EnBW, RWE, and Avangrid. Most stated their preference for HVAC radial export
cables for short distances, confirmed cable technical specifications, installation method, burial depth and
arrangement, and monitoring techniques. Many were concerned about actual ocean grid benefits,
coordination, timing, and project-on-project risk. Some pointed out that the underlying transmission
problem is the onshore grid and identified potential problems and risks of any future-proofing scheme.
Many were strongly in favor of developing shoreline POIs connected to New Jersey’s 500 kV backbone
and they were split on the concept of sharing an offshore radial export cable corridor.6 EnBW stressed the
importance of regulatory certainty as “…a requirement for investor confidence and in the case of an OSW
specific transmission procurement it cannot be stressed enough that clarity in all areas of this matter must
be a focus…” according to page 15 of its comments dated August 19, 2019. Ørsted explained its decision
to utilize HVAC technology for its Hornsea 1 was a function of cost, system losses, timing, and supply chain
6 Since each cable must be separated from one another, even for a single OSW project with multiple cables, the concept of sharing an offshore corridor may not be practical.

- 14 -
conditions. RWE acknowledged that the first few OSW projects would utilize HVAC radial export cables,
encouraged efficient access to the State’s 500 kV backbone. According to page 5 of its comments of August
19, 2019, RWE recommended the Board conduct “…a full offshore integration study that will compare
different connection topologies, estimate grid impacts and the need of network upgrades…” with PJM.
The meeting with industry associations included the Business Network for Offshore Wind, Maritime
Association, National Offshore Wind Research and Development Consortium, and AWEA. Most of them
highlighted the potential advantages of a planned offshore transmission system as well as the challenges,
including project-on-project risk. In any case, initial OSW projects should not be held back. The Business
Network encouraged a multi-state planning effort on page 3 of its responses and cautioned
“[t]ransmission system planning is heavily dependent upon highly localized conditions.”
TOs welcomed the ability to participate in an ocean grid and would contribute their knowledge of the local
transmission system. Exelon/ACE provided useful background information on the uncertain PJM
treatment of an OSW injection that exceeded the largest generating source in the Eastern Mid-Atlantic
Area Council (EMAAC) or in the entire PJM footprint and suggested this question is better suited for PJM.
Exelon/ACE also suggested the Board consider an offshore collector system, a design between radial
export cables and an ocean grid and similar to the power corridor concept, to minimize the number of
coastal cables. First Energy/JCP&L supported an ocean grid to facilitate OSW development, maximize the
use of existing transmission infrastructure, and reduce environmental impacts. PSE&G agreed with Board
that HVAC radial export cables should be used for the next few procurement rounds and then transition
to an ocean grid design that would provide resiliency and environmental benefits. All agreed that PJM’s
interconnection process has flaws, e.g., too many projects get cancelled at the very end of the process
leaving remaining projects with uncertain upgrade costs and upgrades tied to capacity interconnection
rights leave OSW projects exposed to curtailments.7
Fishing interests included the Garden State Seafood Association, the Responsible Offshore Development
Alliance, Anglers for Offshore Wind, and the National Wildlife Federation. They were primarily concerned
with short-term seabed disturbance and long-term risk of entanglement of trawls, dredges, or rakes on
cables or mattress coverings. Given typical gear penetration depths of up to 1 foot, the cable burial depth
of 2 meters recommended by the New Jersey Department of Environmental Protection (DEP) should be
protective, provided that cables are routinely inspected and maintained, and as long as nautical maps
accurately indicate their positions.8
The meeting with the Eastern Atlantic States Regional Council of Carpenters and International
Brotherhood of Electrical Workers focused on maximizing job opportunities for New Jersey residents in
light of foreign ownership of offshore transmission assets.
A meeting was held with consultants, including Guidehouse, Ramboll, Tufts, WSP, Center for Renewables
Integration, CLEAResult, and 1898 & Co. Many supported planned offshore transmission to overcome the
limitations of coastal POIs, minimize environmental disturbances, and remove the interconnection risk
7 Capacity interconnection rights were previously referred to as capacity injection rights. 8 See Considerations for Offshore Wind Cable Burial Depth memo from Colleen Brust, Marine Fisheries Administration to Megan Brunatti, Office of Permit Coordination and Environmental Review, July 23, 2019.
- 15 -
from OSW developers. They also took note of the need for coordination and project-on-project risks.
Guidehouse submitted reports it has authored and provided a comprehensive review of European
offshore transmission systems. The Center for Renewables Integration emphasized that any planned
system be designed to interconnect more than the current goal of 7.5 GW and be coordinated with other
East Coast states. Regulatory shortcomings were identified at the state, regional, and federal levels. The
Center for Renewables Integration concluded on page 5 of its response of August 21, 2019 “…the Board
should develop a comprehensive long-term strategy for offshore transmission that may include both
radial export and ocean grid elements.”
All of the environmental organizations, including Clean Ocean Action, Jersey Renews, and NJ Audubon
encouraged engagement with the Board, local communities, and other policymakers, reducing
environmental impacts, and protecting the coastline. The number of landfalls should be minimized and
planned carefully to avoid coastal habitats.
The meeting with transmission developers included LS Power; Hitachi ABB Power Grids submitted written
comments after the meeting. LS Power emphasized the benefits of a competitive transmission process
and suggested that incumbent TOs not have priority over independent developers. Transmission should
be planned holistically, innovation should be encouraged, and cost caps could be arranged to protect
ratepayers. Hitachi ABB Power Grids, a major supplier of high-voltage power equipment, emphasized the
need for comprehensive studies to make an informed offshore transmission decision.
The meeting with New Jersey government agencies and others included Point Pleasant Beach, Enel,
PennFleet (truck maintenance and repair), the Public Power Association, and Ocean City. Many expressed
concern that the quality of life along the coastline should not be affected, especially around Ocean City,
the tourism and fishing industries are not harmed, and the Board makes this process transparent.
In the meeting with agencies from other states, MADOER explained that it did not evaluate an ocean grid
design but considered and rejected a shared transmission scheme. MADOER indicated ISO-NE’s first
contingency limit is a factor in setting maximum injections and the location of an ocean grid collector
would benefit nearby OSW developers but penalize others. It was unconvinced by the claimed ocean grid
benefits and was concerned the timing of OSW could be delayed. Moreover, the authorized OSW
procurement quantity, 1,600 MW, did not warrant a large-scale backbone or ocean grid. NYSERDA is
soliciting bundled OSW projects and is considering an ocean grid, but that would add a “middle man” to
the planning effort and complicate coordination. NYSERDA provided written reports on cable technology
and fisheries afterwards.
- 16 -
IV. European Lessons Learned
Highlights
Continental Europe has offshore “network grids” that are extensions of the onshore grids.
Ocean grids are rarely used in Europe, if at all. This nomenclature has led to some confusion.
The four studies reviewed below predominantly addressed European regulatory structures for
offshore transmission: centrally led development by TSOs versus OSW developer led with
bundled transmission. The studies did not address different offshore transmission designs.
Continental European TSOs have broad transmission responsibilities compared to New Jersey
TOs and are key in centrally led development. The TSO approach segregates generation and
transmission, making coordination essential to minimize project-on-project risks.
A centralized approach allowed continental European governments to control initial OSW
generation and transmission development. This approach would have inherent limitations in
New Jersey given the multiple parties with transmission responsibilities: BOEM’s leasing
jurisdiction, state permitting and policy authority, corporate transmission ownership, PJM’s
planning and operating responsibilities, and state and federal environmental regulations.
Developer led approaches with bundled generation and transmission can provide economic
advantages even if the radial export cable is later sold to a third party as in the U.K. The
European studies note how competition can lead to lower costs for any configuration.
HVDC systems are suitable for multiple small OSW projects or for long distances but are more
capital-intensive than HVAC radial export cables.
As of year-end 2019, Europe had 22.1 GW of installed OSW capacity. The current European outlook is for
about 70 GW by 2028.9 The U.K. has 45% of total European OSW capacity, followed by Germany at 34%,
and then Denmark, Belgium, and the Netherlands at under 10% each. Ten OSW projects totaling 3,623
MW were completed in 2019: six projects range from 231 MW - 497 MW and the largest, Hornsea One,
was 1,218 MW.10 Turbine capacities used in these projects range from 6.0 MW - 8.4 MW. Water depth is
generally 20-50 meters (65-165 feet) and distance to shore ranges from 15 km (10 miles) to just over 100
9 Wind Europe: Offshore Wind in Europe, Key Trends and Statistics 2019, WindEurope (formerly the European Wind Energy Association), February 2020. There were 110 OSW projects with 5,047 grid-connected turbines as of year-end 2019. The average size OSW project increased from approximately 200 MW in 2009 to 300 MW-400 MW in 2010-2016 and to 621 MW by 2019. 10 Completed projects are those with grid deliveries for some or all of the total project capacity.

- 17 -
km (70 miles).11 The European trends for turbine size, project size, water depth, and distance to shore
have all been increasing in the past few years.
In the U.K. OSW developers typically develop and construct radial export cables that are turned over to
an independent third-party transmission owner.12 In continental Europe, TSOs develop and own network
grids that utilize radial export cable and hybrid system designs. Network grids deliver power to single
onshore POIs using both HVAC and HVDC technology. HVAC radial export cables are used for small OSW
projects and projects close to shore. HVDC hybrid systems are used to connect large OSW projects and
clusters of small projects that are further from shore. Hybrid systems can deliver power from multiple
OSW projects that are comparatively small by today’s standards, e.g., 250-400 MW. TenneT GmbH, the
German TSO with the largest offshore transmission portfolio, has twelve radial export cables and hybrid
systems but no ocean grids as shown in Figure 3 below.
11 For comparison purposes, the BVG report, Offshore Wind Supply Chain, Infrastructure and Workforce Development for 7,500 MW for 2035 provided as Appendix C to the Strategic Plan, assumes water depths of 20-40 meters and offshore transmission cable distances of 20-45 miles for Rounds 1-6. 12 Despite its size and comparatively long distance to shore of about 75 miles, Hornsea One was designed with a 220 kV HVAC cable and the OSW industry’s first offshore reactive compensation platform to reduce line losses.
- 18 -
Figure 4. TenneT GmbH Offshore Radial and Hybrid Transmission Projects
LAI reviewed and summarized four studies of the European OSW industry for lessons learned. European
transmission systems can be divided based on their physical designs (radial export cables versus hybrid
designs) or by regulatory policy and ownership structures (developer led transmission as in the U.K. or
centrally led transmission developed by TSOs as rate-based assets with ratepayer cost recovery in other
European countries). All of the studies we reviewed compared the different regulatory and ownership
approaches, not the physical designs. Of the four studies, only the first one below was not commissioned
by an OSW generation or transmission company. LAI observes that the other three studies support
conclusions consistent with the sponsoring companies’ commercial interests.
Study 1: Offshore Wind - A European Perspective, New York Power Authority
The New York Power Authority (NYPA) released an August 2019 study that reviewed the OSW transmission and interconnection strategies in four European countries – Denmark, Netherlands, Germany, and the U.K. – to gain lessons learned. At the time, these four countries had 16 GW of installed OSW capacity. The NYPA Study divided transmission development and ownership into three models:
- 19 -
Developer-owned: the OSW developer is responsible for offshore transmission planning, construction, ownership, and operations. The developer leases the site and bears the costs and risks.
Transmission System Operator-owned: the TSO is responsible for all facets of the offshore transmission asset and typically includes it into its integrated long-term grid plan. It is also referred to as “centrally led” because the entire planning, development, construction, and operation is done by the TSO, in effect an arm of the central government. Most European countries have adopted this approach.
Third party-owned: in this variation of the developer led model, the developer plans and constructs the transmission asset that is subsequently competitively bid and sold to a third party. This approach is used in the U.K. where the transmission asset must be sold to a third-party Offshore Transmission Owner (OFTO).
OSW procurements in the U.S. currently utilize the developer-owned model that integrates generation
and transmission development. The U.K. has third-party owned transmission with HVAC radial export
cables that are typically developed by the OSW developer and turned over to third parties that own and
operate them. The three other countries in the study, Denmark, the Netherlands, and Germany, have
centrally led development in which the TSOs have planning, construction, ownership, and operation
responsibilities of their offshore network grids.13
The NYPA Study, page 16, explained “…in all three markets where the TSO owns the OSW transmission
assets (i.e., Denmark, Netherlands, Germany), it is also responsible for long-term grid planning, often in
close coordination with the government. In these countries the costs are fully passed through to rate
payers.” The NYPA Study reported the TSO model had certain advantages, which are largely unavailable
in the US context. For instance, the TSO model: (i) allowed government policy-makers to pave the way for
early OSW developers by pre-approving offshore grids, (ii) assured offshore transmission compatibility
with the existing onshore grid, (iii) facilitated and directed future OSW development by establishing OSW
project locations, (iv) addressed broader grid considerations such as load growth, redundancy, and
ancillary services, (v) allowed the TSOs to participate in the growing OSW industry, and (vi) permitted OSW
developers to bid lower costs without transmission burdens. This centrally led approach with significant
TSO involvement was logical and appropriate in the early days of OSW development and in regulated
power markets with significant government direction.
The TSO model requires a high degree of coordination with OSW developers. Compensation may be
required in case of transmission delays or outages.14 One delay example stands out in which TenneT GmbH
was responsible for providing an OSW developer with an offshore connection to the transmission grid
(discussed on page 47 of this Study). This required significant time and effort to coordinate the generation
and transmission projects. Technical issues and misalignment of risks and incentives between the two
parties led to long grid delays and to compensation payments that were ultimately borne by German
13 The term “network grid” is often used by European TSOs to mean any extension of their transmission networks; it does not mean an ocean grid with multiple cables and POIs. 14 The study mentioned that in Denmark, “Energinet also fully compensates the developer in case of delays or outages and ensures the onshore grid can integrate offshore wind.”
- 20 -
ratepayers. After regulatory reform, site development became more transparent and TenneT GmbH
improved its planning and construction process. This reformed model better aligns risks between
developers and the TSO, which remains liable for generator revenue losses due to transmission delays.
Similarly, Danish TSOs follow a centrally led model and fully compensate OSW developers in case of delays
or outages.
When the OSW developer is responsible for the transmission assets, the commercial interests and risks
for the two components are aligned. The interconnection process assures technical compatibility between
the radial export cable and the onshore grid, but broader planning considerations are not incorporated.
Third-party ownership of radial export cables is mandated in the U.K. The transmission asset can be
planned and constructed by the developer but must be sold to an OFTO via a competitive solicitation run
by the U.K. Office of Gas and Electricity Markets (OFGEM). Having the OSW developer plan and construct
the radial export cable provides significant coordination advantages to support timely commercial
operation while allowing operating costs to be borne by private industries. As confirmed in the Navigant
Report reviewed below, the OFTO recovers its investments from TSO revenues, which is partly covered by
revenues from the OSW developer.
The NYPA Study found that both the developer led and centrally planned approaches have advantages,
As explained on page 15, however, the growth in OSW project sizes are “…potentially reducing the
rationale for building a networked transmission system in some instances.”
“A network grid, i.e. hybrid, model may achieve transmission economies of scale if
connecting multiple small projects. In Germany, it requires higher levels of coordination
and planning among different parties. It may, therefore, lead to expensive overbuild of
capacity or delay project execution. In contrast, a radial grid model is simpler, easier to
plan, size, and execute on a project-by-project basis. Even in the U.K., with more than
7,000 miles of shoreline, the radial model is reaching saturation in interconnection points
available for the projects.”
In its Executive Summary on pages 17-18, the NYPA Study had four broad conclusions:
The most effective path to low-cost wind power is through scale and healthy competition.
The NYPA Study explained “…as each country progressed through development, and as the market
competition increased, all countries switched to more competitive [OSW generation] tenders and PPAs in
order to encourage more competition.” Feed-in tariffs, for example, are being replaced by competitive
tenders, analogous to the competitive OSW procurement process used by New Jersey and other Atlantic
coastal states.
The offshore transmission model used is dependent on a variety of physical and non-physical
factors including geography. Regardless of model chosen, the coordination and incentive
alignment between all parties is critical and needs to match their levels of respective capabilities.
This conclusion alluded to Germany’s centrally planned transmission development approach, which may
be more appropriate for its relatively shorter coastline compared to other countries, e.g., the U.K. The
NYPA Study states “…Germany, with only 1,500 miles, has opted for a more networked option. While this
- 21 -
enables Germany to develop more wind parks with minimal disturbance to the environmentally sensitive
shoreline, it does present coordination, accountability and incentive alignment challenges between the
developer and the TSO. These challenges caused delays in implementation, ultimately burdening the
consumer with the additional costs. In response to these challenges, Germany made a change to
regulations creating a TSO lead grid planning process, eliminating delays.”
Visible, long-term grid planning on and offshore, removes barriers to entry, improves
coordination, and lowers costs.
NYPA explained that “Denmark, the Netherlands and Germany now carry out centralized, long-term
planning for siting, generation, transmission, interconnection and onshore transmission upgrades in an
attempt to provide as much forward-looking visibility to developers, grid operators and other key
stakeholders.” Given that the European electricity system was not originally designed to integrate large
quantities of OSW, its growth has put new stresses on the existing grid and would have created
transmission bottlenecks. The NYPA Study asserts that greater visibility early in the grid planning process
removed barriers to entry for new developers, improved coordination between the developers and the
TSOs, facilitated infrastructure upgrades, and resulted in the efficient use of limited POIs.
Cross-border coordination helps countries leverage planned transmission infrastructure, achieve
resource flexibility, and gain economies of scale.
A high percentage of OSW development has occurred in the North Sea and much more is planned for
coming decades. Large areas of the North Sea are sufficiently shallow to permit bottom-fixed foundations,
e.g., monopiles, gravity, and jacket designs. However, the North Sea is enclosed on three sides by the U.K.,
Belgium, Germany, the Netherlands, Denmark, and Norway, so coordinating OSW development and
transmission routes was consequently critical. New Jersey and other coastal states are not so
geographically restricted, but improved inter-state coordination could still be beneficial.
Study 2: Market Design for an Efficient Transmission of Offshore Wind Energy, DIW ECON
This Study was commissioned by Ørsted and was referenced by Ulrik Stridbaek of Ørsted in his comments
at the Transmission Stakeholder Meeting. DIW ECON is the economics consultancy arm of the German
Institute for Economic Research and works closely with the University of Berlin. The DIW ECON Study,
published in May 2019, compares two regulatory approaches for offshore transmission assets (OTAs). The
first “monopolistic” approach is the dominant continental European model with TSO transmission
development and separate competitive OSW generation procurement. DIW ECON used data from
Germany where the local TSOs, regulated monopolies, are solely responsible for the OTAs. In the second
“competitive” approach, transmission must be competitively bid by the OSW developer (often bundled
with generation as in the U.K.), the local TSO, or independent third parties. DIW ECON chose to compare
the regulatory approaches of offshore transmission in Germany and the U.K. based on similarities in size,
energy policy, European Union membership, economic progress, wage and price levels, technical
knowledge, infrastructure, and North Sea maritime conditions.

- 22 -
Figure 5. DIW ECON Cost Difference Break-Down of OTAs in Germany and in the U.K.
(€/MWh)
As illustrated in Figure 5, the DIW ECON Study calculated the levelized cost of electricity (LCoE) for OTAs
and found (as reported on pages v-vi)“[t]he average LCoE of German OTAs is 35 EUR/MWh, more than
twice as much as the LCoE of British OTAs, which have an average LCoE of 16 EUR/MWh. After accounting
for differences in the distance to shore, the choice of transmission technology, and other relevant factors,
the cost difference between OTAs in Germany and the U.K. is 10 EUR/MWh…The remaining cost
difference can be ascribed to the different regulatory frameworks and thus consolidates the results of the
theoretical analysis: A market design with a competitive tender (which leads to an integrated
development of the OTA in the U.K.) reduces the costs of OTAs compared to a monopolistic (separate)
regulatory approach.” In other words, allowing the “monopolistic” German TSOs to be solely responsible
for offshore transmission raised the transmission cost by 61% (9.97 €/MWh compared to 16.35 €/MWh).
The DIW ECON Study identified a number of interrelated reasons why the monopolistic model was more
expensive: (i) TSOs are assured of full recovery of costs; (ii) TSOs do not have efficiency incentives; (iii)
TSOs may utilize more expensive transmission technology; (iv) TSOs have more restrictive planning
parameters; (v) separating transmission increases coordination costs; and (v) TSO OTAs have excess and
unused capacity when completed in advance of OSW projects.
- 23 -
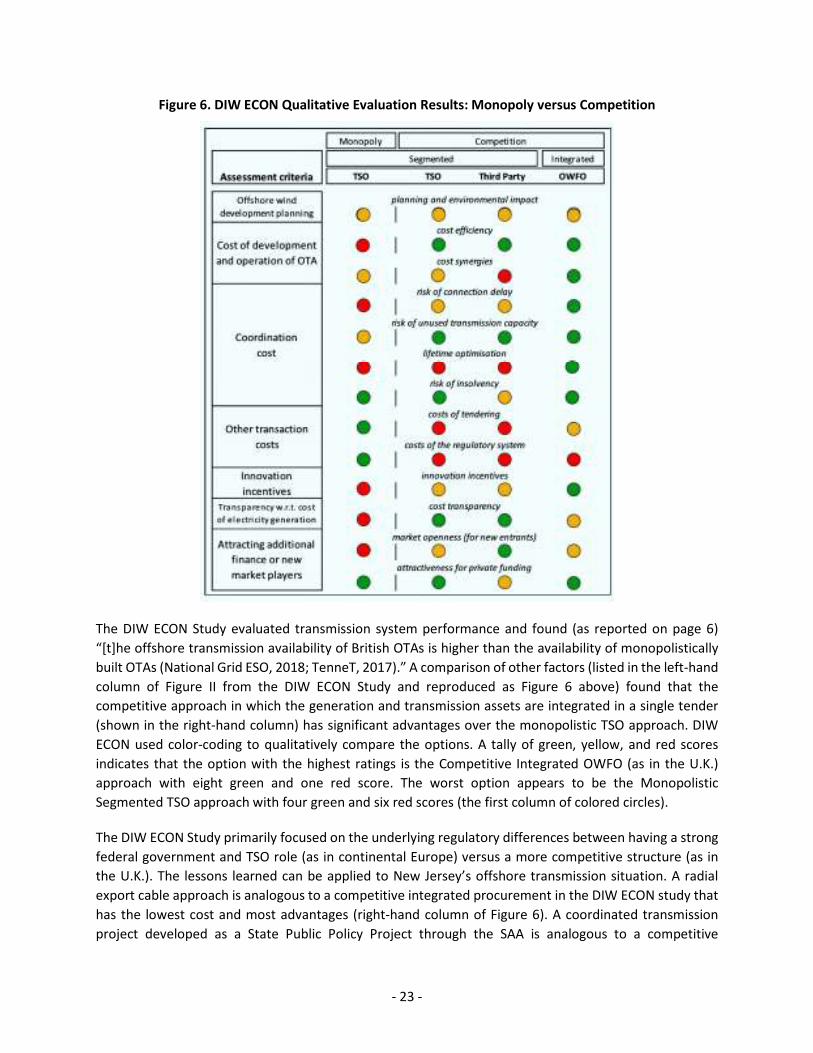
Figure 6. DIW ECON Qualitative Evaluation Results: Monopoly versus Competition
The DIW ECON Study evaluated transmission system performance and found (as reported on page 6)
“[t]he offshore transmission availability of British OTAs is higher than the availability of monopolistically
built OTAs (National Grid ESO, 2018; TenneT, 2017).” A comparison of other factors (listed in the left-hand
column of Figure II from the DIW ECON Study and reproduced as Figure 6 above) found that the
competitive approach in which the generation and transmission assets are integrated in a single tender
(shown in the right-hand column) has significant advantages over the monopolistic TSO approach. DIW
ECON used color-coding to qualitatively compare the options. A tally of green, yellow, and red scores
indicates that the option with the highest ratings is the Competitive Integrated OWFO (as in the U.K.)
approach with eight green and one red score. The worst option appears to be the Monopolistic
Segmented TSO approach with four green and six red scores (the first column of colored circles).
The DIW ECON Study primarily focused on the underlying regulatory differences between having a strong
federal government and TSO role (as in continental Europe) versus a more competitive structure (as in
the U.K.). The lessons learned can be applied to New Jersey’s offshore transmission situation. A radial
export cable approach is analogous to a competitive integrated procurement in the DIW ECON study that
has the lowest cost and most advantages (right-hand column of Figure 6). A coordinated transmission
project developed as a State Public Policy Project through the SAA is analogous to a competitive

- 24 -
segmented transmission project (middle two columns of Figure 6) and should provide some cost
advantages. A coordinated transmission project developed as a Supplemental Project through the SAA
(currently not under consideration by the Board) is analogous to a monopoly segmented transmission
project (left-hand column of Figure 6) and would have the highest cost and the most disadvantages.
Study 3: Connecting Offshore Wind Farms – A Comparison of Offshore Electricity Grid
Development Models in Northwest Europe, Navigant Netherlands B.V.
The July 1, 2019 Navigant Report, referenced by Rate Counsel at the Transmission Stakeholder Meeting,
was conducted for Réseau de Transport d'Électricité (RTE), the French TSO, and TenneT TSO, B.V., a Dutch
TSO and a corporate affiliate of TenneT GmbH.15 The Report compares two development and ownership
models for OSW transmission in the context of a massive 70 GW planned development in the North Sea
to achieve Europe’s zero carbon goal. The two models were “Developer Build” where transmission is the
responsibility of the OSW developer and “TSO Build” where a TSO is responsible as mandated by the
federal government. Costs were evaluated on a quantitative basis and other factors were evaluated on a
qualitative basis. The Navigant Report did not compare physical designs of offshore transmission systems.
The Navigant Report evaluated grid connection capital expenditures (CAPEX) for the two models while
operational aspects were addressed qualitatively. According to page v of the Navigant Report Executive
Summary, “Most European offshore wind markets have transitioned from a ‘Developer Build’ to a ‘TSO
Build’ model. Governments see benefits in the TSO build model and have taken a larger share of the
development risk and costs. This could mean that a larger share of offshore wind will be financed with
public money and that there is less competition in the offshore electricity transmission market, even
though TSO’s have an obligation to organise competition in their tenders.” Shifting transmission
responsibility to the TSOs was designed to assure long-term societal benefits while socializing costs and
risks.
Navigant’s Conclusions
Navigant evaluated the advantages and disadvantages of the TSO Build and Developer Build models, and
drew the following conclusions:
Planning/Design: The TSO model allows for a more holistic and coordinated approach and can plan shared
transmission assets. However, the European experience indicates this process may be unwieldy and
complex. In the developer model, a single party is responsible for integrated development, transmission
development is incremental, and offshore transmission designs may not be standardized.
Commercial / Financial: Given their size and ability to collect rates, TSOs can better leverage costs and
financing but must invest more capital for transmission prior to OSW operation. A TSO may also face lower
competitive pressures which result in higher transmission costs. In contrast, developers must compete for
OSW awards, which provides an incentive to lower costs for both the generation and transmission assets.
15 The TenneT affiliates are 100% owned by TenneT Holding B.V. that is 100% owned by the Dutch government. RTE is 100% owned by French state institutions. Its majority owner is Électricité de France that is 83.6% owned by the French government.

- 25 -
Construction / Interface Risk: Under the TSO approach, separate OSW generation and transmission
development and construction activities must be coordinated to minimize timing and equipment
compatibility problems. Transmission assets can be stranded, with ratepayers bearing the costs, if
interface or other problems between the TSO and the OSW developer cause project delays or
cancellations. Having a bundled approach through the developer model minimizes project delays, but
there is less opportunity for onshore transmission improvements by the OSW developer.
Operations / Reliability: The TSO model allows for transmission assets to be more standardized with clear
development control. In the developer model, OSW developers have a strong incentive to ensure high
export cable system performance, but little incentive to address broader transmission or societal issues.
If transmission assets have a longer design lifetime than a wind farm, long term transmission utilization is
uncertain, but this may not be the case.
Capital Costs
Navigant studied publicly available cost data for OFTO projects in the U.K and TSO projects in Belgium,
Netherlands, and France. The Report relied on six U.K. wind farms that had OFTO licenses granted in 2015
or later and represent a range of offshore wind farm connections from 220 MW to 574 MW. As shown in
Figure 7, each of these six U.K. projects had three data points.16 However, Navigant appears to have relied
on only four TSO transmission projects conceptualized, planned, or built by TenneT NL (TenneT TSO B.V.
in the Netherlands), RTE (France), Elia (Belgium), and Energinet (Denmark).17 These four projects average
656.7 MW, about double the average 341.2 MW size of the six U.K. projects. While “…development costs
are evaluated at a transmission asset main component level…” (as reported on page 11), it is not known
if and how Navigant factored in the disparity in average project sizes that would provide economies of
scale for TSO costs. Navigant did not explain why it relied on one offshore transmission project in the
Netherlands in spite of TenneT TSO B.V. having five projects approved and under development or
construction.18 Navigant also prepared its own estimate for U.K. transmission costs by dividing the total
costs for U.K. developer led projects into various components19
No German transmission projects were included in spite of the fact that TenneT GmbH, an affiliate of the
report client TenneT TSO B.V., has the largest European offshore transmission portfolio of twelve
16 The three data points are (i) “initial transfer value,” the developer’s initial cost estimate, (ii) “indicative transfer value” based upon signed contracts for fabrication and installation, and (iii) “final transfer value” once 90%–95% of the project costs have been incurred. 17 Navigant’s Figure 3 Offshore HVAC Transmission System CAPEX Comparison appears to illustrate only three of these projects. LAI could not determine if Navigant utilized three or four non-U.K. cost estimates. 18 Connecting Wind Energy, https://www.tennet.eu/our-grid/offshore-grid-netherlands/net-op-zee-hollandse-kust-zuid/ 19 Navigant stated “…the goal of the cost assessment is to provide a cost level comparison on component basis, such that they are comparable across different connection capacity ratings and connection lengths. However, only the total CAPEX levels for the U.K. OFTO connections are publicly available through the results of Ofgem transmission asset tenders (OFGEM, 2015, 2016, 2018). No distinction is made between different components. The Navigant E-infra cost model was used to estimate the distribution of total CAPEX costs to its constituent components.” Navigant acknowledged “…the maximum MVA rating of the OFTO OHVSs was 400 MVA, while the TSO assets included substantially larger capacities of 800 MVA.”
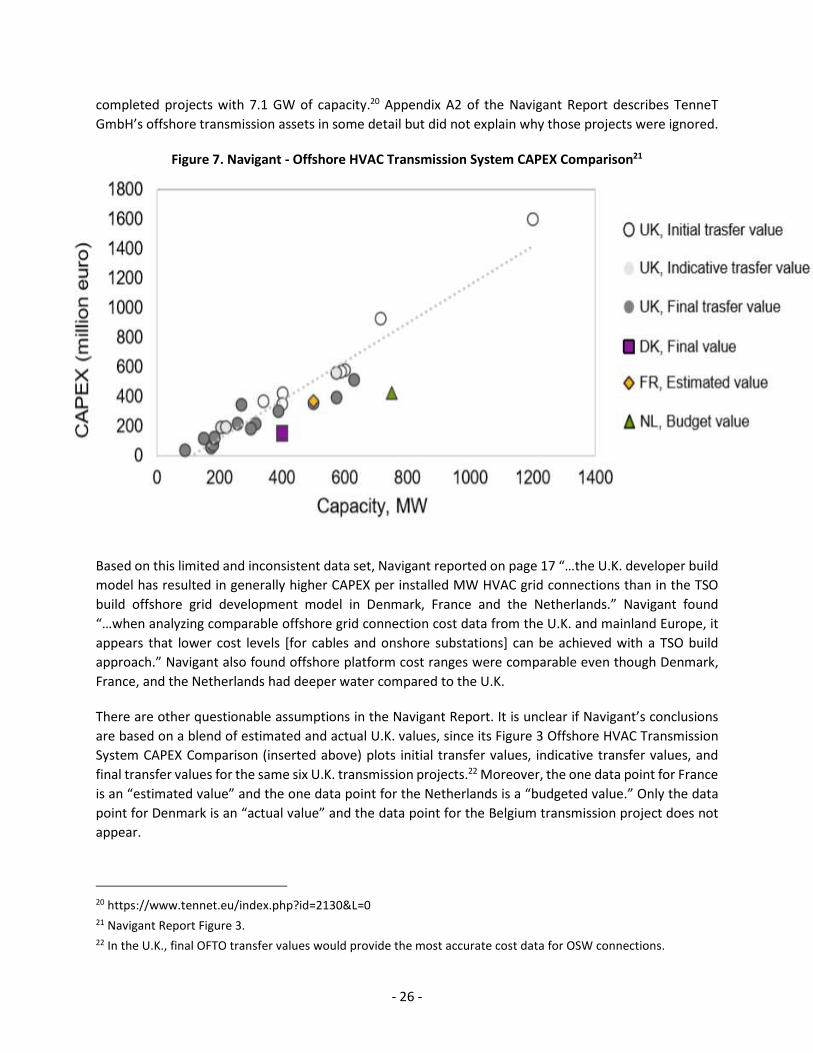
- 26 -
completed projects with 7.1 GW of capacity.20 Appendix A2 of the Navigant Report describes TenneT
GmbH’s offshore transmission assets in some detail but did not explain why those projects were ignored.
Figure 7. Navigant - Offshore HVAC Transmission System CAPEX Comparison21
Based on this limited and inconsistent data set, Navigant reported on page 17 “…the U.K. developer build
model has resulted in generally higher CAPEX per installed MW HVAC grid connections than in the TSO
build offshore grid development model in Denmark, France and the Netherlands.” Navigant found
“…when analyzing comparable offshore grid connection cost data from the U.K. and mainland Europe, it
appears that lower cost levels [for cables and onshore substations] can be achieved with a TSO build
approach.” Navigant also found offshore platform cost ranges were comparable even though Denmark,
France, and the Netherlands had deeper water compared to the U.K.
There are other questionable assumptions in the Navigant Report. It is unclear if Navigant’s conclusions
are based on a blend of estimated and actual U.K. values, since its Figure 3 Offshore HVAC Transmission
System CAPEX Comparison (inserted above) plots initial transfer values, indicative transfer values, and
final transfer values for the same six U.K. transmission projects.22 Moreover, the one data point for France
is an “estimated value” and the one data point for the Netherlands is a “budgeted value.” Only the data
point for Denmark is an “actual value” and the data point for the Belgium transmission project does not
appear.
20 https://www.tennet.eu/index.php?id=2130&L=0 21 Navigant Report Figure 3. 22 In the U.K., final OFTO transfer values would provide the most accurate cost data for OSW connections.

- 27 -
Navigant concluded that the TSO approach to offshore transmission development is less costly than the
developer approach but seemed to ignore its limited and questionable data set. Navigant also concluded
the TSO approach may have longer-term benefits since these systems are better able to standardize
offshore grid development and grid connection. European countries will need to integrate large-scale and
distant OSW clusters and maintain supply security as intermittent resources become a larger portion of
the supply stack. In addition, the Navigant Report found that in five out of six countries evaluated, the
TSO has the responsibility for onshore and offshore development to synergize longer term system
planning and integration of renewables. Lastly, the Report raised a need to coordinate integration with
the onshore grid by indicating (on page 17) that “with a growing offshore wind portfolio secure integration
into the onshore energy system will become increasingly important.”
Grid Connection
Navigant found that OSW generation costs are decreasing while grid connection costs are becoming a
larger part of the combined cost. OSW generators now bid zero subsidy prices while grid connection costs
continue to be supported with government subsidies, leading to an “…increasing focus on innovation and
investment reduction for grid connection systems...”23 The location of European OSW sites and POIs have
a large bearing on the choice of physical grid connection. Most OSW facilities that are close to shore are
connected via HVAC cables while long transmission distances have utilized HVDC technology to “optimize”
the transmission system in terms of costs and electrical losses. The Report breaks down transmission
CAPEX as follows: (i) the Offshore High Voltage Station (OHVS) and offshore cable makes up the vast
majority of the total, (ii) onshore substation costs vary between 8%-16%, (iii) onshore grid connection to
the TSO varies between 2%-5%, and (iv) project management costs vary between 3%-5%.
Financing
Given that “transmission tariffs are regulated by law and monitored by the national electricity regulator”
as reported on page 6, the TSO build model allows the TSO to directly finance construction of onshore
and offshore assets and recover these costs through a government subsidy or tariff. In a developer build
model, the developer (or OFTO in some instances) finances grid connections and sells the assets to an
OFTO via a competitive tender as mandated in the U.K. The OSW developer is responsible for system
operation, but the OFTO maintains the transmission assets and recovers its costs through revenues from
the TSO.
23 Navigant Report page 1. In regard to Danish subsides, Navigant indicated “…the scope of the grid connection will be financed together with the overall subsidies through the Danish state budget. As Energinet will still be responsible for developing the onshore grid connection, the winner of the tender will need to repay the costs to Energinet.”

- 28 -
Study 4: Transmission Policy Lessons from Europe’s Offshore Wind Experience, Dr. Deniz
Ozkan
Dr. Ozkan reviewed European OSW progress as of January 2018 for Atlantic Grid Development, an ocean
grid proponent.24 Dr. Ozkan identified key OSW industry trends on page 1 of the Summary:
“New wind farms are larger and sited farther from shore. These larger farms are
increasingly being served by interconnected transmission networks that are built, owned
and operated by independent companies – typically the grid operators [TSOs]… this trend
is particularly clear in Germany, Denmark and the Netherlands. It’s a slightly different
pattern in the U.K., where we see transmission that is first developed and built by wind
project developers, and then sold to independent financial owners…”
Dr. Ozkan found that policy-makers in Germany, Denmark, and the Netherlands decided to designate OSW
locations, permit sites for development, and designate the TSOs to build the transmission facilities in
advance to best serve the interests of ratepayers and to protect the environment. This has reduced
permitting complexity and risk, promoted OSW competition, and lowered OSW energy prices. According
to page 2 of the Summary, “[b]etter planning of offshore circuits reduces the environmental impact on
the seabed and minimizes land interconnection upgrades, it reduces costs, and it leads to networked
offshore transmission that promotes European energy market integration.” As with the other studies,
“networked offshore transmission” refers to integrating offshore transmission systems with the onshore
grid and does not imply the use of offshore ocean grids.
At the time of Dr. Ozkan’s study, European OSW capacity was about one-half of the current capacity and
the average project size was 380 MW. There would have been cost savings and environmental benefits of
delivering energy from three such wind farms to shore via a hybrid system with a single HVDC export
cable. Given current HVDC cable capacity limits, that benefit would not be available for OSW projects of
1,000 MW - 1,200 MW. The study reported on page 3 that in the Netherlands, for example, “…to create
economies of scale, the national electricity Transmission System Operator TenneT will construct five
standardized platforms with a capacity of 700 MW each within the wind farm zones. They will each be
connected to the national grid with two 220kV export cables.” According to the information on TenneT
TSO B.V.’s website, these five projects will be HVAC radial export cables and HVAC hybrid systems, not
ocean grids. Dr. Ozkan reported that OSW generation costs in the Netherlands have been decreasing, but
she did not address the OSW transmission cost component.
The TSO model was also adopted in Denmark and Germany. While Dr. Ozkan reported low OSW bid prices,
transmission costs were again ignored. She referenced the well-known incident in Germany where
transmission completion delays harmed OSW developers.25 This highlights the project-on-project risk that
24 Atlantic Grid Development, no longer active, led the Atlantic Wind Connection and its component projects: (i) New Jersey Energy Link along the NJ coast, (ii) Delmarva Energy Link along the Delaware, Maryland, and North Carolina costs, (iii) the Bay Link connecting the first two segments. LAI was informed that Atlantic Wind is no longer pursuing this project due to a lack of state interest and financial support. Whether or not Atlantic Wind would resume development in response to the SAA initiative is unknown. 25 This incident was also mentioned in the NYPA Report, referenced above.
- 29 -
is often mentioned by ocean grid opponents. While Dr. Ozkan did not describe the incident in detail, “[a]
study by the Hertie School of Governance found that the regulated grid connection slowed down the
planned expansion of offshore wind energy in Germany with time delays of 13 months on average per
park, increasing rate payer costs by more than €1 Billion through 2014.”26 The major causes included
Germany’s “ambitious offshore wind and renewable energy installed capacity targets”, TenneT GmbH “did
not have enough capacity in terms of financing, knowledge and staff”, and “suppliers underestimated the
lead time to develop and build the first offshore HVDC converters.” TenneT appears to have resolved
these deficiencies since then as discussed on pages 54-55 of this Study.
Dr. Ozkan described the U.K.’s radial export cable approach, in which the transmission assets have to be
competitively sold to a third party, as being designed to ensure low ratepayer costs. On page 10 she
mentioned the U.K. government “…launched an Offshore Transmission Coordination Project to evaluate
better ways to develop transmission.” The U.K. government report “…found that some parts of the
offshore network could exploit a coordinated approach to developing the offshore transmission network,
and this may result in an 8 to 15% overall cost reduction when compared to the radial approach.” At the
time of the U.K. report however, OSW projects were relatively small, which would allow a single HVDC
radial export cable to serve multiple OSW projects. Moreover, the U.K. report highlighted the increased
risk of transmission assets being “stranded” when transmission is built but then underutilized as occurred
in Germany.
Lessons Learned Findings
The four studies have certain inconsistencies due to differences in key assumptions, study approaches,
e.g., by physical layout or by regulatory policy, or the commercial interests of the study clients. While
there are lessons to be learned, it is more important to recognize New Jersey’s unique characteristics and
particular factors. Many speakers at the Transmission Stakeholder Meeting recommended that the Board
conduct an independent study that explicitly considers New Jersey’s unique characteristics. Rate
Counsel’s final recommendation on page 19 was that the Board should “…enter into an investigation to
explore the issues associate with these…OSW transmission projects and the host of financial, legal, and
regulatory issues associate with such a structure.” Francis Chartrand of Atlantic Shores also agreed that
there is no perfect approach in his presentation at the Transmission Stakeholder Meeting. According to
page 23 of the meeting transcript, “All European systems implemented to date have good and bad points…
Everything [ev]olved rather than being planned from experience.” On page 3 of her comments for the
Transmission Stakeholder Meeting, Liz Burdock of the Business Network for Offshore Wind recommended
that New Jersey should take lessons learned from prior European and US experiences but “New Jersey is
unique, and its offshore wind transmission approach should be designed to accommodate the unique
drivers of its current and future energy picture.” Ørsted made the same point on page 1of its comments
submitted for the Transmission Stakeholder Meeting: “New Jersey is unique in terms of its offshore wind
26 Ozkan study page 9. The incident occurred in 2012-14 when the federal government and TenneT, one of the German TSOs, underestimated the challenges of completing the offshore transmission systems. In its Working Paper, Offshore Wind Power Expansion in Germany - Scale, Patterns and Causes of Time Delays and Cost Overruns, the Hertie School of Governance found that TenneT was required to compensate OSW developers for 90% of forgone revenues and ratepayers were required to pay over €1 billion in compensation for lost revenues to eight delayed projects. A full explanation is provided on pages 54-55 of this Study.

- 30 -
ambitions, onshore grid and cable landing constraints, socio-economic policies, and incentive structures.
This means lessons learned from other jurisdictions are very difficult to apply without very deep
knowledge of those frameworks.”
Since the four studies were published, we have learned that Denmark has moved away from segmented
transmission and generation to a bundled structure for its OSW procurements. As of year-end 2019,
Denmark had 14 OSW projects totaling 1,703 MW, the third most in Europe (after the U.K. and Germany).
The Danish TSO Energinet has been responsible for constructing and operating the offshore substation
and export cables. This will change for the next three OSW projects. Bids for the first one, the 800-1,000
MW Thor project, will be due in November 2021 with a commercial operating date (COD) no later than
2027.
With the caveats that there is no perfect approach and the selected offshore transmission option must
recognize New Jersey’s unique characteristics, we draw the following lessons learned (in no particular
order):
(1) Ocean grids are rarely utilized in Europe.
Despite the claimed benefits and the considerable attention being paid to ocean grids, they are rarely
used in Europe, if at all.27 Proponents often point to many offshore European “network grids” as an
indication of the wide use of ocean grids, but TSOs use that term generally for their onshore and offshore
transmission assets. Simply put, a network grid project is not an ocean grid. This terminology has
understandably led to some confusion.28 European TSO offshore transmission systems are predominantly
radial export cables and hybrid systems.29 The U.K., with the largest amount of OSW generation in Europe,
utilizes HVAC radial export cables (as did New Jersey and other Atlantic coast states) but no ocean grids.
TenneT GmbH, the German TSO with the largest European offshore transmission portfolio, has twelve
HVAC radial export cables and HVDC hybrid systems but owns no ocean grids. Its Dutch affiliate, TenneT
TSO B.V., has five offshore transmission projects in construction or under development, all of which are
HVAC radial export cable and HVAC hybrid projects; none are ocean grids.
(2) Competition and larger OSW project capacities lead to lower transmission costs.
The four studies note how competition in Europe, through competitive tenders or market forces, can lead
to lower offshore transmission costs. This is especially true for developer led approaches where
generation and transmission are bid as bundled packages, even if the radial export cable is later sold to a
27 LAI is not aware of any European ocean grids delivering OSW energy from multiple projects to multiple POIs. The proposed North Sea Power Hub would be an ocean grid but completion is not planned for at least a decade. 28 For example, Dr. Ozkan stated: “Better planning of offshore circuits reduces the environmental impact on the seabed and minimizes land interconnection upgrades, it reduces costs, and it leads to networked offshore transmission that promotes European energy market integration.” As with other reports, “networked offshore transmission” refers to integrating offshore transmission systems with the onshore grid and does not imply an offshore ocean grid design. 29 A TenneT Jan 13, 2020 press release states “TenneT's current total of twelve operating offshore grid connection systems for the transmission of wind energy from the German North Sea to land alone now deliver a total capacity of 7,132 megawatts.”
- 31 -
third party (as in the U.K.). Absent workable competition, offshore transmission costs for TSOs may be
unnecessarily high. By soliciting competitive transmission solutions through the SAA, New Jersey can
encourage innovative and cost-effective projects. More work is needed to clarify the degree to which
competition can lower costs for a coordinated transmission solution and to ensure OSW generation and
transmission coordination. Much of this data will be provided through the RTEP proposal window opened
through the SAA. There does not appear to be a dividing line regarding project size that induces lower
transmission costs, but the industry shift to larger project capacities in Europe and the U.S. over the last
few years has demonstrated price efficiency for both the generation and transmission components.
(3) Coordination of segmented offshore generation and transmission is critical.
Coordination is essential when OSW generation and transmission are segmented. If completed too late,
transmission delays can result in large compensation payments ultimately borne by ratepayers. If
completed too early, ratepayers must pay for unutilized transmission capacity. Integrated OSW
generation and transmission aligns incentives and avoids coordination issues between generators and
transmission entities. Integrated OSW generation and transmission also insulates ratepayers from those
financial penalties. Further consideration may be necessary to determine how active coordination to
support segmented generation and transmission can be achieved without exposing ratepayers to
increased risks, some of which may be avoidable.
(4) Centrally led transmission development with strong oversight can be appropriate in early stage OSW
development to provide long-term planning and grid benefits. PJM’s SAA offers similar benefits.
A centrally led approach with strong federal regulatory oversight allowed European governments to
designate OSW sites and control offshore generation and transmission development. This may have been
appropriate for the nascent European OSW industry in which technology had yet to mature and for TSOs
that play a central role of transmission planning, development, ownership, and operation with only one
layer of federal regulation. Centrally led transmission development allowed governments to encourage
public acceptance of OSW, define long-term goals, and lower OSW generation costs.
A coordinated offshore transmission project pursued through the SAA has some of the centrally led
European characteristics, e.g., a single entity to build and operate it with rate-based cost recovery. At the
same time, a competitive SAA process should result in a cost-effective project and avoid a key
disadvantage of TSOs not having to compete against other transmission developers. The SAA maybe
appropriate for New Jersey even with the of multitude of local, state, regional, and federal agencies and
companies involved in transmission planning, construction, regulation, ownership, and operation.
Notwithstanding cost considerations, the SAA could coordinate these diverse interests around a defined
and existing public planning process that can minimize environmental impacts while encouraging
innovation and competition.
(5) HVDC cable technology can transmit large amounts of power over long distances with lower losses
but converters are expensive and incur their own losses.
The BorWin transmission projects in the North Sea were developed over the past decade to demonstrate
increasing HVDC cable capacities and distances (as explained on page 61 of this Study). However, the
BOEM lease areas held by Atlantic Shores, Ocean Wind, and Garden State Ocean Energy are only about
- 32 -
15 miles at their closet points to the New Jersey coast. BOEM’s recommended primary and secondary
portions of the proposed Hudson South lease area are roughly 25-35 miles away and the Equinor lease
area is about 40 miles away. HVAC radial export cable losses should be lower than HVDC options at such
short distances and would avoid the need for expensive offshore and onshore converters. Any cost and
loss differentials will have to be weighed against environmental impacts as discussed later in this Study.
(6) A centrally led approach to site development and transmission construction was appropriate for the
nascent European OSW industry and provided federal government control of project development.
Many European countries initiated their OSW development through a centrally led approach by
designating OSW locations and TSOs to plan and build the transmission facilities. Their goals included
specifying project locations, involving the TSOs, and minimizing environmental disturbances. At this point
in time, the global OSW industry is much farther advanced so that a centrally led process may not be
required. The developer led model can also achieve environmental protection goals with appropriate
regulatory jurisdiction, a rigorous permit process, and vigilant oversight. A qualitative comparison of the
two approaches in the DIW ECON Study revealed no significant differences in environmental impacts.
(7) Hybrid transmission systems can provide transmission for clusters of small OSW projects, but current
OSW projects are large enough to fully utilize the capacity of a single HVDC transmission cable making
hybrids impractical.
European OSW projects averaged 300 MW - 400 MW through 2016, allowing project clusters to utilize a
single hybrid transmission cable. For example, all of TenneT GmbH’s offshore transmission projects have
been HVAC and HVDC radial export cables or hybrid systems. TenneT GmbH’s two projects under
construction and the two under development are HVDC hybrid designs with 900 MW capacities.30 Current
marine HVDC cable and converter technology can transmit up to about 1,200 MW. While marine HVDC
technology is expected to improve, any increased capacity may have limited benefits depending on the
specific HVDC design and PJM reliability criteria. Since the Board’s OSW solicitation plan calls for projects
of 1,100 MW - 1,400 MW, a hybrid design (even with HVDC cables) could not accommodate more than
one OSW project and is therefore impractical.
In summary, the Board should encourage transmission developers to develop the most cost-efficient
design with the fewest environmental disturbances through the SAA and compare those coordinated
transmission solutions to radial export cable schemes.
30 The last two completed were DolWin 3 (2018) and BorWin 3 (2019); projects under construction are DolWin 6 (2023) and DolWin 5 (2024); projects under development are BorWin 5 (2025) and BorWin 6 (2027).
- 33 -
V. Offshore Transmission for New Jersey
Highlights
Current technology allows underwater HVAC cables to transmit 350 MW - 400 MW and HVDC cables up to 1,200 MW. Hence, a 1,200 MW OSW project would require three HVAC radial export cables or one HVDC cable.
A coordinated transmission project would likely use HVDC cables and address New Jersey’s coastal POI limitations. An ocean grid would connect to multiple POIs in New Jersey while a power corridor would combine multiple cables in one ROW to a single POI.
Assuming 1 nautical mile spacing of 12 MW turbines, we estimate New Jersey’s 7.5 GW build-out will require the Ocean Wind, Atlantic Shores, and Garden State lease areas plus at least one large OSW project in either Equinor’s remaining lease area or the proposed Hudson South lease area.
Early OSW Development
In the early days of European OSW development, projects were much smaller than they are today. Until
2016, European OSW projects were in the 300 MW - 400 MW range.31 Last year, the average European
OSW project size grew to just over 600 MW, and the largest was the 1,218 MW Hornsea 1 owned by
Ørsted. The largest OSW project announced so far this year is the 1,500 MW Hollandse Kust Zuid (south)
wind farm off the coast of the Netherlands. This project combines two projects that were awarded to
Vattenfall in 2018 and 2019 and is expected to become fully operational in 2023.32
It is a similar story in the US. The first two domestic completed projects were the 30 MW Block Island
Wind Farm and, more recently, the 12 MW Coastal Virginia Offshore Wind project. Both are small
demonstration projects. The Block Island Wind Farm, comprised of five 6 MW turbines, was developed by
Deepwater Wind (later acquired by Ørsted) in Rhode Island state waters and commissioned in 2016. The
Coastal Virginia Offshore Wind project, comprised of two 6 MW turbines, was developed by Dominion
Energy in federal waters and is scheduled to be commissioned later in 2020. An additional six domestic
OSW projects have made it to the final permitting stages, i.e., the project received most but not all permits
and approvals, (as of July 1, 2020) and have averaged 179 MW:
Fisherman’s Energy 25 MW (not approved)
NRG - Bluewater 200 MW33 (cancelled)
Cape Wind 352 MW34 (cancelled)
31 According to the WindEurope (previously known as EWEA, the European Wind Energy Association), the average size OSW project size increased from about 200 MW in 2009 to 300-400 MW in 2010-2016 and to 621 MW by 2019. 32 Vattenfall is a Swedish multinational power company owned by the Government of Sweden. 33 Originally announced at 600 MW, 200 MW represents the capacity that was under contract to Delmarva Power & Light and was the capacity likely to have been constructed. 34 352 MW (77.5% of the project’s announced capacity of 454 MW) was the capacity under contract to National Grid and NStar. It is not known if the remaining capacity would have been constructed without an offtake agreement of some kind.

- 34 -
Deepwater (now Ørsted) - Skipjack 120 MW
US Wind - Marwind 248 MW
Deepwater (now Ørsted) - South Fork 130 MW35
OSW project sizes and locations are key drivers of offshore transmission designs. A hybrid transmission
system could deliver energy from multiple small OSW projects that are in reasonably close proximity to
one another. For example, the total capacity of the six initial domestic OSW projects listed above is 1,075
MW, which could (if they were located close to one another) be delivered to the mainland by a single
HVDC cable. Underwater HVDC cable capacity has been variously reported at 1,000 MW - 1,200 MW.36
This is consistent with our understanding, as well as with Emmanuel Martin-Lauzer of Nexans High Voltage
USA, a leading international power and telecommunications cable manufacturer. In his comments at the
Transmission Stakeholder Meeting, he explained that current technology allows underwater 275 kV HVAC
cables to transmit 350 MW - 400 MW while HVDC cable pairs can transmit up to 1,200 MW. Currently,
900 MW is the practical limit adopted by TenneT GmbH for their offshore HVDC transmission projects in
operation, under construction, and in development.37
Future HVDC technology developments are expected to increase these capacities, but the usefulness may
be constrained due to PJM reliability criteria. Additional studies performed in the transmission design
stage would be required to guide the technological and economic benefits of higher HVDC cable capacity
designs in the future.
Current OSW Development
Recent domestic OSW projects are larger than the first projects, which will drive the coordinated
transmission design to support New Jersey’s 7.5 GW OSW development goal by 2035. Ørsted’s 1,100 MW
Ocean Wind 1 project exemplifies the scale of project capacities as does the Board’s planned OSW
procurement schedule of at least 1,200 MW in each Round. Moreover, in the current Round 2 solicitation,
the Board has indicated in its Solicitation Guidance Document a willingness to evaluate OSW projects with
capacities up to about 2,400 MW. The Board’s interest in coordinated transmission infrastructure to
enable economic OSW additions in Rounds 3 through 6 may support implementation of an innovative
transmission design that can minimize environmental impacts across New Jersey’s sensitive shoreline and
marine areas.
In New York and New England, recent OSW awards have been in the 700 MW - 1,100 MW range, as listed
below. These project awards have HVAC radial export cables to the onshore transmission grid. The large
OSW sizes are the result of significant economies of scale in turbine size, equipment purchases, and
construction techniques that lower unitized OSW costs for ratepayers.
Copenhagen Infrastructure Partners / Avangrid - Vineyard Wind I 800 MW (Massachusetts)
35 Includes the original 90 MW award and the subsequent 40 MW expansion. 36 In October 2019, it was announced that each of the three 1,200 MW OSW projects, Creyke Beck A, Creyke Beck B, and Teeside A that comprise Dogger Bank in the North Sea off Yorkshire, will have HVDC transmission cables of about 80 miles to the mainland. 37 https://www.tennet.eu/index.php?id=2130&L=0
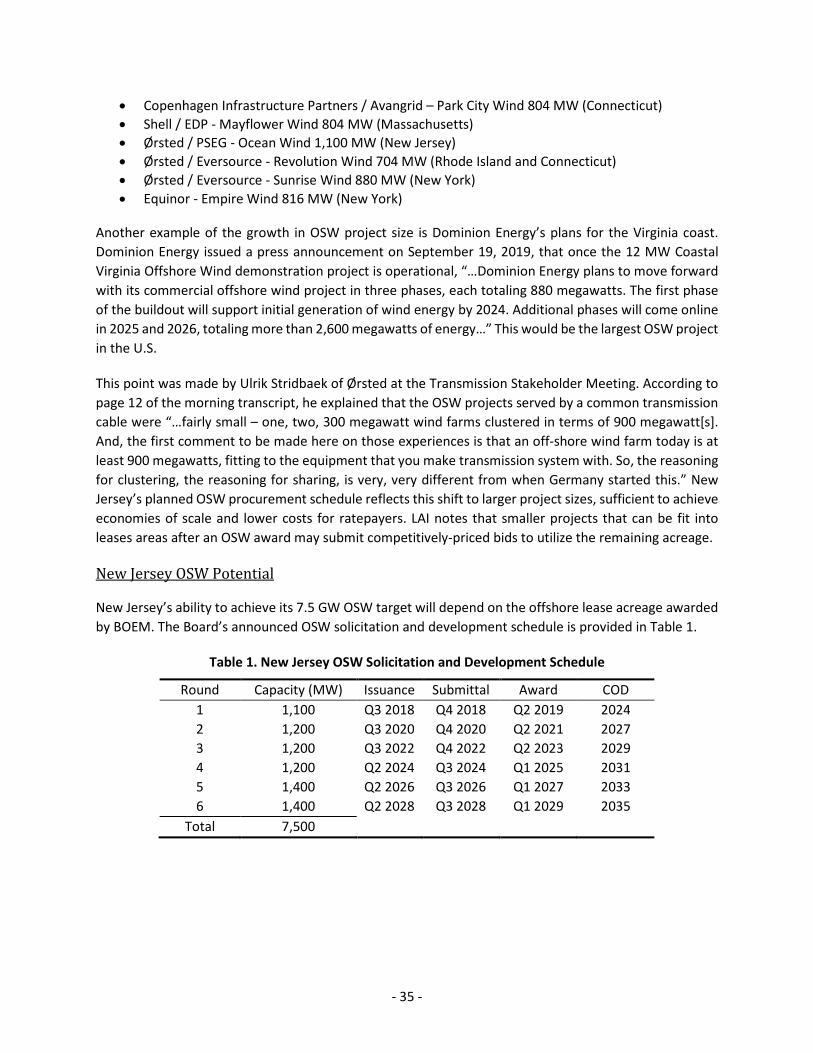
- 35 -
Copenhagen Infrastructure Partners / Avangrid – Park City Wind 804 MW (Connecticut)
Shell / EDP - Mayflower Wind 804 MW (Massachusetts)
Ørsted / PSEG - Ocean Wind 1,100 MW (New Jersey)
Ørsted / Eversource - Revolution Wind 704 MW (Rhode Island and Connecticut)
Ørsted / Eversource - Sunrise Wind 880 MW (New York)
Equinor - Empire Wind 816 MW (New York)
Another example of the growth in OSW project size is Dominion Energy’s plans for the Virginia coast.
Dominion Energy issued a press announcement on September 19, 2019, that once the 12 MW Coastal
Virginia Offshore Wind demonstration project is operational, “…Dominion Energy plans to move forward
with its commercial offshore wind project in three phases, each totaling 880 megawatts. The first phase
of the buildout will support initial generation of wind energy by 2024. Additional phases will come online
in 2025 and 2026, totaling more than 2,600 megawatts of energy…” This would be the largest OSW project
in the U.S.
This point was made by Ulrik Stridbaek of Ørsted at the Transmission Stakeholder Meeting. According to
page 12 of the morning transcript, he explained that the OSW projects served by a common transmission
cable were “…fairly small – one, two, 300 megawatt wind farms clustered in terms of 900 megawatt[s].
And, the first comment to be made here on those experiences is that an off-shore wind farm today is at
least 900 megawatts, fitting to the equipment that you make transmission system with. So, the reasoning
for clustering, the reasoning for sharing, is very, very different from when Germany started this.” New
Jersey’s planned OSW procurement schedule reflects this shift to larger project sizes, sufficient to achieve
economies of scale and lower costs for ratepayers. LAI notes that smaller projects that can be fit into
leases areas after an OSW award may submit competitively-priced bids to utilize the remaining acreage.
New Jersey OSW Potential
New Jersey’s ability to achieve its 7.5 GW OSW target will depend on the offshore lease acreage awarded
by BOEM. The Board’s announced OSW solicitation and development schedule is provided in Table 1.
Table 1. New Jersey OSW Solicitation and Development Schedule
Round Capacity (MW) Issuance Submittal Award COD
1 1,100 Q3 2018 Q4 2018 Q2 2019 2024
2 1,200 Q3 2020 Q4 2020 Q2 2021 2027
3 1,200 Q3 2022 Q4 2022 Q2 2023 2029
4 1,200 Q2 2024 Q3 2024 Q1 2025 2031
5 1,400 Q2 2026 Q3 2026 Q1 2027 2033
6 1,400 Q2 2028 Q3 2028 Q1 2029 2035
Total 7,500
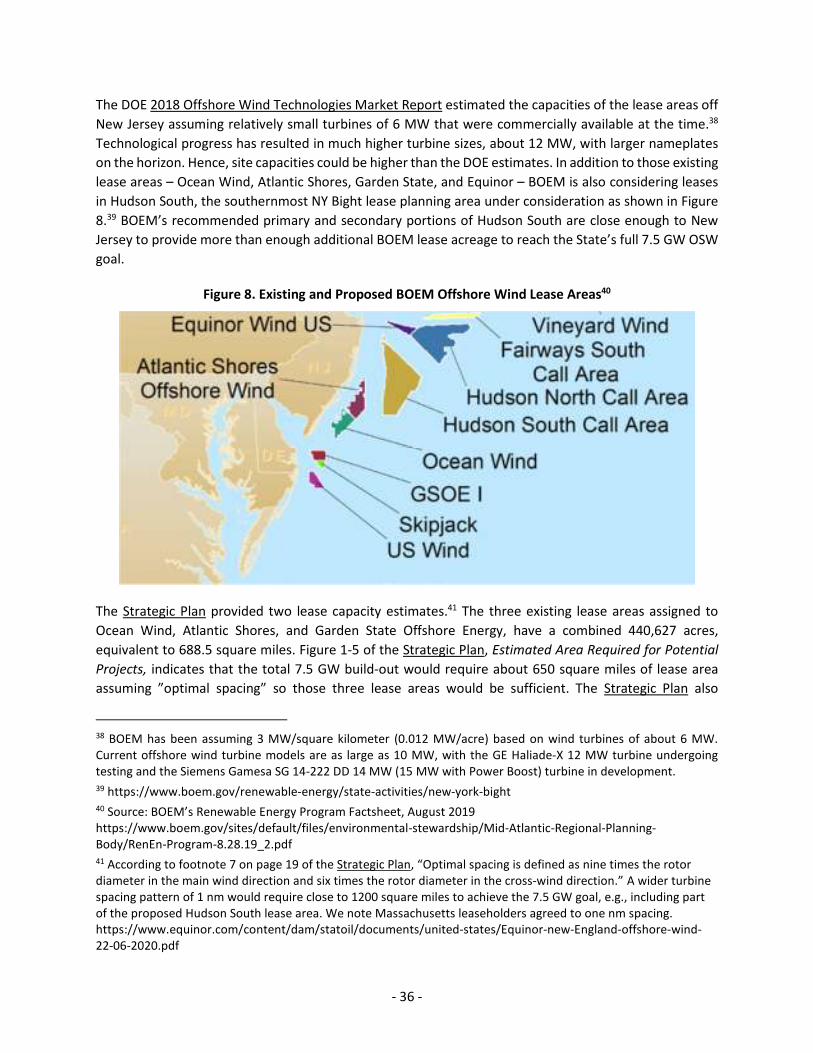
- 36 -
The DOE 2018 Offshore Wind Technologies Market Report estimated the capacities of the lease areas off
New Jersey assuming relatively small turbines of 6 MW that were commercially available at the time.38
Technological progress has resulted in much higher turbine sizes, about 12 MW, with larger nameplates
on the horizon. Hence, site capacities could be higher than the DOE estimates. In addition to those existing
lease areas – Ocean Wind, Atlantic Shores, Garden State, and Equinor – BOEM is also considering leases
in Hudson South, the southernmost NY Bight lease planning area under consideration as shown in Figure
8.39 BOEM’s recommended primary and secondary portions of Hudson South are close enough to New
Jersey to provide more than enough additional BOEM lease acreage to reach the State’s full 7.5 GW OSW
goal.
Figure 8. Existing and Proposed BOEM Offshore Wind Lease Areas40
The Strategic Plan provided two lease capacity estimates.41 The three existing lease areas assigned to
Ocean Wind, Atlantic Shores, and Garden State Offshore Energy, have a combined 440,627 acres,
equivalent to 688.5 square miles. Figure 1-5 of the Strategic Plan, Estimated Area Required for Potential
Projects, indicates that the total 7.5 GW build-out would require about 650 square miles of lease area
assuming ”optimal spacing” so those three lease areas would be sufficient. The Strategic Plan also
38 BOEM has been assuming 3 MW/square kilometer (0.012 MW/acre) based on wind turbines of about 6 MW. Current offshore wind turbine models are as large as 10 MW, with the GE Haliade-X 12 MW turbine undergoing testing and the Siemens Gamesa SG 14-222 DD 14 MW (15 MW with Power Boost) turbine in development. 39 https://www.boem.gov/renewable-energy/state-activities/new-york-bight 40 Source: BOEM’s Renewable Energy Program Factsheet, August 2019 https://www.boem.gov/sites/default/files/environmental-stewardship/Mid-Atlantic-Regional-Planning-Body/RenEn-Program-8.28.19_2.pdf 41 According to footnote 7 on page 19 of the Strategic Plan, “Optimal spacing is defined as nine times the rotor diameter in the main wind direction and six times the rotor diameter in the cross-wind direction.” A wider turbine spacing pattern of 1 nm would require close to 1200 square miles to achieve the 7.5 GW goal, e.g., including part of the proposed Hudson South lease area. We note Massachusetts leaseholders agreed to one nm spacing. https://www.equinor.com/content/dam/statoil/documents/united-states/Equinor-new-England-offshore-wind-22-06-2020.pdf

- 37 -
estimated that the total build-out would require close to 1,200 square miles assuming 1 nautical mile (nm)
spacing, which appears to be becoming the norm among OSW developers and regulators. Those three
existing lease areas would be insufficient under 1 nm spacing.
LAI prepared an independent estimate of potential capacities of these lease areas assuming 1 nm spacing
of 12 MW turbines. 42 Our results, shown in Table 2, fall about halfway between the two sets of estimates
in the Strategic Plan. The Strategic Plan assumed that turbine sizes would increase over time, so its
estimates of ultimate lease area capacities differ from ours. Our results indicate that even if the existing
lease areas are fully developed, at least one OSW project of 1,261 MW (= 7,500 MW - 6,239 MW) will be
required in Equinor’s remaining lease area, the proposed Hudson South lease area, or future unidentified
lease areas to achieve New Jersey’s 7.5 GW target. While larger turbines or tighter packing will affect
these results, any transmission decision should take into account potential OSW development in Hudson
South or other lease areas that BOEM may identify in the future.
Table 2. LAI Estimates of Offshore Wind Lease Area Capacities
Developer BOEM Lease ID Acreage Square Miles Capacity (MW)
Ocean Wind OCS-A 0498 160,844 251.3 2,278
Atlantic Shores OCS-A 0499 183,353 286.5 2,596
Garden State Offshore Energy OCS-A 048243 96,430 150.7 1,365
Total (without Hudson South) 440,627 688.5 6,239
Hudson South44 825,500 1289.8 11,689
42 We recognize that the maximum lease capacities do not precisely match up with the intended Round 2-5 procurements, but this is unimportant for the purpose of comparing offshore transmission options for an equivalent level of OSW development. Our estimates of lease area capacities are reasonably consistent with public and confidential estimates from the lease holders. 43 The southern portion of the original BOEM lease, now OCS-A 0519, was sold to Deepwater Skipjack Offshore Energy and is dedicated to OSW deliveries to MD. 44 BOEM’s recommended primary and secondary lease areas within Hudson South total about 600,000 acres, more than sufficient to achieve New Jersey’s OSW goal.

- 38 -
VI. Capital Costs of Offshore Transmission Designs
Highlights
OSW developers assert that radial export cables are less expensive than coordinated transmission options that require expensive HVDC/HVAC converters and inter-project cables.
Ocean grid proponents claim the potential to have a lower capital cost than export cables in spite of expensive converters due to a single integrated construction scope and onshore transmission savings.
Power corridor costs could fall within the range of the other two options. As with ocean girds, power corridors would require converters and have a single construction scope, but the onshore cables would be co-located in a single ROW.
Existing low-cost headroom at POIs along the New Jersey coast will soon be depleted. OSW projects selected in later rounds will face less attractive POIs with materially higher system upgrade costs. Achieving 7.5 GW will trigger expensive upgrades under any transmission option.
Stakeholder Positions on Capital Cost
Ocean grid proponents claim they have the potential to have a lower capital cost than the sum of the
individual export cable costs for a given level of OSW development due to a single integrated construction
scope, instead of multiple independent scopes of work for radial export cables, as well as from optimizing
the design of the onshore transmission portion.45 However, ocean grids have extra costs for the offshore
and onshore HVAC/HVDC converters and the additional inter-project cables running between the OSW
projects.46
OSW developers believe radial export cables are less expensive than ocean grids. In his comments at the
Transmission Stakeholder Meeting, Ulrik Stridbaek of Ørsted highlighted the study by DIW ECON, Market
Design for an Efficient Transmission of Offshore Wind Energy. According to Mr. Stridbaek comments
reported on page 13 of the morning transcript, the DIW ECON study “…conclusions and results are very,
very clear. The British transmission, off-shore transmission, on a conservative way and a conservative
assessment, costs at least thirty percent less than in Germany.“ He went on to claim that if OSW
developers could not design and build radial export cables, New Jersey would “…risk losing very, very
significant synergies.” In its written comments submitted to the Board after the Transmission Stakeholder
Meeting, Ørsted’s first conclusion on page 4 was “There are significant synergies and cost savings from
integrating the transmission scope together with the offshore wind farm.”
The DIW ECON study focused primarily on the regulatory differences in the UK (competitive procurement
of bundled OSW generation and transmission) and Germany (monopolistic TSO control over transmission
45 Anbaric’s NY/NJ Ocean Grid BOEM Application terms this “building transmission to scale”. 46 We use the terms “inter-project cables” for the ocean grid cables running between offshore collector platforms and “delivery cables” for the ocean grid cables running from those platforms to onshore POIs.

- 39 -
separate from competitive generation procurement), but also addressed cost.47 DIW ECON calculated the
LCoE for the OTAs and found “The average LCoE of German OTAs is 35 EUR/MWh, more than twice as
much as the LCoE of British OTAs, which have an average LCoE of 16 EUR/MWh.” They also found
performance, cost, and other advantages of the competitive and bundled UK approach, which is similar
to the approach used by the Board in Round 1.
The Navigant study, Connecting Offshore Wind Farms, reached the opposite conclusion: “…a TSO build
approach to offshore transmission asset development can be realised at lower cost levels than the
developer build approach. Moreover, the longer-term (design, planning, commercial and operational)
benefits compared to a developer build approach are likely to be significant in a context where large-scale
and far offshore wind clusters will require innovative system integration solutions to keep cost levels
down while maintaining security of supply.” However, Navigant’s conclusion may not be applicable to
New Jersey because the BOEM lease areas are much closer to shore than in Europe and the Round 2-6
OSW solicitations will likely be sufficiently large to reduce or eliminate any benefit from clustering and
utilizing a hybrid transmission design. As previously explained, Navigant evaluated differences in
regulatory structure, not differences between radial export cables and ocean grids, and there are concerns
about Navigant’s cost data and calculation methodology.
The report by BVG Associates, LCOE and Energy Production of Offshore Wind Farms in New Jersey for
7,500 MW by End of 2035, included as Appendix E in the Strategic Plan, evaluated an offshore “backbone”
transmission grid, similar to an ocean grid. The backbone would be an HVDC grid shared by 32 GW of OSW
capacity relatively close, 20 km, to the backbone. Each OSW project would contribute its pro rata share of
the backbone cost. BVG found that a backbone grid connection would reduce the LCOE by 2.8% and
addressed changes to the weighted average cost of capital (WACC). In its Summary, Conclusions, and
Recommendations on page 14, BVG concluded ”[u]sing a backbone approach to transmission can reduce
the transmission CAPEX and OPEX. It will reduce LCOE if there is no corresponding increase in WACC. A
small increase in perceived risk will increase WACC, however, and the downside sensitivity to WACC is
greater than the upside from the backbone cost reduction.” We anticipate the challenges of project-on-
project risk and multi-party coordination would likely contribute to perceived risk and could eliminate any
cost savings.
In response to the Board’s stakeholder outreach last summer, Anbaric submitted a confidential study,
Transmission Planning Study for Integration of Offshore Wind in New Jersey by Pterra Consulting, that
compared three transmission designs: (i) radial export cables, (ii) “Backbone multi-terminal direct current
(MTDC)” similar to an ocean grid, and (iii) “Designated Substation” similar to power corridors. The
Designated Substation design assumed significant onshore transmission upgrades would be made to
Deans and Larrabee substations in northern New Jersey and the Cardiff substation in southern New Jersey.
Both Larrabee and Cardiff would be upgraded to 500 kV to fully accommodate 7.0 GW of OSW energy.
Pterra did not specify how OSW projects would connect to these substations and did not incorporate
offshore transmission costs. Pterra made load, generation, and transmission changes to reflect 2040
conditions to a PJM powerflow model, added OSW injections, conducted thermal contingency analyses to
identify constraints, and estimated the costs to resolve those constraints. Pterra concluded the onshore
47 Germany has four TSOs of which two, TenneT and 50Hz, are responsible for transmission assets adjacent to and in the North Sea and Baltic Sea, respectively.

- 40 -
portion of the Designated Substation design would be more expensive than the Backbone MTDC design,
but the offshore portion of the Designated Substation design might be cheaper than the offshore portion
of the Backbone MTDC design. The Pterra study supports LAI’s recommendation for the Board to consider
the power corridor concept.
Competitive Pressures to Minimize Capital Costs
OSW projects with bundled radial export cables try to identify the best POI taking two cost categories into
account: (i) the radial export cable and onshore facilities leading to the POI and (ii) the likely
interconnection costs of attachment facilities and transmission system upgrades. The first OSW projects
awarded ORECs in any procurement have an economic incentive to interconnect at POIs that have
sufficient low-cost headroom to accept OSW injections with minimal attachment and upgrade costs. As
preferred POIs along the New Jersey coast are utilized by early round OSW projects, projects selected in
later rounds will likely face less attractive POIs that require materially higher costs for system upgrades,
longer offshore cable distances, and potentially higher environmental mitigation costs. While PJM’s
interconnection process rewards early developers with access to lower cost POIs, there are two offsetting
factors. First, PJM’s grid is dynamic, and capacity resource retirements or baseline transmission
improvements will inevitably change the relative attractiveness of coastline POIs. Second, PJM’s
interconnection process, coupled with the Board’s competitive OSW process, effectively functions to favor
the most cost-effective OSW projects and penalize the least cost-effective OSW projects48
A coordinated transmission project would also have an incentive to select POIs with the most headroom
and the lowest expected upgrade costs. Once those POIs are selected and capacity interconnection rights
granted, OSW developers would likely face only modest cost differentials based on their distances to the
transmission project’s offshore terminus. By socializing the coordinated transmission project cost through
the SAA, OSW developers would be insensitive to low-cost or high-cost POIs.
A coordinated transmission solution developed through the SAA will likely be governed by the same PJM
OATT rules that apply to land-based transmission. Both would be developed through the RTEP process
and its competitive structure would encourage innovative and cost-effective transmission solutions from
TOs and independent developers. In its discussion of rate-based structures on page 10 of the Scaling
Renewable Energy memo submitted to the Board, Anbaric reviewed how traditional rate-based
transmission costs are determined:
“In a traditional, rate-based approach to financing transmission, a qualified utility is assigned a project by a state or an Independent System Operator. The utility estimates the cost of the project, initially within a defined plus/minus range (for example, 50%). As the project proceeds and the actual costs become evident the utility has substantial leeway to develop the project at costs within that range. If events cause the project to exceed that range (for example, if community opposition results in an agreement to bury parts of the project), the utility typically must go back to the authorizing agency and obtain permission for that cost over-run.”
48 Proposed onshore generators face this same challenge of selecting a location with low cost fuel supplies, water / wastewater services, and transmission system attachment / upgrades.

- 41 -
Anbaric did not mention proposed PJM transmission projects with cost caps to protect ratepayers. A good
example of an innovative and cost-effective PJM transmission solution with a cost cap is the Silver Run
Electric project to resolve serious stability problems identified by PJM. Seven companies submitted 26
proposed solutions at both 230 kV and 500 kV ranging in cost from a little over $100 million to over $1.5
billion. This robust response demonstrates strong market interest in competitive transmission
opportunities. PJM selected LS Power, one of the least expensive proposals that included a binding cost
cap for its share of the project, one of the first cost caps in the regulated transmission industry.49
We anticipate a high degree of interest by coordinated transmission developers that will provide
competitive pressure to minimize costs as well as achieve environmental and other Board goals. Rate
Counsel highlighted this issue in her presentation at the Transmission Stakeholder Meeting. She pointed
out that the TSOs in Europe do not face the cost pressures that competitive OSW project developers face.
The NYPA Study, Offshore Wind - A European Perspective, also emphasized the benefits of competition.
Two of its conclusions on page 2 specifically address cost: “The most effective path to low-cost wind power
is through scale and healthy competition…” and “Visible, long-term grid planning on and offshore,
removes barriers to entry, improves coordination and lowers costs.”
We expect that an SAA solicitation would attract many serious proposals. Recent OSW procurements in
New Jersey, New York and New England have had robust competition among rival global OSW developers
as evidenced by the favorable bid offer prices offered and selected. Robust interest on the part of
incumbent TOs and independent developers would result in the best possible deal on a coordinated
transmission project developed through the SAA. There are twenty-five companies that have been
granted Designated Entity status by PJM that allows them to construct, own, operate, maintain, and
finance competitive transmission projects.50
Representatives from TOs and independent developers expressed interest in leading or participating in
an offshore transmission project to the Board in its July-August 2020 stakeholder outreach. SAA applicants
would compete on a fair and transparent basis and bid the lowest price consistent with their proposed
projects and environmental and risk allocation guidelines. New Jersey ratepayers will benefit from a fair,
transparent, and competitive SAA process.
LAI notes that New Jersey TOs have limited experience planning, constructing, and operating high voltage
marine power cables. Nevertheless, the New Jersey TOs have established technical expertise with PJM’s
onshore transmission system over many decades of design, engineering, and use. Moreover, the TOs
have regulatory expertise and the balance sheet strength to support an SAA solution. The Board will have
to determine the economic merit of any marine transmission option from a ratepayer standpoint based
on a broad strategic assessment, including the extent to which the potentially significant financial savings
and lower ratepayer risk of conventional radial export cables can be reconciled with the anticipated
environmental advantages ascribable to a coordinated transmission solution.
49 A cost cap could include the construction cost, the allowed return on equity, or the project’s capital structure. We understand LS Power agreed to a $146 million construction cost cap for its portion of the Silver Run project. 50 https://www.pjm.com/planning/competitive-planning-process/pre-qualification.aspx
- 42 -
LAI has not developed independent cost estimates of the offshore transmission options. The Board may
therefore need to consider the all-in OSW costs, onshore and offshore, along with other factors in future
OSW transmission decisions. On page 2 of her study for Atlantic Wind Connection, Transmission Policy
Lessons from Europe’s Offshore Wind Experience, Dr. Ozkan argued that TSO construction of network
grids created “…largely de-risked areas. The result has been vigorous competition and record low prices
for offshore wind energy supply which has delivered dramatic cost savings for ratepayers.”51 A
coordinated transmission solution would largely de-risk transmission for future OSW development in New
Jersey.
PJM Studies for New Jersey’s State Agreement Approach
As requested by the Board, PJM has embarked on a two-phase study of possible “…grid injection locations
and corresponding megawatt amounts in New Jersey to support the state’s offshore wind targets through
2035…” New Jersey could pursue the necessary onshore grid investments through PJM’s SAA.52 PJM
prepared a Scope of Work that was revised and finalized on May 7, 2020. PJM’s Phase 1 work commenced
in April and entailed a screening analysis of over 100 potential in-state POIs from 138 kV to 500 kV. As
explained by Michael Kormos of Atlantic City Electric and Exelon at the November 2019 Transmission
Stakeholder Meeting, the transmission system and POIs along the New Jersey coast are not the
“strongest” part of the grid. There is a strong 500 kV backbone running north-south through the center of
New Jersey, but the coast is generally served by multiple 230 kV and lower voltage lines.
PJM’s Phase 1 analysis was based on standard linear first contingency transfer capability analyses using
2025 RTEP bases cases for summer, winter, and light load conditions. PJM presented its Phase 1 results to
the Board in two parts: 3.5 GW scenarios (consistent with OSW procurement Rounds 1-3) on June 24,
2020 and 7.5 GW scenarios (consistent with OSW procurement Rounds 1-6) on July 29, 2020. PJM’s Phase
1 work was based on 2025 RTEP base cases and all of the scenarios assumed the Round 1 project, Ocean
Wind, would install its own radial export cables to the BL England 138 kV and Oyster Creek 230 kV
substations. PJM’s Phase 1 results included desktop-level cost estimates for onshore transmission lead-
lines from the coast to the POIs using generic cost-per-mile values for overhead lines and underground
cables. PJM also performed a single generator deliverability analysis to determine required transmission
system upgrades and their costs. PJM presented Phase 1 results for seven 3.5 GW scenarios and seven 7.5
GW scenarios based on the lowest onshore costs of lead-lines plus upgrades. PJM did not factor in offshore
transmission costs.
The Board selected three of the 7.5 GW scenarios for PJM’s Phase 2 analyses that included generator
deliverability analyses, full contingency analyses to identify voltage issues, and high-level stability reviews
to identify potential concerns, all using the 2028 RTEP bases cases. The draft Phase 2 results, presented
on September 28, 2020, included office-level transmission overlays and order-of-magnitude cost
estimates. As a result of the more detailed analyses, all three 7.5 GW scenarios triggered expensive
upgrades, primarily to resolve thermal violations outside of New Jersey in winter conditions. PJM is
51 The low OSW energy supply cost data Dr. Ozkan relied upon was for the Borssele 1&2 and Borssele 3&4 projects that excluded the offshore transmission cost component. 52 PJM’s results are confidential. Individual POI data and PJM’s results are not included in this Study.
- 43 -
prepared to conduct a more detailed analysis of one 7.5 GW scenario if requested by the Board in support
of an SAA solution.
Onshore Capital Costs
Onshore capital costs for any generation project interconnecting to the PJM system include attachment
facilities and transmission system upgrades necessary for the safe and reliable operation of PJM’s bulk
electric system considering the wide variety of contingencies that could occur. Transmission system
upgrade costs are one of the key uncertainty factors for any generation project interconnecting to the
PJM system. Estimating attachment facility costs at the POI may be inaccurate but these are not large
costs. In contrast, transmission system upgrade costs are highly uncertain and can be an order of
magnitude larger. While OSW developers typically summon transmission expertise to formulate
transmission system upgrade cost estimates, such third-party estimates are subject to considerable
measurement error compared to PJM’s rigorous interconnection process and hard to pin-down study
assumptions that drive the final cost determination and allocation.
OSW developers with radial export cables would go through the regular PJM interconnection process to
determine the transmission system upgrade costs necessary for grid reliability. A coordinated
transmission project developed through the SAA would go through an RTEP process that would also
determine necessary upgrades.53 Transmission upgrades are often constructed in discrete increments so
any offshore transmission option would benefit if an expensive upgrade could be avoided by reducing,
even slightly, the proposed injections. An ocean grid developer may have more flexibility in planning
injections to POIs with adequate “headroom” so as not to trigger such expensive incremental transmission
system upgrades.
53 The Board approved an Order on November 18, 2020 in Docket No. Q020100630 authorizing PJM to pursue a coordinated transmission solution that supports New Jersey’s 7.5 GW OSW goal as an SAA in the next RTEP, “…the first time that a PJM State has requested that PJM incorporate state public policies into its planning process.” PJM filed the executed SAA Agreement with FERC in Docket No. ER21-689-000 (Service Agreement No. 5890) on December 18, 2020 to commence the SAA process as part of the 2020-2021 RTEP.
- 44 -
VII. Project-on-Project Coordination and Risk
Highlights
The core project-on-project risks when offshore transmission is constructed separately from OSW generation are the project timing and coordination challenges. OSW projects with bundled radial export cables do not have this risk.
There must be a practical mechanism to integrate a coordinated transmission solution with OSW generation projects, including physical interconnection and equipment compatibility.
Developing a coordinated transmission solution through the SAA would necessitate three-way coordination among the OSW developers, transmission developer, and PJM. This would constitute a significant administrative challenge for a first-of-its-kind SAA transmission project.
New Jersey ratepayers will have to bear the transmission costs if developed through the SAA process unless other states participate. The competitive SAA process should assure a cost-effective solution but protecting ratepayer interests will require additional input and rigorous study. European lessons learned highlight ratepayer risks associated with pre-building transmission infrastructure without appropriate regulatory protections.
Permitting will be uncertain for all offshore transmission options. Radial export cable permitting would be piecemeal for multiple projects while permitting for a coordinated transmission project would be a single and larger effort, which could be advantageous.
Domestic OSW development has proven to be uncertain and risky at this early stage. Nevertheless,
developers are willing to commit hundreds of millions of dollars of at-risk capital to design, permit, and
develop OSW projects, including significant transmission design and payment obligations for system
upgrades. Project-on-project risk for separate OSW generation and transmission projects is the risk issue
most often raised by OSW developers. Any coordinated transmission option that is separate from
generation adds a layer of complexity to the planning and construction of two large, complex, and
interdependent projects.
Coordination Challenges
The core project-on-project risks are coordinating timing and planning between the transmission
developer and the OSW generators when they are developed separately. Timing and delay risks are
asymmetric. If an OSW project is completed before a transmission asset, it may suffer a loss in revenues
until the transmission project is completed. Examples of onshore and offshore delays are presented
below. On the other hand, if transmission is completed before the OSW generation project, it will not
suffer financially because it will recover its costs from ratepayers since they will bear the risk of paying for
transmission assets not being used. Similarly, if portions of a coordinated transmission solution are never
utilized, the transmission developer will still recover its full costs from ratepayers for those stranded
assets.
There must be a practical planning mechanism to agree on the physical location of the offshore collector
platform and on the design of the cable terminal where the two projects would interconnect. From an
engineering compatibility standpoint, project-on-project risk may be in the form of equipment
- 45 -
interoperability for HVDC technologies and the need to conform to specific manufacturer’s equipment
specifications. This would depend on the physical demarcation between the transmission developer and
OSW generator. For voltage source converter equipment, a single vendor would need to be used for the
entire transmission design since HVDC technology across vendors is not compatible.54 This would force
strict requirements on the design and selection of converter equipment. From a physical layout
standpoint, project-on-project risk requires tradeoffs for offshore converter locations. An optimal
platform location from the perspective of the coordinated transmission project developer may differ from
the perspective of the OSW generation that must interconnect to it. This may require changes to optimize
the location and layout of the collection cable design and collector platform location through numerous
iterations between the transmission and OSW project developers.
The most likely conceptual arrangement and delineation of responsibility between a coordinated
transmission project and an OSW generation project would involve the OSW generator constructing its
HVAC-based offshore collector platform close to the offshore transmission converter platform. The
generator owner would bring its HVAC delivery cables to a common point on the converter platform. This
would be similar to the line of demarcation at onshore transmission substations and the addition of
adjacent developer-owned converter or step-up transformer stations. In this type of arrangement, the
HVAC cable from the collection transformer to the coordinated transmission converter would be a radial
branch, owned and maintained by the OSW generator project for the sole benefit and use of that project.
Onshore transmission owners and operators typically avoid or minimize third-party assets being co-
located within their facilities, if possible, to prevent added coordination issues and complexities arising
from third-party access required to perform maintenance, legal liabilities from misuse or damage, or other
operational conflicts. The concept of having the entire coordinated transmission system, including the
onshore and offshore converters, owned, maintained, and uniformly operated by a single owner would
ensure consistent design and minimize adverse impacts within the entire transmission system. If the
coordinated transmission project was constructed without the converters, which would be added later by
the OSW generation developers, ratepayers would benefit from lower upfront costs but transmission
conflicts could develop between the OSW generators (who install and operate the converters) and
transmission owners (who install and operate the HVDC cables). For instance, if certain HVDC converters
were owned and maintained by various OSW owners, inadvertent forced outages of one converter could
impact the reliability and deliverability of other OSW projects if they were networked to a common HVDC
protection and control system.
Project coordination would likely involve PJM, since any coordinated transmission solution would have to
interconnect with the onshore transmission system. PJM may need to take additional measures to ensure
the reliability and integrity of the bulk electric system. Three-way planning to assure coordination among
the parties would certainly be time-consuming for such a large and important first-of-its-kind transmission
project. Despite some technical similarities to onshore interconnection arrangements, there would be a
54 Converters can utilize voltage source or line commuted technology. While line commuted is a more traditional technology, we were informed that voltage source technology would be used for OSW applications, possibly due to the size and weight of the equipment on offshore platforms.
- 46 -
wide range of first-time interconnection issues delineating rights, responsibilities, and compensation
between the multiple parties under PJM’s OATT.
New Jersey has begun pursuing a coordinated transmission solution as an SAA project. This would be the
first time PJM has implemented the SAA process, which comes with its own challenges. While there may
be European agreements that can serve as a template, New Jersey will no doubt face complex challenges
in the effort to lock down commercial terms that govern the rights and responsibilities of the parties. How
the Board may allow for negotiations with one or more TOs to finalize the SAA is beyond the scope of this
Study.
PJM has rules governing the process by which a coordinated transmission solution would be solicited and
selected under the SAA process but there will be many physical interconnection and contractual details
to be developed. In March 2019, after the endorsement of a February 2019 problem statement, PJM
began a stakeholder process investigating the tariff changes required to change the interconnection
process to allow merchant transmission developers to request capacity interconnection (or equivalent)
rights for non-controllable AC transmission facilities that would provide interconnection points for future
off-shore generation resources. Proposed merchant transmission facilities could consist of a single
offshore generator lead line or networked offshore transmission facilities for interconnection of future
generation. However, the stakeholder process concluded without reaching consensus on any tariff
changes that would grant transmission injection rights to merchant transmission projects terminating
offshore. The remaining option for a regulated ocean grid or power corridor would be through the SAA
process.
The extent to which permitting may be longer and more uncertain for radial export cables relative to a
coordinated transmission solution is unknown. Permitting for individual bundled OSW projects that
require multiple pathways to landfall and repeated construction projects through sensitive on-shore
ROWs may expose the Round 3-6 developers to permitting delays or lengthy legal challenges, jeopardizing
the Board’s procurement goals. State support for a coordinated transmission solution through the SAA
has the potential to facilitate permitting success for a one-time construction effort. Advantages of fewer
environmental disruptions and a single permitting process will have to be weighed against disadvantages
of cost, project coordination, and ratepayer risk.55 This will require additional rigorous scrutiny by the
Board.
Regulatory Risks
Regulatory uncertainty is one risk category that can cause or exacerbate delays that in turn magnify
project-on-project risk. One example of regulatory risk is the uncertainty of production tax credits (PTC)
and investment tax credits (ITC) for OSW projects. The amount and timing requirements have been
changed many times with short-term extensions and do not provide any long-term certainty. PTC and ITC
uncertainty is exemplified by an April 23, 2020 letter to the U.S. Department of the Treasury from a bi-
partisan group of senators requesting an extension of the continuity safe harbor provisions from four to
55 A power corridor developed through the SAA may be a reasonable alternative.
- 47 -
five years for projects that began construction in 2016 or 2017.56 IRS Notice 2020-41 issued on May 27th
now gives qualifying renewables projects that began construction in either 2016 or 2017 until December
2021 to be completed.
The Jones Act, which requires that goods shipped between U.S. ports be carried on ships that are U.S.-
built, U.S.-flagged, and U.S.-crewed, is another risk factor. In order to comply, developers must use U.S.
ships to carry foundations, towers, turbines, and blades from a domestic staging port to the project site
and use special-purpose ships, all of which currently are European, for the actual installation.57 Although
U.S. OSW developers can utilize European installation vessels, they have to be chartered years in advance,
creating project scheduling risks.
A third example of regulatory risk is the Supreme Court’s Hughes v. Talen Decision that prohibited the
Maryland PSC from directing its load-serving entities to enter into contracts for differences to support the
development of a new gas-fired power plant. The Decision also applied to similar incentives by the Board
under the Long-Term Capacity Agreement Pilot Program procurement initiative culminating in the
selection of three new generation projects. Some state procurements have established regulations to try
to avoid a similar complaint regarding an OSW contract or award, but until an OSW project becomes
operational and a party can claim injury, it is difficult to gauge the extent to which the Decision can impede
project development.
Future OSW projects are also at risk due to FERC’s November 2019 Order expanding PJM’s Minimum Offer
Price Rules (MOPR) that results in setting a high floor price for new OSW projects and makes it difficult, if
not impossible, for those and other renewable resources to clear PJM’s Base Residual Auction. For any
OSW project subject to the new MOPR, the higher price floor would effectively prevent state ratepayers
from realizing capacity value, raising the net OREC price. The Board is currently evaluating alternate
methods of procuring renewable energy resources, recognizing the deleterious impacts from FERC’s
MOPR expansion on renewable energy technologies. FERC’s November 2019 Order is currently under
review on appeal. Absent a change in the current resource adequacy procurement paradigm, ratepayers
will have to pay twice for OSW capacity. Under the Biden Administration, a democratic FERC Chair may
reasonably be expected to review the merit of its MOPR policy and how best to refine resource adequacy
rules to accommodate the accelerated development of renewable energy resources.
OSW Project Delays
Delays are another problem for OSW projects that magnify project-on-project risk. Except for the recently
completed 12 MW Coastal Virginia Offshore Wind project, every domestic OSW project selected through
a procurement or awarded a contract has been delayed or cancelled for internal or external factors. Of
the first OSW projects, Block Island Wind was delayed, Fishermen’s Energy never received final approval,
56 https://www.finance.senate.gov/imo/media/doc/2020-04-23 CEG, RW, et al to Treasury (Energy Tax Credits Safe Harbor).pdf
57 In May 2020, Dominion Energy announced it was part of a consortium to build a Jones Act-qualified offshore wind installation vessel, expected to enter service in 2023.

- 48 -
and Cape Wind has been cancelled. Many of these factors could affect the timely completion of a bundled
OSW project or a coordinated transmission solution as well.
MarWind, the 248 MW OSW project developed by US Wind and selected by the Maryland PSC in May 2017, is now delayed for up to four years. US Wind stated that the original estimated COD of 2021 was delayed until sometime in 2023 due to the time for BOEM to review and approve US Wind’s COP. “Although the Bureau of Ocean Energy Management (BOEM) currently estimates two years to prepare an Environmental Impact Statement under the National Environmental Policy Act and to complete COP review, the actual time period is unknown and largely outside of U.S. Wind’s control.”
Skipjack, the other OSW project selected by the Maryland PSC, is also delayed by at least one year due to federal permitting problems according to Ørsted’s letter to the Maryland PSC of April 21, 2020. After BOEM finishes its review of Skipjack’s Construction and Operations Plan, it will issue a Notice of Intent to prepare the Environmental Impact Statement (EIS).
Both MarWind and Skipjack have notified the Maryland PSC that they intend to utilize larger wind turbines, which has triggered the need for hearings, primarily to address the greater impact on the coastal viewshed. MarWind is considering 8 MW, 10 MW, and 12 MW turbines; Skipjack intends to utilize GE Haliade-X 12 MW turbines.
Vineyard Wind, an 800 MW OSW project selected by Eversource Energy, National Grid, and Unitil, the Massachusetts EDCs, in May 2018 and approved by the DPU in April 2019, was delayed while a Supplemental Environmental Impact Statement (SEIS) was prepared. The SEIS was issued in July 2020 and the Final EIS and Record of Decision, as well as approval of the COP, are expected to be issued by the end of 2020.58 Lars Pedersen of Vineyard Wind stated “While we need to analyze what a longer permitting timeline will mean for beginning construction, commercial operation in 2022 is no longer expected. We look forward to the clarity that will come with a final EIS…” Vineyard may be further delayed as it withdrew and will refile its COP to incorporate larger wind turbines.
Eversource, a 50/50 partner with Ørsted, announced that the timetable for the 800 MW Sunrise Wind project would be delayed due to New York’s restrictions on offshore survey work and by COVID-19. Ørsted expects the project to be fully commissioned by 2024.
Ørsted stated the 704 MW Revolution Wind project faces an increased risk of delay. “Our offshore development projects in the U.S. are moving forward, although at a slower pace than originally expected due to a combination of the Bureau of Ocean Energy Management’s (BOEM) prolonged analysis of the cumulative impacts from the build-out of U.S. offshore wind projects, and now also COVID-19 effects.” The SEIS issued by BOEM in July 2020 for the Vineyard Wind project addresses these cumulative impacts. Ørsted now expects the project to be fully operational by 2023.
58 BOEM, “Vineyard Wind 1 Offshore Wind Energy Project Supplement to the Draft Environmental Impact Statement” (SEIS) OCS EIS/EA BOEM 2020-025, June 2020, https://www.boem.gov/sites/default/files/documents/renewable-energy/Vineyard-Wind-1-Supplement-to-EIS.pdf
- 49 -
The South Fork Project is the most recent OSW project to have announced a delay. On April 1, 2020, Ørsted’s chief executive officer stated South Fork will “very likely be delayed due to federal permitting approvals and Covid-19…”
Onshore PJM transmission projects are also subject to unexpected delays. For example, the 500 kV
Susquehanna-Roseland project took six years to complete, from project inception in 2009 to full
commercial operation in 2015. Two TOs were involved: PSEG and PPL. The PSEG portion was delayed by
three years from an expected 2012 in-service date because environmental approvals took longer than
anticipated after the New Jersey Department of Environmental Protection (DEP) found PSEG’s application
incomplete.
German Project-on-Project Risk Example
Considerable attention has been placed on an incident in Germany in 2012-14 where the federal
government and TenneT GmbH, the TSO, underestimated the challenges of completing the offshore grid.
The resulting delay ultimately required ratepayers to pay about €1.5 billion in compensation for lost OSW
revenues.59 This incident was reported in a Working Paper from the Hertie School of Governance that was
part of a larger investigation into large infrastructure projects. The Working Paper, Offshore Wind Power
Expansion in Germany - Scale, Patterns and Causes of Time Delays and Cost Overruns, was designed to
analyze the scale, patterns, and causes of cost overruns in offshore wind parks (OWPs).60 While it found a
20% average cost overrun for these projects, it paid particular attention to the shortcomings of
monopolistic regulation of the grid and the consequential payments to OSW generators.61 According to
page 35 of the Working Paper, “…the TSO has to compensate 90% of the forgone revenue of electricity
production to the wind park developer, in turn compensated for by higher electricity prices for
consumers.” As explained on page 4 of the Introduction:
“However, what led to further additional costs is the regulated connection of the OWPs to the grid. This is the result of the separation of responsibility for construction of the OWP between the wind park developer and the transmission system operator (TSO), which led to governance problems. Time delays in grid connection, 13 months on average per park, led to a compensation of forgone revenue to the wind park developers, paid by an additional surcharge (Offshore-Haftungsumlage) to consumers. These additional surcharges cost more than €1 billion for the eight existing OWPs finished by the end of 2014…”
By year-end 2014, 2.3 GW of OSW generating capacity was completed but only 1.0 GW was connected to
the German onshore grid. There were many underlying reasons the government and TenneT GmbH
underestimated the challenges of completing the offshore grid on time: over-ambitious OSW targets,
supply chain issues, cost control failures, lack of transparency, overly complex governance, and an unclear
distribution of responsibilities. TenneT GmbH has since improved its coordination with OSW developers
59 “An information platform of the German TSOs reported the cost to be €295 million in 2013, €762 million in 2014 and €491 million in 2015 (Netztransparenz 2013, 2014a, 2014b).” 60 https://www.hertie-school.org/en/debate/detail/content/large-infrastructure-projects-offshore-wind-parks-perform-relatively-well-with-20-per-cent-cost-ove/ 61 The eight OSW projects ranged from 48 MW to 400 MW and started construction from 2007 to 2012.
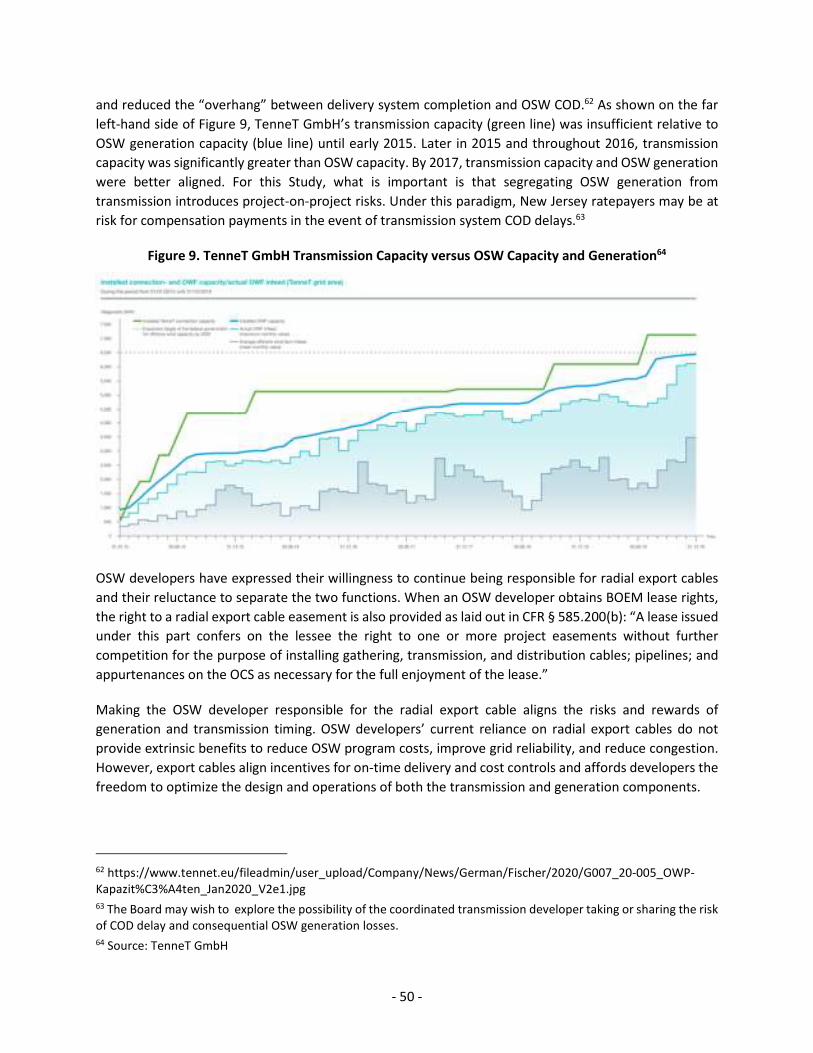
- 50 -
and reduced the “overhang” between delivery system completion and OSW COD.62 As shown on the far
left-hand side of Figure 9, TenneT GmbH’s transmission capacity (green line) was insufficient relative to
OSW generation capacity (blue line) until early 2015. Later in 2015 and throughout 2016, transmission
capacity was significantly greater than OSW capacity. By 2017, transmission capacity and OSW generation
were better aligned. For this Study, what is important is that segregating OSW generation from
transmission introduces project-on-project risks. Under this paradigm, New Jersey ratepayers may be at
risk for compensation payments in the event of transmission system COD delays.63
Figure 9. TenneT GmbH Transmission Capacity versus OSW Capacity and Generation64
OSW developers have expressed their willingness to continue being responsible for radial export cables
and their reluctance to separate the two functions. When an OSW developer obtains BOEM lease rights,
the right to a radial export cable easement is also provided as laid out in CFR § 585.200(b): “A lease issued
under this part confers on the lessee the right to one or more project easements without further
competition for the purpose of installing gathering, transmission, and distribution cables; pipelines; and
appurtenances on the OCS as necessary for the full enjoyment of the lease.”
Making the OSW developer responsible for the radial export cable aligns the risks and rewards of
generation and transmission timing. OSW developers’ current reliance on radial export cables do not
provide extrinsic benefits to reduce OSW program costs, improve grid reliability, and reduce congestion.
However, export cables align incentives for on-time delivery and cost controls and affords developers the
freedom to optimize the design and operations of both the transmission and generation components.
62 https://www.tennet.eu/fileadmin/user_upload/Company/News/German/Fischer/2020/G007_20-005_OWP-Kapazit%C3%A4ten_Jan2020_V2e1.jpg 63 The Board may wish to explore the possibility of the coordinated transmission developer taking or sharing the risk of COD delay and consequential OSW generation losses. 64 Source: TenneT GmbH
- 51 -
U.S. Examples
Early last year, the MADOER requested comments from OSW stakeholders on the necessity, benefits, and
costs of procuring OSW energy. In its comments, Anbaric addressed this issue of project-on-project risk
and referenced the CREZ transmission projects in Texas.65 CREZ was built on an integrated schedule in
advance of the wind projects, supported, in part, by signed interconnection agreements and financial
commitments in the form of surety bonds posted by wind developers in amounts equal to the expected
cost of the transmission upgrade. These surety bonds were posted for a portion of the sites to be
developed and would be forfeited to the utility if the wind project was cancelled. Texas ratepayers paid
for any unused transmission capacity until the wind projects were completed and were ultimately at risk
for unnecessary transmission capacity.66
Applying this logic to a coordinated transmission solution would require some process to ensure OSW
developers are not harmed if the transmission COD is delayed or has operational problems that reduced
their energy sales. Any coordinated transmission solution could require some financial mechanism to
compensate OSW developers for lost revenues. A rate-based coordinated transmission project might
provide compensation from ratepayers in the event of a COD delay and other innovative risk-sharing
mechanisms to protect ratepayers should be further explored. Delivery interruptions after COD would not
likely be compensated.67
TRTP is another example of building transmission assets in anticipation of renewable energy development.
In this case, Southern California Edison built 173 miles of new and upgraded transmission lines to deliver
up to 4,500 MW of renewable wind and other generation to satisfy its renewable energy requirement and
meet the load growth in southern California. “While the Tehachapi project overall was a success…”
according to page 7 of the Rate Counsel comments filed on December 3, 2019, “…it was a massive
undertaking…Rate Counsel cautions against this type of model for offshore wind transmission
development.” We note that California ratepayers were at risk for cost recovery because the generation
projects that had contracted with TRTP as of November 16, 2006 had a combined capacity of about 1,600
MW, far less than TRTP’s capacity.68
65 The Texas PUC approved the CREZ concept in Docket No. 33672 in 2008, leading to the construction of 3,500 miles of high-voltage transmission lines capable of 18,456 MW, including 11,553 MW of wind generation. Although wind developers provided financial security, ratepayers ultimately bore the amortized cost of the $7 billion project. 66 CREZ was successfully developed and utilized due to a number of factors identified by ERCOT: world-class wind resource, large in-state loads, few permitting barriers, resolved cost allocation, a large fleet of quick-start gas-fired resources, and a single-state market not synchronized to adjacent markets. Of critical importance, the Texas Legislature allowed CREZ to circumvent the typical regulatory provisions for issuing a certificate of public convenience and necessity, allowing CREZ to be deemed used and useful regardless of actual use. 67 No compensation to OSW generators after ocean grid COD is consistent with the treatment of onshore generators interconnected to PJM. 68 Six of the seven projects – Coram Energy, Western Wind, two Caithness 251 Wind, and two Ridgetop Energy – were quite small with an average size of 16 MW; the seventh contract – Alta Windpower Development – was 1,500 MW.

- 52 -
Project-on-Project Risk Impacts on Ratepayers
In its comments of February 18, 2020 to the MADOER, Anbaric stated on page 20 “While Anbaric does not
believe risk mitigation for timing coordination of independent transmission development is necessary,
there are examples of mechanisms put in place whereby financial security for completion of projects could
be posted.” CREZ and TRTP had financial protection mechanisms in place for generators that both
ultimately relied on ratepayers. We are unaware of any insurance or similar financial product that could
provide open-ended protection for OSW generators in the event a coordinated transmission project was
delayed, but innovative solutions should be further explored in the future.
Ulrik Stridbaek of Ørsted also made this point on page 3 of his concluding comments to the Board dated
December 2, 2019, requesting that if an ocean grid is adopted, “…revenue recovery mechanisms are in
place to provide certainty to generators in the case that transmission assets are delayed or unavailable
due to outage.” Assuming a rate-base business structure, we would expect that a coordinated
transmission project’s responsibility to generators would be analogous to PJM’s onshore transmission
grid, i.e., the grid is designed to meet NERC and ReliabilityFirst requirements and is not responsible for
lost generator revenues in the event of a grid failure.69 We are not aware of any regulatory provision for
any regulated PJM transmission asset to provide financial protection to generators.
69 ReliabilityFirst is the regional NERC entity governing PJM.

- 53 -
VIII. Environmental Impacts
Highlights
Short-term environmental impacts to invertebrates, finfish, sea turtles and marine mammals will arise during HDD borings at landfalls, cable installation, and during foundation construction for offshore collector and converter platforms.
HVAC and HVDC cables will be initially buried at depths exceeding the penetration limit of bottom fishing gear and anchors. Over time, cables can become exposed. We expect cable depth to be monitored and cables reburied or covered to minimize long-term snagging risks.
HVAC radial export systems will require more cables, miles of trenches, more landings, and more HDD boreholes compared to a coordinated HVDC transmission solution for the same OSW buildout, and thus will have greater short-term habitat disturbance, cumulative environmental impact, and potential long-term conflict with fisheries.
A coordinated HVDC transmission solution will future-proof New Jersey by pre-building onshore and coastal infrastructure. An ocean grid would be designed for long-term OSW project sizes and locations; a power corridor would be designed for fewer projects in the medium term.
The purpose of this section is to identify and compare the potential environmental impacts of radial export
cable, ocean grid, and power corridor designs. The Round 1 OSW procurement was structured around
radial export cables and Round 2 will also be based on that technology. Therefore, regardless of whether
an ocean grid or power corridor is implemented in the future, at least some radial lines will be installed
off New Jersey’s shoreline. Our comparison is not based on any specific cable route or project but
considers impacts that would be expected for any transmission system from the offshore leases, across
the New Jersey shoreline, and to onshore POIs.
Environmental impacts arising from offshore transmission assets consist of short-term impacts during
construction and potentially during decommissioning, and long-term impacts over the OSW project’s
operating life. The relative magnitude of the environmental impacts is a function of:
the total length of the offshore transmission cables that are installed in separate trenches the number of separate landfall locations and associated HDD borings the number of additional required offshore converter platforms required by HVDC designs70 the size of the footprint for the onshore substations and ROW to the POIs the duration and frequency of habitat disturbance at or near the same location that may
contribute to cumulative impacts.
Transmission configurations that require fewer miles of offshore trenching for cable installation, fewer
landing points, fewer offshore platforms, and a smaller footprint for onshore facilities will result in lower
environmental impact. HVAC radial export cables require more cables, miles of trenches, more landings,
and more HDD boreholes compared to a coordinated transmission solution utilizing HVDC cables for the
70 We assume that the offshore collector stations (with switchgear) are OSW generation project assets and would not differ for any offshore transmission options.

- 54 -
same OSW capacity buildout. HVAC radial export cables will result in greater short-term habitat
disturbance and cumulative environmental impact than a coordinated HVDC transmission solution that
has fewer cables and landfalls. Although cable depth will likely be monitored and cables reburied or
covered up if necessary, there will be potential long-term conflict with fisheries due to anchor or fishing
gear snags for any offshore transmission design. For example, Atlantic Shores explained on page 6 in its
August 2020 Stakeholder Outreach comments provided to the Board:
“Typical monitoring systems include DTS (Distributed Temperature Sensing) RTTR (Real Time Thermal Rating), DAS (Distributed Acoustic Sensing) and/or DVS (Distributed Vibration System). The cables will be surveyed periodically and after storms to verify route and burial depth. Other than monitoring for anomalies in gathered data, an in-service cable typically does not require electrical maintenance unless a cable is suspected to have been disturbed or a failure has occurred and a survey, test, and/or repair may be necessary. There will be visual inspections as well, especially after storms to ensure the cable is not exposed.”
Unlike HVAC radial export cable designs, a coordinated HVDC transmission solution would require
offshore and onshore converter stations and an ocean grid would require additional inter-project cables.
These additional components would not significantly change this environmental comparison.
NY/NJ Ocean Grid
The Board and the DEP submitted Comments to BOEM regarding Anbaric’s Unsolicited Right-of-
Way/Right-of-Use & Easement Grant Application for the NY/NJ Ocean Grid on July 19, 2019. The NY/NJ
Ocean Grid would have up to nine offshore collector platforms (OCPs) to deliver up to 5,900 MW of OSW
power to those states. The Comments expressed DEP’s concern that approving this Application would be
premature and its willingness to collaborate with BOEM and other agencies “…to ensure an efficient and
environmentally-sustainable solution, and to ensure BOEM’s grant of siting authority is not premature.”
DEP identified specific environmental issues for recreational and commercial fisheries:
According to page 4 of the Comments, “…cable routes and OCPs should be sited to minimize potential environmental effects and impacts to fish, shellfish, benthic habitats, avian species, and fisheries.” Sensitive areas as well as sand borrow areas should be avoided.
Also on page 4, “[t]he areas of interest for the proposed ADP ROW is important habitat and fishing grounds for valuable NJ fisheries. This is particularly important for our high-value trawl and dredge fisheries, which use gear that contact the bottom and could snag cables.” More details and survey data were requested along with a plan for stakeholder engagement.
The Board and DEP also requested, on page 5, that all cables be buried at “…a depth that will avoid damage and maintain protection of public health and the environment.”
Construction Method
The offshore cable installation method for HVAC and HVDC cables is essentially the same. Once the
offshore cable route is surveyed, a vessel pulls a grapnel train to prepare the seabed and remove any
debris from along the route. Large sand waves along the route may be dredged to level the seabed. A

- 55 -
cable lay vessel then may either simultaneously lay and bury the cable, or the cable may first be laid, then
buried in a second pass. In some areas, the lay vessel may need to be positioned with anchors. The
trenching and burial are accomplished using either a jet plow, mechanical dredge, or controlled jet
excavation, creating a trench approximately 0.5 to 1 meter wide. The depth of the trench depends on the
sediment type other conditions along the route.
HDD is used to install cables beneath environmentally sensitive areas, such as shoreline habitats and
wetlands, where surface disturbance must be minimized. The HDD rig is set up on shore, and the drill is
advanced seaward along a shallow arc. About one acre is needed for the lay down area for the drill and
ancillary equipment, so typically a site such as a parking lot that is already disturbed is used. A pilot hole
is first drilled, then enlarged to accommodate installation of the desired pipeline. The pipe is pulled into
the enlarged hole, creating an underground duct exposed only at the two endpoints. At the offshore end
of each bore site, an area of just under one acre is excavated where the HDD “punches out” and a
temporary cofferdam may be constructed. The offshore excavation is subsequently backfilled when
construction is complete. Each offshore cable is pulled through the duct from offshore into the below-
grade transition joint bay (also referred to as a splice vault). The only visible components of the cable
system at the landfall location are the manhole covers of the transition joint bay. After cable pull and
splicing are complete, the area is generally restored to its prior use.
Offshore cables must be sufficiently buried so that they are unlikely to be exposed during storms or if sand
waves transport the overlying sediment. Burial depth must also be below the penetration of anchors of
fishing and recreational boats and of bottom fishing gear which may become entangled in cables. OSW
developers report that cables are typically buried at least 1.5 to 2 meters deep, depending on location
and the sediment type. Cables would be buried much deeper in channels that are periodically dredged.
Based on the information currently available, DEP notes that a burial depth of 2 meters in most locations
should minimize the risk of exposure and entanglement and reduce electric and magnetic field (EMF)
effects on fish and invertebrates (further discussed below).71 Large draft commercial vessels have much
deeper anchor penetrations, but transmission cables would not be sited to traverse anchoring areas.
If the cable crosses over another cable or a hard substrate that cannot be penetrated or avoided, a
concrete mattress or rocks are placed as protection over the cable. Following the installation, a remote
operated vehicle inspects the cable route to locate any areas where burial may have been inadequate.
Localized depressions may be backfilled with sediment or rocks.
The distance between cable trenches must be sufficient to allow thermal diffusion between cables and to
permit cable repairs, if needed. OSW developers estimated the distance between cables to be at least 100
feet, but if more than two cables are installed in a single corridor, then a wider distance, at least 250 feet,
is needed to fully access a cable in the middle if repairs are needed. The minimum width of a 1,200-MW,
3-cable HVAC offshore corridor would therefore span at least 350 ft between the two outer trenches. If
multiple cables are installed along a single corridor, they converge at the approach to the landfall. A
minimum distance between cables at the cable entry point is about 7 meters. For each cable, a separate
HDD borehole is drilled and a duct is installed to avoid trenching through sensitive nearshore habitat, such
71 Memorandum from C. Brust, DEP, Marine Fisheries Administration to M. Brunatti, DEP Office of Permit Coordination and Env. Review, “Considerations for Offshore Wind Cable Burial Depth” July 23, 2019.

- 56 -
as eelgrass, dunes, shellfish beds, fish spawning and bird nesting areas, which cannot otherwise be
avoided. A 1,200 MW HVAC radial export cable system would require three separate boreholes, one for
each 400 MW cable. A 1,200 MW HVDC cable would require a single HDD borehole at the landing and two
onshore cables to the POI.72 Each offshore HVDC cable in an ocean grid would require an HDD borehole
at various landfall locations along the coastline. The HVDC cables in a power corridor would group the
HDD boreholes in one landfall location.
BOEM Environmental Studies
The nature and extent of environmental impacts associated with the installation and operation of OSW
transmission cables may be derived from studies conducted by BOEM, by OSW project developers, and
by state environmental agencies. BOEM has conducted numerous studies under its Renewable Energy
Program and as required under the National Environmental Policy Act (NEPA) to inform decision-making
and best management practices regarding renewable energy planning, leasing, and development efforts.
Some of these studies broadly cover the all of the Atlantic Wind Energy Areas (WEAs), and some are
technology, resource, or WEA-specific. Many studies are focused on impacts to fisheries and ecosystems
associated with installation and operation of the wind turbines within the lease areas themselves, rather
than the cable corridors and transmission landing points.
Environmental and fisheries impacts specific to cable construction and operation are, however, addressed
in BOEM’s SEIS for the Vineyard Wind 1 project in the MA/RI WEA. The SEIS assesses the cumulative
impacts that could result from the incremental impact of the Vineyard Wind 1 project and project
alternatives, relative to baseline conditions. To develop the cumulative activities scenario analyzed in the
SEIS, BOEM assumed that approximately 22 GW of OSW development are reasonably foreseeable along
the East Coast. Environmental consequences associated with foreseeable future OSW development with
and without Vineyard Wind (the “no-action alternative” required by NEPA to be evaluated) are described
for the following resources: coastal habitat; benthic resources; finfish, invertebrates, and Essential Fish
Habitat; marine mammals; sea turtles; demographics, employment and economics; environmental
justice; cultural resources; recreation and tourism; commercial fisheries and for-hire recreational fishing;
land use and coastal infrastructure; navigation and vessel traffic; and other uses. For each of these
resources, the SEIS identifies the activities and associated short- and long-term impacts.
Based on information in the BOEM SEIS and other studies, activities and impacts associated with the
construction and operation of a radial export cable system or an ocean grid transmission system are
summarized below. Impacts may occur during cable decommissioning, but BOEM has not yet required
final OSW decommissioning plans to be developed.73
72 A power corridor utilizing HVDC delivery cables would be similar to an ocean grid; both would have fewer offshore cables and fewer HDD boreholes on the coast compared to HVAC radial export cables. 73 BOEM regulations (30 CFR §585 Subpart I) require that upon termination of lease or grant, the lessee must “remove or decommission” all “facilities, projects, cables, pipelines, obstructions.” BOEM requires that a project’s COP include only a conceptual decommissioning plan. BOEM regulations do not require a final decommissioning plan until two years prior to lease termination. The Draft COP submitted by Vineyard Wind I defers the decision whether
- 57 -
Environmental Impacts During Construction
Short-term environmental impacts arise during project construction, specifically during cable
emplacement, at the cable landings, and during construction of foundations for offshore platforms. Short-
term disturbances may contribute to longer-term ecosystem impacts. These impacts consist of:
Increased suspended sediment concentration and redeposition during offshore cable installation, maintenance, and decommissioning (if cable removal is required) causes temporary disturbance of species and habitat. Exposure of demersal organisms to increased suspended sediment concentration and potential smothering and mortality of benthic invertebrates is expected to be short term. Suspended sediment resettles within hours or a few days, depending on the type of sediment, water depth, currents, and frequency of storm events. A field study commissioned by BOEM during construction of the Block Island Wind Farm observed that a trench scar was created following cable installation, with overspill sediments extending up to 7 meters beyond the trench and up to 25 cm thick.74
Anchoring of vessels and anchor cable sweep during survey activities and during the construction, maintenance, and decommissioning of cables and platforms also increases suspended sediment levels and has the potential for direct contact to cause mortality of benthic resources. Impacts would be localized, turbidity would be temporary, and mortality of benthic resources from direct contact would be recovered in the short term. However, benthic invertebrates are a food source for Loggerheads and other sea turtles. BOEM’s approved COP would likely prohibit anchoring in sensitive habitats such as seagrass beds. There may also be a risk of sea turtle entanglement during the cable installation process, but further research is warranted.75
Degradation of sensitive habitats such as seagrass beds during cable installation could be long-term to permanent.76 Seagrass is an important nursery ground for many marine species, food source for sea turtles, and habitat for some threatened and endangered species. Seagrass and other submerged vegetation can absorb wave energy and mitigate storm surges and coastal erosion. They are also an important sink for carbon dioxide.
Marine survey activities, installation activities, and pile driving for offshore platform foundations have the potential to locally and temporarily generate noise, which is known to create stress and behavioral changes to marine mammals, sea turtles and other species. Pile driving for offshore structures (and not cables), in particular, may cause changes in swimming patterns/speed, dive profiles, group movements, vocalizations and communication,
to remove cables or decommission in place. See: Vineyard Wind, Draft Construction and Operation Plan, submitted to BOEM June 3, 2020, prepared by Epsilon Associates, Inc. p. 4-45.
https://www.boem.gov/sites/default/files/documents/renewable-energy/Vineyard-Wind-COP-Volume-I-Section-4_0.pdf 74 BOEM, “Observing Cable Laying and Particle Settlement During the Construction of the Block Island Wind Farm” OCS Study BOEM 2017-027, March 2017 https://espis.boem.gov/final%20reports/5596.pdf 75 Protected Species Observers are generally required to be present on vessels during OSW development and construction activities. 76 BOEM, SEIS, p. 3-12.
- 58 -
respiration and displacement from key habitats, which can result in decreased foraging, nursing and mating of marine mammals. Noise transmitted through water and/or through the seabed can cause injury and/or mortality to finfish and invertebrates in a limited space around each pile and can cause short-term stress and behavioral changes to individuals over a greater space.77 Noise reduction measures for offshore structures, such as bubble curtains, may be required under the approved COP.78
Increased vessel traffic during surveys, construction, and decommissioning increases the risk of collision with marine mammals and sea turtles, including threatened and endangered species. Increased vessel traffic also increases risk of avian species strikes, particularly during seasonal migration. Developers will be required to comply with National Oceanic and Atmospheric Administration, National Marine Fisheries Service guidance to minimize vessel strikes.
During surveys, construction, operations, and decommissioning, there is the potential for accidental releases or discharges of pollutants, oil, trash, etc. In the SEIS, BOEM concluded that accidental releases are anticipated to be short term and localized and would not be expected to contribute appreciably to overall impacts.79
Emissions from vessels, vehicles and equipment during construction, operations, and decommissioning activities, vessels traveling to and from the project site will result in a small amount of air emissions. Generators or other equipment used for both onshore and offshore facilities may also result in air emissions. We note that incremental emissions resulting from construction, operations, and decommissioning represent only a very small offset to the cumulative air emissions avoided from the operation of the OSW project.
During cable installations, fishing operations will be excluded from the construction corridors for several days until the cable trench has settled and been surveyed.
The installation and decommissioning of the onshore transmission cable and substation(s) will temporarily disturb some portions of the ROW. Sensitive environments, such as streams or wetlands, will require HDD for crossings and restoration of disturbed areas, pursuant to New Jersey regulations.
Environmental Impacts During Operation
Long-term environmental impacts are associated with permanent changes to habitat and or land use that
persist during the operating period of the project. These include:
Long-term habitat loss or modification resulting from the presence of offshore platform foundations, scour potential around platform footings, and resuspension of sediments during
77 BOEM, SEIS, p. 3-14. 78 A bubble curtain is an underwater system that produces bubbles in a deliberate arrangement to create a barrier to the propagation of contaminants, particles, or sound. 79 BOEM, SEIS, p. 3-21.

- 59 -
storms. Offshore platforms are large structures that increase the risk of avian impacts, particularly during migration.
Localized habitat modification at cable crossings, where “mattresses” or rocks are placed to protect crossed cables creating localized permanent structures.
Possible visual impacts from lighting on offshore platforms, particularly the large converter stations for an ocean grid, but probably have minimal impact given distance from shore.
Sensitivity to EMF by marine mammals and sea turtles, and the effects of EMF on the behavior of electrosensitive and magneto-sensitive species, e.g., elasmobranchs, crustaceans, is not well understood. The BOEM SEIS reports that “biologically significant impacts on finfish and invertebrates have not been documented for EMF from alternating current (AC) cables. Behavioral impacts have been documented for skates and lobsters near operating DC cables, but they are localized and affect the animals only while they are within the EMF.”80 Cables will likely be required to be installed with appropriate shielding, burial depth, and separation to reduce potential EMF.
Impacts to commercial and recreational fishing, and to marine traffic associated with the export or
delivery and inter-project cables are both temporary and longer term:
Buried export and delivery cables will be marked on NOAA navigational charts. Exclusion zones are not expected to be required around the cable corridor if the route avoids shipping traffic lanes.81 Except for during construction, it is not expected that there will be a barrier prohibition to commercial fishing or recreational fishing or boating crossing the cables
Commercial fishermen express concern about the risk that fishing gear and/or anchors may snag on exposed cables. About 70% of New Jersey fishery revenue is from bottom dredging gear, primarily for surfclam, ocean quahog, and sea scallop.82 This equipment penetrates about one foot into sediment, as do anchors for commercial and recreational fishing boats. Additionally, bottom fish such as flounder, golden tile, and monkfish are caught by bottom dragged nets. Requirements established by NJDEP and BOEM regarding cable burial depths and regular monitoring (with re-burial or covering if necessary) are intended to minimize the risk of bottom fishing gear being snagged or damaged by cables.
For safety and security reasons, exclusion zones will be created around all offshore platforms regardless of the transmission system required to connect the OSW project to the POI. Ocean grids using HVDC technology will require an additional platform for an offshore converter station that is much larger than the collector platform that would be required for any OSW project. Commercial fishing and recreational fishing and all private and commercial vessels will be prohibited in this zone for the life of the project. The exclusion zones around the
80 BOEM SEIS p. 3-21. 81 The U.S. Coast Guard determines threats from vessel traffic including fishing, general shipping, and recreational uses and considers the anchor types, drag depths, and recreational usage of the area. If a cable cannot be sufficiently buried due to hard bottom or other obstruction, the Coast Guard may establish a safety zone around that location. 82 BOEM, “Socio-Economic Impact of Outer Continental Shelf Wind Energy Development on Fisheries in the U.S. Atlantic” OCS Study 2017-012, February 2017. https://espis.boem.gov/final%20reports/5580.pdf
- 60 -
converter platforms, however, will be a relatively small increment compared to the navigational restrictions within the turbine grids, where safety zones will be established around each of the wind turbines.
Foundations for offshore structures may serve as artificial reefs, creating localized habitat for fish and invertebrates and increasing food sources, which will attract avian species.
New Jersey’s environmentally sensitive coastline affords limited points to land new transmission cables.
A BOEM geographic information system database identifies the locations of numerous existing cables
along the New Jersey coast, shown on Figure 10. NOAA Charted Submarine Cables.83 Most are
transatlantic telecommunications cables, but a few are electrical cables connecting islands to the
mainland. There are clusters of telecom cables emerging near Manasquan, Harvey Cedars, and Beach
Haven. Detailed NOAA charts of Long Beach Island and the intercoastal waterway confirm that the cables
do not cross the barrier island or continue across to the mainland, and therefore avoid environmentally
sensitive areas. Existing cables do not cross the seagrass beds, shown as green areas in Figure 10. NOAA
Charted Submarine Cables, nor are they located in “Habitat Areas of Particular Concern,” mapped as the
yellow areas. Habitat Areas of Particular Concern are defined as “…subsets of Essential Fish Habitat (EFH)
that provide extremely important ecological functions or are especially vulnerable to degradation.” Not
shown on this map are numerous coastal areas designated by DEP Division of Land Resource Protection
as Shellfish Habitat, regulated under N.J.A.C 7:7-9.2. “New dredging” for cable installation is prohibited in
these areas.
83 Source: BOEM Marine Cadastre National Viewer, https://marinecadastre.gov/nationalviewer/

- 61 -
Figure 10. NOAA Charted Submarine Cables
Future-Proofing
Future-proofing in this context refers to building transmission infrastructure so that it remains useful and
can be utilized in the future to avoid multiple construction efforts and repeated disturbance of the same
location. Recurring habitat disturbance could be avoided by constructing extra HDD ducts and transition
joint bays in anticipation of future OSW projects with landing points in close proximity, subject to space
constraints. This would largely but not completely avoid repeated and cumulative impacts in the sensitive
coastal habitat. At some future time when the extra cable ducts are to be utilized, the offshore duct ends
would be unburied and uncapped to allow the marine cables to be pulled through, re-disturbing a small
section of sediment.
Similarly, the onshore segments may be developed to minimize or avoid repeated ROW mobilizations.
Physical landfall constraints and capacity limitations at the POI may limit the opportunities for future-
- 62 -
proofing the transmission system. Whether extra HDD ducts that are not necessary could be permitted
and whether ratepayers should bear costs for infrastructure that is not currently or may never be utilized
remain open questions. There are also questions about evaluating OSW bids that include extra
infrastructure and any uncovered risks a developer would take on if required to utilize that infrastructure
but was not a party to the original HDD contract. A cost-benefit analysis of future proofing to enable lower
cost expansibility for additional OSW tranches to achieve 7.5 GW is worthwhile from a ratepayer
standpoint is outside the scope of this assessment.
A bundled OSW project could install extra HDD ducts and transition joint bays for future-proofing, but
there are many questions regarding liability between the original and ultimate owner, cost recovery until
those assets are utilized, and environmental benefit limitations if onshore construction from the joint bay
to the POI will be required in the future. An ocean grid by definition, achieves future-proofing by building
the entire onshore and coastal transmission infrastructure for New Jersey’s remaining long-term OSW
development. A power corridor would also future-proof but for a smaller number of medium-term OSW
projects, which may be more manageable and lessen ratepayers’ cost recovery risk. In our example, a
southern corridor could serve the Ocean Wind, Atlantic Shores, Garden State, and southern portion of the
proposed Hudson South lease areas. Board Staff may want to examine the feasibility of an SAA power
corridor to help mitigate environmental impacts attributable to multiple landfalls and by weighing the full
range of potential benefits against the costs and risks.

- 63 -
IX. Technology, Redundancy, Reliability, and Losses
Highlights
Radial export cables would rely on 220 kV - 275 kV, 3-phase / 3-core designs with up to 400 MW of capacity. A 1,200 MW OSW project would require three radial export cables that would be buried in three separate trenches on the sea floor.
A coordinated transmission project would likely utilize HVDC technology. Current technology is typically ±320 kV 2-core cables that can carry 1,000-1,200 MW and be installed in a single trench. Higher voltage cables with and higher capacities are becoming available but may not be useable due to PJM reliability criteria.
HVAC and HVDC subsea cables are reliable. Failures are rare and are typically due to manufacturing defects, installation mistakes, or damage by external factors.
HVAC or HVDC submarine cables from an OSW project would make landfall through HDD ducts to transition joint bays, at which point each cable core would be jointed to a single core onshore cable buried in a single bank to the POI.
HVAC cable losses increase with distance. HVDC cable losses are largely unaffected by distance converters impose their own losses. We estimate HVAC radial export cable losses at about one-half of HVDC losses for a single OSW project due to the relative proximity of existing and proposed BOEM lease areas to New Jersey’s shoreline.
Constructing an entire ocean grid in one program would be a formidable undertaking for a first-of-its-kind project. Construction in stages would be more manageable but might significantly increase the construction cost and lessen environmental and permitting advantages. Constructing a power corridor appears far less complicated.
A claimed ocean grid advantage is reducing congestion and energy prices by injecting OSW or grid energy at the POIs with the highest prices, but a simple analysis of New Jersey zonal 2019 hourly energy prices did not reveal significant net benefits.
Overview
Marine HVAC and HVDC cables have been in use for decades. Both HVAC and HVDC cable capacities have
increased over time. As evidenced by their wide use, marine cables are considered to be reliable and are
widely used for transmitting energy to remote loads, sharing supplies between markets, ensuring
reliability across bodies of water, and delivering power to or from offshore locations. Current HVAC and
HVDC cable designs have copper or aluminum conductors, cross-linked polyethylene insulation, and
external armoring.
The PJM transmission system is an HVAC system for internal generation and loads. Other domestic and
European power systems are also HVAC systems due to its relative simplicity and low cost. HVDC
technology has fewer losses for transporting large quantities of power over long distances but requires
more expensive conversion equipment. HVDC cables are used to link PJM (New Jersey) with NYISO (New
York) due to its controllability and ability to connect to independent power systems. Two such cable
projects are the 660 MW Neptune project and the 660 MW Hudson Transmission Project.
- 64 -
HVAC and HVDC Technology
Current HVAC technology relies on 400 MW, 220 kV - 275 kV, 3-phase / 3-core designs for OSW radial
export cables.84 Thus a 1,200 MW OSW project would require three radial export cables that would fan
out from the OSW project’s offshore collector platform and be buried in three separate trenches on the
sea floor, and pulled through three separate HDD ducts at the landing to the below grade transition joint
bay.85 The 3-core HVAC submarine cables would be separated in the transition joint bay and each cable
core would be jointed to a single core cross-linked polyethylene onshore cable. The nine onshore cables
would exit the vault and be buried in a single bank along the ROW to a transformer located adjacent or
close to the POI.
A coordinated transmission system would likely rely on HVDC cables.86 Current technology is typically ±320
kV 2-core (bundled positive and negative, plus fiber optic) cables that can be installed in a single trench
with higher voltages becoming available,.87 Higher capacity cables are becoming available but may not be
usable in New Jersey if a single OSW injection exceeds the largest EMAAC or RTO generation source and
triggers compensating costs. An ocean grid or power corridor would require numerous offshore
HVAC/HVDC converter station platforms, probably with jacket foundations, that would be considerably
larger than collector platforms. They would also require onshore HVDC/HVAC converter stations that
would typically be located close to the POIs and be comparable in size to a large electric substation.
The increasing capacities of offshore HVDC transmission systems is illustrated by the BorWin projects
developed by TenneT GmbH, as illustrated in Figure 3.
BorWin1 utilized the first offshore HVDC converter platform in the North Sea to deliver up to 400 MW of energy from the BARD OSW farm over 125 km of marine cable plus 75 km of onshore cable to an inland grid connection point. Upon completion, this had the largest capacity and was one of the longest OSW transmission projects, demonstrating that HVDC technology was suitable for long underwater distances. BorWin1 has been operational since December 2010.
BorWin2 was designed to deliver 800 MW with one offshore converter and one onshore converter. OSW energy is delivered over 110 km of marine cable plus 90 km of onshore cable with
84 HVAC cable capacity may be affected by cable length, water depth, seabed conductivity, and any required reactive compensation. Cable capacity is more accurately described as ampere-capacity, or ampacity that can be converted to units of power at unity voltage. 1MVA = 1 MW at a 1.0 power factor. The actual power factor for a NJ OSW radial export cable will likely be close to 1.0. LAI assumes that 1 MVA = 1 MW. 85 Ocean Wind 1 has proposed to utilize two POIs and will therefore have two radial export cables in parallel trenches to Oyster Creek and a third cable to BL England. 86Radial export cables can but do not generally utilize HVDC technology. 87 Most but not all HVDC cables are bundled pairs. TenneT GmbH’s HVDC transmission projects utilize separate HVDC cables with positive and negative poles that are buried some distance apart in a single trench. The 1,400 MW +/- 515 kV HVDC North Sea Link is currently under construction to transmit energy between the northeast of England and the southwest of Norway. The 720 kilometer cable would be the longest underwater power cable in the world but will not transmit OSW energy. The project licenses were granted in 2014, cable installation commenced in 2018, and commercial operation is expected in 2021. The Eastern HVDC Link is expected to utilize +/- 525 kV technology to deliver 4 GW of OSW energy via two cables along the eastern costs of Scotland and England. Construction is expected to start in 2025 with completion in 2029.
- 65 -
losses estimated to be less than 4%. Borwin 2 runs parallel to Borwin 1 to minimize environmental impacts and has been operating since January 2015.
BorWin3 is a 900 MW HVDC interconnection project with a 130 km marine cable plus a 30 km onshore cable and two converter stations. It was ready for service in August 2019 and became operational in February 2020.
Anbaric has depicted an ocean grid using HVDC technology for the delivery cables to shore and for the
inter-project cables that connect the OSW projects to one another. Assuming four 1,200 MW OSW
projects, an ocean grid would thus have three inter-project HVDC cables and four HVDC delivery cables.
Each delivery cable would require a single HDD borehole and conduit from the landing to a transition joint
bay, along with its own onshore underground cables to an onshore converter station.
HVAC and HVDC Common and Differentiating Factors
Regardless of HVAC and HVDC technology, the marine cables would be pulled through the HDD ducts to
a transition joint bay where it would be connected to onshore cables that would likely be installed
underground to the POI. Depending on voltage and design details, onshore HVAC cables would likely
terminate at a transformer station adjacent to the POI. Onshore HVDC cables would likely terminate at a
combined transformer and HVDC/HVAC converter station adjacent to the POI.
The choice of HVAC or HVDC cables is highly project specific. All OSW projects submitted in the Board’s
first solicitation used multiples of 400 MW radial HVAC export cables. Since the earliest OSW projects
were conceived, i.e., Block Island, South Fork, Skipjack, and US Wind, virtually all OSW projects submitted
in other states have been offered in multiples of 400 MW. OSW developers participating in the Board’s
stakeholder meetings concurred that HVDC may become economic for OSW projects that are more distant
from shore and can use the full 1,200 MW cable capacity. HVAC cable losses increase with distance; HVDC
cable losses are relatively unaffected by distance but HVDC converter stations are expensive and impose
fixed losses.88
Balancing losses and costs is a key part of the economic equation regarding OSW transmission technology.
LAI’s high-level comparison indicates that losses for HVAC radial export cables would be less than for an
HVDC system for a single large OSW project given the relative proximity to the New Jersey coast. This is
just one of the economic, environmental, and risk tradeoffs that must be factored into a transmission
decision. OSW developer decisions also consider equipment delivery schedules, vendor pricing, and other
commercial issues. The BOEM lease sites off the New Jersey and Delaware coasts are only about 15 miles
to shore from their closest points, and BOEM’s recommended primary and secondary portions of the
proposed Hudson South lease area are about 25-35 miles away. These distances may not be long enough
88 In its OSW Study Phase 2 Results presentation, PJM roughly estimated the cost for a converter station at $250 million.
- 66 -
to warrant the more capital-intensive HVDC technology.89 Over time, HVDC may become more
competitive for radial export cable configurations as capacity from nearby BOEM lease sites is depleted.
TenneT recognizes the relative advantages for HVAC and HVDC systems and has been utilizing HVAC
technology for moderate power amounts over short distances. According to its brochure, From Land to
Sea published in January 2020, “Nordergründe is the third project within the twelve nautical mile zone of
Lower Saxony for which TenneT has implemented a three-phase [AC] grid connection. This is both
technically and economically the most efficient solution, as the Nordergründe wind farm is only around
30 kilometres from the coast.” This distance is comparable to the existing BOEM leases off the New Jersey
coast.
Cable and Converter Reliability
HVAC and HVDC subsea cable failures are rare and are typically due to manufacturing defects, installation
mistakes, or damage by external factors, e.g., ship anchors. Handling and installation of subsea cables
must be done by qualified firms using specialized vessels. While marine cables are not considered to be
less reliable than underground cables, repairs are more difficult and can take much longer.90 Once the
location for the damaged portion is identified, the two cable ends must be brought to the surface in a
special vessel that can splice in a new section and re-lay the cable. The splice lengthens the cable, requiring
a new and longer seabed trench.
The HVAC/HVDC voltage source converters that would utilized by a coordinated transmission project have
become more widely utilized but their implementation in a multi-terminal ocean grid arrangement is rare.
In terms of reliability, the additional converters, DC inductors, filters, and other HVDC components
themselves likely do not have a discernable difference when compared to individual HVAC components,
since an HVAC-based system may also introduce the need for ancillary equipment such as gas-insulated
switching, reactive compensation, and filtering. Both technologies and associated equipment have long
been used across the globe with a proven track record for reliability. However, when comparing the
technologies from an integrated system arrangement standpoint, it is difficult to compare the expected
reliability of a first-of-its-kind, multi-terminal HVDC ocean grid to the reliability of numerous sets of
existing HVAC radial export cables.91 While it is obvious that the first use of a certain type of technology
generally assumes a higher degree of uncertainty and risk, differences in expected reliability would need
to be more comprehensively analyzed based on a thorough, detailed comparison of the proposed
arrangement and the underlying equipment.
89 Hornsea 1, 1,218 MW and 75 miles from the UK shore, elected to utilize 245 kV HVAC cables with a reactive compensation substation platform. It is expected to become operational later this year. Hornsea 2, 1,320 MW and 55 miles from the U.K. shore, is also being constructed with HVAC cables and a reactive compensation substation platform. 90 A domestic submarine cable failure happened on the 660 MW HVAC Hudson Transmission Project in 2016 that required replacement of the submarine cable. 91 In our discussions with converter manufacturers, they were not aware of any existing ocean grids with multiple generation sources and grid injections.
- 67 -
OSW developers have a demonstrated track record of designing, permitting, building, and operating radial
export cables. They point to the fact that “risks are aligned” and the logic of having OSW generation and
transmission bundled together. For either offshore transmission option, PJM’s detailed and
comprehensive interconnection process would ensure that the design will support the safe and reliable
operation of the PJM grid.
Redundancy
Radial export cables have some level of redundancy due to their use of multiple HVAC cables, typically
three for a 1,000 MW - 1,200 MW OSW project. If one cable fails, the OSW project would be able to limit
its total output so as not to exceed the capacity of the remaining two cables.92 An ocean grid could also
operate this way by re-directing generation to its remaining HVDC delivery cables and limiting total OSW
output to the capacity of those remaining cables.93 In this regard, the redundancies of the two offshore
transmission options are expected to be similar but would depend on the specific cable and converter
designs. A power corridor may be able to provide a similar level of redundancy if its design could permit
energy transfers among the HVDC circuits.
One of the goals of Anbaric’s proposed NY/NJ Ocean Grid is “maximizing the deliverability” from the OSW
projects. Although its BOEM Application does not describe how it would accomplish this, another way to
continue full deliveries in the event of a cable failure would be to build excess delivery capacity into the
ocean grid.94 For example, an ocean grid designed to deliver energy from six 1,000 MW OSW projects with
six 1,000 MW delivery cables could have a seventh cable to ensure full deliveries in the event one delivery
cable fails. Alternatively, an ocean grid could ensure full deliveries by over-sizing the six delivery cables to
1,200 MW, so that five of the six could accommodate the full 6,000 MW of OSW generation. Such solutions
to ensure full OSW delivery would require additional costs to “oversize” the cables or POI injection
capacity and incur additional system upgrades.95
Performance
Rate-based coordinated transmission projects differ from radial export cables in performance incentives.
If an onshore PJM transmission asset has an operational failure and the owner has adhered to appropriate
construction and maintenance practices, the owner would not be penalized. The just and reasonable costs
92 For example, a 1,200 MW OSW project that lost one of three radial export cables would limit its total output to about 800 MW until the cable was repaired. 93 For example, an ocean grid with six 1,000 MW HVDC delivery cables connecting to six 1,000 MW POIs would have to limit OSW generation to 5,000 MW if one delivery cable failed. Alternatively, the combined output of the six OSW projects could be limited to 5,000 MW until the ocean grid delivery cable was repaired. 94 Anbaric’s Unsolicited Right-of-Way/Right-of-Use & Easement Grant Application for the NY/NJ Ocean Grid states it “…will connect to the onshore electric grid with a goal of maximizing the deliverability from the offshore while minimizing the need and cost for onshore upgrades.” The number of cables and marine trenches, as well as the POIs, were not specified in the Application but were later identified as Ruland Road, Farragut, and Gowanus in New York and Deans, Larrabee, and Cardiff in New Jersey in a presentation to the Intergovernmental Renewable Energy Task Force Meeting on the New York Bight. 95 Excess network grid capacity would only be required if the six OSW projects were operating at or close to full capacity. In this example, excess capacity would not be required if the six OSW projects could be curtailed.

- 68 -
of repairs or replacement would be rate-based and recovered from ratepayers. We anticipate that a
coordinated transmission project, as an offshore PJM transmission asset, would be receive similar
treatment.
It is reasonable to assume that PJM would not approve a coordinated transmission solution that was not
properly designed, constructed, operated, and maintained. Repairs should therefore be infrequent.
However, as a rate-based asset, performance risk will likely reside with ratepayers unless commercial
safeguards are incorporated via the SAA process that requires the transmission owner and operator to
bear all or some of the repair costs. In contrast, a radial export cable approach leaves performance and
repair cost with the developer. The extent to which cable performance and repairs are reflected in the
applicant’s bid offer price has not been discovered.
Engineering, Procurement, and Construction
Many radial export cable and hybrid systems have been designed and engineered in Europe over the past
decade. The first few domestic OSW projects benefited from that overseas experience. While onshore
transmission experience is applicable, the environmental challenges of severe weather, physical damage
(anchors, trawls, etc.), and corrosion for offshore applications are significant. Nevertheless, we are not
aware of any generic engineering problems with radial export cables. Ocean grids and power corridors
are more complex and will require greater design and engineering effort. More importantly, without any
in operation, there is little opportunity to evaluate the track record for a first-of-its-kind project to benefit
from lessons learned. We view power corridors as less technically risky because marine HVDC systems are
in use and grouping cables together in a ROW should not constitute a technical challenge.
Any HVDC transmission system requires more specialized equipment than radial export cables. Based on
conversations with vendors, an offshore HVDC system for a single OSW project would take 1½ - 2 years
longer to procure than for similarly specified HVAC radial export cable designs. Given the size and
complexity of a coordinated transmission solution for multiple OSW projects, we were informally told that
it could take even longer to procure the required equipment, particularly the converters, compared to
multiple sets of radial export cables.
The actual construction effort for a coordinated transmission project would be more complicated
compared to radial export cables. OSW projects with bundled transmission, primarily in the U.K., have
demonstrated the developers’ ability to coordinate engineering, procurement, and construction (EPC) to
ensure that initial OSW energy can be delivered to the local grid. A coordinated transmission project would
be constructed independently of the OSW projects, possibly in accord with the timing of the Round 3 and
4 OSW projects. Constructing the entire transmission project in one program would be a massive
undertaking, particularly for first-of-its-kind. An ocean grid constructed in stages would likely be more
manageable, but would increase the construction cost, possibly significantly, and lessen anticipated
environmental and permitting advantages. Since a power corridor is by definition within a single ROW, it
would not make sense to construct it in stages. However, the converters at each end could be constructed
as part of the SAA solution or could be added later by the OSW developers.
- 69 -
Losses
Losses for HVAC and HVDC transmission options are difficult to compare and depend heavily on numerous
physical details typically developed during the conceptual design phase. In general, losses for HVAC cables,
such as traditional OSW radial export cables, grow as power deliveries and cable length increases. This is
primarily due to the conductor resistive (skin) losses that are absent in HVDC technology. Making generic
assumptions with basic equipment data from more recent projects and excluding the offshore collector
step up transformer, we estimated that a set of three 275 kV HVAC radial export cables carrying 1,200
MW from any one of the New Jersey BOEM lease areas to a POI with a total onshore plus offshore distance
of roughly 30 miles from the high side of the collector platform to the POI would have total losses of about
10 MW or 0.83%. This includes two 600 MVA transformers with typical impedance characteristics.
HVDC cables have relatively small losses but the offshore and onshore converter stations themselves
would impose material losses, so HVDC-based system losses would be less variable and relatively
independent of cable length. An equivalent 1,200 MW HVDC system with two voltage source converters
operating at 320 kV, one at the POI and one located at the high side of the offshore collector platform
with a total onshore plus offshore cable distance of roughly 30 miles, would have total estimated losses
of about 21.4 MW or 1.78%. If the output of the onshore converter must be transformed to match the
POI voltage, the HVDC system losses would be higher.
When considering radial export cables or an HVDC system design in the context of New Jersey’s 7.5 GW
goal, we can scale up the 1,200 MW loss estimates above assuming Rounds 1 and 2 will utilize HVAC radial
export cables. The remaining 5.2 GW or Rounds 3-6 implies losses of about 43.3 MW for HVAC radial
export cables and losses of about 92.7 MW for an HVDC-based ocean grid. We recognize these estimates
rest on numerous simplifying assumptions; a detailed analysis is not possible without defined system
arrangements and equipment selections. While the accuracy of our loss estimates could be improved, a
coordinated HVDC transmission solution could be expected to have about twice the losses of HVAC-based
radial export lines based on the relatively short transmission distances from existing and anticipated
BOEM lease sites to shoreline POIs.
As an additional reference point, we were informally told by TenneT GmbH that its HVDC hybrid systems
have total losses of just under 4%: about 1% for each converter station and about 2% for transformers,
HVDC cables, and other equipment. TenneT GmbH recognizes that HVAC is more cost-effective for small
OSW projects and short distances. According to the TenneT GmbH website, “Nordergründe is the third
project within the twelve nautical mile zone of Lower Saxony for which TenneT has implemented a three-
phase [AC] grid connection. This is both technically and economically the most efficient solution, as the
Nordergründe wind farm is only around 30 kilometres from the coast.”
Operating and Maintenance Costs
It is difficult to compare the expected operating and maintenance (O&M) costs for HVAC and HVDC
transmission designs without specifying the arrangement and equipment for the two systems. While a
coordinated HVDC transmission solution has more equipment and requires more specialized maintenance
and repair expertise, we expect that the O&M costs for either system would be very small relative to their
capital costs and would not be a meaningful differentiator at this conceptual level of comparison.

- 70 -
Ocean Grid Energy Transfers
Unlike the other options, ocean grids can be designed to transfer energy across its system to minimize in-
state congestion subject to PJM market rule and dispatch procedures. This could be done with OSW
energy or with grid (non-OSW) energy. In the first case, OSW energy can be directed to ocean grid POIs in
zones with high Locational Marginal Prices (LMPs).96 In the second case, an ocean grid could withdraw grid
energy at one or more POIs with low LMPs and inject it at other POIs with high LMPs. This is a potential
advantage of controllable HVDC technology and can be a valuable means to optimize the coastal onshore
transmission system and defray the higher cost of HVDC technology. The extent to which controllable
HVDC technology can confer energy price benefits by injecting OSW generation at the POIs with the
highest LMPs has been explored on a preliminary basis through a simple look back at 2019 zonal LMPs in
New Jersey. The results are discussed below.
New Jersey ratepayers have often incurred relatively high energy prices compared to other PJM load
zones due to transmission congestion. Transmission improvements like the Susquehanna-Roseland 500
kV line and others have lowered in-State congestion.97 PJM conducted a Market Efficiency Analysis on the
expected energy price impacts of the Susquehanna-Roseland line and found that AECO, JCP&L, PSE&G,
and RECO were among the load zones with the highest forecasted savings.98
If an ocean grid were to withdraw grid energy or shift OSW energy from a low energy cost zone and inject
it in a high energy cost zone, energy prices in the injection zone should decline due to the lower-cost
incremental supply. However, energy prices in the withdrawal zone may increase if more expensive
supplies must be generated in or transmitted into that zone. The extent to which benefits in one zone are
offset by costs in another has not been assessed in detail but LAI prepared a high-level estimate of the
potential net savings of transferring grid energy. We relied on 2019 hourly day-ahead LMPs among the
New Jersey load zones that could have ocean grid POIs – AECO, JCP&L, and PSE&G.99 We found that the
AECO average 2019 day-ahead LMP was 0.7% lower than the load-weighted 3-zone average LMP, while
the JCP&L and PSE&G average 2019 day-ahead LMPs were 0.1% above the 3-zone average. All three zones
had hours in which the LMPs were above the three-zone average, which we assumed was primarily due
to in-state transmission congestion and could be theoretically alleviated by an ocean grid shifting energy
deliveries from low-cost zones to high-cost zones.
96 We assumed an ocean grid would have POIs in the AECO, JCP&L, and PSE&G zones. RECO is inland and would not have a POI, but its LMPs could be affected by ocean grid energy transfers. 97 The Roseland-Susquehanna project also included upgrades to 230 kV lines and new and upgraded substations. 98 For the 2007 base case, PJM found the line would reduce RTO energy prices by a load-weighted average of 0.2%. The savings for the New Jersey load zones ranged from 0.7% to 1.0%. For the 2010 analysis, PJM found the line would reduce RTO energy prices by a load-weighted average of 0.2%. The savings for the New Jersey load zones ranged from 0.8% to 1.2%.https://www.pjm.com/-/media/committees-groups/committees/teac/20070314/20070314-item-07-susquehanna-roseland-500kv.ashx 99 We did not use year-to-date 2020 data because it may not be representative due to coronavirus effects on load. Day-ahead LMPs include the PJM System Energy Price and components for congestion and transmission losses.

- 71 -
Table 3. New Jersey 2019 Zonal LMPs and Energy Costs (averages are load-weighted)
AECO JCP&L PSE&G Average/Total
Load (GWh) 9,418.4 22,286.0 43,107.3 74,811.7 Average LMP ($/MWh) $24.90 $25.12 $25.10 $25.08 Annual Energy Cost ($ millions) $234.5 $559.7 $1,082.0 $1,876.3
Zonal LMP Premiums above 3-Zone Average Hours 2,972 5,333 5,169 n/a Average Premium ($/MWh) $0.68 $0.13 $0.31 n/a Annual Premium ($ millions) $2.4
+1.0%
$1.7 +0.3%
$7.5 +0.7%
$11.7
+0.6%
Zonal LMP Premiums at least 2% above 3-Zone Average
Hours 882 189 410 n/a Average Premium ($/MWh) $0.03 $0.01 $0.04 $0.03
Annual Premium ($ millions) $1.3 +0.55%
$0.2 +0.04%
$3.6 +0.33%
$5.1
+0.27%
As shown in Table 3, ratepayers in AECO, JCP&L, and PSE&G paid an extra $11.7 million when their 2019
LMPs were above the 3-zone average, primarily due to congestion. Parenthetically, we note those
ratepayers saved an equivalent amount when their 2019 LMPs were below the 3-zone average. This
amount represents a 0.6% premium over the total 2019 average energy cost for the three zones. However,
any net savings would have to cover the converter and transformer losses an ocean grid would incur in
shifting energy deliveries.100 In order to account for those losses, we imposed a conservative 2% threshold
for this analysis, i.e., zonal LMPs must be at least 2% above the 3-zone average for grid or OSW transfers
to be cost-effective. The results in Table 3 indicate that the total potential savings is reduced to $5.1
million, a 0.27% premium over the 2019 average energy cost for AECO, JCPL, and PSEG. While it may be
possible for an ocean grid to alleviate some portion of that premium, shifting grid energy or OSW energy
to high-priced injection zones would likely raise LMPs in the withdrawal zones, reducing or eliminating the
overall benefit to New Jersey ratepayers.101
HVAC and HVDC Applications to Date
HVAC radial export cables is the most common offshore transmission technology being used in Europe.
HVDC hybrid systems are sometimes utilized to minimize losses over long distances. This is consistent with
the June 2020 Offshore Wind Supply Chain, Infrastructure, and Workforce Development for 7,500 MW for
2035 (OSW Supply Chain) report provided as Appendix C to the Strategic Plan: “HVAC electrical systems
have been the most common solution to date. For projects that are built further offshore, however; there
is a cost benefit in using HVDC systems due to reduction in electricity losses.” While a long HVAC distance
may require reactive compensation equipment, e.g., Hornsea One, HVDC systems require expensive and
sizeable onshore and offshore converters. According to the OSW Supply Chain report, “An HVAC offshore
substation platform weighs up to 2,000t and may include a helipad and emergency accommodation. HVDC
100 An hourly chronological dispatch simulation analysis would be required to accurately estimate the changes in zonal LMPs and any net savings to New Jersey ratepayers after losses for ocean grid energy transfers. 101 This review of 2019 zonal LMPs is useful but not dispositive in light of key structural changes to New Jersey’s future resource mix, including uncertainties surrounding the divestiture of PSEG Power’s fossil fleet.

- 72 -
substations are much larger, with masses of up to 15,000t.” While technology advancements are reducing
the physical footprint of the equipment, for general comparison purposes an HVDC converter station
would be many times the size and weight of an HVAC collector platform.
All U.K. OSW projects utilize HVAC radial export cables, even large projects over 1,000 MW. TenneT GmbH
has the largest European offshore transmission portfolio with HVAC and HVDC radial export cables and
hybrid systems. TenneT GmbH has no ocean grids but is planning large OSW transmission systems for the
distant future.102 TenneT GmbH’s Netherlands affiliate, TenneT TSO B.V., will utilize HVAC cables for its
offshore transmission projects for the next five years and HVDC cables for onshore transmission.103
According to TenneT TSO B.V.’s brochure, From Land to Sea published in January 2020:
“In TenneT’s view, the best way to connect wind farm areas located relatively close to the Dutch coast to the grid is to use alternating current technology. The energy produced in these areas can be transmitted via a standard TenneT transformer platform that is connected to an onshore high-voltage station located near the coast via 220 kV AC cables buried in the seabed. This standardised connection system with a capacity of 700 MW each is used by TenneT for the wind energy areas of Borssele (2 x 700 MW), Hollandse Kust (zuid) (2 x 700 MW), Hollandse Kust (noord) (700 MW), Hollandse Kust (west) (2 x 700 MW), and the area Ten Noorden van de Waddeneilanden (700 MW).”104
On June 4, 2020, Vattenfall announced its final investment decision to proceed with the 1,500 MW
Hollandse Kust Zuid OSW project, Europe’s largest to date. It will interconnect to two of the TenneT TSO
B.V. platforms and the power will be transmitted via HVAC cables. TenneT TSO B.V. intends to utilize HVDC
cables for future offshore transmission systems provided cable manufacturers can successfully
demonstrate a 525 kV HVDC submarine cable with extruded insulation by April 2022. According to TenneT
TSO B.V.’s announcement in 2019: “At this moment in time a submarine cable system with such
specification is not available on the market, and TenneT wants to stimulate the development of such
submarine cable system.”105
Other examples of large European OSW projects utilizing HVAC cables is the 1,218 MW Hornsea 1, about
75 miles from shore with a COD later this year, and the 1,075 MW Seagreen, about 17 miles from shore
with a 2022/23 expected COD. The New Jersey BOEM leases held by Ocean Wind and Atlantic Shores are
102 TenneT is part of a consortium planning the North Sea Wind Power Hub to deliver electrical and/or hydrogen energy from large OSW projects expected to be developed sometime after 2030. The total OSW capacity could range from 70 GW to 150 GW by the year 2040 and more thereafter. https://northseawindpowerhub.eu/ 103 “The wind power areas Hollandse Kust (west) and Ten Noorden van de Waddeneilanden will benefit from TenneT’s standardised AC-concept with offshore electrical substations of 700 MW. These pool the electricity from the wind farms. 220-kV cables then transport the wind electricity to the coast. In the IJmuiden Ver offshore wind energy area, two direct current connections (comprising cables and converter stations) will be used; for the first time in the world with a 2,000 MW (2GW) capacity. The cables will have a 525 kV (525,000 V) voltage level.” https://www.tennet.eu/news/detail/tennet-connects-dutch-north-sea-wind-farms-using-the-worlds-highest-capacity-connections/ 104 The Borssele projects were scheduled to be commissioned in 2019 and 2020; Hollandse Kust (zuid) in 2021 and 2022; Hollandse Kust (noord) in 2023; Hollandse Kust (west) in 2024 and 2025; Noorden van de Waddeneilanden in 2026. Future TenneT TSO B.V. projects may utilize HVDC technology. 105 https://www.tennet.eu/our-grid/offshore-grid-netherlands/information-for-cable-suppliers-525-kv-hvdc-xlpe/

- 73 -
about 15 miles to the NJ shore at their closest locations, as is the Delaware lease held by Garden State
Offshore Energy. BOEM’s recommended primary and secondary areas in the proposed Hudson South
lease are about 25-35 miles away. Even with an allowance for avoiding sensitive fisheries and underwater
obstacles, radial export cable lengths for the NJ OSW projects should not incur losses much greater than
1.0 % with HVAC technology.
- 74 -
X. Long-Term Planning versus Flexibility
Highlights
New Jersey’s transmission reliability and market efficiency needs should be satisfied for the next fifteen years through RTEP. The SAA is an appropriate transmission planning mechanism to pursue New Jersey’s public policy goals.
PJM’s tariff permits New Jersey to pursue a coordinated transmission project as a State Public Policy Project through the SAA. New Jersey ratepayers will have to bear the full cost, including associated upgrades, unless other states agree to utilize and pay for the project.
Inexpensive headroom at coastal POIs will be depleted in early Board procurement rounds, leaving coordinated transmission developers with the same engineering and economic challenges that OSW applicants (with bundled generation and transmission) face.
Ocean grid claims of extrinsic benefits such as improving system resiliency, lowering O&M costs, reducing congestion, and lowering market energy prices have potential but may not be significant or achievable. Radial export cables would not provide extrinsic benefits. Power corridors may be able to provide some extrinsic benefits.
Long-Term Planning Considerations
Radial export cables are solely designed to deliver OSW energy to the PJM transmission grid and offer no
opportunities to address long-term system planning or other transmission issues of concern. Ocean grid
proponents claim they can address such planning issues and provide long-term transmission advantages.
Aaron Berner of PJM discussed this subject at the Transmission Stakeholder Meeting. He pointed out that
PJM’s interconnection queue process, in which its studies assume new projects are “layered” on top of
previous projects, “… doesn't give you a clear view of what you might get to in the end if all these [OSW]
projects don't go forward. We can define what the required reinforcements are for all these different
projects. However, if they don't all go forward, we have to back up and restudy them.”
PJM has milestone and other requirements for proposed generation and transmission projects that enter
the interconnection queue to minimize the chance they will not be constructed. However, these
requirements, along with the interconnection study costs, do not prevent projects from dropping out,
thus imposing interconnection risks (primarily the uncertain cost of system upgrades) on later projects.
As mentioned by Mr. Berner, this issue applies to all proposed PJM generators.
As noted, PJM has the RTEP process in place that identifies transmission needs fifteen years out through
an open stakeholder process that considers generation, transmission, and load response solutions. In
addition, PJM’s SAA gives New Jersey the ability to pursue an optimal, comprehensive solution to develop
a coordinated transmission solution to support Governor Murphy’s 7.5 GW OSW goal.106 States can pursue
State Public Policy Projects through the SAA. Unless other states agreed to utilize an offshore transmission
system and share the cost under some formulaic basis, New Jersey ratepayers would bear the entire cost.
106 Refer to Schedule 6, section 1.5.9 of the PJM Operating Agreement and Transmission Enhancement Charges, Schedule 12 of the Tariff.

- 75 -
The Board has discretion to allocate the cost of State Public Policy Projects and Supplemental Projects
across zones. Economic tradeoffs under the fixed (rate-based) versus variable (as-delivered) commercial
structure underlying coordinated transmission and radial export cables, respectively, environmental
considerations, and other factors in this Study should be weighed by the Board to address the changing
power market landscape for OSW Rounds 3 to 6.
Headroom at Points of Interconnection
Headroom, the amount of available or inexpensive injection capacity, at coastal POIs has emerged as a
key and contentious issue in many states pursuing OSW. Headroom was a key issue in the two
interconnection requests Anbaric filed with PJM for two 1,100 MW HVAC offshore transmission lines in
March 2018 and then for a 1,200 MW HVDC line in June 2018. Anbaric would have reserved POI headroom
if its requests proceeded successfully through PJM’s interconnection process. Its proposed lines would
originate from offshore open access transmission platforms that would connect expected OSW projects
to the PJM transmission grid. Although its requests made some progress through PJM’s interconnection
process, PJM ultimately determined Anbaric could not obtain interconnection rights to inject power and
discontinued the process.
On November 18, 2019, Anbaric filed a Complaint at FERC (Docket No. EL20-10-000) alleging (on page 1)
PJM denied Anbaric “…meaningful open access interconnection service...” In its Answer of December 19,
2019, PJM responded the Complaint suffered from “fundamental flaws” and recommended FERC deny
the Complaint. PJM pointed out that Anbaric did not propose any generation and would needlessly tie up
headroom at the POIs.107 PJM’s Independent Market Monitor agreed with PJM’s Answer.
The uncertainty of available headroom and the uncertain cost of transmission system upgrades triggered
by increasing OSW injections add to the complexity. Until an interconnection request gets through at least
the System Impact Study (second step), it is difficult to estimate accurately the transmission system
upgrade costs for a single injection quantity, much less for the combined OSW quantities. While OSW
developers retain transmission experts to prepare estimates, it is possible that selected OSW projects may
leave inexpensive headroom at a POI after their interconnection. OSW projects with radial export cables
may have less flexibility to fully utilize inexpensive headroom compared to a coordinated transmission
solution that can utilize the controllability of its HVDC assets.
As inexpensive headroom at coastal POIs is depleted, coordinated transmission project developers will
face the same engineering and economic challenges that OSW applicants (with bundled generation and
transmission) face in gauging the dynamics of the PJM transmission system. Under the Board’s two-part
transmission pricing structure applied in Round 1 and Round 2, the extent to which ratepayers are
benefited through the dedication of available headroom vis-à-vis a lower all-in bid offer price is unclear.
One way or another, as available headroom wanes at existing POIs, it is reasonable to suppose that
ratepayers will bear the cost of more expensive transmission improvements required to accommodate
large new OSW injections. Coal retirements in MAAC, coupled with PSEG’s announced fossil plant
107 PJM also argued that the proposed project would interfere with the interconnection queue process and that PJM’s OATT should not have “…a separate set of preferential interconnection rules for Anbaric’s specific business model.”
- 76 -
divestiture, adds uncertainty to any determination of transmission headroom to accommodate OSW
injections in Rounds 2-6. More nuanced is the financial calculus about the timing of such cost obligations,
risk apportionment, and the inherent rigidity of a fixed, rate-based ocean grid model that has the potential
to saddle ratepayers with iron-clad cost obligations before it is fully utilized. The accelerated iron-clad cost
obligations associated with a coordinated transmission solution is a key factor in New Jersey’s financial
commitment to realize the 7.5 GW OSW procurement goal. The Board should benefit from a robust SAA
process that encourages innovative and cost-effective proposals that seek to minimize transmission
upgrade costs.
Extrinsic Benefits
Ocean grid proponents have argued that relieving offshore transmission systems of market risk would
allow them to seek extrinsic benefits such as improving system resiliency, lowering O&M costs, reducing
congestion, shifting power deliveries, and lowering market energy prices.108 While these extrinsic benefits
appear worthwhile, they may not be achievable and it is difficult to assign a dollar value to them. Having
fewer cables and fewer HCC boreholes at landfall, however, is a tangible advantage compared to HVAC
radial export cables. OSW projects with bundled radial export cables do not have the design flexibility that
would allow them to provide extrinsic benefits. An HVDC power corridor design would also have the
environmental benefits of fewer cables and fewer HDD boreholes, plus a single ROW to New Jersey’s 500
kV backbone. At this initial juncture, we do not know if a power corridor can be designed to provide other
extrinsic benefits.
108 In addition to Anbaric, another ocean grid proponent, Atlantic Grid Development, made a number of arguments supporting extrinsic benefits before the Maryland PSC in Case 9431: https://webapp.psc.state.md.us/newIntranet/Casenum/NewIndex3_VOpenFile.cfm?filepath=//Coldfusion/Casenum/9400-9499/9431/Item_63\PSCCase9431-AtlanticGrid-MelnykDirectTestimony-PUBLIC2.15.17.pdf

- 77 -
XI. Business Structure, Financing, and Ratepayer Risk
Highlights
Competitive OSW solicitations provide a strong incentive for developers with radial export cables to minimize costs. With enough interest, competitive incentives for an SAA coordinated transmission solution would also be strong.
The merchant offshore transmission model is not viable. Costs for a regulated coordinated transmission solution would be recoverable from ratepayers, facilitating development despite first-of-its-kind risks. Rate Counsel has expressed concern over FERC return on equity incentives that would increase ratepayer costs.
Radial export cable costs would be recovered volumetrically based on energy deliveries, so developers bear construction and operating cost risks. Regulated coordinated transmission project costs would be recovered through fixed charges that cannot be avoided, thereby placing ratepayers at risk.
Developing a coordinated transmission solution through the SAA will require Board involvement to support financing and development with reasonable commercial and statutory safeguards to protect ratepayer interests.
Bundled OSW projects recover their costs over the 20-year OREC term. A coordinated transmission solution may have a longer cost recovery period. Intergenerational equity considerations may be resolved if generation operates beyond the 20-year OREC term.
The Competitive Renewable Energy Zone project in Texas and the Tehachapi Renewable Transmission Project in California facilitated land-based wind additions based on ratepayer financial support.
Offshore Transmission Business Structures
Radial export cables bundled with generation leaves OSW developers at risk, i.e., they are merchant
projects. An ocean grid or power corridor can have two possible business structures. First and most
practical, it can be a rate-based PJM asset for which project capital and operating costs are recovered
under a cost-of-service formula from ratepayers. Second, they can be a merchant asset in which the owner
designs, builds, and operates it at risk and recovers its costs through negotiated rates with OSW projects.
Given the significant cost and undertaking, a merchant business structure is not viable, as explained on
page 11 of Anbaric’s comments of December 1, 2019 sent to the Board, Scaling Renewable Energy.
“If ‘merchant’ is defined as a project that does not have a credit-worthy, long-term credit stream, it is unlikely that any developer today would undertake such a project. Contrary to expectations early in the electricity restructuring era, merchant transmission built entirely to capture energy or capacity market arbitrage between control areas, or between regions within control areas, has not emerged. This is largely because transmission is essentially infrastructure, and financing 50-100 year infrastructure

- 78 -
projects on the basis of uncertain market revenues such as Financial Transmission Rights has not proven viable.”109
JCPL filed comments to the Board supporting the rate-base model: “Electric utilities’ transmission
investments are recovered over the useful life of the transmission assets, which is considerably longer
than the lifecycle of windmills. Thus, electric utility ownership of transmission associated with offshore
wind not only lowers initial costs to ratepayers but also spreads the costs to all the beneficiaries over the
asset’s useful life. This helps to ensure achievement of intergenerational equity.” While amortizing costs
of a coordinated transmission project over a longer period would lower annual costs to ratepayers, it
raises the issue of “generational equity” if it remains in service (with ratepayers bearing the cost) after
the OSW generation projects retire.110 Generational equity is less of an issue for radial export cables
because bundling it with the OSW generation assets ensures both costs are spread over an equal period
of time. While OSW generation may well continue after the initial OREC purchase period, future
technology advances may render the transmission assets (regardless of design) sub-optimal.
If a rate-based coordinated transmission project was selected through the SAA process, it is unclear what
risks the developer would take in the permitting, design, construction, or operation. For example, an
approved onshore transmission asset must go through a rigorous design process and is then engineered
and constructed consistent with PJM’s and TO’s technical standards. As long as the project is built
consistent with the PJM tariff and is subject to open access, the transmission asset developer is permitted
to recover all of its costs, even for unexpected construction cost overruns, subject to any applicable cost
commitments. A coordinated transmission project selected through the SAA may be able to minimize the
chance of overruns, implement a risk-sharing mechanism, agree to protections against delays, and offer
cost caps as did the Silver Run Electric project. The Board should retain the requisite regulatory latitude
to define the array of commercial terms governing implementation of an SAA.
Pursuing an ocean grid or a power corridor through the SAA would enable TOs and independent
transmission developers to propose cost-effective designs with minimal environmental impacts. On page
10 of its comments, Scaling Renewable Energy, Anbaric argued that the Board could award ocean grid
development rights through a competitive bid process to “…qualified transmission developers. This would
enable the BPU to combine the desirable traits of the utility model with the desirable traits of the
competitive market practices.” A competitive bid process could provide such benefits as long as there are
enough qualified bidders.
109 We have not found any evidence supporting a 50-100 year life for offshore transmission assets but note they would face severe weather and corrosion conditions as well as possible damage from anchors, etc. In its response to the Board’s questions, Anbaric has backed away from this claim: “Offshore transmission equipment has a similar design life as onshore gear of 40 - 50 years as a general figure with a variety of defined replacements such as controls at 15 years, transformers likely at 35 years.” 110 The IRS Class Life for transmission assets is 30 years. PJM depreciates the capital costs of transmission assets over their estimated useful lives that vary depending on the methodology used, the type of asset, etc. The average estimated useful lives for transmission assets owned by New Jersey TOs is 35-46 years.
- 79 -
Onshore Transmission Examples
There are at least two examples of rate-based transmission projects designed to facilitate renewable
resource development. Both were developed cost-effectively. The CREZ transmission lines in Texas were
expressly designed by Texas policymakers and the ERCOT independent system operator. This transmission
infrastructure was apportioned through a competitive process to qualified market entrants who were
willing and able to bid on building the projects on acceptable terms.
If a rate-based ocean grid is constructed, we assume ratepayers will have to pay for those assets regardless
of rate of use and timing. This is analogous to an onshore transmission asset that is developed through
PJM’s RTEP process. Assuming the project is approved via the PJM stakeholder process, is designed
consistent with PJM’s engineering criteria, and is properly constructed, those costs are recoverable from
ratepayers under some FERC-approved allocation formula. For example, Anbaric explained on page 9 of
its February 18, 2020 comments filed with the MADOER that the TRTP was built with “a transmission cost
allocation system designed by the CAISO and approved by FERC. California took serious steps to spread
costs of transmission.” The TRTP costs were rate-based “through the CAISO Tariff’s Transmission Access
Charge (TAC)…to recover the Transmission Revenue Requirements” which meant that the cost and risk
“was initially borne by all CAISO customers who pay the TAC.” Costs for unused CREZ capacity were also
to be paid by ratepayers (in Texas) until the wind projects were completed.
If New Jersey pursues a competitive transmission project through PJM’s SAA, New Jersey ratepayers
would be financially obligated irrespective of use. The Board could allocate transmission costs based on
estimated energy savings, estimated air emission benefits, or other metrics at its discretion.
A regulated coordinated transmission project may impose a greater cost risk on ratepayers compared to
a merchant structure. Once a regulated project is completed and the asset qualifies for rate-based
treatment, ratepayers must pay for any capacity whether needed or not. As previously described, OSW
development in the US is risky, which increases the chance of underutilized capacity or its cost becoming
stranded. While an ocean grid can be built in stages to minimize ratepayer exposure, any sequential
construction process would be more expensive than a single coordinated construction effort. A power
corridor would not be built in stages, although the converters, which are very expensive, could be delayed
until needed by the OSW projects as part of their construction scopes.
Financing
OSW developers finance their projects (generation bundled with radial export cables) based on a
combination of factors, i.e., their experience and expertise, their credit-worthiness, the willingness of
equity and debt investors to fund projects, and, critically, the long-term obligation of credit-worthy
purchasers under contracts or commission orders. OSW developers generally claim to have “perfected”
their financing arrangements to lower their overall cost of capital. Competitive OSW solicitations,
combined with the high capital costs for OSW projects, provide a strong incentive for OSW developers to
minimize their cost of capital.
Regulated coordinated transmission projects that receive cost-of-service treatment should also be able to
achieve a low cost of capital based on assured cost recovery through the PJM tariff. However, there are
financing issues that could raise the cost of capital. First, no domestic ocean grid or power corridor has

- 80 -
been built or financed and we are not aware of any European versions that have been completed.
Moreover, all of the European offshore network grids that have been completed were financed on-
balance sheet by the parent TSOs that have strong implicit or explicit federal government support. Second,
first-of-a-kind projects, particularly expensive ones using advanced technologies in challenging
environments, often have problems that are only identified after construction or operation commences.
Domestic lenders would take this risk into account. Third, the coordinated transmission grid owner will
almost certainly be a single-asset entity that will be assured of cost recovery through PJM’s transmission
tariff but may have limited financial strength to weather unexpected short-term problems. In contrast,
European offshore network grids are designed, built, and operated by the incumbent TSO that are large
and financially strong.111 Notwithstanding these challenges, the Board’s willingness to implement a
coordinated transmission solution will likely require procedural and statutory safeguards to assure SAA
success and to assure the transmission developers of timely payments from ratepayers via the EDCs. Such
commitments might emulate the Texas CREZ model that deemed transmission infrastructure used and
useful regardless of utilization. Other commercial safeguards may be required as well to protect
ratepayers against unreasonable cost recovery or delay provisions.
Regulated transmission investments are entitled to FERC-approved equity adders and other financial
benefits to promote its transmission objectives of “benefiting consumers by ensuring reliability and
reducing the cost of delivered power by reducing transmission congestion” as established in Order 679
(Docket No. RM06-4-000).112 The equity adders could boost an ocean grid’s return on equity (ROE) by as
much as 250 basis-points (2.5%), which would raise ratepayer costs.113 Given the unique nature of an
ocean grid investment, it is likely that FERC would grant ROE adders to an ocean grid project.114
Rate Counsel highlighted this issue on page 7 in the Comments of December 3, 2019 submitted to the
Transmission Stakeholder Meeting: “…the Board and Rate Counsel have jointly challenged incentives for
specific projects arguing returns earned by utilities are sufficient and additional incentives are excessive
and unnecessary.” Rate Counsel also noted on page 8 “Incentive strategies should be limited to provide
an ROE sufficient to attract capital and only provide further incentives to projects that are truly merited,
on a case-by-case basis.”
FERC issued a Notice of Inquiry on ROE incentives March 21, 2019. The Board and Rate Counsel (NJ
Agencies) filed Comments on June 26 in Docket PL19-3-000 recommending FERC “…should revise its
111 TenneT Holding B.V., for example, had assets of €23.0 billion as of year-end 2019, revenues of €4.4 billion, and profits of €630 million. It is about two-thirds the size and profitability of PSE&G, one of the largest electric utilities in the US. According to its 2019 Annual Report, TenneT Holding B.V.is rated A3 by S&P and A- by Moody’s, slightly above PSE&G. 112 Order 679 also permitted transmission investors to assign up to 100% of construction work in progress (CWIP) to rate base and begin recovering those costs from ratepayers prior to project operation. 113 Order 679 allows up to 100 basis-points for risks and complexity, 50 basis-points for utilizing new technology, 50 basis-points for turning over operation to the local RTO (or similar organization), and 50 basis-points for independent (non-utility) ownership. These equity adders would increase ratepayer costs. 114 TRTP, described earlier, is a good example of these equity adders. According to the filed comments of Rate Counsel, TRTP received a 125 basis-point adder (presumably for risk and technology), an additional 50 basis-points for CAISO participation, 100% recovery of CWIP, and 100% recovery of prudently incurred costs if the project was cancelled.

- 81 -
incentive policies to relieve ratepayers from further excessive transmission costs…” because the
underinvestment concerns Congress faced in 2006 no longer exist, PJM grid conditions have improved
since then, and transmission investment is not driven by and does not require such incentives.
FERC is pursuing this matter and issued a Notice of Proposed Rulemaking (NOPR), Docket RM20-10-000,
on March 20, 2020 that would alter their determination of equity adders. The total potential ROE incentive
would remain 250 basis-points, but FERC’s focus would shift from risks and challenges to consumer
benefits. The NOPR proposes to increase the ROE incentive for joining an RTO from 50 basis-points to 100
basis-points, a 50-basis-point incentive for projects in the top 25% of pre-construction benefit-to-cost
ratios, 50 basis-points for projects in the top 10% of post-construction benefit-to-cost ratios, 100-basis-
points for technologies that enhance reliability, efficiency and capacity and 50 basis-points for projects
that demonstrate reliability benefits.
There was a 90-day NOPR comment period through mid-June. The New Jersey Office of Attorney General
is participating in this NOPR and the NJ Agencies filed Comments on July 1, 2020 asserting (on page 4)
“…several fatal flaws in the NOPR. First, the NOPR is frequently inconsistent with Section 219 [of the
Federal Power Act]. Further, the NOPR departs from prior policy without adequate justification. Finally,
the NOPR fails to achieve its stated goals. On these grounds, the Commission cannot adopt this NOPR as
a final rule.”
Cost Recovery and Ratepayer Risk
The recovery of capital costs via fixed or variable ratepayer charges is an important consideration. In the
case of a rate-based coordinated transmission project, capital costs would be recovered through fixed
charges under the PJM OATT that amortize those costs over a defined period of time. Once the project
became operational, those fixed charges would be paid regardless of actual use; ratepayers will be “on
the hook” whether or not the project delivers OSW energy.115 Ocean grids magnify this risk if the entire
project were built at once, since ratepayers would pay for ocean grid sections that would not be utilized
right away and perhaps not for many years. Any portion of an ocean grid that is underutilized, e.g., an
OSW project is smaller than the ocean grid design capacity, would require ratepayers to pay for that
underutilized transmission capacity. Under the ocean grid paradigm, ratepayers are in effect pre-paying
for the optionality associated with future OSW generation tranches that meet the Board’s 7.5 GW
procurement objective. An ocean grid could minimize this problem by building in stages, but that would
significantly raise the construction cost. We have not explored the environmental consequences
associated with building an ocean grid in stages.
Power corridors can reduce the risk of unutilized or underutilized transmission capacity by being designed
for fewer OSW projects that would be commercialized in the medium-term. In the case of radial export
cables, the combined generation and transmission costs would be recovered from ratepayers through
115 In the case of a merchant transmission project, the capital costs would be recovered through charges paid by OSW generators so the transmission owner would be at risk for capital cost recovery. OSW generator payments could be in the form of fixed reservation charges and/or volumetric charges based on deliveries. The OSW generator would include those charges in the offer bid price so ratepayers would ultimately pay for those transmission costs.

- 82 -
volumetric OREC payments. Hence, ratepayers only pay for the radial export cable when OSW energy is
actually delivered and the cost recovery risk rests entirely with the OSW project.

- 83 -
XII. State Benefits and Procurement Process
Highlights
Diverse economic benefits will be ascribable to OSW development in New Jersey irrespective of the transmission option. These benefits are robust and likely sustainable over the long term.
A coordinated transmission solution would be complex and expensive. Specialized high-value equipment and specialized construction and O&M labor would likely be sourced from outside New Jersey. The remaining in-State benefits may not differ significantly among the transmission options.
Current standard OSW procurement practices in PJM, NYISO, and ISO-NE bundle generation and transmission. If the Board pursued an independent (unbundled) transmission solution outside of the SAA, the procurement process would be complicated and lengthy with many uncertainties and logistical challenges.
If the Board pursued a coordinated transmission project through the SAA, competing State Public Policy projects could be selected based on price, environmental, and other criteria defined by New Jersey. Many SAA details have not yet been established.
State Benefits
States that procure OSW energy expect to realize diverse benefits during project development,
construction, and long-term operation. Such benefits include reduced carbon and other power plant air
emissions, reduced wholesale market energy and, perhaps, capacity prices, port development and
utilization, and increased in-state employment. Reduced air emissions from conventional power plants
and wholesale market energy prices in New Jersey from OSW would be unaffected by the transmission
choice.116 For other benefits, the differences between radial export cables and coordinated transmission
solutions grids are minor after out-of-State spending is accounted for.
In-state employment during construction would be higher for a coordinated transmission solution
because HVDC technology is more complicated and expensive. However, much of the additional capital
cost is for specialized and expensive power equipment, e.g., HVDC/HVAC converters, manufactured
overseas. One of the two principal converter station suppliers, Hitachi ABB, manufactures almost all of
the important components, including transformers, semiconductors, reactors, and switchgear, and
assembles those converter components in Sweden and Switzerland. The other principal supplier, Siemens,
manufactures most of its HVDC / HVAC equipment and assembles its converters in Germany.
A coordinated transmission solution will also require more labor than radial export cables due to its
complexity, particularly civil and electrical engineering and construction labor. While most engineering
and construction labor can be sourced in-state, specialized labor for the HVDC equipment will likely be
provided by the manufacturer or from a specialty company likely sourced out-of-state. During operations,
O&M labor requirements would not differ significantly between the HVAC and HVDC transmission
116 A multistate New York / New Jersey coordinated transmission solution could affect the distribution of air emission and energy price benefits if OSW energy were shifted from one state to another.
- 84 -
options. The specific electrical components on converter platforms would typically require limited annual
maintenance by the vendor’s approved companies that may not have locations in New Jersey. Other
regular site-specific preventative maintenance activities on the converter platforms, such as for safety,
fire systems, and auxiliary support equipment, would typically involve local crews as these inspections
and maintenance activities are much more frequent.
HVAC collector platforms required for OSW projects are smaller in size and weight than HVDC converter
platforms. They utilize construction practices and domestically-source materials so may be able to utilize
in-state resources, perhaps through partnerships with qualified New Jersey companies. The only
exceptions would be for any specialty power system equipment that may be sourced overseas. For HVDC
converter platform construction, this type of assembly generally takes place overseas in large shipyards
that are equipped specifically for this type of large-scale construction. The finished converter platforms
are then shipped directly to the site, resulting in less use of the domestic workforce.
Procurement Process
OSW procurements with bundled radial export cables are relatively straightforward and have been widely
utilized in Maryland, New Jersey, New York and New England. To test procuring generation and
transmission separately, Massachusetts designed its first OSW solicitation under Section 83C of the Green
Communities Act to include hybrid transmission options. This option, referred to as “expandable
transmission,” sought to share transmission cable capacity and thus minimize the need for marine and
shoreline disturbances. The expandable transmission option proved difficult to evaluate, was not selected
in the first solicitation, and was effectively dropped from the second solicitation.117 According to page 3
of MADOER Commissioner Patrick Woodcock’s letter to the Joint Committee on Telecommunication,
Utilities and Energy of July 28, 2020:
“A separate solicitation for 1,600 MW transmission capacity is too limiting to yield an offshore transmission grid that could be used as a platform for future offshore wind development for Massachusetts or the region. Additionally, undertaking a separate transmission solicitation would likely introduce certain risks such as: delaying upcoming offshore wind generation procurements; coordination issues between separate transmission and generation projects; and contracting and permitting hurdles that may increase costs and delay the successful development of future selected offshore wind projects.”
No other New England states have conducted an independent offshore transmission procurement.
NYSERDA considered a transmission-only procurement but expressed coordination concerns to Board
Staff at its Transmission Stakeholder Meeting of August 3, 2020 (as described on page 15 of this Study).
If the Board decided to pursue an independent offshore transmission solution outside of the SAA, the
procurement process would be more complicated and lengthier than for OSW projects with bundled radial
export cables. A sequential solicitation or parallel solicitation would be needed to support a planned
117 Massachusetts selected the 800 MW Vineyard Wind project without expandable transmission. Expandable transmission was considered by the EDCs and MADOER, but they did not support selecting this option.
- 85 -
transmission infrastructure aligned with New Jersey’s 7.5 GW procurement goal.118 Competing
transmission designs could be selected on the basis of cost, delivery capacity, environmental impacts, and
ratepayer protections.
In its comments filed with the MADOER on February 8, 2020, Anbaric suggested a sequential procurement
process with an OSW transmission procurement followed by an OSW generation procurement.
“A separate OSW transmission solicitation will increase competition between wind developers. With a route to shore provided by a third party, an entity not affiliated with any wind generator, competition on price, supply, and other wind-specific factors will determine the outcome of competitive procurements. In this world, with transmission understood as separately owned infrastructure, OSW developers bidding to a common location will no longer be advantaged or disadvantaged by factors such as distance to shore, interconnection position, or use of limited shore approaches.”
It would be preferable to procure an independent transmission solution before OSW projects are selected
because offshore transmission developers already know the locations of existing BOEM lease sites close
to New Jersey. However, it is not clear if the winning transmission proposal should be built to serve all
those sites or just the sites most likely to have winning OSW projects. It would be difficult to size the
converters and cables without knowing the OSW project specifications yet to be determined. Oversizing
the converters and/or cables for optionality sake might impose deadweight costs on ratepayers. Once an
independent transmission project is approved, it may effectively determine the location and size of future
OSW projects. Similarly, the location of proposed transmission converter stations may favor some OSW
lease areas but penalize others. How best to ensure a level playing field for OSW developers competing
for market share in Rounds 3-6 alongside an independent transmission solution will involve professional
judgment and may be best achieved through the SAA procurement process.
It is also not clear if the transmission project should be built at once or if it would be better to construct
it piecemeal as required. If the entire project is built, a good portion of it will not be utilized for many
years and possibly never, requiring ratepayers to pay for under-utilized or stranded assets. A completed
offshore transmission project may not be well-located for succeeding lease areas, e.g., Hudson South, not
yet approved or auctioned. On the other hand, building an ocean grid piecemeal will greatly increase the
cost as procurement and construction economies of scale dissipate. Piecemeal construction would also
increase the environmental impacts as construction must be stretched over time.
Some partial solutions have been proposed, such as selecting an offshore transmission design and later
allowing collector stations (where the OSW projects tie into the ocean grid) to be positioned to best serve
future winning OSW projects. Such flexibility, however, injects additional cost uncertainty as any changes
would necessarily affect the actual transmission system costs. Without such flexibility, OSW developers
would have to design their cable system around the converter station locations regardless of any cost
penalties for their own projects. As previously discussed, power corridors could minimize, but could not
completely avoid these difficulties by being designed for a smaller number of OSW projects expected in
118 See Public Utilities Fortnightly, Seth Parker and Alex Mattfolk, October 2019, Offshore Wind: Export Cables or Backbone Transmission? https://www.fortnightly.com/fortnightly/2019/10/offshore-wind-%E2%80%93-export-cables-or-backbone-transmission
- 86 -
the medium-term. It may be impossible to select an optimal location of the offshore terminus that
accommodates all potential OSW bidders and equalizes the cable distances for each OSW project.
State Agreement Approach
Alternatively, the Board could pursue a coordinated transmission solution as an SAA State Public Policy
Project as defined under Section 6 of the PJM Operating Agreement.119 As mentioned earlier, any single
state or group of states can identify a transmission need that would be addressed through the RTEP
process provided the state(s) agree to pay its cost. Unless other states agreed to participate, New Jersey
ratepayers would have to bear the entire coordinated transmission solution cost. Once it becomes
operational, we do not know if New Jersey can charge OSW projects for utilizing it. That would shift the
cost burden from a fixed non-bypassable pure transmission charge to a volumetric charge, bundled with
other OSW costs, based on OSW energy deliveries. In either case, ratepayers would pay for the ocean grid,
but OSW developers may view utilization charges as a financial risk and charge a premium when bundling
those transmission charges with its own costs.
PJM has never had a transmission project go through the SAA process. From a regulatory standpoint, New
Jersey would be trailblazing. PJM’s SAA provisions describe the need identification in the RTEP context,
the process to post and review short-listed proposals, and a general instruction to select the most efficient
or cost-effective projects, but there are many SAA details yet to be worked out. The SAA process will be
lengthy and require a high level of commitment from Board Staff to ensure the process provides the
optimal combination of low cost, low risk, minimal environmental impacts, and maximum prospects to
achieve New Jersey’s OSW goal.120 An effective long-range transmission solution will need to incorporate
sensible tradeoffs among cost, reliability, ratepayer risk, and environmental objectives.
Common Concerns
Whether the Board pursues an offshore transmission project directly or through the SAA, accurate price
signals are critical to efficient wholesale markets to ensure scarce resources are allocated to the highest
and best use. This axiomatic tenet should apply to the selection of cost-effective POIs by OSW or
transmission developers, but its implementation is complicated since economic efficiency is not easily
reconciled to equally important environmental and risk minimization objectives. Reasonably accessible
POIs with adequate headroom are always preferred, but an independent (via a Board procurement) or
coordinated transmission solution (via the SAA) would obscure those POI costs and lead to a less efficient
selection of POIs. OSW bids with bunded transmission incorporate all of the transmission costs to support
informed Board decisions: offshore cables, landfall structures, onshore cables, attachment facilities at the
POI, and system upgrades. Unbundled OSW bids would ignore transmission costs and other transmission
considerations.
We note that onshore generation developers select locations based on interconnection factors virtually
identical to OSW developers: distance to a suitable POI, queue position, route permitability, and cost
components. Interconnection is a key cost component of any generation project and cannot easily be
119 The Board is not contemplating developing a coordinated transmission project as a Supplemental Project. 120 Further SAA evaluation is beyond the scope of this Study.

- 87 -
disaggregated from the other project costs. OSW projects could be viewed in a similar fashion. Once an
OSW developer begins development activities in earnest, it would be difficult to negotiate a changeover
from a radial export cable design to an independent or coordinated transmission solution.
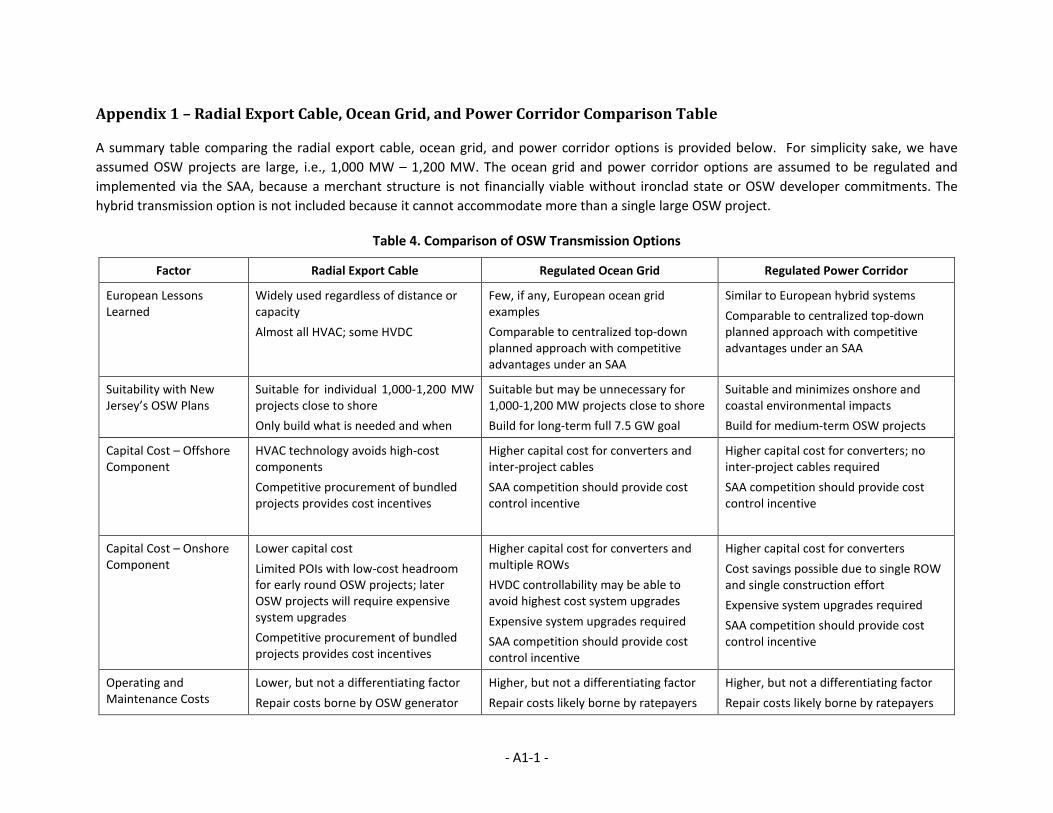
- A1-1 -
Appendix 1 – Radial Export Cable, Ocean Grid, and Power Corridor Comparison Table
A summary table comparing the radial export cable, ocean grid, and power corridor options is provided below. For simplicity sake, we have
assumed OSW projects are large, i.e., 1,000 MW – 1,200 MW. The ocean grid and power corridor options are assumed to be regulated and
implemented via the SAA, because a merchant structure is not financially viable without ironclad state or OSW developer commitments. The
hybrid transmission option is not included because it cannot accommodate more than a single large OSW project.
Table 4. Comparison of OSW Transmission Options
Factor Radial Export Cable Regulated Ocean Grid Regulated Power Corridor
European Lessons Learned
Widely used regardless of distance or capacity
Almost all HVAC; some HVDC
Few, if any, European ocean grid examples
Comparable to centralized top-down planned approach with competitive advantages under an SAA
Similar to European hybrid systems
Comparable to centralized top-down planned approach with competitive advantages under an SAA
Suitability with New Jersey’s OSW Plans
Suitable for individual 1,000-1,200 MW projects close to shore
Only build what is needed and when
Suitable but may be unnecessary for 1,000-1,200 MW projects close to shore
Build for long-term full 7.5 GW goal
Suitable and minimizes onshore and coastal environmental impacts
Build for medium-term OSW projects
Capital Cost – Offshore Component
HVAC technology avoids high-cost components
Competitive procurement of bundled projects provides cost incentives
Higher capital cost for converters and inter-project cables
SAA competition should provide cost control incentive
Higher capital cost for converters; no inter-project cables required
SAA competition should provide cost control incentive
Capital Cost – Onshore Component
Lower capital cost
Limited POIs with low-cost headroom for early round OSW projects; later OSW projects will require expensive system upgrades
Competitive procurement of bundled projects provides cost incentives
Higher capital cost for converters and multiple ROWs
HVDC controllability may be able to avoid highest cost system upgrades
Expensive system upgrades required
SAA competition should provide cost control incentive
Higher capital cost for converters
Cost savings possible due to single ROW and single construction effort
Expensive system upgrades required
SAA competition should provide cost control incentive
Operating and Maintenance Costs
Lower, but not a differentiating factor
Repair costs borne by OSW generator
Higher, but not a differentiating factor
Repair costs likely borne by ratepayers
Higher, but not a differentiating factor
Repair costs likely borne by ratepayers
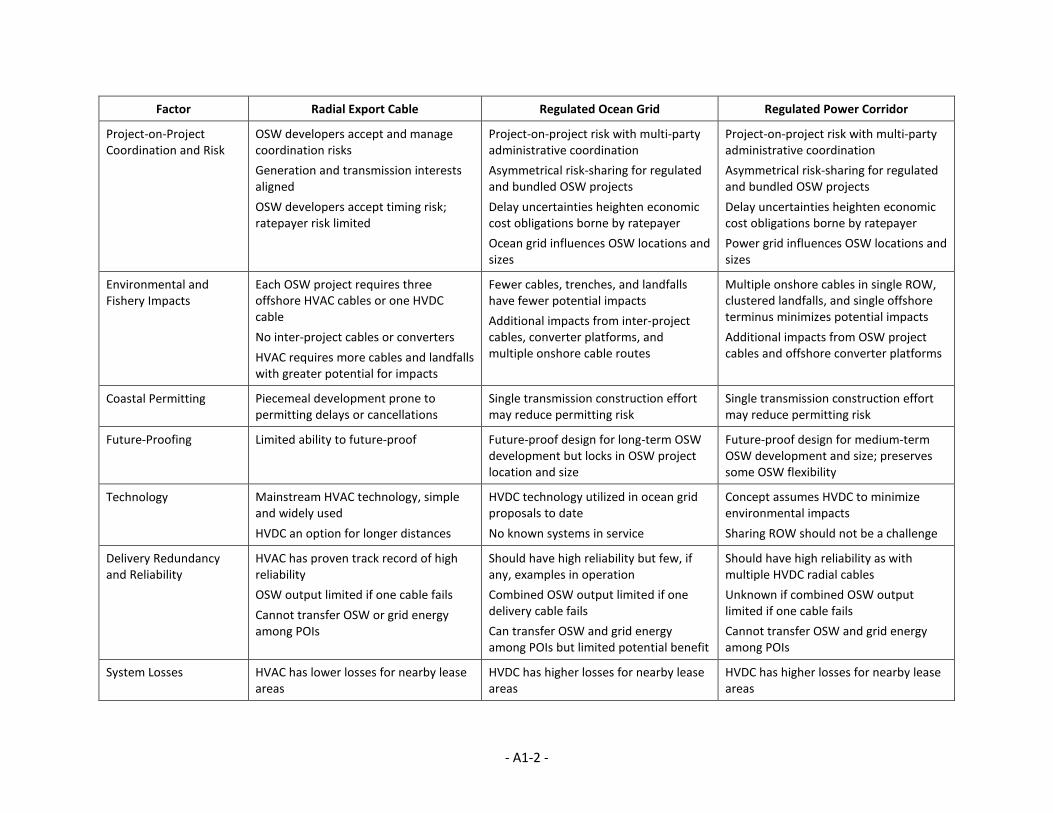
- A1-2 -
Factor Radial Export Cable Regulated Ocean Grid Regulated Power Corridor
Project-on-Project Coordination and Risk
OSW developers accept and manage coordination risks
Generation and transmission interests aligned
OSW developers accept timing risk; ratepayer risk limited
Project-on-project risk with multi-party administrative coordination
Asymmetrical risk-sharing for regulated and bundled OSW projects
Delay uncertainties heighten economic cost obligations borne by ratepayer
Ocean grid influences OSW locations and sizes
Project-on-project risk with multi-party administrative coordination
Asymmetrical risk-sharing for regulated and bundled OSW projects
Delay uncertainties heighten economic cost obligations borne by ratepayer
Power grid influences OSW locations and sizes
Environmental and Fishery Impacts
Each OSW project requires three offshore HVAC cables or one HVDC cable
No inter-project cables or converters
HVAC requires more cables and landfalls with greater potential for impacts
Fewer cables, trenches, and landfalls have fewer potential impacts
Additional impacts from inter-project cables, converter platforms, and multiple onshore cable routes
Multiple onshore cables in single ROW, clustered landfalls, and single offshore terminus minimizes potential impacts
Additional impacts from OSW project cables and offshore converter platforms
Coastal Permitting Piecemeal development prone to permitting delays or cancellations
Single transmission construction effort may reduce permitting risk
Single transmission construction effort may reduce permitting risk
Future-Proofing Limited ability to future-proof Future-proof design for long-term OSW development but locks in OSW project location and size
Future-proof design for medium-term OSW development and size; preserves some OSW flexibility
Technology Mainstream HVAC technology, simple and widely used
HVDC an option for longer distances
HVDC technology utilized in ocean grid proposals to date
No known systems in service
Concept assumes HVDC to minimize environmental impacts
Sharing ROW should not be a challenge
Delivery Redundancy and Reliability
HVAC has proven track record of high reliability
OSW output limited if one cable fails
Cannot transfer OSW or grid energy among POIs
Should have high reliability but few, if any, examples in operation
Combined OSW output limited if one delivery cable fails
Can transfer OSW and grid energy among POIs but limited potential benefit
Should have high reliability as with multiple HVDC radial cables
Unknown if combined OSW output limited if one cable fails
Cannot transfer OSW and grid energy among POIs
System Losses HVAC has lower losses for nearby lease areas
HVDC has higher losses for nearby lease areas
HVDC has higher losses for nearby lease areas
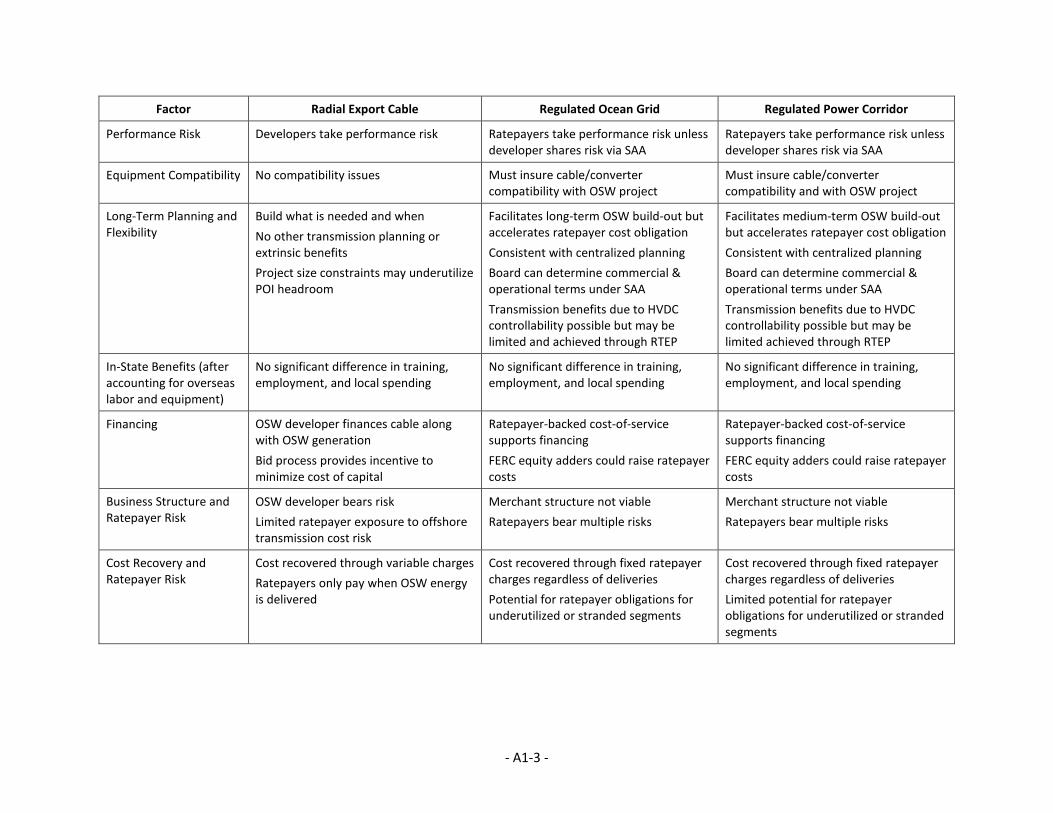
- A1-3 -
Factor Radial Export Cable Regulated Ocean Grid Regulated Power Corridor
Performance Risk Developers take performance risk Ratepayers take performance risk unless developer shares risk via SAA
Ratepayers take performance risk unless developer shares risk via SAA
Equipment Compatibility No compatibility issues Must insure cable/converter compatibility with OSW project
Must insure cable/converter compatibility and with OSW project
Long-Term Planning and Flexibility
Build what is needed and when
No other transmission planning or extrinsic benefits
Project size constraints may underutilize POI headroom
Facilitates long-term OSW build-out but accelerates ratepayer cost obligation
Consistent with centralized planning
Board can determine commercial & operational terms under SAA
Transmission benefits due to HVDC controllability possible but may be limited and achieved through RTEP
Facilitates medium-term OSW build-out but accelerates ratepayer cost obligation
Consistent with centralized planning
Board can determine commercial & operational terms under SAA
Transmission benefits due to HVDC controllability possible but may be limited achieved through RTEP
In-State Benefits (after accounting for overseas labor and equipment)
No significant difference in training, employment, and local spending
No significant difference in training, employment, and local spending
No significant difference in training, employment, and local spending
Financing OSW developer finances cable along with OSW generation
Bid process provides incentive to minimize cost of capital
Ratepayer-backed cost-of-service supports financing
FERC equity adders could raise ratepayer costs
Ratepayer-backed cost-of-service supports financing
FERC equity adders could raise ratepayer costs
Business Structure and Ratepayer Risk
OSW developer bears risk
Limited ratepayer exposure to offshore transmission cost risk
Merchant structure not viable
Ratepayers bear multiple risks
Merchant structure not viable
Ratepayers bear multiple risks
Cost Recovery and Ratepayer Risk
Cost recovered through variable charges
Ratepayers only pay when OSW energy is delivered
Cost recovered through fixed ratepayer charges regardless of deliveries
Potential for ratepayer obligations for underutilized or stranded segments
Cost recovered through fixed ratepayer charges regardless of deliveries
Limited potential for ratepayer obligations for underutilized or stranded segments

- A1-4 -
Factor Radial Export Cable Regulated Ocean Grid Regulated Power Corridor
Procurement Process One-step procurement process for bundled OSW generation and transmission
Procurement based on net price, environmental impacts, economic benefits, and other factors defined by Board
State procurement long and complicated with potential recursive effects
PJM administrative & technical support in competitive SAA procurement
Difficult to neutralize OSW favoritism once offshore interconnection locations defined
State procurement long and complicated with potential recursive effects
PJM administrative & technical support in competitive SAA procurement
Difficult to neutralize OSW favoritism once offshore interconnection locations defined
Timing Shorter multiple procurements & EPC processes
Uncertain permitting improvement under Biden Administration
PJM Interconnection process established and in practice
Lengthy SAA procurement & EPC process
Uncertain permitting improvement under Biden Administration
Delays possible with untested SAA process
Lengthy SAA procurement & more manageable EPC process
Uncertain permitting improvement under Biden Administration
Delays possible with untested SAA process
Transmission Price Signals
Competitive bundled procurements incentivize OSW developers to select cost-effective POIs
Ocean grid incurs transmission costs to facilitate long-term OSW development
OSW developers insulated from onshore & offshore transmission costs
Power corridor incurs transmission costs to facilitate medium-term OSW development
OSW developers insulated from many onshore & offshore transmission costs