ohio’s state tests · 2018-01-02 · then, choose or write the answer you think is best in your...
TRANSCRIPT

Ohio’s State Tests
PRACTICE TESTLARGE PRINT
BIOLOGY
Student Name

The Ohio Department of Education does not discriminate on the basis of race, color, national origin, sex, religion, age,
or disability in employment or the provision of services.
Copyright © 2017 by the Ohio Department of Education. All rights reserved.

1
Directions:
Today you will be taking the Ohio Biology PracticeAssessment.
There are several important things to remember:
1. Read each question carefully. Think about what isbeing asked. Look carefully at graphs or diagramsbecause they will help you understand the question.Then, choose or write the answer you think is best inyour Answer Document.
2. Use only a #2 pencil to answer questions on this test.
3. For questions with bubbled responses, choose thecorrect answer and then fill in the circle with theappropriate letter in your Answer Document. Make sure the number of the question in this Student TestBooklet matches the number in your AnswerDocument. If you change your answer, make sureyou erase your old answer completely. Do not crossout or make any marks on the other choices.
4. For questions with response boxes, write your answerneatly, clearly and only in the space provided in yourAnswer Document. Any responses written in yourStudent Test Booklet will not be scored. Make sure thenumber of the question in this Student Test Bookletmatches the number in your Answer Document.

2
5. If you do not know the answer to a question, skip itand go on to the next question. If you have time, goback to the questions you skipped and try to answerthem before turning in your Student Test Booklet andAnswer Document.
6. Check over your work when you are finished.

3
This page is intentionally blank
Biology—Part 1
4 Go to the next page
2. Scientists are studying the protein in the Na+-K+ pumpfound in nerve and muscle cells from a pig. They areinterested in learning how DNA and proteins from twodifferent types of cells from the same organismcompare to one another.
Describe the results scientists should see if they testboth cells for the presence of the gene that producesthis protein in the Na+-K+ pump.
Describe how protein synthesis is required to express the gene that produces this protein in the Na+-K+ pump.
Write your answer in the Answer Document.
15433
1.
15431
This item cannot be rendered as a paper/pencil item.

STOP
Biology—Part 1
5
3.
15430
This item cannot be rendered as a paper/pencil item.
4. Scientists study the evolutionary relationships ofspecies to better understand the history of life on Earth.
Describe two methods that scientists can use todetermine whether two species (modern or extinct)are closely related.
Write your answer in the Answer Document.
15432
5.
15429
This item cannot be rendered as a paper/pencil item.

Do not go on
6

Do not go on
7
Biology—Part 2
8 Go to the next page
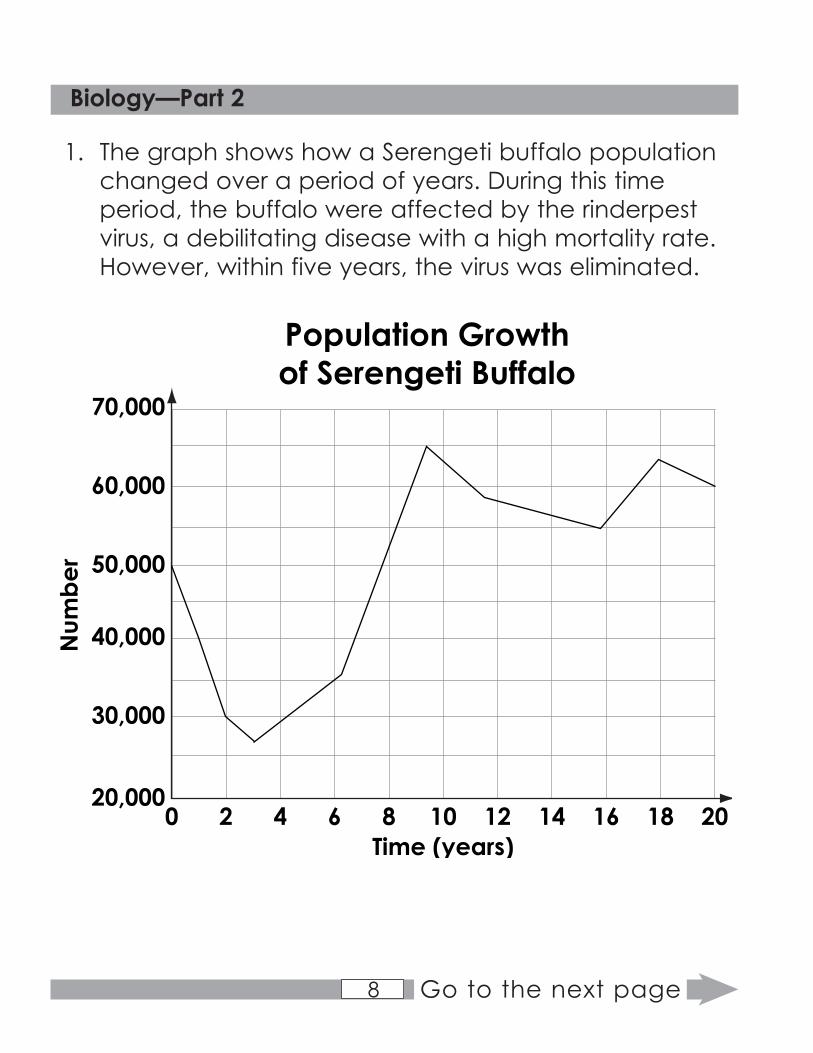
1. The graph shows how a Serengeti buffalo populationchanged over a period of years. During this timeperiod, the buffalo were affected by the rinderpestvirus, a debilitating disease with a high mortality rate.However, within five years, the virus was eliminated.
Population Growthof Serengeti Buffalo
70,000
60,000
50,000
40,000
30,000
20,0000 2 4 6 8 10 12 1614 2018
Time (years)
Num
ber

Biology—Part 2
9 Go to the next page
2.
15442
This item cannot be rendered as a paper/pencil item.
3.
15434
This item cannot be rendered as a paper/pencil item.
What was the ecosystem’s carrying capacity forbuffalo, based on the graph, once rinderpest waseliminated?
A. 35,000 buffalo
B. 55,000 buffalo
C. 60,000 buffalo
D. 65,000 buffalo
15436

Biology—Part 2
10 Go to the next page
4. A scientist isolates a number of non-photosyntheticprokaryotes.
Which structure would be found in these cells?
A. cell walls
B. chloroplast
C. golgi
D. nucleus
15445

Biology—Part 2
11 Go to the next page
5.
15437
This item cannot be rendered as a paper/pencil item.

Biology—Part 2
12 Go to the next page
6. The following question has two parts. In the AnswerDocument, first, answer Part A. Then, answer Part B.
Part A
Students in a biology class conduct an experiment todetermine the effect of temperature on the rate ofphotosynthesis in a plant. They place an Elodea plantinto a test tube filled with water. Then, the studentsplace the test tube under a light and slowly increasethe temperature of the water. They record their results and display them on a graph as shown.

Biology—Part 2
13 Go to the next page
See the following pages.
Photosynthesis vs. TemperatureExperiment
0 25
L
K
M
N
Temperature (°C)
Rate
of P
hoto
synt
hesis

Biology—Part 2
14 Go to the next page
6. (continued)
Which statement is supported by the data in the graph?
A. The rate of oxygen production is lowest in section M.
B. The rate of oxygen production is greatest in section M.
C. The production of water molecules is greatest insection L.
D. The number of carbon dioxide molecules in thebeaker is greatest in section K.

Biology—Part 2
15 Go to the next page
Part B
Which statement explains the effect of temperatureon the rate of photosynthesis?
A. Oxygen molecules break down at temperaturesabove 25°C.
B. The rate of photosynthesis is unaffected by thetemperature of the water.
C. The number of chloroplasts in the cell decreases as temperature increases.
D. Enzymes involved with plant photosynthesis aredisrupted at temperatures above 25°C.
15449

Biology—Part 2
16 Go to the next page
7. A scientist is examining a pedigree that includesseveral generations of an organism with XX/XYchromosome sex determination.
Which pattern of inheritance would support thehypothesis that the trait being studied is a recessivesex-linked trait found on the X chromosome?
A. The trait is only expressed in males who have afather with the trait.
B. The trait is expressed in half of the female organismsand all of the male organisms.
C. The trait is mostly expressed in males who have amaternal grandfather with the trait.
D. The trait is mostly expressed in females who have apaternal grandmother with the trait.
15447

Biology—Part 2
Go to the next page
17

Biology—Part 2
18 Go to the next page
8. The diagram models the time-lapse movement ofparticles across a cell membrane. The particles havecharacteristics that allow them to pass freely acrossthe membrane.
Particles Crossing a Membrane over Time
Time 1 Time 2 Time 3

Biology—Part 2
19 Go to the next page
In the Answer Document, select all of the statementsthat describe the particles or their movement basedon the time-lapse diagram.
A. The particles crossing the membrane do not havea charge.
B. The movement across the membrane requiresenergy from ATP.
C. The movement across the membrane requiresenergy from glucose.
D. The movement across the membrane does notrequire added energy.
E. The particles crossing the membrane could beproteins or carbohydrates.
F. The particles crossing the membrane could bewater (H2O) or oxygen (O2).
G. The particles crossing the membrane have a strongpositive or negative charge.
15452

Biology—Part 2
20 Go to the next page
10. The table shows sample cells taken from tissues of twoindividuals of the same species. DNA from each cell isanalyzed using gel electrophoresis.
Gel Electrophoresis Cell Comparison
Cell Tissue SourceIndividual A
Tissue SourceIndividual B
1
2
3
4
Liver Liver
Lung Skin
Muscle Muscle
Blood Pancreas
9.
15439
This item cannot be rendered as a paper/pencil item.

Biology—Part 2
21 Go to the next page
Which prediction will be supported by the results of the gel electrophoresis analysis?
A. Cell 1 from Individual A will have an identicalbanding pattern compared to Cell 1 fromIndividual B.
B. Cell 1 from Individual A will have an identicalbanding pattern compared to Cell 2 fromIndividual A.
C. Cell 1 from Individual A will have a differentbanding pattern compared to Cell 3 fromIndividual A.
D. Cell 1 from Individual A will have a differentbanding pattern compared to Cell 4 fromIndividual A.
15446

Biology—Part 2
22 Go to the next page
11.
15440
This item cannot be rendered as a paper/pencil item.
12.
15444
This item cannot be rendered as a paper/pencil item.
13.
15443
This item cannot be rendered as a paper/pencil item.

Biology—Part 2
Go to the next page
23

Biology—Part 2
24 Go to the next page
14. A red blood cell is placed into an aqueous solution.The red blood cell has a lower concentration ofprotein and sugar than the aqueous solution, asshown in the diagram. In the diagram, the volume of the cell is equal to the volume outside the cell.
Protein
Red Blood Cell
Sugar
Key

Biology—Part 2
25 Go to the next page
What is most likely to occur?
A. Water from the solution will diffuse into the redblood cell.
B. Water from the red blood cell will diffuse into thesolution.
C. Protein and sugar from the solution will diffuse intothe red blood cell.
D. Protein and sugar from the red blood cell willdiffuse into the solution.
15441
15.
15451
This item cannot be rendered as a paper/pencil item.

Biology—Part 2
26 Go to the next page
16.
15438
This item cannot be rendered as a paper/pencil item.

Biology—Part 2
27 Go to the next page
17. The evolutionary relationships among four animals and four animal traits are shown in the cladogram.
In the Answer Document, select the boxes to identifythe trait(s) that each animal possesses.
Shark Bullfrog Kangaroo
Animal Cladogram
Placenta
Mammary glands
Two pairs of limbs
Vertebrae
Chimpanzee
Placenta
Vertebrae
MammaryglandsTwo pairsof limbs
A C
E
D
F
B
I
HG
KJ L
M N O P
Bullfrog Chimpanzee Kangaroo Shark

Biology—Part 2
28 Go to the next page
18.
15435
This item cannot be rendered as a paper/pencil item.

STOP
Biology—Part 2
29
19. A scientist is trying to determine the evolutionaryrelationships among species with very similar physicalcharacteristics. One method to determine therelationships is by comparing amino acid sequencesof proteins.
Why would the scientist compare the amino acidsequences of proteins common to those similarspecies?
A. Amino acid sequence differences provideevidence of gene flow among the species.
B. Amino acid sequence differences reflect theaccumulated differences in the DNA of thespecies.
C. Amino acid sequence differences are the onlyuseful data for constructing accurate cladogramsof the species.
D. Amino acid sequence differences are the result of mutations caused by different selection pressuresexperienced by the species.
15448
