oil and gas drilling fluids distribution & blending … agm.pdf · oil and gas drilling fluids...
TRANSCRIPT

TSX: BRY
June 2014
Company
Overview
2014 Year End
Highlights
Jason Theiss, Chief
Financial Officer
Don Caron, Chief
Executive Officer
North America’s Largest Pure Play
“For over 30 years we have proven our ability to combine strategic supplier relationships and expert logistics making us the premier
supplier of drilling fluid chemicals and drilling fluid additives to the North American oil and gas industry.”
Oil and Gas Drilling Fluids
Distribution & Blending
Company
TSX:BRY June 2015

TSX: BRY
June 2014
Certain statements set forth in this presentation are forward looking statements. Although Bri-Chem Corp. management believe
their expectations are based on reasonable assumptions, they give no assurance that expected results will be achieved. There
are numerous risks and uncertainties that can effect the outcome and timing of such events, including many factors beyond the
control of Bri-Chem Corp.’s management.
These factors include, but are not limited to, economic and political conditions, government regulation, commodity prices for oil
and gas, fluctuations in the level of oil and gas, the need to effectively integrate acquired businesses, uncertainties as to Bri-
Chem’s ability to implement its business strategy effectively in Canada and the United States, Bri-Chem’s ability to attract and
retain key personnel, currency fluctuations and other factors that affect demand for the Company’s product. Should one or more
of these risks or uncertainties occur, or should underlying assumptions prove incorrect, the actual results and plans for fiscal
2015 and beyond could differ materially from those expressed in the forward looking statements. Additional information on
these and other factors and uncertainties are described under the heading “Risk Factors” in the Company’s most recent Annual
Information Form (“AIF”) and other continuous disclosure materials filed by the Company with Canadian securities regulators,
which are available to the public at www.sedar.com.
Readers are cautioned not to place undue reliance on this forward-looking information, which is given as of the date it is
expressed. The Company does not undertake to update or revise any forward-looking information, whether as a result of new
information, future events or otherwise, except as required by law.
Furthermore, certain measures we use are not recognized measures under International Financial Reporting Standards
(“IFRS”). Specific measures used are earnings before interest, taxes, depreciation, amortization and non-cash stock based
compensation (“EBITDA”). We strongly recommend the participants review the discussion of these statements in the
“Management’s Discussion and Analysis – Non-IFRS Measures and Reconciliations” section of our 2014 Annual Report.
Forward-Looking Statement
2

TSX: BRY
June 2014
1. COMPANY & INDUSTRY OVERVIEW
2. FINANCIAL REVIEW
3. 2015 OUTLOOK
4. QUESTIONS
Presentation Agenda
3

TSX: BRY
June 2014
4
Largest Independent Drilling
Fluids Wholesale Distributor
in North America
2014 Record Sales of $185M
2014 Record EBITDA of $17M
31 Strategic
Warehouses in North
America
7 Blending & Packaging
Facilities
Vital Link in the
Supply Chain
Drilling, Completion
Stimulation &
Production Chemicals
Warehouse Logistics
Operate 24/7
365 days per year
Enable Energy Service
Companies To Grow
Nationally
North American
Customer Base
Drilling Fluids
Blending Additives
Oilfield Cement
Our Business
Company & Industry Overview

TSX: BRY
June 2014 Market Data
As of May 25, 2015
Exchange Toronto Stock Exchange
Shares Outstanding 23.7M/FD25.3M
Share Price $0.48
52 Week High/Low $1.98/$0.37
Market Capitalization $11.4M
Float 18.0M
Net working capital $29.4M
EBITDA (1) $17.0M
EBITDA per FD share (1) $0.70
EV/EBITDA (1) (3) 4.2X
Debt/EBITDA (1) (2) 3.6X
Book Value per FD share (1) $1.83
(1) For the year ending December 31, 2014 from continued operations
(2) Debt is calculated as operating line, plus long-term debt
(3) Enterprise Value = Market capitalization, plus debt, less non-controlling interest
Management, Directors and
Insiders 24%
Institutional 41%
Retail 35%
Shareholder Breakdown
Company & Industry Overview
5

TSX: BRY
June 2014
6
Corporate Highlights
Company & Industry Overview
Canadian Fluids Distribution & Blending Divisions
USA Fluids Distribution & Blending Divisions
North America
2014 Sales flat YOY • Distribution sales down 4% • Blending sales up 13%
2014 Sales up 75% • Distribution sales up 66% • Blending sales up 260%
Consolidated 2014 Sales up 23% • Distribution sales up 20% • Blending sales up 41%
50 Employees generating $103M in Revenue Expanded Blending Facility Capacity Strategic Transportation Relationship with Mullen Group
73 Employees generating $82M in Revenue Expanded from 3 to 18 Warehouses and $6M to $74M in sales in 4 years No other national independent drilling fluids wholesaler in USA at present
123 Employees generating $185M in Revenue ($1.5M/employee) Limited Capex needs for additional expansion Best Inventory & Warehouse Industry Coverage

TSX: BRY
June 2014
7
Solution Blend - Production Chemicals
Well maintenance Enhance production
Sodium/ Solution Blend - Stimulation Chemicals
Eliminate unwanted materials Injection of fluids for fracturing process
Sodium/Sun Coast - Cementing Chemicals
Displaces the drilling fluids Cements wellbore casing
Bri-Chem Supply - Drilling Fluids
Lubricates and cools the drill
bit.
Remove cutting debris from
the bottom of the drill hole. Controls subsurface pressure
Prevents the well from
flowing or blowing out.
Oil & Gas Fluids – Fully Integrated
Drilling Fluids Are Essential
Company & Industry Overview
* See Appendix for Product List

TSX: BRY
June 2014
North American Oilfield Chemical Market
Stimulation Chemicals, 50%
Drill ings Fluids, 30%
Production Chemicals, 10%
Cementing Chemicals, 8%
Other Types, 2%
North American Drilling Fluids Market
(1) Company Estimate
(2) Source: Freedonia Group – US Oilfield Chemical Demand Company & Industry Overview
8

TSX: BRY
June 2014
9
Canadian Distribution and Blending Facilities
Company & Industry Overview
► 15 Distribution and Blending Facilities ► 12 Third party owned and operated warehouses minimize
capital and operating costs. ► Customers pay for all transportation costs to and from
rig sites
Distribution Facility Distribution & Blending Facilities

TSX: BRY
June 2014 USA Distribution and Blending Facilities
► 16 Distribution & Blending Facilities ► 8 third party owned and operated warehouses ► Coverage in all major USA resource plays
Distribution Facility
Distribution & Blending Facilities
10
Company & Industry Overview

TSX: BRY
June 2014
For The Years Ended Dec 31
Consolidated (Continued Operations)
2014 2013 % Change
Revenue $184,708 $150,040 23.1%
Gross Margin ($) $31,750 $26,644 19.2%
Gross Margin (%) 17.2% 17.8% (0.6%)
EBITDA $16,832 $13,031 29.2%
EBITDA/Share $0.70 $0.74 ($0.04)
Wgt Avg Shares Outstanding (000s)
24,014
17,613
37.6%
Financial Review
2014 Performance
11

TSX: BRY
June 2014 Annual Divisional Sales Breakdown
Financial Overview
12
40%
44%
11%
5%
2014 Consolidated Revenue $184.7M
USA Fluids
CDN Fluids
CDN Blend/Pack
USA Blend/Pack
30%
56%
12%
2%
2013 Consolidated Revenue $150.0M

TSX: BRY
June 2014 USA Fluids Division Explosive Growth
13 Financial Review
-
5,000
10,000
15,000
20,000
25,000
2011 2012 2013 2014
Q1 3,134 7,825 12,501
Q2 461 6,273 10,242 18,185
Q3 1,682 5,999 12,643 21,155
Q4 2,928 4,503 13,839 22,004
(00
0's
of
CD
N $
)
Year
USA Fluids Distribution Division Quarterly Revenue Growth

TSX: BRY
June 2014 Gross Margins
(1) Divisional Gross Margin based on percentage of divisional revenue
14
Financial Review
$-
$5,000
$10,000
$15,000
$20,000
$25,000
$30,000
$35,000
2010 2011 2012 2013 2014
Blend/Pack USA $- $915 $3,324
Blend/Pack CA $1,302 $1,494 $1,435 $3,581 $3,704
Fluids Dist USA $- $1,487 $4,113 $9,809 $13,998
Fluids Dist CA $16,672 $20,553 $14,574 $12,339 $10,724
$ T
ho
usa
nd
s
14.7%
21.8%
40.0%
17.8%
15.8%
19.5%
19.0% 22.0% 14.1%
39.6%
14.4% 16.3% 14.6% 13.1% 15.3%
20.9%

TSX: BRY
June 2014 Balance Sheet
As of Dec 31, 2014
ABL Operating Line $51.9M
Available Credit ($90M ABL) $21.5M
Inventory $57.3M
Total Assets $131.8M
Net working capital $29.4M
Long-term Debt $7.5M
Shareholders Equity $47.2M
Inventory Turnover 2.7X
Capital Expenditures $5.6M
Financial Review 15
$0
$10
$20
$30
$40
$50
$60
$70
$80
$90
$100
$ M
illio
ns
Credit Facility
Facility Used
Unmargined Availability
Margined Availability
$38M Available Liquidity
$22M Available
$52M Used
TSX: BRY
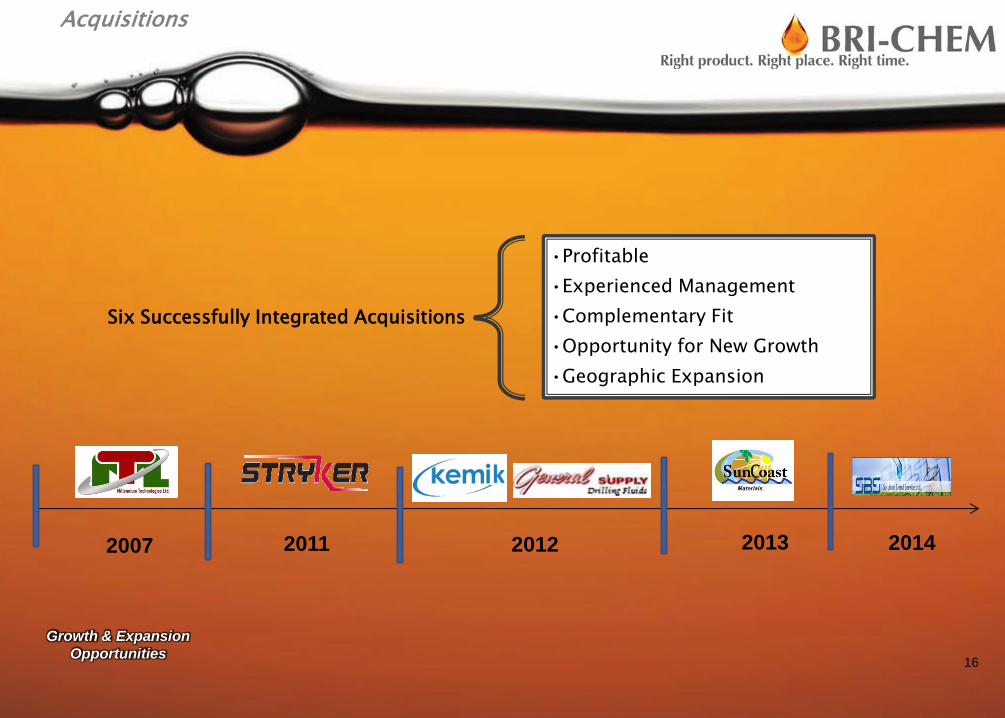
June 2014
Six Successfully Integrated Acquisitions
•Profitable
•Experienced Management
•Complementary Fit
•Opportunity for New Growth
•Geographic Expansion
16
Acquisitions
2007 2011 2012 2013 2014
Growth & Expansion
Opportunities

TSX: BRY
June 2014
17
2015 Industry Outlook
2015 Depressed Oil & Gas Prices
•PSAC forecasts 5,320 wells to be drilled in Western Canada (42% decrease -2014)
•CAODC forecasts 203 average active rigs (40% decrease - 2014)
•USA actual 885 average active rigs (53% decrease - 2014)
•Rig count (as of May 27, 2015)
• CA 75 rigs
• USA 885 rigs
A Forward Look
Growth & Expansion
Opportunities

TSX: BRY
June 2014
18
2015 Strategy
Project “Debt Reduction” Plan
Annualized interest savings of $1.1M (est.)
•Inventory reduction from $54M to $33M
•Repay Sub Debt principal down from $8.4M
to $5M
•Reduce CapX spending from $5.7M to
$750K
•Reduce ABL Debt from $43M to $30M
•Reduce ABL facilty from $90M to $50M
Project “Right Size” Plan
Annualized cost savings of $3.2M (est.)
•Wage Rollbacks (5% non-managerial, 10%
Management)
•Layoff 25% of employee base
•Suspension of employee benefits
•Cut back discretionary spending
•Corporate office move back to Acheson, AB
•Closure of less active warehouses
A Forward Look
Growth & Expansion
Opportunities

TSX: BRY
June 2014
19
Don Caron
Chief Executive Officer
2125 64 Avenue Edmonton, Alberta T6P 1Z4
Email: [email protected]
Ph: 780.420.6885
Contacts
Appendix
Jason Theiss
Chief Financial Officer
2125 64 Avenue Edmonton, AlbertaT6P 1Z4
Email: [email protected]
Ph: 780.577.0595

TSX: BRY
June 2014
20
Don Caron Chief Executive
Officer & Director
President and CEO since 2008
Partner of Alberta based Private Equity Firm.
Founder of International Technologies Inc. which merged to create Tervita (formerly CCS) (1992)
Albert Sharp Director
Former Chief Executive Officer of Altus Geomatics, partnership residing under Altus Group Income Fund. (TSX: AIF.UN)
Retired Trustee of Altus Group Income Fund.
Member of The Canadian Institute of Geomatics; The International Right of Way Association; and, The Alberta
Association of Surface Land Agents.
Eric Sauze Director & Chair
of Audit Committee
Chartered Accountant and Chartered Financial Analyst.
Chief Financial Officer of Western Canadian based oil and gas valve company.
Brian Campbell
Director
Over 25 Years of field and management experience in the drilling fluids industry.
Founded Bri-Chem in 1985.
Former President of Bri-Chem Fluids division.
Trent Abraham President of Fluids
Division
Over 20 years experience in the drilling fluids industry, oversees the day to day operations
Former owner of Millennium Technologies which was purchased by Bri-Chem (2007).
Jason Theiss Chief Financial
Officer
Chartered Accountant.
Prior, controller of private income trust, and senior auditor with public accounting firm.
Joined Bri-Chem in 2007.
Bios
Appendix

TSX: BRY
June 2014
21
Fluid Products
Stimulation &
Fracturing
Sodium Chloride
Silica Fume
Processed Lime
Hydrated Lime
Copper Chloride
Gilsonite
Kelzan
Barite
Bentonite
Oil Based Muds
Emulsifiers
Defoaming Agents
Calcium Nitrate
Soda Ash
Polymers
Surfactants
Acids
Guar Gums
Petro Distillate
Borate Salts
Citric Acid
Corrosion Inhibitors
Scale Inhibitors
Methanol
Sand Dispersants
Foaming Agents
De-waxing Solvents
Hydrogen Sulfide
Appendix
Cementing &
Other
Production
Chemicals
Drilling
Fluids