oil and gas industry trends ektinteractive
TRANSCRIPT
Industry Trends

INDUSTRY TRENDS
2
Introduction to Oil & Gas
Industry Trends
Copyright © 2013 EKT Interactive, Inc.
All Rights Reserved
Feel free to email, tweet, blog, and pass this eBook around the web… but please
don’t alter any of its contents when you do. Thanks.
EKTInteractive.com
INDUSTRY TRENDS
3
Learning Objectives
We have put these e-books together to give basic background on oil & gas to
professionals who are new to the industry or those interested in pursuing a
career in oil & gas. They have been developed by senior industry
professionals with decades of experience.
Upon completing the Industry Trends Lesson, participants will be able to:
Explain why OPEC has limited ability to dampen price spikes by producing
more.
Define Reserves-to-Production Ratio, and contrast the value of this metric in
the Middle East with the U.S.
Explain why the oil and gas industry may need to be renamed the Gas and
Oil industry in the future.
Explain why the oil and gas industry needs to invest massive amounts of capital in the coming years.
Explain why upstream and downstream construction costs have begun to rise dramatically.
List some of the key challenges facing the oil and gas industry in hiring staff to replace retiring employees.
Describe the two leading approaches for limiting CO2 emissions.
Contrast the concepts of independence with interdependence.
INDUSTRY TRENDS
4
Introduction
Future Energy Demand
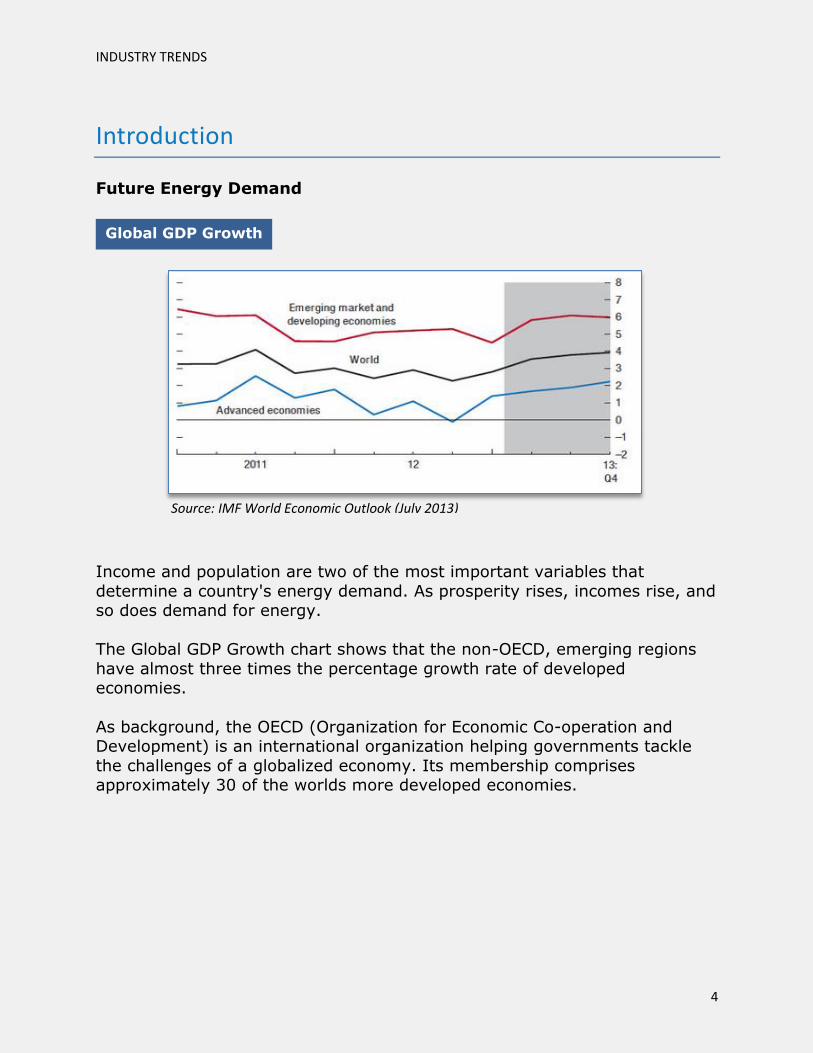
Income and population are two of the most important variables that
determine a country's energy demand. As prosperity rises, incomes rise, and so does demand for energy.
The Global GDP Growth chart shows that the non-OECD, emerging regions
have almost three times the percentage growth rate of developed economies.
As background, the OECD (Organization for Economic Co-operation and Development) is an international organization helping governments tackle
the challenges of a globalized economy. Its membership comprises approximately 30 of the worlds more developed economies.
GlobalGDPGrowth
Source:IMFWorldEconomicOutlook(July2013)
Global GDP Growth
Source: IMF World Economic Outlook (July 2013)

INDUSTRY TRENDS
5
“In 2005, Non-OECD and OECD energy demand was about equal, but by 2040, Non OECD demand will be nearly double that of the OECD.”
This projection has numerous geopolitical implications, as well as oil and gas
supply demand implications.
For example, while China garners most headline attention, the Middle East as a whole has a similar demand size and growth pattern. These economies
continue to invest recent oil revenue windfalls in massive infrastructure projects.
Global Energy Demand Growth
Non OCED energy demand
Quadrillion BTUs
GlobalEnergyDemandGrowth
Source:ExxonMobilEnergyDataCenter
OCED energy demand
Quadrillion BTUs
GlobalEnergyDemandGrowth
Source:ExxonMobilEnergyDataCenter
Non OCED energy demand
Quadrillion BTUs
Source: ExxonMobil Energy Data Center
INDUSTRY TRENDS
6
The Peak Oil Debate
The Peak Oil Debate includes these topics:
Current peak oil definition
Crude oil spare capacity Oil reserves-to-production ratio
Natural gas reserves-to-production ratios Abundance of natural gas
Even with recent growth in renewable energy sources, the demand growth
for oil seems to be inevitable. At the same time, experts estimate that oilfield decline rates are somewhere around 4.5% per year for conventional
production.
This fact has led to one the most widely debated topics in the oil and gas industry today, the concept of Peak Oil. At its core, Peak Oil concerns the
decline rate of producing existing (conventional) oil fields.
It is worth noting that 80% of the world’s oil production comes from fields
discovered before 1970, the vast majority of which now have steep decline curves.
In 1956, nobody believed M. King Hubbert, a Shell Oil Company geologist,
when he predicted that the U.S. oil production would peak by 1970. At that time the U.S. was the king of oil, producing more oil than any other country
in the world. Right on Mr. Hubbert’s schedule, in 1970, the U.S. peaked in oil production.
If Peak Oil proves to be true, future global oil production could be much less
than it is today. Prior to the boom in domestic shale production, the U.S. production had peaked in the lower 48 states in 1970. Within 20 years, U.S.
production had fallen by over 40%.
INDUSTRY TRENDS
7
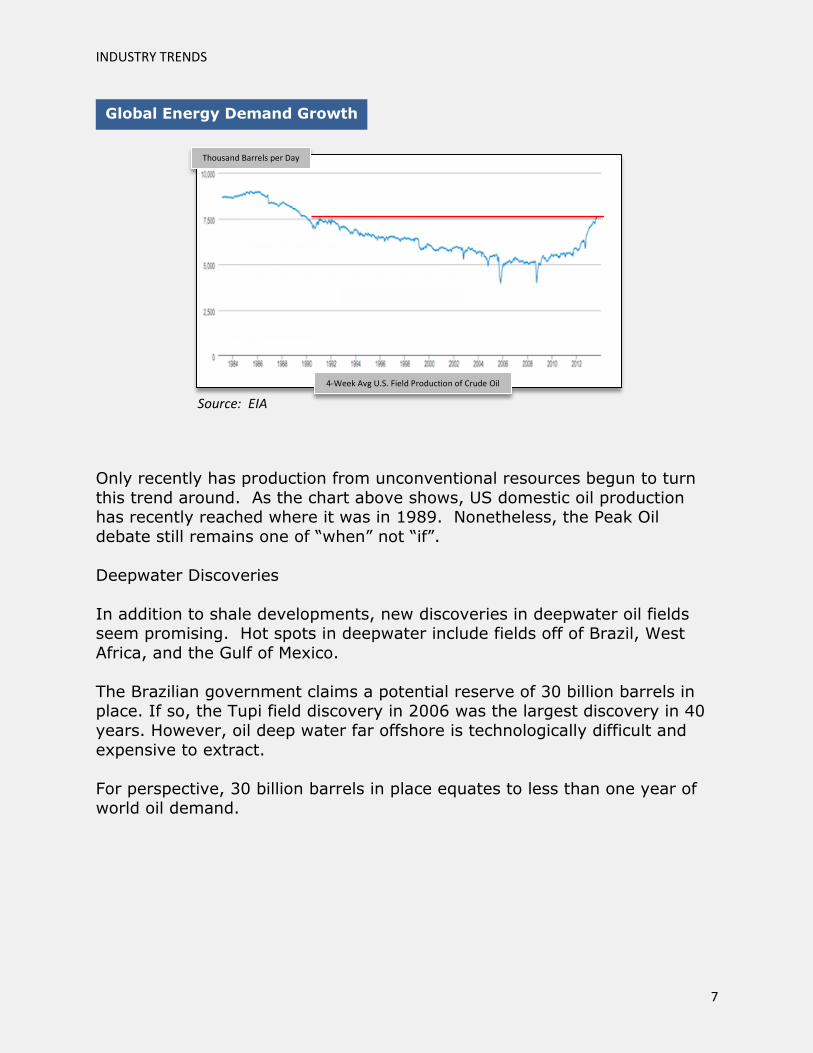
Only recently has production from unconventional resources begun to turn
this trend around. As the chart above shows, US domestic oil production has recently reached where it was in 1989. Nonetheless, the Peak Oil
debate still remains one of “when” not “if”.
Deepwater Discoveries
In addition to shale developments, new discoveries in deepwater oil fields seem promising. Hot spots in deepwater include fields off of Brazil, West
Africa, and the Gulf of Mexico.
The Brazilian government claims a potential reserve of 30 billion barrels in place. If so, the Tupi field discovery in 2006 was the largest discovery in 40
years. However, oil deep water far offshore is technologically difficult and
expensive to extract.
For perspective, 30 billion barrels in place equates to less than one year of world oil demand.
Global Energy Demand Growth
USOilfieldProduc on
Source:IMFWorldEconomicOutlook(July2013)
Source:EIA
4-Week Avg U.S. Field Production of Crude Oil
Thousand Barrels per Day
Source: EIA

INDUSTRY TRENDS
8
Source: EIA
Global Crude Oil Spare Capacity
One key barometer causing price spikes and supply turbulence in oil markets
is the OPEC’s spare crude oil production capacity. OPEC has continuous crude oil output capacity of around 30 million barrels per day, approximately
40% of the world’s demand for oil.
As the Spare Production Capacity chart shows, OPEC spare capacity and prices are inversely related, and current spare capacity is around 4-5 million
barrels per day. In the mid-1980s, OPEC had approximately 10 to 15 million
barrels per day of spare capacity which allowed them, especially Saudi Arabia, to dampen price spikes by bringing more oil to the market.
Although spare capacity is at its lower boundary, it is on the rise. OPEC
members have substantial investments underway to ensure secure oil supplies. Production capacity of natural gas liquids (NGL) and other liquids
available for transportation fuels also will be expanded significantly in the future.
Neither the Peak Oil discussion nor OPEC spare capacity calculations consider
increased availability of NGLs.
Spare Production Capacity and Prices SpareProcuc onCapacityandPrices
Source:EIA
INDUSTRY TRENDS
9
Source: BP Statistical Review 2013
Oil Reserves-to-Production Ratio
Another important consideration is the Reserves-to-Production (R/P) ratio:
The ratio of current proven reserves, divided by the current
production, measured in years
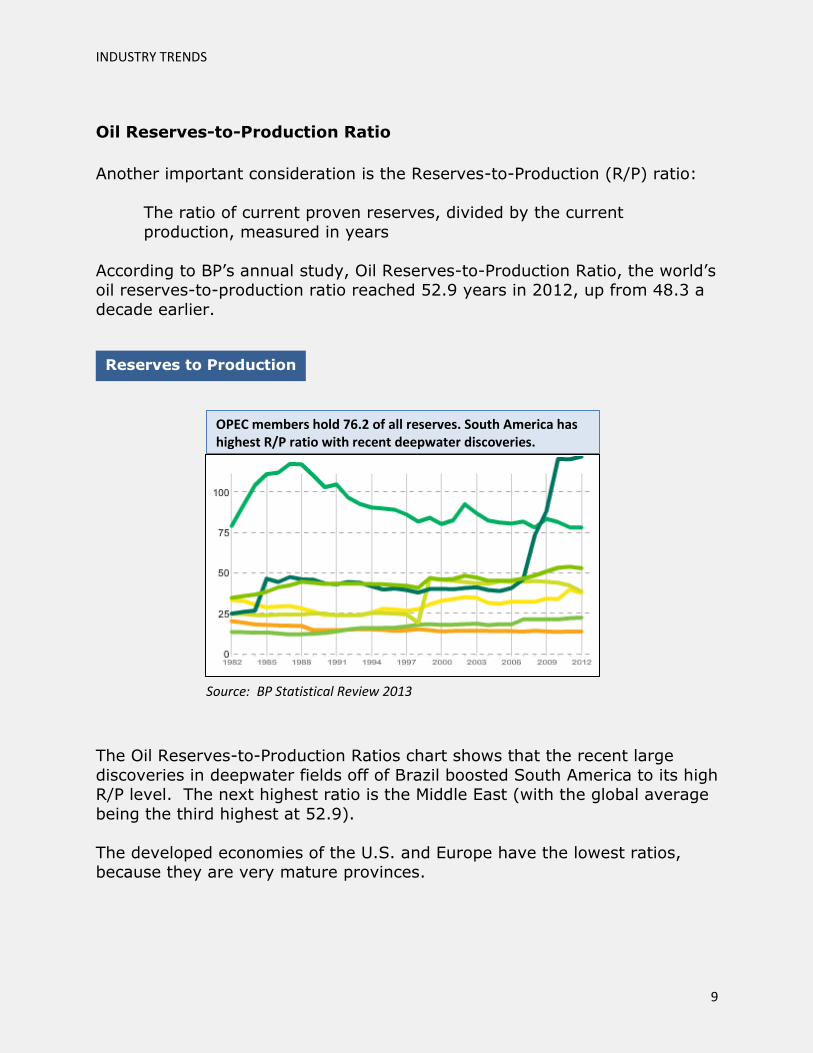
According to BP’s annual study, Oil Reserves-to-Production Ratio, the world’s oil reserves-to-production ratio reached 52.9 years in 2012, up from 48.3 a
decade earlier.
The Oil Reserves-to-Production Ratios chart shows that the recent large
discoveries in deepwater fields off of Brazil boosted South America to its high R/P level. The next highest ratio is the Middle East (with the global average
being the third highest at 52.9).
The developed economies of the U.S. and Europe have the lowest ratios, because they are very mature provinces.
Reserves to Production
OPEC members hold 76.2 of all reserves. South America has highest R/P ratio with recent deepwater discoveries.
INDUSTRY TRENDS
10
Source: Watts, P.: “Building Bridges – Fulfilling the Potential for Gas in the 21st Century,” speech – World Gas Conference, Tokyo, Japan, 060303.
Natural Gas Reserves-to-Production Ratios
The world’s natural gas R/P ratio is 55.7 (BP, 2012) years with global
reserves standing at 187.3 trillion cubic meters.
Europe/Eurasia and the Middle East combine to hold over 75% of the worlds proven natural gas reserves.
Recent developments in unconventional drilling have led the oil R/P Ratio to
gain ground on the natural gas R/P.
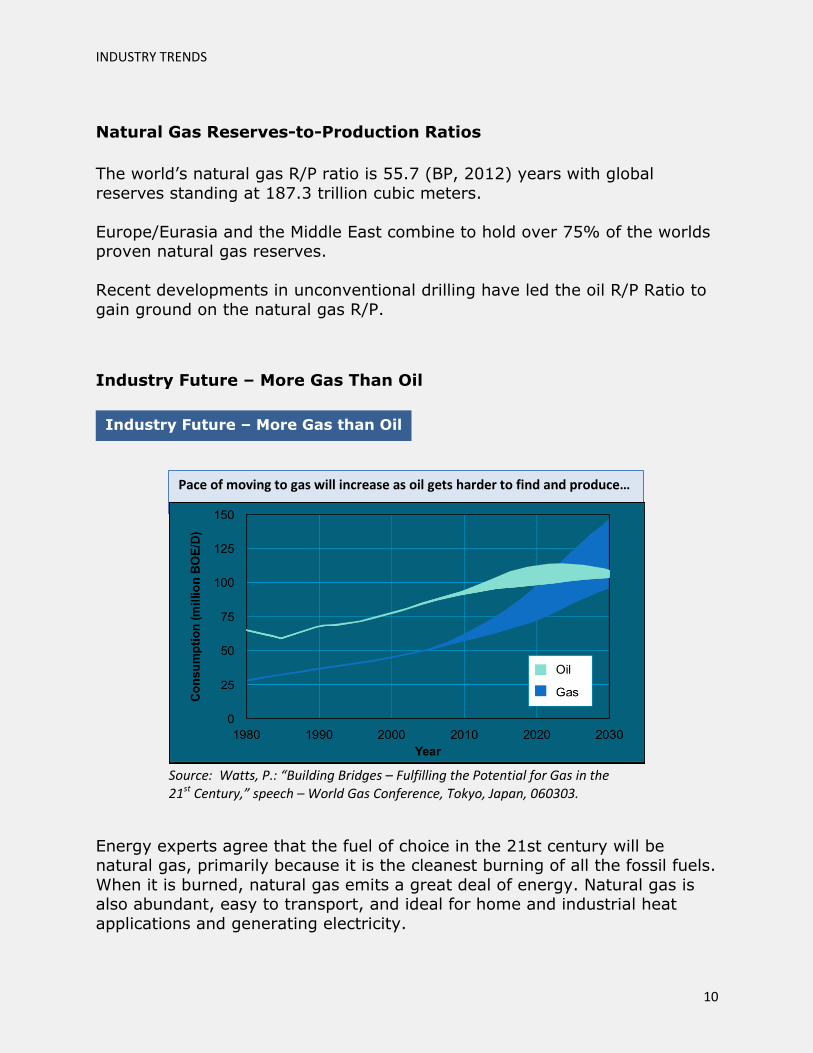
Industry Future – More Gas Than Oil
Energy experts agree that the fuel of choice in the 21st century will be natural gas, primarily because it is the cleanest burning of all the fossil fuels.
When it is burned, natural gas emits a great deal of energy. Natural gas is also abundant, easy to transport, and ideal for home and industrial heat
applications and generating electricity.
Industry Future – More Gas than Oil
Pace of moving to gas will increase as oil gets harder to find and produce…
INDUSTRY TRENDS
11
GlobalNaturalGasPrices
Source:HartEnergySource: Hart Energy
Given these qualities, and with gas reserves more available than oil, it is
apparent in the Industry Future – More Gas than Oil chart that the demand
for natural gas is growing faster than oil, with power generation accounting for more than half of the expected demand growth. Global demand and new
technology is accelerating the use of liquefied natural gas (LNG), even with high capital and delivery costs.
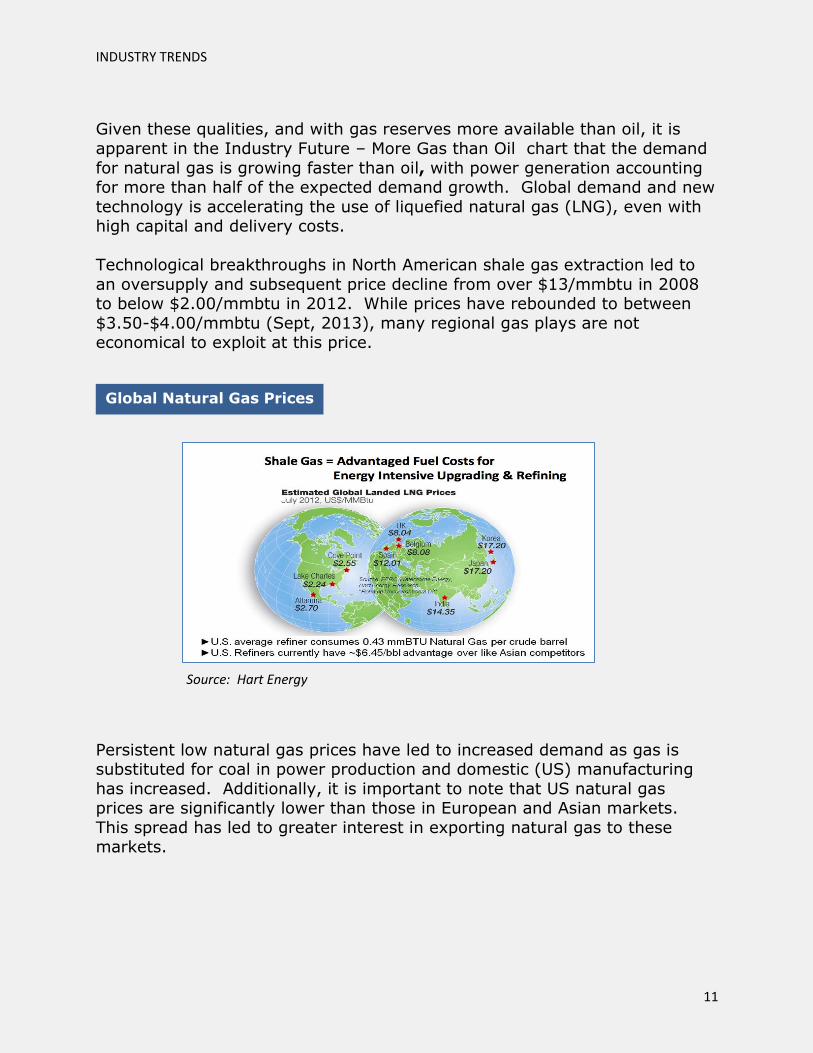
Technological breakthroughs in North American shale gas extraction led to
an oversupply and subsequent price decline from over $13/mmbtu in 2008 to below $2.00/mmbtu in 2012. While prices have rebounded to between
$3.50-$4.00/mmbtu (Sept, 2013), many regional gas plays are not economical to exploit at this price.
Persistent low natural gas prices have led to increased demand as gas is substituted for coal in power production and domestic (US) manufacturing
has increased. Additionally, it is important to note that US natural gas prices are significantly lower than those in European and Asian markets.
This spread has led to greater interest in exporting natural gas to these markets.
Global Natural Gas Prices
INDUSTRY TRENDS
12
IHSCERAUpstreamCapitalCostsIndex(UCCI)
Source:IHS
Capital Investment for New Oil and Gas Exploration
The discussion of capital investment for new oil and gas exploration
includes:
Upstream capital cost
Downstream capital cost
Midstream Super-cycle and existing infrastructure replacement
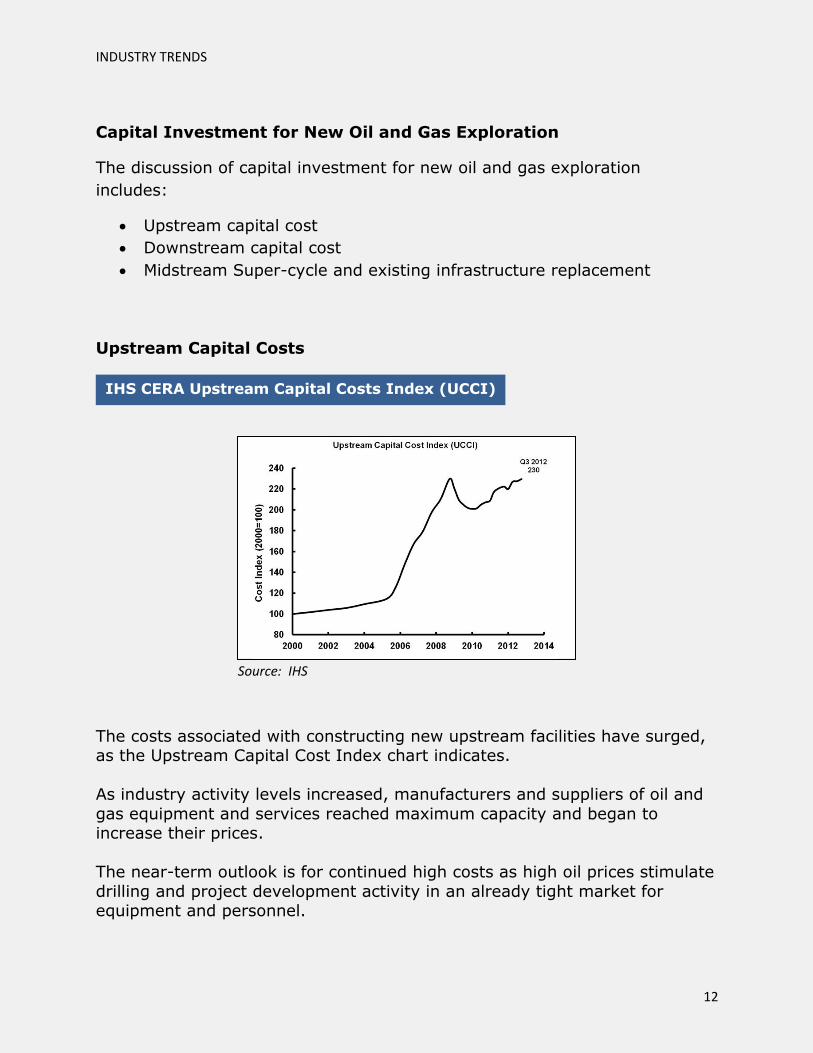
Upstream Capital Costs
The costs associated with constructing new upstream facilities have surged, as the Upstream Capital Cost Index chart indicates.
As industry activity levels increased, manufacturers and suppliers of oil and
gas equipment and services reached maximum capacity and began to increase their prices.
The near-term outlook is for continued high costs as high oil prices stimulate
drilling and project development activity in an already tight market for equipment and personnel.
IHS CERA Upstream Capital Costs Index (UCCI)
Source: IHS
INDUSTRY TRENDS
13
DownstreamCapitalCostIndex
Source:IHSCERA
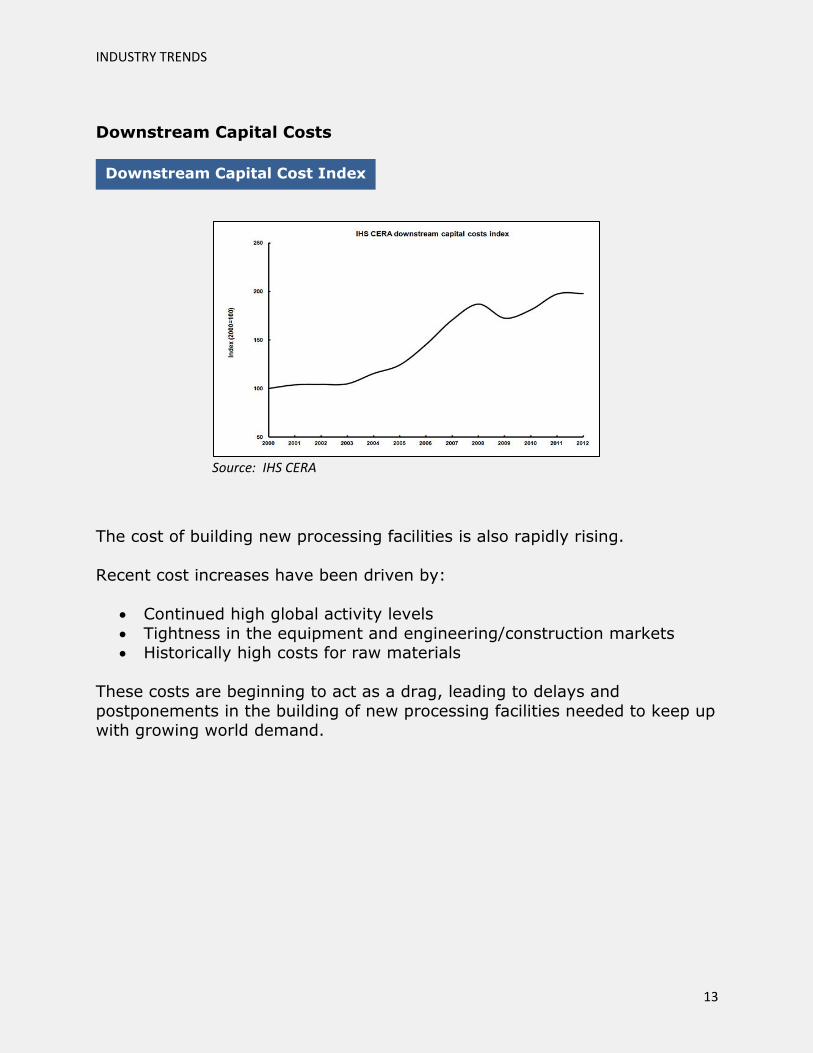
Downstream Capital Costs
The cost of building new processing facilities is also rapidly rising.
Recent cost increases have been driven by:
Continued high global activity levels
Tightness in the equipment and engineering/construction markets Historically high costs for raw materials
These costs are beginning to act as a drag, leading to delays and
postponements in the building of new processing facilities needed to keep up with growing world demand.
Downstream Capital Cost Index
Source: IHS CERA
INDUSTRY TRENDS
14
Midstream Super-cycle
The capital needed for new midstream oil and gas investments between now and 2030 has been estimated in excess of $200 billion. Over $80 billion in
proposed projects are expected to come online by 2020.
Domestic oil and gas production has led to the need for a reconfiguration of midstream assets. New pipelines are required to get oil to refining centers
in the Northeast and Gulf Coast that have traditionally used imported oil.
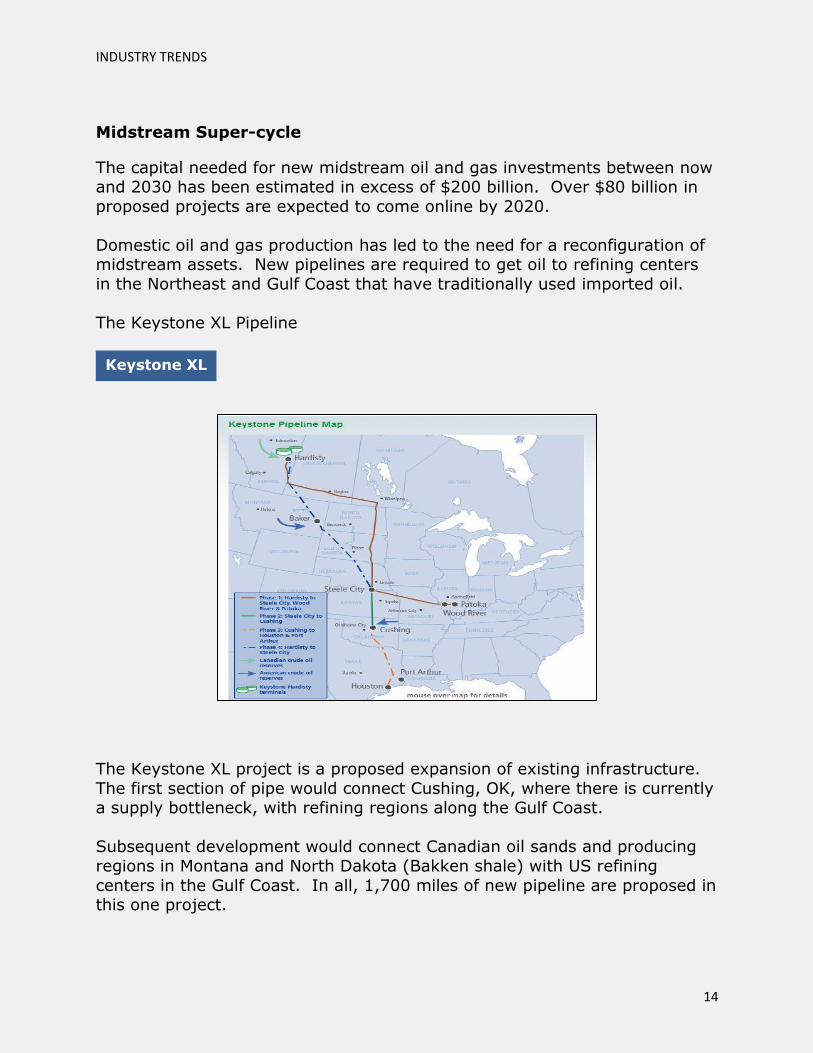
The Keystone XL Pipeline
The Keystone XL project is a proposed expansion of existing infrastructure.
The first section of pipe would connect Cushing, OK, where there is currently a supply bottleneck, with refining regions along the Gulf Coast.
Subsequent development would connect Canadian oil sands and producing
regions in Montana and North Dakota (Bakken shale) with US refining
centers in the Gulf Coast. In all, 1,700 miles of new pipeline are proposed in this one project.
KeystoneXLKeystone XL
INDUSTRY TRENDS
15
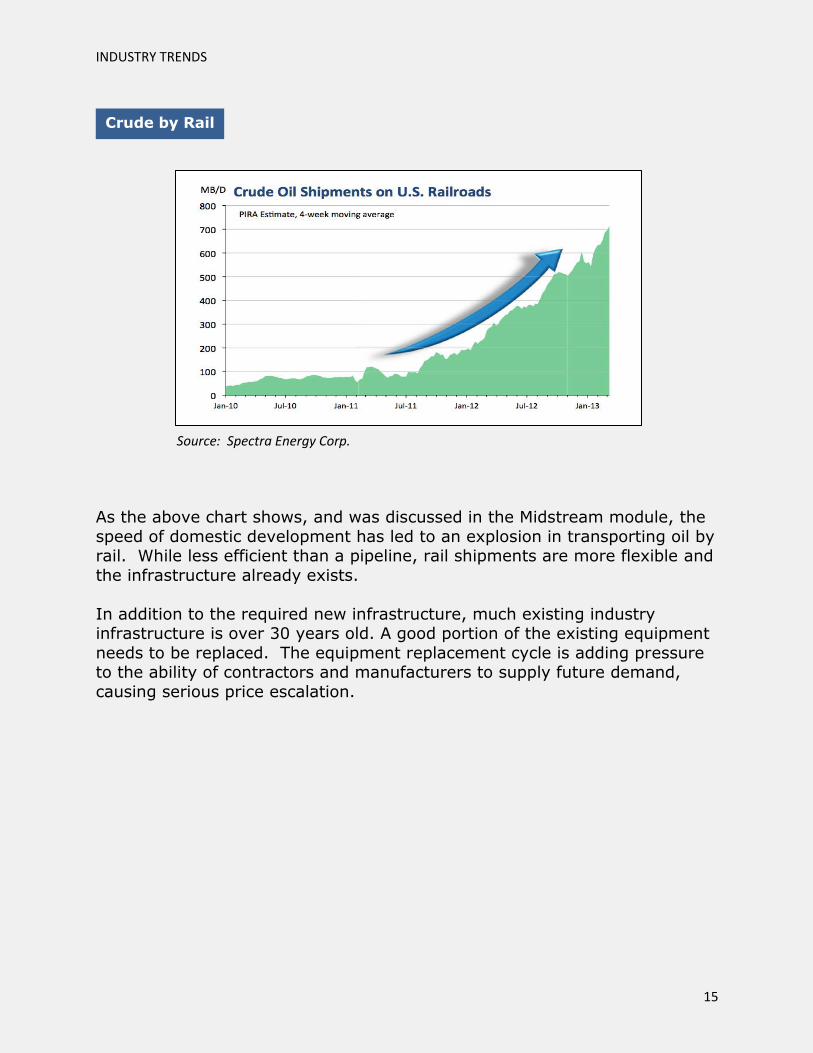
As the above chart shows, and was discussed in the Midstream module, the
speed of domestic development has led to an explosion in transporting oil by rail. While less efficient than a pipeline, rail shipments are more flexible and
the infrastructure already exists.
In addition to the required new infrastructure, much existing industry infrastructure is over 30 years old. A good portion of the existing equipment
needs to be replaced. The equipment replacement cycle is adding pressure to the ability of contractors and manufacturers to supply future demand,
causing serious price escalation.
CrudebyRailCrude by Rail
Source: Spectra Energy Corp.

INDUSTRY TRENDS
16
The Effect of Emissions Growth in the Developing World
The topic of emissions includes:
Increase in emissions in developed countries Efforts to control carbon growth
A call for interdependence
Energy demand growth is accelerating in the developing world, and CO2
emissions follow. In addition, the energy mix in these geographies includes a higher concentration of fossil fuels, especially coal.
The U.S. and China together account for approximately 40% of the world's
total CO2 emissions. This statistic points to a global issue, requiring global solutions.
The scale and complexity of the challenge to meaningfully reduce carbon
emissions is daunting.
In 2012, U.S. energy related carbon emissions declined to 5.3 billion tons of CO2., the lowest since 1994. The dominant reason for this was a decreased
use of coal in power generation due to persistently low natural gas prices.
Power generated from coal accounts for approximately 44% of all generation
capacity in the US. Yet coal plants account for 74% of CO2 emissions from domestic electricity generation activities.
GlobalCO2ChangeSince1990
Change in Global CO2 Emissions Relative to 1990
INDUSTRY TRENDS
17
Other factors included lower demand for transportation fuels and mild winter
temperatures.
Limiting Carbon Growth
Another challenge is the shifting political debate. No longer is the argument
about whether or not the world is warming, and whether or not it is a problem. The political arena is convinced that it is.
The global warming culprit is also considered to be carbon dioxide, although
there is still raging scientific debate on the topic. Be that as it may, two approaches have been considered to limit carbon:
When a carbon tax is considered, industrial sources of carbon dioxide are required to pay a tax for every ton of pollution they emit. The
challenge is to determine a standard for emissions that are taxable and how to guarantee payment of the tax. Then, the governing body
must figure out who pays the tax and what to do with the revenue. This solution proved to be politically unviable.
Under a cap-and-trade program, the government sets an overall
emissions cap and allows companies to buy and sell emission permits. The U.S. implemented a cap-and-trade system to control acid rain
pollution (The Acid Rain Program) and achieved greater reductions at lower costs than anyone anticipated.
The U.S. is behind the European Union (EU) in implementing carbon
mitigation systems. The EU has had a carbon cap-and-trade program in
place since 2005, with mixed (but improving) results.
Some cap-and-trade programs in effect in the US include:
The Clean Air Interstate Rule Clean Air Visibility Rule
The Acid Rain Program The NOX Budget Trading Program
RGGI – Northeast and Mid-Atlantic RECLAIM – South Coast Air Basin
Assembly Bill 32 - California HRVOC – Texas (Houston, Galveston, Brazoria)
Emissions Reduction Market System - Illinois
INDUSTRY TRENDS
18
Talent Storage Challenge
Interdependence as a Solution
Recent developments in domestic energy production have started the
rallying cries for energy independence. In reality, the complexity and global nature of our energy markets will always require a mindset of
interdependence. An independent attitude and policy environment implies self-sufficiency while interdependence is more dynamic, requiring mutual
responsibility to and a shared set of principles with others.
In global energy, consuming countries need the hydrocarbons to fuel their growing economies and populations. Producing countries need an outlet for
their hydrocarbon resources.
There are very few countries that are energy self-sufficient; therefore, the complex global energy system of facilities and people needs to work even
more closely to meet the future challenges.
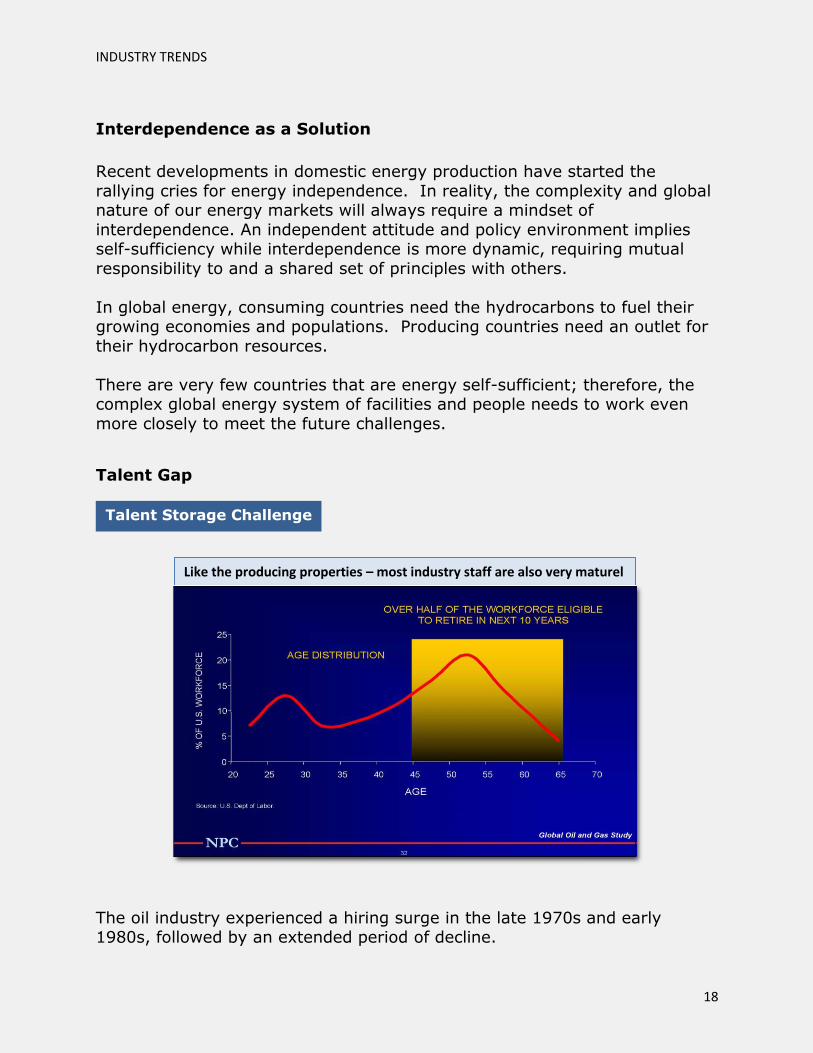
Talent Gap
The oil industry experienced a hiring surge in the late 1970s and early 1980s, followed by an extended period of decline.
Like the producing properties – most industry staff are also very maturel
Talent Shortage Challenge
17
Like the producing properties – most industry staff are also very mature!
INDUSTRY TRENDS
19
New talent has not made up for decades of depressed hiring activity. As a
result, over half of today's U.S. workforce is eligible for retirement within the
next 10 years, often referred to as "the big crew change."
A 2008 survey by Ernst and Young and Rice University confirmed the extent of the struggle that oil and gas companies have in recruiting, training, and
developing a sufficient number of staff:
Nearly 90% of the senior executives interviewed at 22 top international oil and gas companies called the talent shortage one of
the top five issues facing their companies.
More than half the executives surveyed feel the talent void could hurt corporate growth as a result of an inability to staff projects.
Nearly three quarters agreed that the need for training has increased due to
changing workforce demographics.
More recently, a study performed by Schlumberger Business Consulting
(2011) highlighted a loss of 5,000 experienced petrotechnical professionals by 2014. Universities have succeeded in ramping up graduates in petroleum
engineering and geosciences. However, over 70% of these graduates come from Asia and Russia CIS which will require a global mindset in recruitment
of talent.

INDUSTRY TRENDS
20
Summary
For the first time in history, non-Organisation for Economic Co-operation and
Development (OECD) energy demand has exceeded OECD energy demand.
The concept of Peak Oil concerns the decline rate of producing existing
(conventional) oil fields.
Energy experts agree that the fuel of choice in the 21st century will be
natural gas, primarily because it is the cleanest burning of all the fossil fuels.
The discussion of capital investment for new oil and gas exploration
includes:
Upstream capital cost
Downstream capital cost
Midstream Super-cycle
Talent shortage
Even with recent developments in domestic oil and gas production, complex
global energy markets will always require a mindset of interdependence,
rather than independence.

INDUSTRY TRENDS
21
Are You Ready to Unlock the Opportunities Available in Oil & Gas?
The eBook you have just read is only one part of our Introduction to Oil &
Gas course.
EKT Interactive has been providing custom training solutions to the oil and
gas industry since 1986, and our Introduction to Oil & Gas courses have
been used by energy companies of all sizes and specialties including super-
majors, large independents, and niche players.
Beyond traditional industry players, we have worked with Big 6 accounting
firms and other financial services companies looking to increase industry
awareness in audit, analyst, sales, and support functions.
If you are looking to become a part of the global boom in oil and gas
opportunities or are committed to making the most of your current position
in the industry, sign up now and get started.
Click Here to Find Out More