oil and grease resistant paper- board factors affecting
TRANSCRIPT
Anne Riekki
OIL AND GREASE RESISTANT PAPER-BOARD – FACTORS AFFECTING BAR-RIER PROPERTIES AND AN EVALUA-
TION OF THE TEST METHODS
Faculty of Engineering and Natural Sciences Master’s Thesis
August 2019

i
ABSTRACT
Anne Riekki: Oil and grease resistant paperboard – factors affecting barrier properties and an
evaluation of the test methods
Master’s Thesis
Tampere University
Materials Science and Engineering
August 2019
Paper and paperboard material can be used for applications of a different kind, for example in packaging materials such as food packages. For food packages one important requirement are the barrier properties, which can mean the properties of the package which either block the pen-etrants from outside to find their way into the package or to block the penetration of food through the package. Barrier properties can include blocking or reducing the flow of water, oil or gases through the package.
The aim of this thesis is to study paperboard oil and grease resistance tests and factors af-fecting oil and grease penetration in paperboard. Based on the theoretical part the properties of oil, barrier and base paperboard affect how oil and grease penetrate in the paperboard. These factors include the surface tension, viscosity and chemical properties of the oil or grease, the properties of the barrier such and crystallinity, glass transition temperature and chemical proper-ties, and the properties of the base paperboard such and porosity and thickness. The quantitative determination of the different factors is difficult since there are several theories about fluid flow in paperboard. Paperboard in not homogeneous material, which must be considered when compar-ing different test methods and results.
In the experimental part different vegetable oils, such as olive oil and corn oil, and their surface tension and viscosity were studied. The crystallinity or chemical properties of the barrier were not studied, but different paperboard samples were tested. Besides surface roughness, thickness and surface free energy, the properties of paperboard were not studied in the experimental part.
From the different oil and grease resistance tests available, ASTM F119 -test and so-called KIT-test, which is meant for fluorochemically treated paperboard, were used as test methods. The paperboard samples were not fluorochemically treated and thus the defects caused by KIT-test liquid and its solvents on two latexes (SA-latex and SB-latex) were studied under stereomicro-scope and the damages to the paperboard were evaluated with SEM and OptiTopo. In ASTM F119 test the effect of temperature and relative humidity on different the penetration times for different oil and different samples were studied and compared with each other. Also making the interpretation of the ASTM F119 -test easier and possibly automate the test were tried to develop.
One of the targets was to find a test method which would be suitable for testing the quality during the production of reels quickly. Three different kind of test methods, Hercules sizing tester, Emco DPM ultrasound method and Cobb-Unger, were studied but none of these are at least not directly suitable for the quality control. Further tests are still needed. During the experimental part it was noticed that for barrier boards a fast test method should probably be an indirect method, in other words testing the barrier properties with plain oil or grease is not fast enough.
Keywords: barrier properties, oil and grease resistance, folded box board
The originality of this thesis has been checked using the Turnitin OriginalityCheck service.

ii
TIIVISTELMÄ
Anne Riekki: Öljyn ja rasvan kestävä kartonki – barrierominaisuuksiin vaikuttavat tekijät ja tes-timenetelmien vertailu Diplomityö Tampereen yliopisto Materiaalitekniikka Elokuu 2019
Paperi- ja kartonkimateriaaleja käytetään erilaisiin käyttötarkoituksiin, esimerkiksi pakkausma-teriaaleissa kuten ruokapakkauksissa. Ruokapakkauksissa yksi tärkeä tekijä on pakkauksen bar-rier- eli suojaominaisuudet, jotta joko tuotteen ominaisuuksia suojellaan siten, että ulkopuoliset tekijät eivät pääse pakkaukseen sisälle tai tuotteesta ei kulkeudu pakkauksen läpi mitään. Barrier-ominaisuuksia voivat olla esimerkiksi veden, öljyn tai kaasujen läpäisyn estäminen tai vähentä-minen.
Tämän diplomityön tarkoituksena on tutkia kartongin öljyn ja rasvan keston testejä ja tekijöitä, jotka vaikuttavat öljyjen ja rasvojen kulkeutumiseen kartongissa. Teoriaosuuden perusteella sekä öljyn, barrierin että pohjakartongin ominaisuudet voivat vaikuttaa öljyn ja rasvan kulkeutumiseen kartongissa. Näitä tekijöitä ovat muun muassa öljyn tai rasvan pintajännitys, viskositeetti sekä kemialliset ominaisuudet, barrierin ominaisuudet kuten kiteisyys, lasisiirtymälämpötila ja kemialli-set ominaisuudet sekä pohjakartongin ominaisuudet kuten huokoisuus ja paksuus. Erilaisten te-kijöiden kvantitatiivinen määrittäminen on hankalaa, koska erilaisia teorioita nesteen kulkeutumi-seen kartongissa on useita. Kartonki ei myöskään ole täysin homogeeninen materiaali, mikä on otettava huomioon testimenetelmiä ja tuloksia verratessa.
Käytännön osuudessa tutkittiin erilaisia kasviöljyjä, kuten oliiviöljyä ja maissiöljyä, ja niiden pintajännitystä ja viskositeettiä. Barrierin kiteisyyttä tai kemiallisia ominaisuuksia ei tutkittu, mutta erilaisia kartonkeja oli testattavana. Myöskään pohjakartongin ominaisuuksia sen pinnankarheu-den, paksuuden ja pintaenergian lisäksi ei käytännön osuudessa pystytty tutkimaan.
Öljyn ja rasvan keston testausmenetelmistä käytettiin ASTM F119 -testiä sekä niin sanottua KIT-testiä, joka on tarkoitettu fluorokemikaalikäsitellyille kartongeille. Tutkittavat kartongit eivät olleet fluorokemikaalikäsiteltyjä, joten KIT testiliuoksen aiheuttamia vaurioita kahdelle eri lateksille (SA-lateksi ja SB-lateksi) tutkittiin stereomikroskoopilla ja barrier-kartongin vaurioita arvioitiin SEM:llä sekä OptiTopolla. ASTM F119 -testissä lämpötilan ja suhteellisen kosteuden vaikutuksia sekä eri öljyjen läpäisyaikoja tutkittiin ja verrattiin toisiinsa. Myös ASTM F119 -testin tulkittavuu-den helpottamista ja mahdollista automatisointia yritettiin kehittää.
Yhtenä tavoitteena oli löytää tuotannon laaduntarkkailuun soveltuva nopea testimenetelmä tehtaan laboratorioon. Kolmea erilaista testimenetelmää kokeiltiin, mutta mikään näistä ei aina-kaan suoraan sovellu laaduntarkkailuun. Tässä vaaditaan vielä lisätestien tekemistä. Käytännön osuuden aikana havaittiin, että barrier-kartongeille tarkoitetun testimenetelmän tulisi luultavasti olla epäsuora menetelmä tehtaan laboratorioon, eli pelkän öljyn tai rasvan avulla ei barrier-omi-naisuuksien testaaminen onnistu riittävän nopeasti.
Avainsanat: barrier-ominaisuudet, öljyn ja rasvan kesto, taivekartonki
Tämän julkaisun alkuperäisyys on tarkastettu Turnitin OriginalityCheck –ohjelmalla.

iii
PREFACE
This thesis and the process behind it have made my knowledge about paper industry
deeper. Simultaneously, I have understood how much I still do not know about the indus-
try. The basics learnt at Tampere University of Technology will in the future carry me in
any field I decide to work in.
I want to express my sincere gratitude to my supervisors and instructors at MetsäBoard
and Tampere University. Almost weekly I got feedback from Riku Talja and I would like
to thank for taking the time for Skype meetings. I appreciate the flexibility of Terhi Saari
and the possibility to do some of the writing process in Tampere. I also want to thank
Terhi and Pekka Suokas for the instructions on the experimental part at Technology Cen-
tre, Äänekoski. I also value the comments and guidance from Jurkka Kuusipalo and Sanna
Auvinen for giving perspective from Tampere University.
The subject of the thesis was well defined and it was quite easy to start the thesis process.
It was always nice to come to work at TC and for that I want to thank all the laboratory
technicians and other workers. You always helped me without a question, unless these
questions took me further with my thesis.
And finally, thanks go to my family and friends who have supported me during my stud-
ies. Without extra-curricular activity I would not have enjoyed these four years as much.
Tampere, August 13, 2019
Anne Riekki

iv
CONTENTS
1. INTRODUCTION ................................................................................................ 1
2. PAPERBOARD PACKAGES ............................................................................... 2
2.1 Paperboard manufacturing .......................................................................... 2
2.2 Barrier properties of the paperboard and factors affecting them................... 6
2.3 Processing and converting of barrier paperboard ......................................... 7
2.3.1 Creating barrier properties by internal sizing or surface coating .... 8
2.3.2 Converting operations of paperboard ........................................... 11
3. GREASE RESISTANCE OF PAPERBOARD .................................................... 13
3.1. Liquid penetration models in a barrier treated paperboard ......................... 13
3.2 Paperboard properties affecting grease resistance ...................................... 16
3.3 Liquid properties affecting penetration ...................................................... 19
4. QUALITY CONTROL IN PAPERBOARD MILLS ........................................... 25
4.1 Generals aspects of quality testing in paperboard mills ............................. 25
4.2 Grease resistance testing of paperboard ..................................................... 26
5. EXPERIMENTAL PART ................................................................................... 30
5.1 Materials................................................................................................... 30
5.2 Methods .................................................................................................... 31
5.2.1 Technical measurements ............................................................. 31
5.2.2 Surface free energy ..................................................................... 31
5.2.3 Viscosity and surface tension of oils............................................ 32
5.2.4 ASTM F119 oil and grease resistance test ................................... 33
5.2.5 KIT grease resistance test ............................................................ 34
5.2.6 Hercules sizing tester .................................................................. 35
5.2.7 Cobb-Unger ................................................................................ 37
5.2.8 Emco DPM ultrasound ................................................................ 37
5.3 Results and discussion .............................................................................. 39
5.3.1 Technical measurements ............................................................. 39
5.3.2 Surface free energy ..................................................................... 40
5.3.3 Properties of the oils ................................................................... 41
5.3.4 ASTM F119 oil and grease resistance test ................................... 45
5.3.5 KIT grease resistance test ............................................................ 51
5.3.6 Hercules sizing tester .................................................................. 57
5.3.7 Cobb-Unger ................................................................................ 59
5.3.8 Emco DPM ultrasound ................................................................ 60
6. CONCLUSIONS ................................................................................................. 66
REFERENCES ........................................................................................................... 69
APPENDIX A: HARKINS-JORDAN CORRECTION FACTOR TABLE .................. 75
APPENDIX B: ASTM F119 RESULTS FOR BOARD 2 WITH DYED OLIVE OIL . 76
APPENDIX C: ASTM F119 RESULTS FOR BOARD 3 WITH DYED OLIVE OIL . 77

v
LIST OF ABBREVIATIONS
ASTM American Society for Testing and Materials
BS Back side of paperboard
CD Cross-machine direction
CEPI The Confederation of European Paper Industries
DHA Docosahexaenoic acid
DIM Diiodomethane
DPM Dynamic penetration measurement
EHA Eicosapentaenoic acid
FBB Folding box board
FSB Food service board
FTIR Fourier-transform infrared
GSM Grams per square meter
HST Hercules sizing tester
ISO International Organization for Standardization
L&W Lorentzen & Wettre
MC Machine direction
MUFA Monounsaturated fatty acid
OGR Oil and grease resistance
PE Polyethylene
PPS Parker Print-Surf
PUFA Polyunsaturated fatty acid
RH Relative humidity
SA Styrene-acrylate
SAF Saturated fatty acid
SB Styrene-butadiene
SCAN Scandinavian Pulp, Paper and Board Testing Committee
SEM Scanning electron microscope
SFA Saturated fatty acid
TAPPI Technical Association of the Pulp and Paper Industry
Tg Glass transition temperature
TGA Thermogravimetric analysis
TS Top side of paperboard
WBBC Water-based barrier coating

1
1. INTRODUCTION
Paperboard is a versatile material, which can be used in packaging applications of a dif-
ferent kind. But what if as food package in the store has poor printing quality, the package
has collapsed or it has wetted? The demands for paperboard packages vary from appear-
ance to performance properties. For example, printability can be affected by the surface
properties of paperboard. Physical properties can affect the flexibility or stiffness of the
paperboard. For food applications the barrier properties must be sufficient. (Kirwan 2012,
p. 4)
The barrier properties of paperboard can include a barrier against water, grease and oil
and gases such as oxygen or carbon dioxide (Kirwan 2012, p. 92). Depending on the
material and end-use requirements must food service boards have a barrier against several
penetrants. Barrier properties on paperboard can be achieved, for example, by dispersion
coating, extrusion coating, with fluorochemical or wax treatment (Kirwan 2012, p. 5).
Fluorochemical treatment affects the fiber and makes the surface free energy so low that
liquid penetrants cannot spread on the surface. On the other hand, dispersion and extru-
sion coating create a physical barrier on paperboard to block the flow of penetrants in the
board.
The focus of this thesis is oil and grease resistant paperboard and the test methods. Several
options for testing oil and grease resistance (OGR) are available, but the focus is on
ASTM F119 oil and grease resistance test. Also so called KIT-test is compared with
ASTM F119 test and it is studied how KIT-test solvents affect latexes and barrier board.
Factors affecting oil and grease penetration in paperboard are studied with ASTM F119
test. In the literature review are different liquid penetration theories studied and different
factors affecting the penetration presented. These factors include, among others, temper-
ature and humidity and their impact on the penetrant and barrier paperboard is studied in
the experimental part.
One aim in the experimental part is to find out if there is a better option for quality test in
the paperboard mill than KIT-test. There are limitations to the use of the possible new test
method. It should be fast, accurate, repeatable, free of interpretation and tell about the
quality of the barrier. For this Hercules sizing tester, Emco DPM ultrasound device and
Cobb-Unger tests were studied. Also other test methods found in the literature for evalu-
ating the oil and grease barrier level quickly are discussed.
2
2. PAPERBOARD PACKAGES
2.1 Paperboard manufacturing
Paperboard is a versatile material which is widely used in different packaging applica-
tions, but also in other purposes, such as in books. A large portion of paper and paperboard
produced is utilized as packaging material. (Kirwan 2012, p. 1) Total of 51 % of paper
and paperboard manufacturing in 2017 was used as packaging material. There has been
fluctuation in the quantity of paper and paperboard manufacturing as well as in the usage
of these materials as packaging material during the past ten years. During a few last years
the overall production and consumption of paper and paperboard material in general and
in packaging has been growing. (CEPI 2017)
The definition of paper and paperboard material is that is comprised of overlapping net-
work of cellulose fibers, which are bonded together to form a compact paper web. The
division between paper and paperboard is made based on the grammage and thickness,
although overlapping may occur. In an ISO 4046-4-standard board grammages start from
150 g/m2 and an upper limit has not been specified. In special cases the grammage of a
board can be as low as 100 g/m2. The thickness of the board has not been specified in the
ISO-standard, but paper board in general has higher thickness than paper. (Paulapuro,
2000, p. 55; Kirwan 2012, pp. 3–4; ISO 4046-4 2016)
Paperboard is consisted of one or several plies. When comprised of several plies paper
board is called a multi-ply product. Paperboard grades of a different kind and with differ-
ent properties are available. White lined chipboard, solid bleached board and liquid pack-
aging board are examples of boxboards used in several kinds of packaging applications.
These board grades have pigment coated top, which gives good printability and surface
properties. The middle layers can originate from virgin fibers or recycled fibers depend-
ing on the board grade, and pulp, the raw material of paper and paperboard, can be chem-
ically or mechanically treated. Also corrugated board and special board grades are avail-
able. As an example, folding boxboard (FBB) is widely used in food packaging, pharma-
ceuticals and in cosmetics whereas corrugated board can be used as a secondary package
in storage or distribution. (Paulapuro, 2000, pp. 58–70, Kirwan 2012, pp. 22–24)

3
FBB is typically made of three or four plies. FBB can be surface sized on the top side or
on the top and back side. Figure 1 shows the structures of uncoated Natural FBB and a
food service board (FSB) with coating on top and back side (Metsä Board Products). Both
of their paperboards are constructed of three plies. The middle ply is mechanical pulp
between the top and back plies made of bleached chemical pulp. The middle ply can also
additionally be chemically treated to give the back side of the board a lighter shade. (Pau-
lapuro, 2000, pp. 58–59; Kirwan 2012, p. 23)
Before the paper and paperboard manufacturing process in the paper or board machine
can begin the pulp must be made. Paper and paperboard can be made of different fibers,
which can originate from hardwood, softwood or non-wood plants. Different woods pro-
duce fibers with different properties. For example, the fiber length can vary from being
under 1 mm or over 7 mm. Wood can be mechanically or chemically pulped and bleach-
ing and refining operations are also performed. All these steps affect the pulp properties
and eventually also the paperboard properties. (Niskanen 2008, pp. 61–68)
There are different ways to extract the fiber material from the wood during pulping. Me-
chanical pulp and chemical pulp are examples of pulps originating from different pulping
processes. (Niskanen 2008, p. 68). Refining done during the pulping process leads to sev-
eral bonding sites in the fiber since fiber surface and the fiber cell undergoes deformation.
Refining affects the pore size in paper and paperboard by making the pores smaller. (Rasi
2013, Gigac et al. 2018) Pulp can also be bleached to produce white paper products as is
the case with MetsäBoard products.
Figure 1. The structure of two MetsäBoard products: MetsäBoard Natural FBB on
the left and MetsäBoard Prime FSB EB1 on the right. The layers in the Natural FBB
are 1) bleached chemical pulp 2) bleached chemi-thermo-mechanical pulp (BCTMP)
and 3) bleached chemical pulp. The middle layers (2-4) of Prime FSB EB1 are the
same but the top side is 1) double blade coated, and the back side has 5) special bar-
rier treatment. (Metsä Board Products)

4
The paper and paperboard manufacturing process consist of several steps. In the paper
machine the first part is the forming section, which can also be called a wet section or a
wet end. Wet end comprises of headbox, wire section and press section. Wet end is fol-
lowed by dry end consisting of drying section, sizing and coating section including an-
other drying section, calendering, reeling and optionally winding. (Holik 2006, pp. 254–
309) The different sections of the paper machine are shown in Figure 2.
In the forming section, suspension containing pulp, chemicals, fillers and additives is fed
to the headbox. Internal sizing agents, it is additives of different kind, make the paper web
usually more hydrophobic. The purpose of internal sizing is to alter the surface of the
fibers to control the liquid penetration into the paper and paperboard. Sizing chemicals
can make the fibers for example hydrophobic and reduce the penetration of aqueous liq-
uids. (Holik 2006, pp. 80–88) Also oleophobic surface can be created with internal sizing.
Internal sizing chemicals are distributed throughout the sheet and thus are less prone to
abrasion, creasing and folding compared with surface coating (Deisenroth et al. 1998).
The suspension at the headbox has a solid content of 0.1 to 1.5 % depending on the paper
or paperboard grade. After the headbox, the suspension forms a fiber web on a wire. Wa-
ter is further removed from the suspension by filtration and thickening. After this step,
the solid content is 18–20 %. The orientation of the fibers is determined here, and it can
have a significant role in the properties of the final product. Fibers orientate in the ma-
chine direction (MD). (Holik 2006, pp. 254–272)
In the press section, the solid content of the paper web is further increased by compres-
sion. Here the paper web is transported by felts. The paper web is pressed between nips
Figure 2. Paperboard process line showing different stages of board manufacturing
(MetsäBoard internal).

5
and it is required to have constant pressure on a nip to obtain a uniform moisture profile
in the cross-machine direction (CD). Solid content can be even above 50 % after press
section. (Holik 2006, pp. 275–280; Paulapuro 2008, pp. 355–360) Paper and paperboard
properties affected in the press section are for example smoothness, porosity, absorption
properties, density, stiffness and surface strength. For paperboard packages especially
stiffness, internal bond and absorption properties are key properties. (Paulapuro 2008,
pp. 364–365)
From the wet end the paper or paper board is moving from the press section into the first
drying section at the dry end. Drying of the base paper is performed in the dryer section
by evaporation. (Holik 2006, pp. 280–283) After drying paper or board can be surface
sized. Surface coating can increase the strength of the paperboard and modify the surface
chemistry and surface porosity. Moreover, stiffness can be increased, the printing prop-
erties of the board improved and optical properties enhanced. Surface coating can also be
used to reduce the penetration of liquids into the board. (Holik 2006, p. 291; Paltakari
2009, pp. 12–13) The properties achieved by surface coating depend on the chemicals
used. Optical brighteners improve the whiteness of the paper whereas alkyl ketene dimer
(AKD) improves the hydrophobicity. (Holik 2006, p. 242) Surface coating can in some
cases also be performed outside the paper machine, for example in off-line dispersion
coating (Kuusipalo 2008, p. 67).
Paper must be dried after surface coating. The techniques are different in comparison with
the previous drying section. Air impingement and infra-red drying methods are used. It is
also possible to combine these two drying methods. (Häggblom-Ahnger & Komulainen
2001, pp. 200-202)
Calendering and reeling sections are the last parts of the paper machine. Paper can be
calendered to achieve good surface properties before the paper is reeled and winded. Cal-
endering section consists of rolls which press the paper or paperboard between them in
the nip. Calendering creates a smooth surface and gloss on the paper. Also, the thickness
of the paper becomes more uniform. (Holik 2006, pp. 294–295) In reeling, the final prod-
uct is rolled onto a reel drum. (Holik 2006, p. 309) The reel is then moved to the winder
section where smaller customer rolls can be slit. (Holik 2006, p. 383)
Paperboard is inhomogeneous, anisotropic and hygroscopic material. Fibers, fillers and
pores cause the inhomogeneous nature of paperboard. Processing of the paperboard
makes it anisotropic, which means that the properties of the paperboard are different in
different directions. For example, the stiffness is influenced significantly by the fiber ori-
entation. The hygroscopic nature of the paperboard causes it to absorb or release moisture
depending on the relative humidity and the temperature. (Holik 2006, p. 447)
Paperboard can be used in different packages as a primary, secondary or tertiary package
to protect the product. Different criteria need to be fulfilled, such can be to protect the

6
product from mechanical damage or deterioration, or to provide graphical and structural
designs. Paperboard undergoes different treatments before the final package is ready.
Such treatments can be printing, cutting, creasing, folding, gluing and many more. (Kir-
wan 2012, p. 4)
2.2 Barrier properties of the paperboard and factors affecting
them
Paperboard itself does not have very good properties against penetrants such as moisture,
oxygen, aroma and grease. Barrier properties can refer to protecting the product from
outside penetrants or the loss of features of the product when something penetrates from
the product through the packaging material outside of the package. (Holik 2006, p. 100)
For example, the package can protect the product absorbing moisture from outside the
package or keep the moisture inside the package. Potato chips and cakes are examples of
products demanding different kind of moisture control. Potato chips must be kept dry
whereas cakes need to be protected against moisture loss. Cake and chips must also be
packed in a greaseproof package to prevent oil and grease from the product penetrating
the package. (Kirwan 2012, pp. 96–98)
The fibers of paperboard are made of cellulose, which is a polar molecule. The structure
of a cellulose molecule is shown in Figure 3. It could prevent the penetration of hydro-
phobic substance, such as oils, due to its hydrophilic nature, but it is a poor barrier against
hydrophilic substances like water. And in practice paperboard still needs to be treated to
achieve the desired barrier properties against penetrants. (Ovaska 2016) Carboxymethyl
cellulose, which is a cellulose derivative, can be used in coating to increase the grease
resistance of board, but special barrier treatments are also available (Holik 2006, p. 108).
Figure 3. The chemical structure of cellulose.
There are several different types of penetrants and different materials and methods for
obtaining suitable barrier properties. A complete barrier is not always needed but instead
the appropriate type and amount of the barrier material must be applied depending on the
end use requirements. Water, gases, oil and grease are the common penetrants that differ-
ent barrier materials are needed for especially in applications for food packaging. When

7
considering the packaging materials barrier properties, the shelf life of the product must
be considered too. Sometimes the period of how long the package must protect a food
product can be over a year. But for example, in the case of hamburger clamp shells, the
package can be used just for a few minutes and the barrier does not have to be as effective
as if the hamburgers were kept at the package for days. (Kirwan 2012, pp. 96–99; Kirwan
2012, p. 315)
The fillers and additives used in paperboard manufacturing can increase or decrease the
barrier properties. For example, depending on the nature of starch added at wet-end, the
grease barrier can be improved. Hydrophobic starch creates higher oil barrier than water-
soluble starch. Talc, as an example, is also one additive which can improve barrier prop-
erties of paperboard. (Yang et el. 1999; Ovaska, 2016)
Paperboard is a hygroscopic material and the moisture content depends on relative hu-
midity and the temperature. There is also a hysteresis phenomenon related to the alternat-
ing temperature and humidity. Hysteresis in this case means that the moisture content is
different depending if the paperboard is absorbing water or desorbing it. When paper has
been stored under normal conditions — 50 % relative humidity and temperature of 23 °C
— is the moisture content between 5 % to 10 %. For FBB, the minimum moisture content
should be approximately 6-7 %. Unbleached or bleached fibers can have different mois-
ture content as well as paper made of chemical pulp compared with mechanical pulp.
(Casey 1961, pp. 1440–1443; Niskanen 2008, pp. 266–269)
Fibers become more flexible when the relative humidity increases This improves the fold-
ing endurance of paperboard. (Casey 1961, p. 1446) Creasing and folding of the paper-
board package is affected by the folding endurance and thus it may influence the barrier
properties of the final paperboard package. Higher humidity increases the moisture con-
tent in the paperboard. This leads to a decrease in porosity which eventually can reduce
the oil permeability and make the oil barrier properties of paperboard better (Casey 1961,
p. 1447).
It has been stated that the temperature does not have significant effect on the physical or
chemical properties of paperboard although it can have some effect on the physical prop-
erties. The temperature can affect the relative humidity, which is more important factor
when considering the paperboard properties. (Casey 1961, p. 1256)
2.3 Processing and converting of barrier paperboard
When the final paperboard package is used in a barrier application, it has undergone sev-
eral processes. First the paperboard is manufactured and the barrier properties in the paper
machine can be achieved by internal sizing or surface coating. Also, the properties of the
fibers, their orientation in the board, drying of the board and calendering can affect the
barrier properties. Surface coating can also be made in an external process. Additionally,

8
the paperboard package goes through different converting operations: creasing, folding,
side gluing, heat sealing, embossing and printing (Kirwan 2012, pp. 277–294). These pro-
cesses can affect the barrier properties, usually the barrier properties are weakened in
these processes.
2.3.1 Creating barrier properties by internal sizing or surface
coating
Barrier properties against oil and grease penetration can be achieved by creating either a
low-energy surface which can repel oil or a tortuous physical barrier. By a physical barrier
the penetration of fluids can be prevented or reduced, for example, by minimizing the
pores in the paperboard structure and closing the pores on the surface. It is also possible
to alter the oil penetration speed by changing the fiber composition, but this is not con-
sidered as internal or surface coating, which are discussed next. (Ovaska 2016; Gigac et
al. 2018)
Barrier properties are achieved in the sizing processes. Sizing can be internal sizing or
surface coating. (Alén 2007, p. 98; Deisenroth et al. 1998) Sizing is a process where
chemical additives are applied to make paperboard resistant to the penetration of water,
oils, solvents or gases. Without sizing, the hydrophilic and porous cellulose fibers would
imbibe, for example, water is seconds. (Alén 2007, p. 124; Kuusipalo 2008, p. 98)
Internal sizing can be done with different chemicals. Barrier against water is often a de-
sired function and rosin acids, alkyl ketene dimer or alkenyl succinic anhydride, are com-
monly used. For more specific barrier products waxes, sodium stearate and fluorochemi-
cals are used. (Alén 2007, p. 124)
Fluorochemicals generate grease barrier on paperboard. Fluorochemicals can be applied
to the pulp in the wet end (internal sizing) or at the size press (external sizing or coating).
(Deisenroth et al. 1998; Yang et al. 1999) Fluorochemicals are hydrogen bonded to the
cellulose fiber of paperboard and they generate a chemical barrier on the paperboard as
an opposite of a physical barrier of dispersion or extrusion coating. They lower the surface
energy of the fibers, which can be seen in paperboard having lower surface energy too,
and cause oil or other liquids not to spread on the paperboard surface. Fluorochemicals
do not affect the porosity or the flexibility of the paperboard or create a film on it since
fluorochemicals only alter the surface of the fibers. (Gigac et al. 2018)
Different fluorochemicals have been used but they have a perfluoroalkyl functional group
to provide the oil repellency (Deisenroth et al. 1998, Moody & Needles, 2004). A struc-
ture of one fluorochemical molecule is seen Figure 4. The low surface energy of the flu-
orochemically treated paperboard inhibits wetting and makes the surface repellent to oil
and also to other fluids. This is due to the high contact angle between the oil and paper-
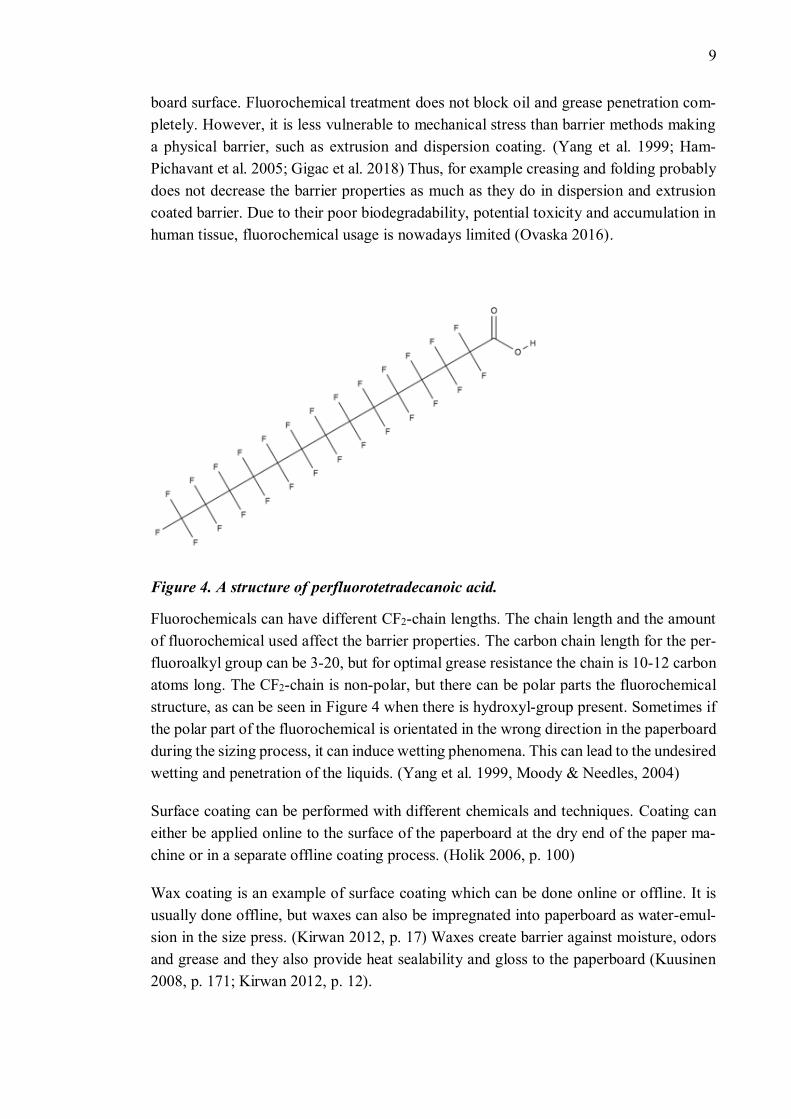
9
board surface. Fluorochemical treatment does not block oil and grease penetration com-
pletely. However, it is less vulnerable to mechanical stress than barrier methods making
a physical barrier, such as extrusion and dispersion coating. (Yang et al. 1999; Ham-
Pichavant et al. 2005; Gigac et al. 2018) Thus, for example creasing and folding probably
does not decrease the barrier properties as much as they do in dispersion and extrusion
coated barrier. Due to their poor biodegradability, potential toxicity and accumulation in
human tissue, fluorochemical usage is nowadays limited (Ovaska 2016).
Figure 4. A structure of perfluorotetradecanoic acid.
Fluorochemicals can have different CF2-chain lengths. The chain length and the amount
of fluorochemical used affect the barrier properties. The carbon chain length for the per-
fluoroalkyl group can be 3-20, but for optimal grease resistance the chain is 10-12 carbon
atoms long. The CF2-chain is non-polar, but there can be polar parts the fluorochemical
structure, as can be seen in Figure 4 when there is hydroxyl-group present. Sometimes if
the polar part of the fluorochemical is orientated in the wrong direction in the paperboard
during the sizing process, it can induce wetting phenomena. This can lead to the undesired
wetting and penetration of the liquids. (Yang et al. 1999, Moody & Needles, 2004)
Surface coating can be performed with different chemicals and techniques. Coating can
either be applied online to the surface of the paperboard at the dry end of the paper ma-
chine or in a separate offline coating process. (Holik 2006, p. 100)
Wax coating is an example of surface coating which can be done online or offline. It is
usually done offline, but waxes can also be impregnated into paperboard as water-emul-
sion in the size press. (Kirwan 2012, p. 17) Waxes create barrier against moisture, odors
and grease and they also provide heat sealability and gloss to the paperboard (Kuusinen
2008, p. 171; Kirwan 2012, p. 12).

10
In dispersion coating water-based barrier coatings (WBBC) are used in obtaining barrier
properties for paperboard. WBBC is water-based dispersion containing fine polymer par-
ticles, this mixture is called latex. Besides latex, WBBC consists of different additives
and fillers, such as stabilizers, thickeners and emulsifiers. Dispersion coating can be done
online or offline and is not limited as extrusion coating when considering the speed of the
process. (Kuusipalo 2008, pp. 60–62)
WBBC contain 10-20 components including the polymer, several additives and fillers.
The polymers used can be polyacrylates, polystyrene, polybutadiene, polyvinylacetate
and polyolefins. Fillers and additives are added to improve the barrier properties but also
to increase the runnability, blocking resistance, optical properties and to lower the costs.
Dispersion coating produces barrier film by water evaporation, dense packing and coa-
lescence. It is favorable to have non-foaming latex to avoid pinholes and voids. (Kuusi-
palo 2008, pp. 61–65)
Examples of common barrier dispersion polymers are styrene-butadiene and styrene-
acrylate, which structures are shown in Figure 5. Other synthetic polymers and biopoly-
mers are also used in dispersion coatings and they can provide different properties on the
paperboard. For example, polyvinylidene chloride provides oxygen and grease barrier
and is also heat sealable (Kirwan 2012, p. 99). The mixture of the polymer typically has
a water-insoluble polymer with higher concentration and a water-soluble polymer with
lower concentration. The molecular weight, molecular weight distribution, Tg, viscosity
and surface tension are a few of the factors affecting the coating properties and process.
For example, a lower Tg results in greater thermoplasticity and more flexible polymer
matrix, which can help in creasing and folding the final product, but can lower the barrier
properties. (Kuusipalo 2008, p. 75–81)
Online and offline dispersion coating machines have different advantages. Offline coaters
have been dominating the field since they have more controllable coating and web han-
dling and the possibility to treat a cold web. The web breaks do not affect offline coaters,
Figure 5. Chemical structure of styrene-butadiene and styrene-acrylate.

11
whereas on-line coating efficiency is lowered due to web breaks. On the other hand,
online coaters increase production capacity by minimizing material losses and reduce in-
vestment costs and cause savings in operating time and labor input. (Kuusipalo 2008,
p. 67)
Extrusion coating is done offline and thus it needs a separate coater (Kuusipalo 2008,
p. 62). Paperboard can be coated with polyolefins like polyethylene (PE) or biodegradable
polymers such as polylactide (PLA) or polyhydroxyalkanoates (PHA). Like in dispersion
coating also in extrusion coating different polymers provide different properties on pa-
perboard. Some of the polymers provide good gas and aroma barriers whereas some of
the polymers have good moisture barrier properties and are heat sealable. (Kuusipalo
2008, pp. 149–152)
An advantage in extrusion coating compared with dispersion coating is that there is no
need for solvents or drying of the coating. Also the barrier can be pinhole-free and have
better barrier properties compared with a barrier produced by dispersion coating. If ex-
trusion coated board is meant to be recycled, the plastic can be separated with a special
technique before recycling the base board for pulp, but the recycling process is difficult.
(Kuusipalo 2008, p. 158; Gigac et al. 2018)
2.3.2 Converting operations of paperboard
Converting the paperboard material into a package can include cutting, creasing and fold-
ing, for instance. (Kirwan 2012, p. 281) Creasing makes a groove in the paperboard to
make bending or folding easier along a defined line (Kirwan 2012, p. 280). Creasing
causes plastic deformation in the paperboard, which means that it is permanent and unre-
coverable. The board delaminates into thin layers, which is a desired outcome of the
creasing process. Undamaged layers are the goal but since the z-direction strength in the
paperboard is low will also internal delamination occur. The width and depth of the
groove influence the outcome. Additionally, the multi-layer and high bulk boards are eas-
ier to crease. The fiber orientation and creasing direction also influence the result. (Kuusi-
palo 2008, pp. 253–256)
Tension, compression and shear forces occur in different places in the creasing zone. In
the top and bottom of the board compression and stretching occur. If the top or bottom
layer is an elastic material, such as dispersion coating, will the material deform without
cracking. Penetration of fluids can happen faster if paperboard or coating has deformed
such that new paths to fluids are formed. This can happen when creasing has not been
completely successful or depending on the creasing direction, fiber orientation, gram-
mage and stiffness of the paperboard and many other factors. (Kuusipalo 2008, pp. 255–
256)

12
In package forming creasing is followed by folding. Folding further increases internal
delamination in the paperboard. (Kirwan 2012, p. 290) When creasing and folding has
been performed in MD the barrier properties are weakened more than when creasing is
made in CD due to the fiber orientation. The angle on folding can also affect the barrier
properties, the bigger the folding angle is the more harmful delamination can occur and
result in lower barrier properties.
Package can be closed by sealing or gluing. Heat sealing involves high temperatures
whereas cold sealing is done with high pressure. Both require suitable surface coating on
paperboard. (Kirwan 2012, p. 95) Separate adhesives can be added in side seam gluing.
The adhesion is achieved similarly to sealing by pressure or heat, but the adhesive is
added in a production line to the paperboard. (Kirwan 2012, pp. 294-295) When heat is
applied during the package forming processes, can the barrier properties be weakened.
High temperature can melt the barrier coating and locally the thickness of the barrier is
not as high as it should be.
Paperboard packages can have several other converting processes, including printing, la-
belling, embossing and windowing. Different printing methods are available, for example
digital, flexographic and gravure printing, and printing is often the first step of converting
the paperboard package (Kirwan 2012, pp. 30-31). Embossing produces a relief on the
surface of the package. The process can be compared with creasing since similar forces
are created. (Kirwan 2012, p. 292)

13
3. GREASE RESISTANCE OF PAPERBOARD
3.1. Liquid penetration models in a barrier treated paperboard
The transportation of a fluid in a paperboard substrate or through it involves several steps.
Raymond (2004) has presented several theories from different researchers on how fluid
interacts with paper. Most of the theories start from wetting phenomenon. Fluid must be
absorbed onto the surface of the substrate and surface wetting must occur before the flow
of the fluid can take place. The flow of a fluid in a substrate can be called penetration or
permeation. Penetration and permeation are sometimes used as synonyms, but permeation
can be defined as a fluid moving through a porous substrate whereas penetration is a
process where fluid makes its way into the substrate. The transportation of a fluid through
the paperboard can happen with diffusion or capillary forces and also the possibility of
the fluid to dissolve the substrate need to be considered. Finally, when the fluid has trav-
elled through the substrate it can be desorbed from the surface. (Kuusipalo 2008, p. 289;
Rance 1988, p. 62; Raymond 2004; Rasi 2013; Sperling 2006, p. 172)
The first step of the fluid transportation is surface wetting. The contact angle between the
fluid and substrate defines if wetting will occur. Only if the contact angle is small enough
can wetting take place and penetration or permeation can occur. (Rance 1988, pp. 61–63)
In Figure 6 are shown three possible wetting phenomena. In Figure 6A is seen partial
wetting when the contact angle between the liquid and solid surface is under 90°. In
Figure 6B is seen complete wetting and in Figure 6C complete dewetting. (Bormashenko
2013, pp. 13–14) In the case of partial or complete wetting can penetration and thus trans-
portation occur.
Figure 6. The wetting phenomena A) partial wetting, B) complete wetting, C) complete
dewetting and D) contact angle θγ determination (Adapted from Bormashenko 2013).

14
The contact angle Y can be determined from Young equation
𝑐𝑜𝑠𝜃𝑌 =𝛾𝑆𝐴 − 𝛾𝑆𝐿
𝛾, (1)
where SA, SL and are the surface tension at solid/air, solid/liquid and liquid/air inter-
faces respectively (Bormashenko 2013, p. 16).
The contact angle, which can be measured, defines whether spreading occurs or not. The
spreading parameter, also shown in Figure 6D, is
𝜓 = ��𝑆𝐴∗ − (��𝑆𝐿
∗ + ��𝐿𝐴∗ ), (2)
where ��𝑆𝐴∗ and ��𝑆𝐿
∗ are the specific surface energies at the solid/air and solid/liquid inter-
phase and ��𝐿𝐴∗ is the surface free energy, of the liquid/air interphase. The spreading pa-
rameter can be presented also with surface tensions if there is no difference in surface
tension and surface free energy. (Bormashenko 2013, pp. 13–14) It can be seen from the
equation that if the surface energy ��𝑆𝐴∗ is low and the surface energy of liquid ��𝐿𝐴
∗ is high,
the spreading parameter will be negative, and no wetting occurs. In other words, low
surface energy (or surface tension) liquids will wet surfaces with high surface energy.
For paper and paperboard Darcy’s law can be used to define the fluid flow. Darcy’s law
describes the fluid flow through porous media. The flow rate is proportional to the pres-
sure drop across the paperboard or other porous sample. The volume flow rate over unit
area is
𝑞 = −𝐾∆𝑝
𝐿, (3)
where K is permeability coefficient, ∆p the total pressure drop over the sample length L.
(Niskanen 2008, pp. 275–276)
Since the viscosity () of the penetrating liquid and the porosity () of the paperboard
affect the flow rate, can Darcy’s law be rewritten
𝑞 = 𝐾𝑣∆𝑝
𝜂𝐿=
𝜙3𝑑𝑒𝑓𝑓2
36(1− 𝜙)2𝜅
∆𝑝
𝜂𝐿, (4)
where Kv is replaced with the Kozeny-Carman equation, where deff is the effective particle
diameter in a uniform bed of packed particles and is the Kozeny constant. (Niskanen
2008, pp. 275–276)
As discussed earlier, paperboard is an anisotropic material and the permeability differs in
different directions. The Kozeny-Carman equation can be expressed in MD (Kv,x), CD
(Kv,y) and z-direction (Kv,z). The permeability in the z-direction, through the thickness

15
direction, is the smallest. (Niskanen 2008, p. 276) The same phenomenon was observed
in Hyväluoma et al. (2006) research where the liquid spread faster in the planar direction
than in the transverse direction.
The permeation of a fluid into paperboard can take place by capillary flow into capillaries.
Lucas-Washburn equation quantifies this interfiber permeation, although assuming the
flow being driven only by surface tension while the gravity effects are negligible. The
Lucas-Washburn equation and the rate of penetration is
𝑑ℎ
𝑑𝑡=𝑟𝛾𝑐𝑜𝑠𝜃
4𝜂ℎ, (5)
where h is the distance travelled over time t, r is the capillary radius, the surface tension,
the contact angle between the liquid and the capillary wall and η the viscosity of the
fluid. (Niskanen 2008, pp. 279–280)
Paperboard can be coated with non-porous substrate to form desired barrier properties.
(Kuusipalo 2008, p. 60). In such case or if diffusion happens through the fibers will Fick’s
first law describe the penetration through the coating or fibers. (Raymond 2004; Kuusi-
palo 2008, pp. 288–291)
The diffusion flow (J) through the unit area of a non-porous layer is
𝐽 = −𝐷𝑑𝑐
𝑑𝑥, (6)
where D is the diffusion coefficient, c the concentration of the penetrant and x the thick-
ness of the non-porous layer (Kuusipalo 2008, p. 289). This in known as Fick’s first law
of diffusion under steady-state diffusion (Sperling 2006, p. 173).
The rate of diffusion is affected by several factors such as the temperature, size of the
penetrant molecule and the free volume of the substrate. The higher the temperature or
the smaller the penetrating molecule is the higher is the rate of penetration. (Sperling
2006, p. 174-177)
Permeation and penetration in a polymer-based coating depend on the properties of the
penetrating fluid and the properties of the polymer. Besides diffusivity must also the sol-
ubility of penetrant into paperboard and polymers be considered. Also, the polarity, crys-
tallinity, orientation and Tg (glass transition temperature) of the polymer affect the per-
meability. (Sperling 2006, pp. 172–173) These factors can be implied on coatings of dif-
ferent kind having polymer particles, for example dispersion coatings such as styrene-
butadiene or styrene-acrylate coatings or polyethylene extrusion coating.
Moisture can plasticize a polymer used in paperboard coating. Plasticizing can cause de-
crease in Tg or reduce the crystallinity of the polymer. (Sperling 2006, p. 19) It has also

16
been stated that moisture plasticizes cellulose fibers and the outcome for fluid penetration
is similar to the case of polymer plasticization. The penetrating substance can also plasti-
cize the polymer coating (Kuusipalo 2008, p. 292) Plasticization increases the free vol-
ume and thus diffusion occurs faster. This means that the Tg of the polymer is one of the
factors determining the diffusion properties. Above Tg diffusion happens faster than be-
low Tg (Sperling 2006, p. 173).
The lower the free volume inside the polymer network is the slower the penetration oc-
curs. It is advantageous to have a coating with high crystallinity since crystalline areas
have less free volume than amorphous areas when considering the barrier properties.
(Sperling 2006, p. 175) High crystallinity and low Tg on the other hand can make polymer
to act glassy and brittle and make processing more difficult.
If the polymer used in the coating process is non-polar, the coating is a barrier against
polar penetrants, water vapor for example. Polar coatings, PVOH for example, on the
other hand can block or slow down the penetration of non-polar molecules such as oxygen
and carbon dioxide. As a conclusion the penetrant and the polymer used in coating need
to have opposite chemical properties in a barrier application. (Alén 2007, p. 124; Kuusi-
palo 2008, p. 67; Kuusipalo 2008 p. 98) Oil as an amphiphilic molecule has polar and
non-polar groups in the structure. The long alkyl chain is nonpolar; thus, a polar molecule
in the coating could have better barrier properties against oils than non-polar molecule.
It has been stated that diffusion through fibers is a faster process than the capillary flow
in a sizer paper whereas in unsized paper these two processes and their rate could not be
separated. On the other hand, it has also been stated that the flow through defects, pinholes
for example, can be greater than the diffusional flow in intact polymer films. The equa-
tions and theories presented above do not completely describe the phenomenon of paper-
board permeability. Diffusion and capillary flow are not the only theories about how fluid
can flow in paper or paperboard. At least vapor phase movement through the pores or the
liquid movement by various processes through the fibers have also been presented. (An-
dersson et al. 2002; Raymond 2004)
With some other porous materials than paper and paperboard, the permeability does not
vary much within certain porous material or even material class. In paperboard the fiber
properties, size, flexibility and surface structure, as well as homogeneity of the fiber web
and interactions between fibers and fluid affect the flow in paper or paperboard in a dif-
ferent manner. The variation in the permeability can be substantial. (Rasi 2013)
3.2 Paperboard properties affecting grease resistance
In this section the properties of paperboard substrate as well those of coating are explained
regarding the grease resistance. The technical properties of paperboard, such as thickness,
17
porosity and surface roughness are presented and the effect of temperature, humidity and
converting are also explained.
Surface roughness is the unevenness of the paperboard surface (Niskanen 2008, p. 94).
Roughness also affects the spreading and wettability by affecting the hydrophobicity and
hydrophilicity of the paperboard (Ovaska 2016). Roughness can also be considered as
surface porosity (Rance 1982, p. 242). The coating on paperboard can reduce the porosity
on the paperboard surface. High surface roughness leads to bigger potential bonding area
but at the same time roughness can delay the rate of spreading leading to reduced wetting
and penetration (Kuusipalo 2008, p. 39).
Surface roughness of paperboard affects what kind of model best describes the wetting
phenomena discussed earlier. The Wenzel model describes the wetting of rough, chemi-
cally homogeneous surface. Cassie-Baxter model describes the wetting of heterogeneous
surfaces and is more complex that the Wenzel model. Wenzel equation tells that the ap-
parent contact angle is
cos 𝜃∗ = 𝑟𝑐𝑜𝑠𝜃𝑌 , (7)
where r is the roughness ratio of wet surface, more precisely the true contact area with
the liquid divided by the apparent area, and Y the Young contact angle defined for an
ideal surface. (Bormashenko 2013, pp. 92–96)
Porosity describes a material containing holes. Porosity is defined as a relationship be-
tween the volume of the entire sheet defined by the volume occupied by fibers and this
relationship is subtracted from 1. (Niskanen 2008, p. 20) The volume of an individual
pore can vary significantly, and the pore size distribution can also affect the paperboard
properties. Pores can further be divided into interfiber pores and intrafiber pores. Perme-
ability is mostly governed by interfiber pores. Interfiber properties are influenced by the
origin of the fiber and the pulp treatment. For example, refining can reduce the interfiber
porosity by 30–60 % compared with unrefined pulp. Typically, the reduction happens
with the larger interfiber pores. (Rasi 2013)
Pore size can affect the penetration, especially when considering coated products. Larger
amount of smaller pores compared with smaller amount of large pores can cause faster
penetration since there are more ways to penetrate through the pores. For barrier paper-
board this might have a negligible effect. (Ovaska 2016)
Pinholes in the coating can have a significant outcome on barrier properties. Any discon-
tinuity can lower the barrier properties and pinholes are one of the possible discontinui-
ties. Depending on the coating process, pinholes can occur due to gases, air bubbles or
contaminants in the coating substance, for example in the dispersion coating. Especially
if the coating is thin, can uneven and rough paperboard web surface cause microperfora-
tions in the coating layer and too low coating thickness. Also, fibers on the paperboard

18
substrate surface can puncture the coating. If the coating thickness is low (5–15 µm),
pinholes have a significant effect by lowering the barrier properties of the coated paper-
board. As an example, with laminated aluminum foil 7 µm coating has one order of mag-
nitude more pinholes compared with 12 µm thick foil. (Kuusipalo 2008, p. 98; Kuusipalo
2008, p. 136)
The surface energy affects the wettability as seen in Equation 2 and in Figure 6. For ex-
ample, a fluorochemical treatment lowers the surface energy of the paperboard and the
surface energy can be below 10 mN/m. With fluorochemicals when the chain length in-
creases the surface energy decreases. Also, different coatings lower the surface energy
compared with untreated paperboard. Ovaska studied that uncoated reference had the sur-
face energy of 47 mN/m, board coated with starch-talc (95:5) 45 mN/m, PET-coated
board 41 mN/m and board with starch-talc-latex (70:30:10)-coating 39 mN/m. (Ovaska
2016; Yang et al. 1999)
Thickness of the coating is inversely proportional to the permeability of the film if per-
meation happens through diffusion. Fick’s first law (Eq. 6) also states this. If the coating
layer is thin, also pinholes can affect the barrier properties significantly and increase oil
penetration in comparison with coating having no pinholes and voids. (Kuusipalo 2008,
pp. 292–295)
The temperature and moisture change the properties of cellulose and thus lead to changes
at least in paper and paperboard mechanical properties. The increase in relative humidity
leads to an increase in the moisture content of paperboard. It was studied that in compar-
ison with low humidity the contact angle of penetrating liquid decreased significantly
when tested at high relative humidity. The increase in the temperature had a similar effect.
Of course, the temperature of the test liquid affects the results also through lower viscos-
ity, and criticism has been presented since paper surface is so heterogeneous and there
were large variations in the results. But the effect of the temperature and humidity on
barrier properties cannot be ignored. (Rance 1980, pp. 62–66)
There are not many studies about paperboard barrier properties at different relative hu-
midity or temperature. Wang et al. (2018) studied that for water vapor the humidity affects
such that the water vapor transmission rate is usually the lowest at 50 %RH and increases
significantly with increasing relative humidity. When considering polymer properties, the
increase in humidity can either increase oxygen permeability through polymer film or
have no effect. For cellulose nanomaterials Wang et al. studied that oxygen permeability
increases with increasing relative humidity and above 65 %RH the increase is exponen-
tial.
Paperboard undergoes different converting processes before it is turned into a package.
These processes can have an influence on the barrier properties. For example, creasing,
folding and sealing are common process steps in a package forming process as presented

19
earlier. All these can locally decrease the barrier properties of paperboard. Printing or
lacquering on the other hand can create a surface on paperboard and enhance the barrier
properties. (Kuusipalo 2008, pp. 250–273; Kirwan 2012, p. 4)
Creasing causes local delamination and deformation in the paperboard and coating. Dif-
ferent forces of creasing can open new pathways in the paperboard. This decreases OGR
since there is more free space for the oil to penetrate through the substrate. It has been
studied that with some coatings creasing can cause the paperboard package to have no
improvement in grease resistance compared with non-coated paperboard. Also, creasing
made in machine direction leads to lower grease resistance than cross direction creasing.
Folding can further decrease the barrier properties. (Kuusipalo 2008, pp. 252–255;
Ovaska 2016)
Heat sealing can locally have a major effect on the grease barrier properties. In heat seal-
ing heat and pressure are applied on the sealed surfaces. The coating of the paperboard
experiences recrystallization when the seal is formed. Especially PE-coatings are used
when heat sealing of the package is needed. (Kuusipalo 2008, pp. 261–262) Marjański et
al. (1996) studied paperboard coated with PE on both sides. The sample was creased and
bent in different directions and angles, and the sample was also heat sealed. Grease re-
sistance tests using vegetable oils showed that heat sealing lines had the worst grease
resistance in paperboard coated with PE and PET. For example, the grease resistance can
be dozens of times longer in creased areas than in heat sealed areas.
Blocking is an undesired phenomenon where two surfaces adhere together. This can hap-
pen for coated paperboard if the conditions, the temperature and pressure for example,
are suitable. Blocking can be a problem especially when polymers with low Tg are used
in the coatings (Ovaska 2016). Blocking is a problem since when the adhered surfaces
are separated, the coating will be damaged, and the penetration of fluids happen easier.
3.3 Liquid properties affecting penetration
Oils and fats can be categorized into vegetable oils, animal fats and mineral oils. Vegeta-
ble and animal-based oils and fats are comprised of fatty acids whereas mineral oils are
aliphatic or aromatic hydrocarbons. Fatty acids are slightly polar molecules while mineral
oils are non-polar. (Rousu et al. 2003)
Fatty acids can be classified to saturated or unsaturated fatty acids and they can be named
based on the amount of carbon atoms in the chain and the number and location of double
bonds in the unsaturated fatty acids. In Figure 7 are shown three different fatty acids
having 18 carbon atoms in the chain. The saturated stearic acid (Figure 7A) does not
contain any double bonds, but monounsaturated oleic acid (Figure 7B) and polyunsatu-
rated linoleic acid (Figure 7C) contain one and two double bonds. The double bond can
cause either cis- or trans-configuration to the chain. (Lawrence 2010, pp. 16-17)

20
Figure 7. Fatty acid composition of A) stearic acid (18:0), B) oleic acid (18:1) and
C) linoleic acid (18:2). Adapted from Lawrence 2010.
Butter, vegetable oils and other fats and oils usually are not comprised of only one fatty
acid as can be seen in Table 1. The amount of saturated fatty acids (SAF), monounsatu-
rated fatty acids (MUFA) and polyunsaturated fatty acids (PUFA) can be seen in the table.
It must be noted that since vegetable oils are natural products and derived from different
sources, the fatty acid composition can vary (Melo-Espinosa et al. 2014). This also means
that the oils do not have one chemical structure since they are formed from a mixture of
triglycerides. An example of olive oil triglyceride is shown in Figure 8.
Figure 8. An example of a possible structure of olive oil.
Fish oil, for example cod liver oil, has a composition of omega fatty acids but also other
fatty acids such as oleic acid and palmitic acid. These omega fatty acids can be eicosa-
pentanoic acid or docosahexanoic acid, which have five and six double bonds and are
polyunsaturated fatty acids (Lawrence 2010, p. 19). The number of these fatty acids in
fish oil vary greatly and thus the composition in Table 1 only shows what fatty acids fish
oil can contain, not their amount.

21
Table 1. Fatty acid composition (percentage) of common fats and oils. X marks that the
oil contains certain fatty acid, but the percentage varies. Adapted from Lawrence 2010
and Melo-Espinosa 2014.
Saturated Monounsaturated Polyunsaturated
C4:0-C12:0 C14:0 C16:0 C18:0 C16:1 C18:1 C18:2 C18:3 other
Butterfat 13 11 27 12 2 29 2 1 Canola oil 4 2 62 22 10 Castor oil 1 1 92 6 Chicken fat 1 1 24 6 6 40 16 1 Cocoa butter 26 34 34 3
Coconut oil 62 18 9 3 6 2 Corn oil 11 2 28 58 1 Fish oil x x x x x
Lard 2 26 14 3 44 10 Oleic acid 100
Olive oil 13 3 1 71 10 Palm oil 1 45 4 40 10 Palm kernel oil 55 16 8 3 15 2 1 Peanut oil 9 6 49 27 1 Soybean oil 11 4 24 54 7 Sunflower oil 7 5 19 68 1
Every fatty acid has its own chemical name based on the number of carbons in the chain.
Butyric acid, caproic acid, caprylic acid, capric acid, lauric acid, myristic acid, palmitic
acid and stearic acid are the unsaturated fatty acid in the order from C4:0 to C18:0. Pal-
mitoleic acid has 16 carbons in the chain with one double bond (C16:1) and dodenaic
acid, C18:1, is oleic acid, if the double bond is in the center of the chain (as in Figure 7B),
or vaccenic acid if the double bond is between 11th and 12th carbon from the acid group.
Polyunsaturated C18:2 has two double bonds and can be linoleic acid if it is cis-config-
urated and linolelaidic acid if it is trans-configurated. C18:3 is linolenic acid and is one
of the omega-3 fatty acids. Fish oils are a common source of different omega fatty acids.
For example, eicosapentaenoic acid (C20:5) and docosahexaenoic acid (C20:6), more
commonly known as EHA and DHA, are found in fish oils. (Lawrence 2010, p. 130;
Lawrence 2010, p. 220)
Vegetable oils are usually triglycerides. Triglycerides are comprised of three fatty acid
chains and are connected to each other when glycerol and its three alcohol groups are
present. The OH-group of glycerol will react with the carboxyl group of a fatty acid and
connect the three fatty acid chains. The glycerol part, carboxylic acid end, of the chain is
polar and the long carbon chain is nonpolar. (Lawrence 2010, pp. 20–25)
22
Having a polar and non-polar end means that oils are amphiphilic. This means that they
have both hydrophilic and lipophilic properties. The polar end is hydrophilic and the non-
polar chain is the lipophilic part. (Lawrence 2010, pp. 24–25) The amphiphilic nature of
fatty acids can have an influence on the penetration through paperboard. Also, the length
of the chain, saturation and configuration of unsaturated fatty acid affect the properties of
fats and oils and thus can penetrate through paperboard at different velocity (Ovaska
2016).
It has been stated (Ovaska 2016) that the coating influences the penetration. For example,
it has been noticed that in PE-coating the penetration was faster when the oil had longer
alkyl chain and a greater degree of saturation. Ovaska also studied the blends of vegetable
oils and their penetration through paperboard with different amount of talc and noticed
that with talc content under 30 % the oil blends penetrated through faster than pure canola
or coconut oils. With 30 % of talc, coconut oil penetrated faster, which may be due to the
smaller molecular size of coconut oil. Canola oil is also more saturated, and this can in-
fluence penetration. However, the presence of lipophilic talc must also be considered, not
just the properties of the oils.
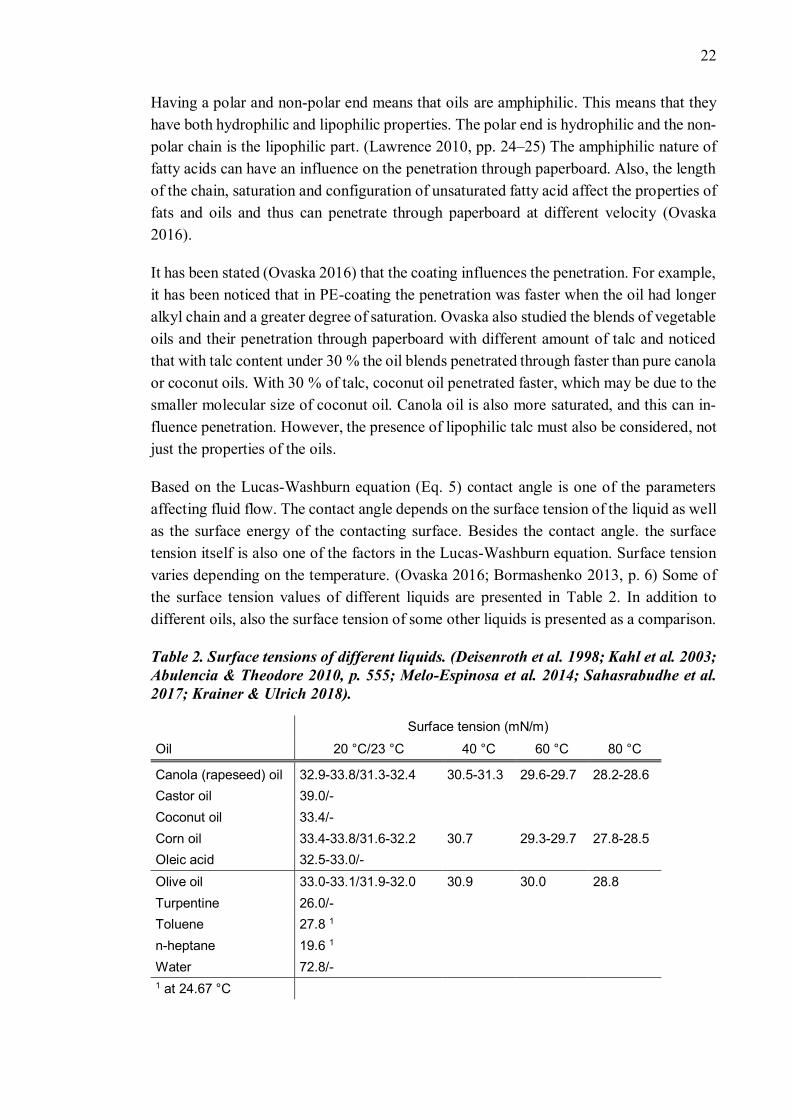
Based on the Lucas-Washburn equation (Eq. 5) contact angle is one of the parameters
affecting fluid flow. The contact angle depends on the surface tension of the liquid as well
as the surface energy of the contacting surface. Besides the contact angle. the surface
tension itself is also one of the factors in the Lucas-Washburn equation. Surface tension
varies depending on the temperature. (Ovaska 2016; Bormashenko 2013, p. 6) Some of
the surface tension values of different liquids are presented in Table 2. In addition to
different oils, also the surface tension of some other liquids is presented as a comparison.
Table 2. Surface tensions of different liquids. (Deisenroth et al. 1998; Kahl et al. 2003;
Abulencia & Theodore 2010, p. 555; Melo-Espinosa et al. 2014; Sahasrabudhe et al.
2017; Krainer & Ulrich 2018).
Surface tension (mN/m)
Oil 20 °C/23 °C 40 °C 60 °C 80 °C
Canola (rapeseed) oil 32.9-33.8/31.3-32.4 30.5-31.3 29.6-29.7 28.2-28.6
Castor oil 39.0/- Coconut oil 33.4/- Corn oil 33.4-33.8/31.6-32.2 30.7 29.3-29.7 27.8-28.5
Oleic acid 32.5-33.0/-
Olive oil 33.0-33.1/31.9-32.0 30.9 30.0 28.8
Turpentine 26.0/-
Toluene 27.8 1
n-heptane 19.6 1
Water 72.8/-
1 at 24.67 °C

23
The viscosity of the penetrating liquid has an impact on the flow rate based on Lucas-
Washburn equation. The viscosity of the fluid is temperature-dependent like the surface
tension values (Sperling 2006, p. 147). The viscosity values of some oils and solvents are
presented in Table 3. Viscosity tells about a fluids capability to resist deformation and
flow – the lower the viscosity is the easier the fluid will flow. Low viscosity fluids will
also spread faster on the surface (Ovaska 2016).
Table 3. Viscosity of liquids (Noureddini et al. 1992; Brock et al. 2008; Ovaska 2016;
Abdelraziq & Nierat 2015; Sahasrabudhe et al. 2017; Velásquez & Hoyos 2017,
Krainer & Ulrich 2018).
Viscosity (mPa·s)
Oil 22 °C 40°C 60 °C 80 °C
Canola (rapeseed) oil 63.5 34.9-35.6 16.4-21.4 11.8
Castor oil 800 1 325 Coconut oil 28.0 3 13.2-13.3 7.6 4
Corn oil 59.2-67.6 32.3-34.5 15.7-19.1 12.5
Oleic acid 27.6 2
Olive oil 74.1 37.8-40.1 21.1-21.4 13.4
Peanut oil 72.2 38.8 20.5 12.6
Soybean oil 57.1 29.5-31.3 16.1-17.9 11.4
Turpentine 1.5
Toluene 58.7 1
n-heptane 41.9 1
Water 1.0
1 at 20 °C, 2 at 25 °C, 3 at 37.8 °C, 4 at 82.2 °C
The possibility of oil or other liquids to dissolve paperboard or coating must be consid-
ered. In the case of testing the OGR, indirect methods can use solvents of a different kind
which should mimic the oil penetration. However, solvents can dissolve paperboard, its
additives or coating and give incorrect OGR results. Especially in the case of a solvent
dissolving for example the surface of paperboard substrate, the penetration models do not
tell about the oil penetration any longer. It can be predicted with the solubility parameters
whether or not a polymer or other material will swell or dissolve into a solvent.
Different solubility parameters () are tabulated and it has been noticed that when the
solubility parameters (in (cal/cm3)1/2) of solvent and polymer are within one unit, disso-
lution will occur. If the difference is bigger, dissolution can still happen. Solubility pa-
rameters can also be addressed in the unit of MPa1/2. (Sperling 2006, pp. 74–76) The sol-
ubility parameters of some of the solvents, polymers and vegetable oils are seen in Table
4. As an example, turpentine with a solubility parameter of 8.1 (cal/cm3)1/2 will dissolve

24
PE- or styrene-butadiene-coating based on the solubility parameters. The solubility pa-
rameter of a mixture can be summed based on the fraction and solubility parameters of
the starting materials.
Table 4. Solubility parameters of different solvents, polymers and oils (Hildebrand
1980; Rousu et al. 2003; Sperling 2006; Batista et al. 2015).
𝛿
Solvent (cal/cm3)1/2 MPa1/2
Acetone 9.9 20.3
Benzene 9.2 18.8
Formic acid 12.2 24.9
n-heptane 7.4 15.3
Toluene 8.9 18.2
Turpentine 8.1 16.6
Polymer/barrier chemical
Polybutadiene 8.4 17.2
Polystyrene 9.1 18.6
Polyethylene 7.9 16.2
Polyacrylate 10.4 21.3
Polylactic acid 9.9 20.2
Polybutylene succinate 10.2 20.9
Polybutylene adipate terephthalate 10.9 22.3
Fluorochemical (n-C7F16) 5.6 11.5
Oil
Coconut oil 8.5 17.4
Palm oil 8.9 18.3
Used frying oil 8.4 17.2
Aliphatic mineral 7.0 14.3
Aromatic mineral 8.6 17.7
The solubility parameter for oils is usually lower than for latexes in dispersion coating. If
the latex is modified such that the solubility parameter decreases closer to the solubility
parameter of the oil, should association with the oil be enhanced. However, it has been
studied that not just the solubility parameter affects the association but also the Tg of the
latex has an effect. The molecular movement of the latex is decreased if Tg increases. For
example, if latex is modified to have Tg above or close to room temperature (instead of
having a lower Tg), the latex is more in a glassy state at room temperature and this results
in slower diffusion of oil into the latex film even if the solubility parameter does not
change. (Rousu et al. 2003)
25
4. QUALITY CONTROL IN PAPERBOARD
MILLS
4.1 Generals aspects of quality testing in paperboard mills
The aim of quality control in paperboard mills is to describe the properties or features of
the tested material, which can be the final product or its intermediate. This means that the
quality of the pulp and the final paperboard is tested. On-line and offline measurements
are needed to control the product quality. On-line testing means that testing occurs during
the production process. Offline testing includes traditional laboratory testing and is per-
formed since, for example, all necessary tests cannot be performed online, and samples
are not conditioned before testing. (Levlin & Söderhjelm 1999, p. 12)
The focus here is on the laboratory testing of the final product. When selecting suitable
tests, must the required functional properties be defined first. Then the actual test methods
can be selected to measure the relevance of the functional behavior. For example, suitable
surface properties can be tested by measuring the smoothness or roughness and the sur-
face strength of the paperboard. (Levlin & Söderhjelm 1999, pp. 14–15) The inhomoge-
neous nature of paperboard, anisotropicity and hygroscopicity affect the test method se-
lection, sampling and test conditions such as temperature.
Uncertainty, repeatability and reproducibility are terms used in quality control. Uncer-
tainty tells about the distribution of the values attributed to the measurand. Uncertainty
can originate from the material or sample itself, instructions, experience of the personnel
or the equipment and environment. Repeatability is defined as the closeness of the results
of successive measurement under the same conditions using the same material or samples.
Repeatability thus tells how the conditions, equipment and a certain operator work. Re-
producibility is the closeness of the results when different conditions are used. Reproduc-
ibility can tell about differences between operators in the same laboratory or the differ-
ences between laboratories. (Levlin & Söderhjelm 1999, p. 258–259)
Specification limits can be set to specify the desired values of the tests. Usually there are
values for different properties of the paperboard that customers require. One specific
value can be used to describe for example the thickness of the paperboard, but there will
always be some variation in it. Thus, are the lower and upper specification limits deter-
mined and the product passes the quality tests and quality control even if the tested value
is not exactly the value determined in the specifications. As explained, there is always
uncertainty in the values of the test. The uncertainty must be known and if the upper and
lower specification limits are close to each other and the uncertainty is large, the material
properties can be partly outside the specifications. (Levlin & Söderhjelm, p.257–258)

26
Some specific features apply to the quality control in a shift work at the paperboard mill.
The production rate can be fast, and the test methods used should be suitable for quick
determination of the product quality. The tests must tell about the process – if the process
parameters are incorrect must it show in the tests. All tests should also have such results
that they tell about the properties that the test is designed for and that it is possible to
change the process to meet the quality requirements. (Roponen 2019)
Quality control at shift work sets some limitations to the tests. The test method should be
simple, fast to perform and be reliable. The possibility for human errors must be as small
as possible and complicated tests or tests including visual inspection should be avoided.
It would be beneficial to have automated tests where the skills of the operator do not have
a role on the result. Automated tests would lead to more reliable test results. Also, safety
must be taken into consideration. The test devices and used reagents should be safe and
only when necessary harmful substances can be used. (Roponen 2019)
Tests are performed based on the instructions written in the laboratory founded on stand-
ards. With approved instructions laboratory workers are always able to follow the test
scheme the same way. Laboratorians are educated for their work. Test devices are based
on standards and they are calibrated and checked at certain intervals. There are different
ways to ensure that the test devices and methods give correct results. For example, CEPI
Comparative Testing Service can provide a reference material to be tested in the labora-
tory or different laboratories can test the same material to see if the results vary. All these
increase the reliability, repeatability and reproducibility of the results. (Roponen 2019) It
must be noted that when doing interlaboratory comparison that the test methods must be
the same.
Reporting of the results should be easy. Different user groups get different data from the
process. Results from the quality control are one of the sections presented in the manu-
facturing execution system, which provides information about the production process.
Changing the reel production process variables can be based on the results from quality
control tests. Everything should be justified based on test results. This means that in the
production there should be instructions (Roponen 2019) Results should be presented pre-
cisely and the easiest technique to interpret results is often in a numerical way. To be able
to compare the results from different measurements, the test method must be the same.
As an example, in an oil and grease resistance test ASTM F119 the test temperature and
the penetrating liquid can vary. If different laboratories use different conditions, the re-
sults are not comparable.
4.2 Grease resistance testing of paperboard
Many tests are developed to test the grease resistance of paper and paperboard products
of different kind. There are ASTM, ISO and TAPPI standard test methods as well as
procedures developed by companies and research groups. Tests can be divided into direct

27
and indirect methods. A direct method uses oil or fat and is more realistic but time con-
suming than an indirect method, which can utilize for example turpentine for faster but
not so realistic a test. (Gietl et al. 2009)
Different tests can measure different things. For example, the show-through or break-
through times can be different if visual inspection is used. Break-through time means the
time when the oil or grease has penetrated through the test piece to the other side of it
whereas show-through tells the time when first visual sign can be observed from the other
side of the test piece (ISO 16532-1 2008). With the help of pigment or dye, the visual oil
and grease resistance tests can be modified to be less prone to human errors or misinter-
pretations. Most of the test include some kind of visual inspection and the results are
sometimes ambiguous. As an example, the ASTM F119 or ISO 16532-1 tests are one of
the grease resistance tests where the oil break through or show-through time is observed
visually. In some of the tests the amount of absorbed oil in to the sample is measured
gravimetrically, which gives more valid results since no visual inspection is needed.
(Gietl et al. 2009)
To minimize the interpretation errors in tests requiring visual inspection, the time when
oil has penetrated through the sample can be determined by scanning the sample and using
software to find contrast differences or making a spectrophotometer measurement. The
time-consuming test methods can be modified to not so labor-intensive if time-lapse pho-
tography or scanning is used for monitoring the backside of the sample to record when
the oil penetrates the sample. (Gietl et al. 2009) If the images taken are saved, the results
can be stored and compared afterwards.
When a glass plate is used in grease resistance testing to help the visual inspection, can
different tools and devices be used. In some of the standards, the glass plate is instructed
to be frosted or that with the help of a mirror the penetration is observed. In these tests
also blotting paper or another type of paper can be placed under the test arrangement.
Also rings, weights and sand piles of a different kind are utilized in the tests. For example,
when the test liquid is highly viscous is pressure and high temperature often used. This
can decrease the time needed for the test procedure. Sand piles or cotton patches on the
other hand are used to keep low viscous liquid in a limited area. (Gietl et al. 2009)
Pinholes and defects caused by creasing, for example, can lead to inhomogeneous pene-
tration. In these cases, the oil penetration can be seen in several different spots not just
one circle. Of course, this tells about the oil resistance of the paperboard if the faults
describe grease resistance of a larger area of the paperboard. Creasing is an example of
this since creasing is done intentionally to mimic paperboard converting operation, but it
does not tell the oil resistance of intact paperboard. In some cases, there can be local voids
and the inhomogeneous penetration tells only about this small area as is the case with
pinholes. (Gietl et al. 2009)

28
The test solution in the ISO-standard Determination of grease resistance – part 2: the
surface repellency test (ISO 16532-2 2007) is the same as in KIT-test (TAPPI 559 pm-
96). In the ISO-standard, the repeatability and reproducibility of the test has been evalu-
ated. It was noticed that the repeatability between laboratories was good in all KIT-ratings
but only the highest KIT-ratings (10-12) gave good reproducibility. In another test
method, the ASTM F 119 -standard, the repeatability was found to be good in different
laboratories but the reproducibility between laboratories showed poor results.
A few of the oil and grease resistance test methods are seen in Table 5. Some of the test
methods have been described in different standards and some of the test methods devel-
oped by researches are based on standards. Breese & Cheney test is an example of this.
Hercules sizing test (HST) is used when testing ink absorptiveness and Cobb-Unger in
oil absorptiveness. FTIR, ultrasound and scanning absorptiometer are used for liquid pen-
etration evaluation. These test methods can still, at least in theory, be used when studying
the oil and grease resistance of paperboard. (Gietl et al. 2009; Hercules sizing tester 2015;
Krainer & Ulrich 2018; Scan-P 37:77)
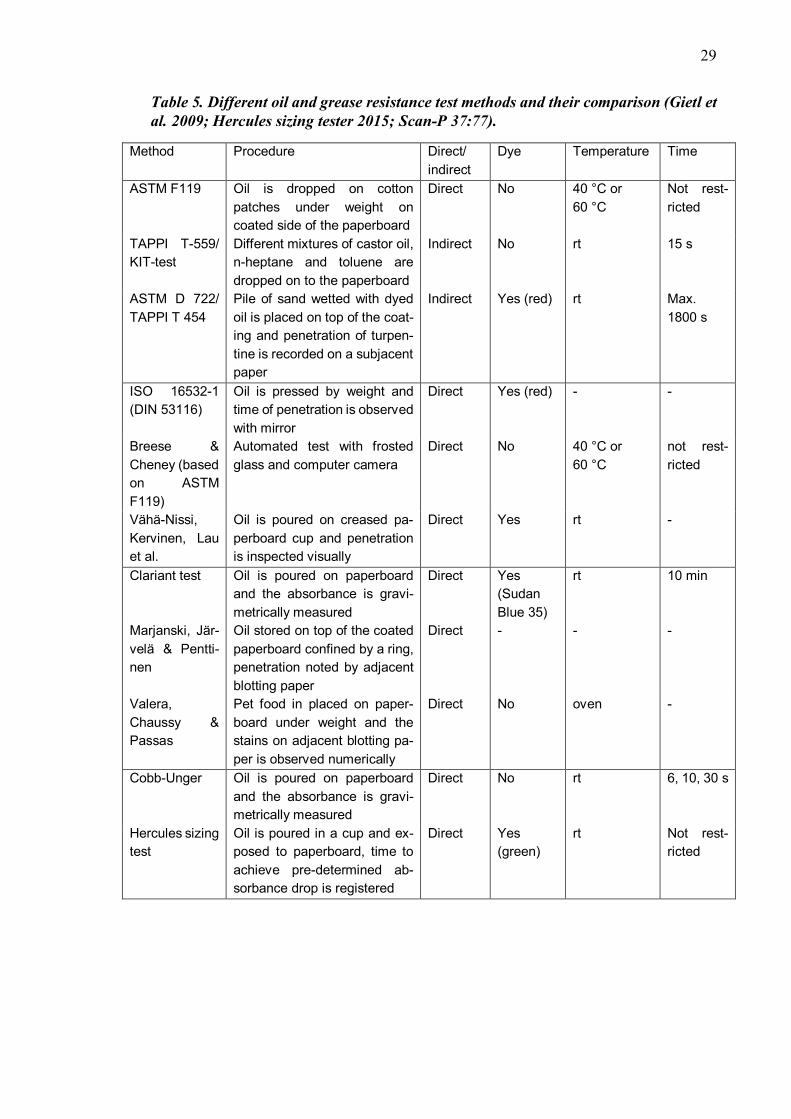
29
Table 5. Different oil and grease resistance test methods and their comparison (Gietl et
al. 2009; Hercules sizing tester 2015; Scan-P 37:77).
Method Procedure Direct/
indirect
Dye Temperature Time
ASTM F119 Oil is dropped on cotton
patches under weight on
coated side of the paperboard
Direct No 40 °C or
60 °C
Not rest-
ricted
TAPPI T-559/
KIT-test
Different mixtures of castor oil,
n-heptane and toluene are
dropped on to the paperboard
Indirect No rt 15 s
ASTM D 722/
TAPPI T 454
Pile of sand wetted with dyed
oil is placed on top of the coat-
ing and penetration of turpen-
tine is recorded on a subjacent
paper
Indirect Yes (red) rt Max.
1800 s
ISO 16532-1
(DIN 53116)
Oil is pressed by weight and
time of penetration is observed
with mirror
Direct Yes (red) - -
Breese &
Cheney (based
on ASTM
F119)
Automated test with frosted
glass and computer camera
Direct No 40 °C or
60 °C
not rest-
ricted
Vaha-Nissi,
Kervinen, Lau
et al.
Oil is poured on creased pa-
perboard cup and penetration
is inspected visually
Direct Yes rt -
Clariant test Oil is poured on paperboard
and the absorbance is gravi-
metrically measured
Direct Yes
(Sudan
Blue 35)
rt 10 min
Marjanski, Jär-
velä & Pentti-
nen
Oil stored on top of the coated
paperboard confined by a ring,
penetration noted by adjacent
blotting paper
Direct - - -
Valera,
Chaussy &
Passas
Pet food in placed on paper-
board under weight and the
stains on adjacent blotting pa-
per is observed numerically
Direct No oven -
Cobb-Unger Oil is poured on paperboard
and the absorbance is gravi-
metrically measured
Direct No rt 6, 10, 30 s
Hercules sizing
test
Oil is poured in a cup and ex-
posed to paperboard, time to
achieve pre-determined ab-
sorbance drop is registered
Direct Yes
(green)
rt Not rest-
ricted
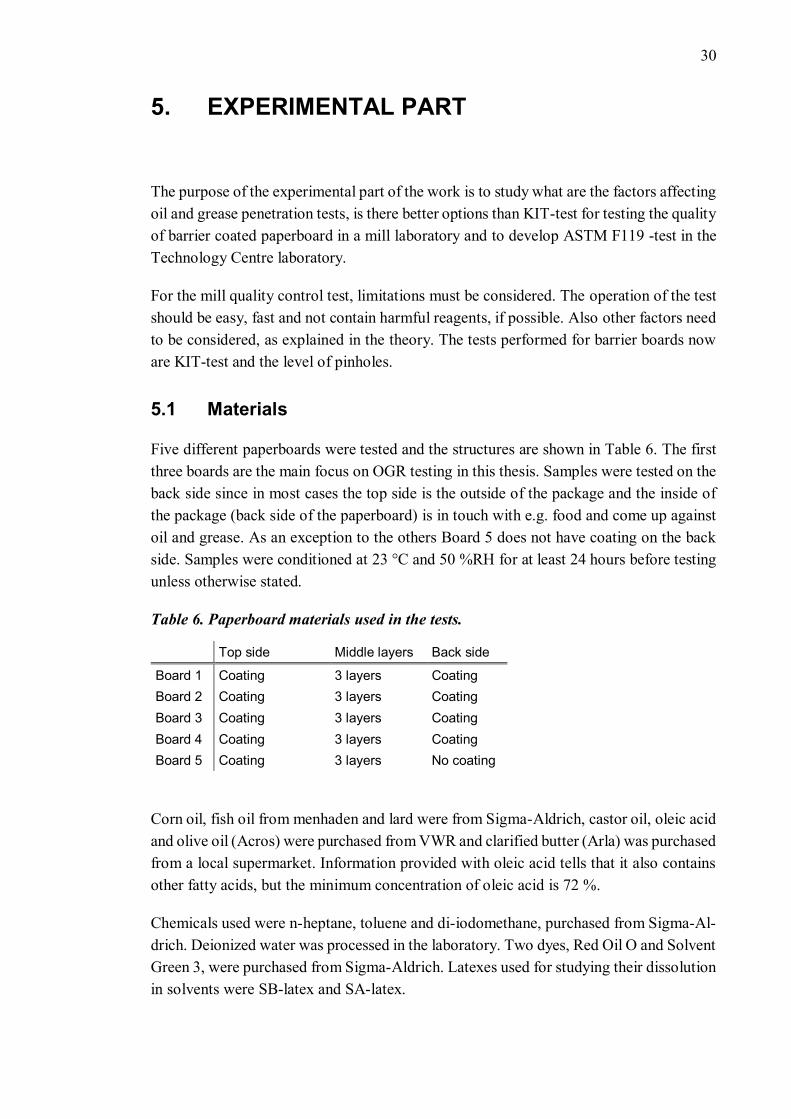
30
5. EXPERIMENTAL PART
The purpose of the experimental part of the work is to study what are the factors affecting
oil and grease penetration tests, is there better options than KIT-test for testing the quality
of barrier coated paperboard in a mill laboratory and to develop ASTM F119 -test in the
Technology Centre laboratory.
For the mill quality control test, limitations must be considered. The operation of the test
should be easy, fast and not contain harmful reagents, if possible. Also other factors need
to be considered, as explained in the theory. The tests performed for barrier boards now
are KIT-test and the level of pinholes.
5.1 Materials
Five different paperboards were tested and the structures are shown in Table 6. The first
three boards are the main focus on OGR testing in this thesis. Samples were tested on the
back side since in most cases the top side is the outside of the package and the inside of
the package (back side of the paperboard) is in touch with e.g. food and come up against
oil and grease. As an exception to the others Board 5 does not have coating on the back
side. Samples were conditioned at 23 °C and 50 %RH for at least 24 hours before testing
unless otherwise stated.
Table 6. Paperboard materials used in the tests.
Top side Middle layers Back side
Board 1 Coating 3 layers Coating
Board 2 Coating 3 layers Coating
Board 3 Coating 3 layers Coating
Board 4 Coating 3 layers Coating
Board 5 Coating 3 layers No coating
Corn oil, fish oil from menhaden and lard were from Sigma-Aldrich, castor oil, oleic acid
and olive oil (Acros) were purchased from VWR and clarified butter (Arla) was purchased
from a local supermarket. Information provided with oleic acid tells that it also contains
other fatty acids, but the minimum concentration of oleic acid is 72 %.
Chemicals used were n-heptane, toluene and di-iodomethane, purchased from Sigma-Al-
drich. Deionized water was processed in the laboratory. Two dyes, Red Oil O and Solvent
Green 3, were purchased from Sigma-Aldrich. Latexes used for studying their dissolution
in solvents were SB-latex and SA-latex.

31
5.2 Methods
All the measurements were taken at Technology Center, MetsäBoard Äänekoski expect
for Parker Print-Surf (PPS) roughness measurement performed at the papermill laboratory
in MetsäBoard Äänekoski and viscosity measurements at Tampere University.
5.2.1 Technical measurements
Thickness of the paperboard was measured with Lorentzen & Wettre (L&W) micrometer
based on ISO 534 -standard. The amount of test pieces is different from the instructions
in the standard. From 10 samples each 6 test pieces were made and the average of these
is the measured thickness. Grammage was measured from A4-sized samples according to
ISO 536 -standard. Contrary to the standard the test piece amount was only 10. The weight
of a single sample was measured, and the dimensions of the sample were taken with cal-
ibrated ruler. Bendtsen surface roughness was measured in accordance with Scan-P 84:1-
standard with L&W Bendtsen SE164. From 8 samples 2 test pieces were made. This re-
sults in 16 measurements on both sides of the paperboard samples. Top side and back side
were measured separately. Parker Print-Surf roughness was measured based on ISO 8791-
4-standard with L&W PPS Flex Tester 175 in the paperboard mill laboratory. From 5
sheets each 2 test pieces were made resulting in 10 test pieces. Top side and back side
were measured separately. Technical measurements were performed for Board 1, Board
2 and Board 3.
5.2.2 Surface free energy
The surface energy of paperboard was measured with OneAttension Theta (Biolin Scien-
tific AB). Measurements were carried out with a sessile drop method. The contact angle
of ultra-pure water and diiodomethane (DIM) were measured. The drop size was 3.0 µl
for ultra-pure water and 2.0 µl for DIM and the temperature of the liquids was 23 ˚C.
Total of 10 drops were dropped in CD of the test piece and 8 of these were used for the
surface free energy calculations based on OWRKFowkes theory.
Attension Theta records 33 frames per second for 3 seconds and then 17 frames per sec-
ond for the next 8 seconds. From these images the baseline was manually selected and
the contact angle of left and right side of the drop was measured by the program. The
contact angle of DIM and water were calculated after 0.1 s, 1.0 s, 2.0 s and 10.0 s. Surface
free energy values, and its dispersive and polar parts, after 0.1 s and 1.0 s were calculated.
The surface energy of Board 1, Board 2 and Board 3 was determined.

32
5.2.3 Viscosity and surface tension of oils
Viscosity was measured with Anton-Paar Physica MCR 301 rheometer in Tampere Uni-
versity. It utilizes cup and bob geometry. The cup was filled up to a specific mark, sample
size needed was under 5 ml. Shear rate was kept constant since oil was predicted to act
as Newtonian fluid, not having shear thickening or thinning behavior. Shear rate was
1 1/s, heating rate was 2 ˚C/min from 20 ˚C for 30 minutes, unless otherwise stated. Vis-
cosity was measured and calculated at 2-minute interval. The viscosity of all the seven
oils were determined once except for olive oil which was tested 3 times in total. Two
times for untested olive oil and once starting from 40 °C for olive oil already tested.
The surface tension of olive oil and corn oil at different temperatures were measured in
accordance with SFS-EN 14370 with Krüss K6 tensiometer, seen in Figure 9. Oils were
heated in an oven and the temperature of the oil was measured just before starting the
measurement and immediately after the test. The temperature measured after the test was
marked as the temperature for the measured surface tension.
Figure 9. Krüss K6 tensiometer (KRÜSS GmbH). Reprinted with permission.
The surface tension test procedure is as followed: the platinum ring is immersed in the
liquid. Simultaneously the sample table is lowered with a micrometer screw, causing the
ring to withdraw from the liquid, and the adjustment knob of surface tension scale is
rotated keeping the horizontal balance beam between the marks. When the platinum ring
rises from the liquid can the surface tension be read from the scale.
The scale in the tensiometer was 1 mN/m and the surface tension was read at 0.5 mN/m
interval as instructed by the manufacturer (Krüss Scientific). Calibration factor is calcu-
lated by measuring the surface tension of deionized water at 20 ˚C and dividing
balance beam
sample table
micrometer screw
handwheel

33
72.8 mN/m with the measured value. Correction factor by Harkins and Jordan was also
used, which are tabulated. Table can be found in Appendix A. The true surface tension
is
𝛿 = ��𝑐𝐹, (8)
where �� is the measured surface tension, c is calibration factor and F is the Harkins and
Jordan correction factor.
5.2.4 ASTM F119 oil and grease resistance test
Based on ASTM F119 -standard the oil and grease resistance of paperboard was studied
at different conditions and with different oils. The test is modified such that 200 µl oil
was pipetted with Eppendorf automatic pipette to obtain equal amount of oil and to make
the application of oil easier and faster. Also the oil penetration was observed underneath
of non-frosted or -grinded glass plate when the assembly is in the oven, not from the
surface of the glass plate as instructed in the standard. With this procedure the test is not
discontinued when observing the penetration. The time interval for observation is pre-
sented in Table 7, also this differs from the times suggested in the standard.
Table 7. ASTM F119 -test inspection time table.
Time of the test Observation interval
1st hour 10 min
2nd hour 20 min
3rd hour 30 min
until the end of the test 1 h / overnight
Tests were performed in a Climacell 404 Eco (MMM) conditioned chamber. Tempera-
tures used were 20 ˚C, 40 ˚C, 60 ˚C and 80 ˚C with 10 % relative humidity. At 60 ˚C also
relative humidity 50 % and 70 % were used.
All the oils were tested in the pre-tests, but testing was continued with corn oil, clarified
butter, oleic acid and olive oil. Clarified butter was melted such that it could be applied
dropwise. Two dyed oils were also tested, 0.05 wt. % Red Oil O in olive oil and
0.05 wt. % Solvent Green 3 in olive oil at 60 ˚C and 10 %RH.
Samples were Board 1, Board 2 and Board 3. Tests were done for uncreased and unfolded
test pieces unless otherwise stated. If the test pieces were creased was creasing performed
with Zwick-Röll Z010 and the creasing channel was chosen based on the recommenda-
tions by CITO-SYSTEM GmbH, which provides the creasing channels.
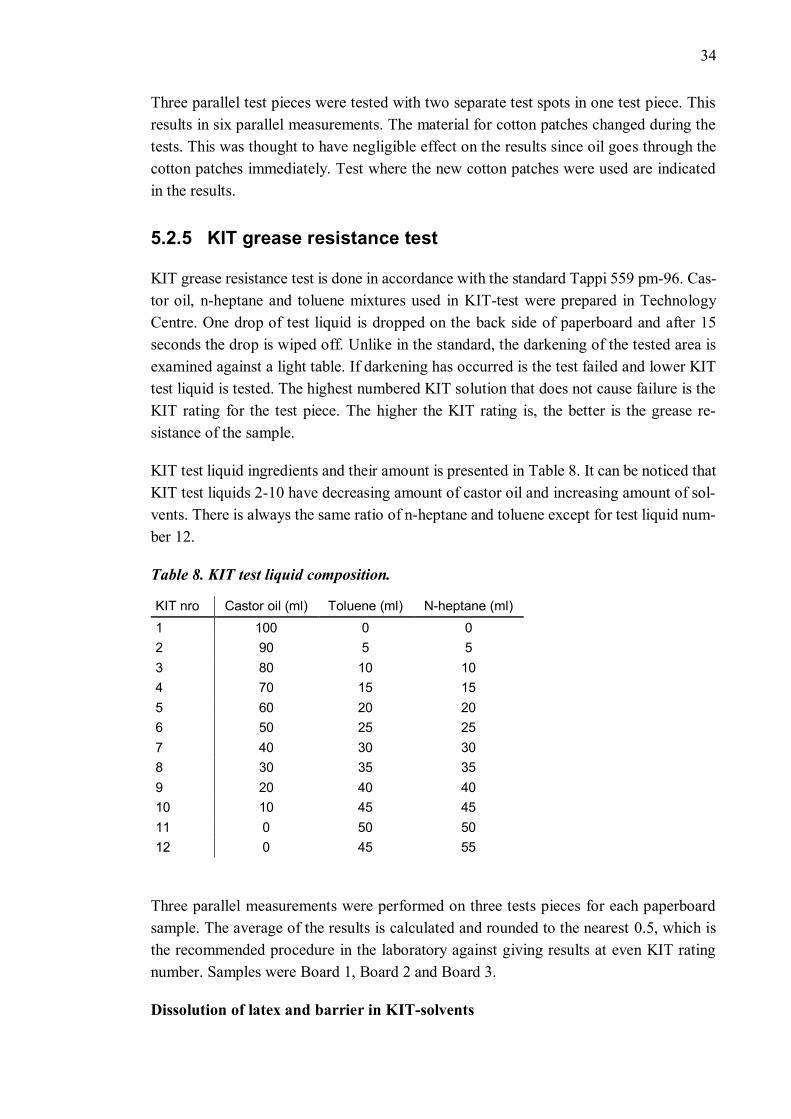
34
Three parallel test pieces were tested with two separate test spots in one test piece. This
results in six parallel measurements. The material for cotton patches changed during the
tests. This was thought to have negligible effect on the results since oil goes through the
cotton patches immediately. Test where the new cotton patches were used are indicated
in the results.
5.2.5 KIT grease resistance test
KIT grease resistance test is done in accordance with the standard Tappi 559 pm-96. Cas-
tor oil, n-heptane and toluene mixtures used in KIT-test were prepared in Technology
Centre. One drop of test liquid is dropped on the back side of paperboard and after 15
seconds the drop is wiped off. Unlike in the standard, the darkening of the tested area is
examined against a light table. If darkening has occurred is the test failed and lower KIT
test liquid is tested. The highest numbered KIT solution that does not cause failure is the
KIT rating for the test piece. The higher the KIT rating is, the better is the grease re-
sistance of the sample.
KIT test liquid ingredients and their amount is presented in Table 8. It can be noticed that
KIT test liquids 2-10 have decreasing amount of castor oil and increasing amount of sol-
vents. There is always the same ratio of n-heptane and toluene except for test liquid num-
ber 12.
Table 8. KIT test liquid composition.
KIT nro Castor oil (ml) Toluene (ml) N-heptane (ml)
1 100 0 0
2 90 5 5
3 80 10 10
4 70 15 15
5 60 20 20
6 50 25 25
7 40 30 30
8 30 35 35
9 20 40 40
10 10 45 45
11 0 50 50
12 0 45 55
Three parallel measurements were performed on three tests pieces for each paperboard
sample. The average of the results is calculated and rounded to the nearest 0.5, which is
the recommended procedure in the laboratory against giving results at even KIT rating
number. Samples were Board 1, Board 2 and Board 3.
Dissolution of latex and barrier in KIT-solvents

35
Solubility of the paperboard coating or the plain latex in toluene, n-heptane and 50/50-
mixture of toluene and n-heptane (KIT 11 test liquid) was studied to find out if KIT test
solvents cause damages to the barrier coating. The target was to gravimetrically study the
dissolution, but it was noticed that making a latex film with uniform thickness and re-
moving it from the surface was difficult. The next phase was to study the dissolution
visually.
First was SB-latex and SA-latex applied by hand on separate microscope slides and dried
under an infrared dryer. Then KIT-test was simulated by dropping one drop of toluene,
n-heptane and KIT 11 test liquid on separate spots on the microscope slide. Also a refer-
ence spots, where castor oil or olive oil were dropped or where only wiping was done,
were examined. After 15 seconds the drop was wiped off. Tested spots were examined
under Olympus SZX9 stereomicroscope and photos were taken with Zeiss Axiocam 105
camera attached to the microscope.
The same procedure was done with paperboard samples (Board 1 and Board 2) with tol-
uene, n-heptane and KIT 11 test liquid dropped on the back side of the board. Oils were
not studied since they would contaminate SEM.
SEM images were taken with JCM-6000Plus Benchtop SEM (Jeol). Acceleration voltage
10 kV was used and secondary electrons (SE) were used for image formation. To avoid
charging, test pieces were sputter coated with gold using argon as sputtering gas. Test
area was compared with paperboard with no damage.
Based on SEM images further studies were performed with STFI Optitopo Expert. On
Board 2 sample areas of 3 by 3 cm were marked. Optitopo images were taken from these
areas. After that three drops of KIT 11 test liquid, n-heptane and toluene were dropped
and wiped after 15 seconds. Three drops were used to get large enough test area. Three
parallel test pieces were studied.
OptiTopo took two differently illuminated images with 120 ms exposure time and the
shadows caused by paperboard topography were analyzed. Image size was 13 mm by
13 mm. Images were taken in CD direction. With OptiTopo the surface roughness of the
sample can be studied with different wavelengths by using bandpass filtering. The small-
est wavelengths originate from pigments, little larger from fibers, middle scale wave-
lengths from formation and the largest from the process.
5.2.6 Hercules sizing tester
Hercules sizing tester (Hercofinn) is used for determining the level of sizing of paper-
board in compliance with TAPPI T 530 om-02. Hercules sizing tester is designed for ink
absorption testing, but it can also be used for oil resistance testing. The oil penetration

36
test is run in the same manner as the ink penetration test. Test liquid should absorb light
heavily between 600 and 800 nm and it can be dyed with dye meeting this requirement.
First the reflectance end point was selected. Test piece was placed in the sample holder
tested side (back side) upwards. 10 ml of oil was poured on the test piece and the timer
in the machine was started simultaneously. A black disk was placed over the sample
holder to block the penetration of light through the oil. Photoelectric cells measured the
optical reflectance of the test piece and when the penetrating liquid darkens the test piece,
the tester ended the run at the beforehand selected reflectance end point. The schematic
view of HST is seen in Figure 10.
Figure 10. Measurement principle of Hercules Sizing Tester. Oil was used in the tests
instead of acid solution. (Adapted from Applied Paper Technology Inc.)
Reflectance end point under 90 % should be used and it is recommended to use endpoints
50-80 %. The lower the percentage is, the longer the test runs. On the other hand, if the
reflectance end point is too high will the variation between samples and operator tech-
niques affect the result too much. The duration of the test should be from 30 s to
10 minutes and the test conditions (reflectance end point) should be chosen to meet this
recommendation. Different reflectance end points were used depending on the sample.
Also values over 90 % were used since some of the samples were oil resistant and the
tests with recommended values would have taken several hours.
Two different oils were used in HST, olive oil and oleic acid. Also olive oil dyed with
0.013 wt. % Solvent Green 3 was used as penetrant. Solvent Green 3 absorption happens
at 644-607 nm, based on the information provided by Sigma-Aldrich, and should be suit-
able for HST. Samples used were Board 1, Board 2, Board 4 and Board 5. Samples were
tested at ambient conditions.

37
5.2.7 Cobb-Unger
Cobb-Unger oil absorbency test is based on Scan-P 37:77 standard. Oil absorbency is
tested with L&W Cobb Sizing tester. Cobb-Unger oil absorbency in grams per square
meter is
𝐶𝑈 =𝑚2−𝑚1
𝐴, (9)
Where m1 is the mass of the test piece before the test, m2 mass of the test piece after the
test and A the area of the test piece (here 0.0100 m2).
The test schedule differs from the standard and is presented in Table 9. Samples were
Board 1, Board 2 and Board 3, Board 4 and Board 5. The oil absorbency of the back side
of the sample was studied. Reported values are the average of duplicates.
Table 9. Cobb-Unger procedure steps. CU30 is the same as in SCAN P37:77 apart from
longer time for wiping off the oil.
Step in the procedure
Times from the start of the test (s)
CU30 CU60 CU180 CU300 CU600
Turn the cup upside down 0 0 0 0 0
Return the cup to its original position 25 55 175 295 595
Release the lever which closes the lid,
extract the test piece and place it on the
blotting paper
28 58 178 298 598
Start wiping off the surplus oil 30 60 180 300 600
Stop wiping off the oil 35 65 185 305 605
5.2.8 Emco DPM ultrasound
Dynamic Penetration Measurement DPM 30 (Emco) was used to study oil penetration
with ultrasonic waves. The measurement principle is seen in Figure 11. The measuring
cell was filled with deionized water. A cell insert was filled with oil and then inserted into
the measuring cell. Two-sided tape and test piece 5 cm by 7 cm (long side in the machine
direction) were fastened separately on to the sample holder. Air inclusions were avoided.
The edges of the test piece were taped to avoid liquid penetration from the sides.

38
Figure 11. The principle of ultrasound measurement of liquid penetration in paper
(Adapted from Emtec).
Ultrasound with the frequency of 1 MHz was used and results from both measuring cells
(diameter of 10 mm and 35 mm) were obtained. Different dropping velocities were used
(10 – 70 m/s). Differences between results caused by dropping velocity were not noticed.
With higher dropping velocity, the recording of the ultrasound starts faster after the test
piece has touched the liquid.
Emco program draws a transmittance curve over time. The program calculates certain
parameters automatically. They are presented in Table 10. As stated in the used manual,
interpretation of the results must be done based on the application. Krainer & Ulrich
(2018) used S-value as the rate of penetration. Parameter tB should tell how long the
wetting takes.
Table 10. Emco DPM parameters calculated by the program.
Parameter Explanation
tB Point of time with maximum transmission (highest y-value)
tS Point of time with the most negative gradient
tV Point of time with minimum transmission (lowest y-value)
L Difference between the average of the first values and the maximum in %r
S Gradient in % per second at tS
tX Point of time with maximum curvature
Oleic acid and olive oil were used as penetrants. The oil was not changed between meas-
urements, but it was added due to the loss caused by paperboard absorption. Samples
were Board 1, Board 2, Board 4 and Board 5. Back side of the samples were facing the
oil.
Cel
l in-
sert

39
5.3 Results and discussion
5.3.1 Technical measurements
The results of thickness and grammage measurements are shown in Table 11. From the
results can be seen that board 2 has the highest thickness and grammage whereas board
has the lowest values.
Table 11. Measured thickness and grammage of the boards.
Board 1 Board 2 Board 3
Thickness (µm)
average 379.9 400.0 360.3
standard
deviation 1.99 2.94 2.16
Grammage (g/m2)
average 243.0 246.9 240.3
standard
deviation 0.82 1.22 0.57
Bendtsen and PPS measurements are shown in Table 12. Oil and grease resistance tests
are performed on the back side of the sample. Thus, the results from the back side are
more meaningful than the top side results. Board 2 has the highest back side roughness
values and Board 3 the lowest.
Table 12. Measured Bendtsen and PPS roughness from top side (TS) and back side
(BS) of the boards.
Board 1 Board 2 Board 3
Bendtsen (ml/min)
TS BS TS BS TS BS
average 10.19 107.06 9.88 184.88 15.94 105.50
standard
deviation 3.468 12.030 4.485 29.058 4.139 7.554
PPS (µm)
TS BS TS BS TS BS
average 1.26 5.29 1.31 5.92 1.34 4.85
standard
deviation 0.043 0.102 0.034 0.185 0.038 0.093

40
5.3.2 Surface free energy
The contact angle of DIM and water on the boards at 0.1 s, 1.0 s, 2.0 s and 10.0 s are
presented in Figure 12. The contact angle of DIM does not change much during 10 sec-
onds on any of the boards. With Board 1 the contact angle of water decreases during the
whole test whereas for Board 2 and Board 3 the contact angle does not decrease during
the first 2.0 s. Contact angle measured at 10.0 s shows that it has decreased also for these
boards. Board 1 is more hydrophilic than Board 2 and Board 3 based on the decrease in
the water contact angle. Water might be absorbed in Board 1 based on the contact angle
results.
The surface free energy of the boards after 0.10 s and 1.00 s is presented in Figure 13.
The polar and dispersive part of the surface energy are also shown. Board 1 has the highest
surface energy and Board 3 the lowest. Board 1 clearly has the highest dispersive part of
surface energy. Board 2 on the other hand has the highest polar part. The rise in the polar
part of surface energy seen in the graph for Board 1 can be explained by the decrease in
water contact angle.
0
10
20
30
40
50
60
70
Board 1 Board 2 Board 3
Co
nta
ct a
ngl
e (˚
)
0.10 s 1.00 s 2.00 s 10.00 s
0
10
20
30
40
50
60
70
Board 1 Board 2 Board 3
Co
nta
ct a
ngl
e (˚
)
0.10 s 1.00 s 2.00 s 10.00 s
Figure 12. The contact angle of DIM on the left and water on the right.

41
Figure 13. Surface free energy of the boards after 0.10 s and 1.00 s. Dispersive (γd) and
polar (γp) parts of the surface energy presented separately.
5.3.3 Properties of the oils
The viscosity values of the oils are shown in Figure 14. In the logarithmic scale the vis-
cosity decreases in a linear manner when the temperature rises.
Figure 14. Viscosity of the oils at temperatures 20-80 °C. Viscosity of butter measured
from 40 °C.
0
10
20
30
40
50
60
0.10 s 1.00 s 0.10 s 1.00 s 0.10 s 1.00 s
Board 1 Board 2 Board 3
Surf
ace
en
ergy
(mN
/m)
γd γp
1
10
100
1000
20 30 40 50 60 70 80
Vis
cosi
ty (m
Pa·
s)
Temperature (˚C)
Oleic acid Fish oil Butter Corn oil Lard Olive oil Castor oil

42
The viscosity values in ascending order is oleic acid, fish oil, clarified butter and corn oil,
lard, olive oil and castor oil. Castor oil has much higher viscosity than other oils.
At high temperatures the oils can degrade for example through oxidation. This can have
an effect on the viscosity values. The viscosity of olive oil was tested three times to see
if there are differences in the viscosity values between the measurements. Results are seen
in Figure 15. The degradation processes of oils can also affect the penetration, but this
could be further studied with FTIR (Fourier-transform infrared spectroscopy) or TGA
(thermogravimetric analysis), for example. With TGA purging gas could be air of if oxi-
dization is studied can oxygen be used.
Figure 15. Viscosity of two untested olive oils at temperature 20-80 °C and one retested
olive oil at temperature 40-80 °C.
The viscosity values of the untested olive oils are similar at temperatures below 40 °C,
but the second test shows lower viscosity values at higher temperatures. Re-tested olive
oil was tested from 40 °C and gave similar results in comparison with the second olive
oil test. The differences in the viscosities can be caused by the measurement geometry.
The measured temperature is the temperature of the chamber, not the temperature of the
oil. Thus, the measured temperature can differ from the temperature of the oil, but the
sample size is so small that the temperature difference should not be big. Probably olive
oil did not undergo degradation during the viscosity measurements since the test time was
so short.
10
100
20 30 40 50 60 70 80
Vis
cosi
ty (m
Pa·
s)
Temperature (˚C)
Olive oil 1 first heating Olive oil 1 reheating Olive oil 2

43
When comparing the viscosity results of olive oil and corn with the values obtained from
the literature (Brock et al. 2008) it can be said that the values are similar. The viscosity
values in the study of Brock et al. was performed with Brookfield viscosimeter (LVDV-
III+). For corn oil at temperatures below 70 °C the values are almost exact the same.
Above this temperature there were fluctuations in the measured values from the test with
rheometer and this can lead to the small difference between measured and literature val-
ues. For olive oil the measured values had a little larger value than what Brock et al. had
measured. At 40 °C the difference was 2.2 – 4.5 mPa·s (for retested olive oil the viscosity
was 1.5 mPa·s below the literature value but above 50 °C the difference turned upside
down) but at 60 °C the difference is negligible for reheated olive and the second olive oil.
For the first olive oil viscosity at 60 °C is about 4.0 mPa·s higher than the literature value.
The surface tension values of olive oil and corn oil were measured and the results in
comparison with literature values are presented in Figure 16. The literature values were
measured with a pendant drop method using KRÜSS drop shape analyzer (DSA30B) (Sa-
hasrabudhe et al. 2017). Similar values are obtained also in other studies.
Figure 16. Surface tension olive oil and corn oil. Measured values presented with a
solid line and values from literature (Sahasrabudhe et al. 2017) presented with a dashed
line.
Measured surface tension values are higher than values from the literature. The slope of
the measured and the literature values of olive oil is similar, but for corn oil the slope is
much steeper with the measured values. During the surface tension measurements reading
25
26
27
28
29
30
31
32
33
34
35
20 30 40 50 60 70 80
Surf
ace
ten
sio
n (
mN
/m)
Temperature (˚C)
Olive oil Corn oil Olive oil literature Corn oil literature
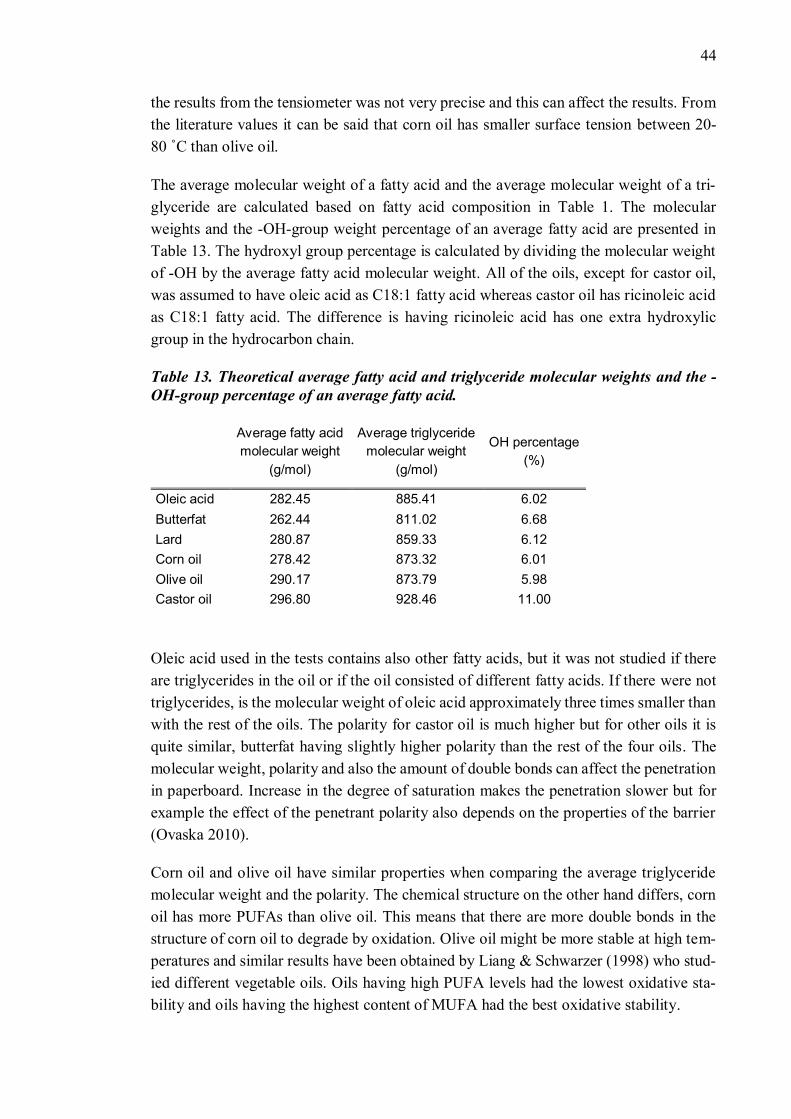
44
the results from the tensiometer was not very precise and this can affect the results. From
the literature values it can be said that corn oil has smaller surface tension between 20-
80 ˚C than olive oil.
The average molecular weight of a fatty acid and the average molecular weight of a tri-
glyceride are calculated based on fatty acid composition in Table 1. The molecular
weights and the -OH-group weight percentage of an average fatty acid are presented in
Table 13. The hydroxyl group percentage is calculated by dividing the molecular weight
of -OH by the average fatty acid molecular weight. All of the oils, except for castor oil,
was assumed to have oleic acid as C18:1 fatty acid whereas castor oil has ricinoleic acid
as C18:1 fatty acid. The difference is having ricinoleic acid has one extra hydroxylic
group in the hydrocarbon chain.
Table 13. Theoretical average fatty acid and triglyceride molecular weights and the -
OH-group percentage of an average fatty acid.
Average fatty acid
molecular weight
(g/mol)
Average triglyceride
molecular weight
(g/mol)
OH percentage
(%)
Oleic acid 282.45 885.41 6.02
Butterfat 262.44 811.02 6.68
Lard 280.87 859.33 6.12
Corn oil 278.42 873.32 6.01
Olive oil 290.17 873.79 5.98
Castor oil 296.80 928.46 11.00
Oleic acid used in the tests contains also other fatty acids, but it was not studied if there
are triglycerides in the oil or if the oil consisted of different fatty acids. If there were not
triglycerides, is the molecular weight of oleic acid approximately three times smaller than
with the rest of the oils. The polarity for castor oil is much higher but for other oils it is
quite similar, butterfat having slightly higher polarity than the rest of the four oils. The
molecular weight, polarity and also the amount of double bonds can affect the penetration
in paperboard. Increase in the degree of saturation makes the penetration slower but for
example the effect of the penetrant polarity also depends on the properties of the barrier
(Ovaska 2010).
Corn oil and olive oil have similar properties when comparing the average triglyceride
molecular weight and the polarity. The chemical structure on the other hand differs, corn
oil has more PUFAs than olive oil. This means that there are more double bonds in the
structure of corn oil to degrade by oxidation. Olive oil might be more stable at high tem-
peratures and similar results have been obtained by Liang & Schwarzer (1998) who stud-
ied different vegetable oils. Oils having high PUFA levels had the lowest oxidative sta-
bility and oils having the highest content of MUFA had the best oxidative stability.

45
The effect of temperature on oils has been studied widely. The physical properties, such
as surface tension and viscosity, and the chemical structure change when the temperature
rises. The accelerated oxidation test, Schaal test at 60-65 °C, has shown that different oils
act differently (Liang & Schwarzer 1998; Maszewska et al. 2018) but oxidation happens
with different vegetable and animal oils at high temperatures over time. The surface ten-
sion values and viscosity values also change as a function of temperature as presented in
Table 2 and Table 3.
5.3.4 ASTM F119 oil and grease resistance test
Eppendorf automatic pipette is used for dispensing the oil in ASTM F119 test for making
the amount of pipetted oil more repeatable and taking less time than pipetting with a
medicine dropper. The mass of olive oil pipetted with Eppendorf and plastic Pasteur pi-
pette are shown in Table 14. In the standard, the pipetted amount is six drops whereas the
mass of 200 µl suggests that the amount pipetted with Eppendorf is more than six drops
but slightly less than seven drops. The minimum and maximum values and the standard
deviation tell that with an automatic pipette the amount of olive oil is more uniform than
if it was pipetted with a Pasteur pipette.
Table 14. The mass of olive oil pipetted with Eppendorf and pasteur pipette. From five
parallel measurements also the minimum and maximum values are presented.
mass (mg)
Eppendorf 200 µl 6 drops 7 drops
average 178.0 153.4 189.4
standard deviation 2.92 4.16 7.83
min 174 149 182
max 181 158 200
The effect of temperature
The results from ASTM F119 test at different temperatures are shown in Figure 17 for
Board, in Figure 18 for Board 2 and in Figure 19 for Board 3. Note that the dashes are the
minimum and maximum values of the penetration times. The standard deviation is shown
in the graph for Board 1, but not for Board 2 and Board 3 since calculating the standard
deviation does not give correct results. The reason for this is that for Board 2 and Board 3
must be noted that if the penetration has occurred during the night is the time for the
penetration the last inspection time. This can alter the results and must be kept in mind
when doing the interpretation of the results. New cotton patches were used for Board 3 at
40 ˚C for corn oil and butter and they are marked with an asterisk.

46
Figure 17. ASTM F119 results at different temperatures for Board 1. Relative humidity
is 10 %. Minimum and maximum values marked with a bar and standard deviation
with error bars.
Figure 18. ASTM F119 results at different temperatures for Board 2. Relative humidity
is 10 %. Minimum and maximum values marked with a bar.
0
1
2
3
4
5
6
7
Olive oil Corn oil Butter Oleic acid Lard Castor oil Fish oil
Tim
e (h
)
20 ˚C 40 ˚C 60 ˚C 80 ˚C
0
20
40
60
80
100
120
140
160
180
Olive oil Corn oil Butter Oleic acid
Tim
e (h
)
20 ˚C 40 ˚C 60 ˚C 80 ˚C

47
Figure 19. ASTM F119 results at different temperatures for Board 3. Relative humidity
is 10 %. Minimum and maximum values marked with a bar. Different cotton patches
used at 40 °C with corn oil and butter.
Oleic acid showed the shortest penetration time for most of the boards and temperatures.
Corn oil and clarified butter give similar results except at the temperature of 20 °C. Butter
is solid at 20 °C and the longer penetration time can be explained by this. Olive oil had
the highest penetration times. Castor oil, lard and fish oil were studied with Board 1 at
limited temperatures. Castor oil had significantly higher penetration time, which can be
explained by higher viscosity values. Lard has similar penetration time as corn oil and the
viscosity of lard is similar to corn oil. Fish oil has a slightly longer penetration time than
lard and corn oil. Based on the viscosity values fish oil should have faster penetration
time than lard and corn oil. The surface tension of fish oil or lard were not measured and
the longer penetration time of fish oil might be caused by higher surface tension. The fatty
acid composition of fish oil is different in comparison with corn oil or lard since it is more
saturated fatty acids which might slow the penetration (Lawrence 2010). Also for other
oils viscosity and surface tension values explain the behavior between different oils and
the behavior of a certain oil at different temperatures. In theory the higher the unsaturated
fatty acid concentration is, the more the high temperature affects the oils through oxidi-
zation. The molecular weight and polarity can also affect the penetration. If the oleic acid
used did not contain triglycerides, it its molecular weight significantly smaller than of
other oils. This can explain the faster penetration of oleic acid in comparison to other
studied oils.
The temperature also affects the paperboard and the coating. When the temperature rises
there is more free volume for the oil to flow and the ASTM F119 test time gets shorter.
Since the temperature affects both the penetrant and the substrate (barrier and paperboard)
0
20
40
60
80
100
120
140
160
180
Olive oil Corn oil Butter Oleic acid
Tim
e (h
)
20 ˚C 40 ˚C 60 ˚C 80 ˚C
**

48
it was not possible during this test to quantify if the temperature affects more on the pen-
etrant, barrier or paperboard. Probably it is a combined effect, where the properties of the
oil are changed faster than the properties of the barrier and paperboard.
The effect of relative humidity
The oil and grease resistance was studied at 60 °C having different relative humidity. The
results of these test are in Figure 20 for Board 1, in Figure 20 for Board 2 and in Figure
21 for Board 3. The marked dashes are the minimum and maximum time of the penetra-
tion and standard deviation is only calculated for Board 1. For Board 2 and Board 3 must
be noted that if the penetration has occurred during the night is the time for the penetration
the last inspection time. This can alter the results and must be kept in mind when doing
interpretation of the results. New cotton patches were used at 70 %RH and they are
marked with an asterisk in the graph.
Figure 20. ASTM F119 results for Board 1 at 60 ˚C with different relative humidity.
Maximum and minimum times marked with dashes and standard deviation with error
bars. Different cotton patches used at 70 %RH.
For Board 1 the relative humidity did not have a significant effect on penetration times.
For some of the oils (olive oil and butter) the penetration time decreased but for some
(corn oil and oleic acid) it increased with increasing humidity. Since the penetration time
is so short for Board 1 the differences can be caused by the test procedure where the oil
application can take several minutes when there is dozens of test pieces. The timer is not
started before the assembly is in the oven.
0
0.1
0.2
0.3
0.4
0.5
0.6
0.7
0.8
0.9
Olive oil Corn oil Butter Oleic acid
Tim
e (h
)
60 ˚C/10 %RH 60 ˚C/50 %RH 60 ˚C/70 %RH
* * * *
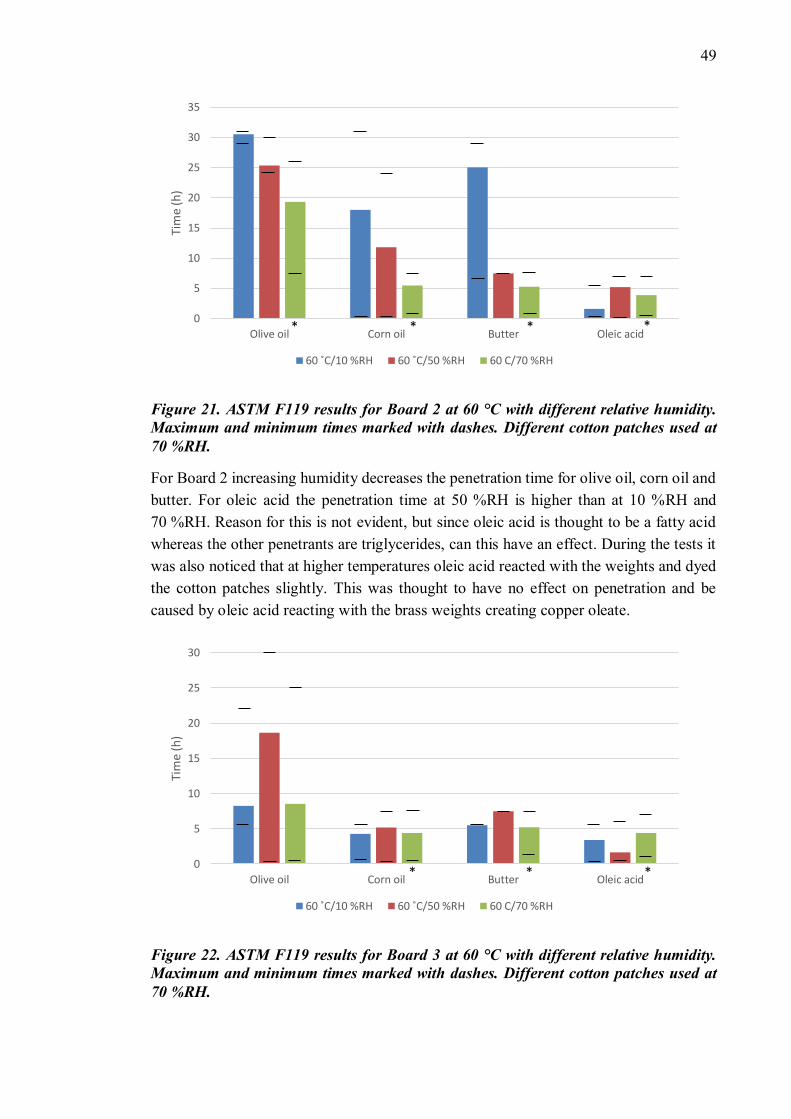
49
Figure 21. ASTM F119 results for Board 2 at 60 °C with different relative humidity.
Maximum and minimum times marked with dashes. Different cotton patches used at
70 %RH.
For Board 2 increasing humidity decreases the penetration time for olive oil, corn oil and
butter. For oleic acid the penetration time at 50 %RH is higher than at 10 %RH and
70 %RH. Reason for this is not evident, but since oleic acid is thought to be a fatty acid
whereas the other penetrants are triglycerides, can this have an effect. During the tests it
was also noticed that at higher temperatures oleic acid reacted with the weights and dyed
the cotton patches slightly. This was thought to have no effect on penetration and be
caused by oleic acid reacting with the brass weights creating copper oleate.
Figure 22. ASTM F119 results for Board 3 at 60 °C with different relative humidity.
Maximum and minimum times marked with dashes. Different cotton patches used at
70 %RH.
0
5
10
15
20
25
30
35
Olive oil Corn oil Butter Oleic acid
Tim
e (h
)
60 ˚C/10 %RH 60 ˚C/50 %RH 60 C/70 %RH
* * * *
0
5
10
15
20
25
30
Olive oil Corn oil Butter Oleic acid
Tim
e (h
)
60 ˚C/10 %RH 60 ˚C/50 %RH 60 C/70 %RH
* * *

50
For Board 3 the results do not follow the same pattern as for Board 2. The reason for this
might be with the possible wrong results at 10 %RH, as explained previously when the
results at different temperatures were presented. Especially with corn oil and butter at
50 %RH the penetration happened during the night for most of the parallel measurements
and the true penetration time is higher. Then the difference between the results at 50 %RH
would be similar with Board 2 except for oleic acid. Oleic acid at 50 %RH for Board 3
has the lowest penetration time whereas with Board 2 it had the highest penetration time.
Humidity can plasticize the barrier coating and also the hydrogen bonds between the cel-
lulose fibers. When the relative humidity is high, and plasticization has occurred, is there
more space for penetrants to flow. In theory at low relative humidity there might be less
water bonded to fibers and in such case, there could be more free volume between the
fibers for oil to flow. But probably this does not explain why the results for Board 3 are
the shortest for olive oil, corn oil and butter with 10 %RH.
The ASTM F119 results correspond with the plasticization theory if the results from
Board 3 at 60 °C 10 %RH are ignored. For Board 1 the penetration time at 60 °C is so
short that the results are not significantly different at different relative humidty. More
precise results might have been obtained if testing would have been performed at 40 °C
for this board.
Jung et al. (2017) has studied the effect of humidity on the structure of vegetable oils at
25 °C for 8 months. After the first 4 months the changes were much smaller than after
8 months. Four different relative humidity were studied and 75 % and 93 % showed big-
ger effect of degradation than 0 % or 32 %. In comparison with corn oil olive oil showed
smaller changes. This can be caused by the amount of polyunsaturated fatty acids since
olive oil has lower content of PUFA than corn oil (see Table 1). ASTM F119 test usually
lasts only a couple of days and the humidity probably does not affect the oil during this
time or has a negligible effect on the results.
Probably the effect of humidity is bigger for barrier and board than for the oil. The
changes caused by the humidity can take time to be noticed and thus the results for
Board 1 do not alter a lot. For Board 2 and Board 3 the penetration times are longer, and
the effect of humidity can be observed easier.
ASTM F119 with dyed olive oil
Board 1, Board 2 and Board 3 were studied with dyed and undyed olive oil and their
results were compared. Results are presented in Table 15. For Board 1 all the samples
penetrated at the same time. For Board 2 the penetration time for the olive oil dyed with
Solvent Green 3 was double the time compared with olive oil or olive oil dyed with Red
Oil O. Some of the test pieces had penetrated during the night, between 7 h and 23 h, and
this can make the real difference smaller. Now the results are calculated with 7 hours even
though the penetration might have occurred closer to 23 hours. New cotton patches were

51
used in this test. Also MD creased Board 2 and Board 3 samples were studied with dyed
olive oil and plain olive oil to compare if it is easier to see the penetration in this case
with dyed oil. Penetration occurred so quickly and the stain spread out on wide area that
the interpretation of the results was as easy with the olive oil than dyed olive oil.
Table 15. ASTM F119 results at 60 °C, 10 %RH with olive oil and dyed olive oil.
Time (h)
Board 1 Board 2 Board 3
Olive oil 0.33 12.42 6.11
Red Oil O + olive oil 0.33 12.50 3.67
Solvent Green 3 + olive oil 0.33 25.83 5.92
Photos of the uncreased (flat) test pieces were taken after all of the parallel test pieces had
penetrated through the board. Thus, from the pictures the intensity of the dyed oil at the
break-through moment cannot be evaluated. During the test the red olive oil gave more
intensive color than the blue/green color. At the break-through of oil the blue/green color
was not as clearly seen as the red color. And the intensity could have been more intensive,
but this can be improved by adding more dye into the oil. The solubility of the dyes in oil
was not tabulated, but in ISO 16532-1-standard similar red dye was added up to 0.25 %
in palm kernel oil. This could suggest that Red Oil O could be added at least close to this
concentration in olive oil or other vegetable oils.
Pictures taken of all parallel samples of Board 2 and Board 3 with olive oil and dyed olive
oil are presented in Appendix B and Appendix C. Photos were taken on a light table with
minimum light intensity. Test pieces were on top of a blotting paper to block the light to
be too intensive. For Board 1 photos do not tell much since the oil has spread throughout
the test piece since the test was continued almost 2 days after the penetration occurred.
Thus this photo is not added to the appendix. The times marked at the oil penetration spot
is the time how many hours before taking the photo the board had penetrated.
If this method is further evaluated, could the test be automated with a camera or scanner.
Temperature should be lowered to 40 °C and the camera or scanner should have operating
temperature at least close to 40 °C. Even more dye could be added to olive oil to see if
the inspection of penetration would become easier. Also samples of a different kind
should be used during the method development since, for example, sometimes there can
be printing on the non-barrier side. Printing can affect the interpretation of the oil break-
through time.
5.3.5 KIT grease resistance test
KIT test results are seen in Table 16. Board 1 has the lowest and Board 3 the highest oil
and grease resistance based on this test. In the ASTM F119 -test the best OGR board was

52
Board 2 whereas KIT test suggests that Board 3 has better OGR. The difference between
these two boards in KIT test is quite small. In the ASTM F119 -test the OGR times had
bigger difference. Board 1 has the worst OGR based on ASTM F119 and KIT test. The
KIT test results are in the same order as the surface energy values. And since KIT test is
designed to measure the quality of fluorochemical treatment, which lowers the surface
energy of the board, is the relation between surface energy values and KIT results logical.
Table 16. The mean KIT test results, rounded to closest 0.5.
Board 1 Board 2 Board 3
average rating 8.0 10.0 10.5
standard deviation 0.44 0.93 1.22
Dissolution of latex
The dissolution of two latexes were studied with KIT 11 -liquid, n-heptane and toluene.
Besides these solvents also castor oil and olive oil were used and all these were compared
with a reference spot where only wiping with a cloth was done.
In Figure 23 are seen the defects on SB-latex caused by the solvents and oils compared
with reference. The lighting in the stereomicroscope images is somewhat different but it
is clearly seen that oils do not cause damage, whereas the solvents do cause a small defect.
Figure 23. Stereomicroscope photos of SB-latex with A) reference wiping, B) castor oil,
C) olive oil, D) KIT 11 test liquid, E) n-heptane and F) toluene.
In Figure 24 are seen the defects on SA-latex. In Figure 24A the unevenness in the refer-
ence is at least partially caused by the latex application process. When examining the

53
latex film without stereomicroscope, no defects caused by the test can be seen in the ref-
erence or oils. KIT 11 test liquid and n-heptane defects are clearly seen in the stereomi-
croscope images, but the defect caused by toluene is better seen with the naked eye. A
round circle, in the area where toluene was dropped, is formed in the latex film with
toluene.
Figure 24. Stereomicroscope photos of SA-latex with A) reference wiping, B) castor oil,
C) olive oil, D) KIT 11 test liquid, E) n-heptane and F) toluene.
Based on Hansen solubility parameter (tabulated in Table 4) styrene has a similar solu-
bility parameter than toluene, but higher than n-heptane. Butadiene on the other hand has
a lower solubility parameter than toluene and n-heptane where the solubility parameter
of acrylate is much higher than with the solvents. Based on Hansen solubility parameters
it could be predicted that SB-latex would dissolve easily or heavier than SA-latex, but in
this test it was the opposite. Hansen solubility parameters has its limitations concerning
the temperature, molecular weight and that it is comprised of three different parameters
itself. Also their closeness when concerning solubility must be noted. Other solvents
would also dissolve latexes based on the solubility parameter since many of the solvents
have similar solubility parameters than many polymers used in latexes (see Table 4). Thus
new KIT liquids having different solvents than n-heptane and toluene were not studied
since the new solvents would probably also have the possibility dissolve latexes. Also
oils might have similar solubility parameters than latexes, but during this test dissolution
was not noticed. Perhaps if longer tests were run could even the oils dissolve latexes.
Dissolution of barrier
In Figure 25 are a SEM-images of Board 1. Here the reference (A) and KIT 11 test liquid
(B), n-heptane (C) and toluene (D) all look similar. The surface of the board is quite
smooth and any defects caused by the solvents are not visible.
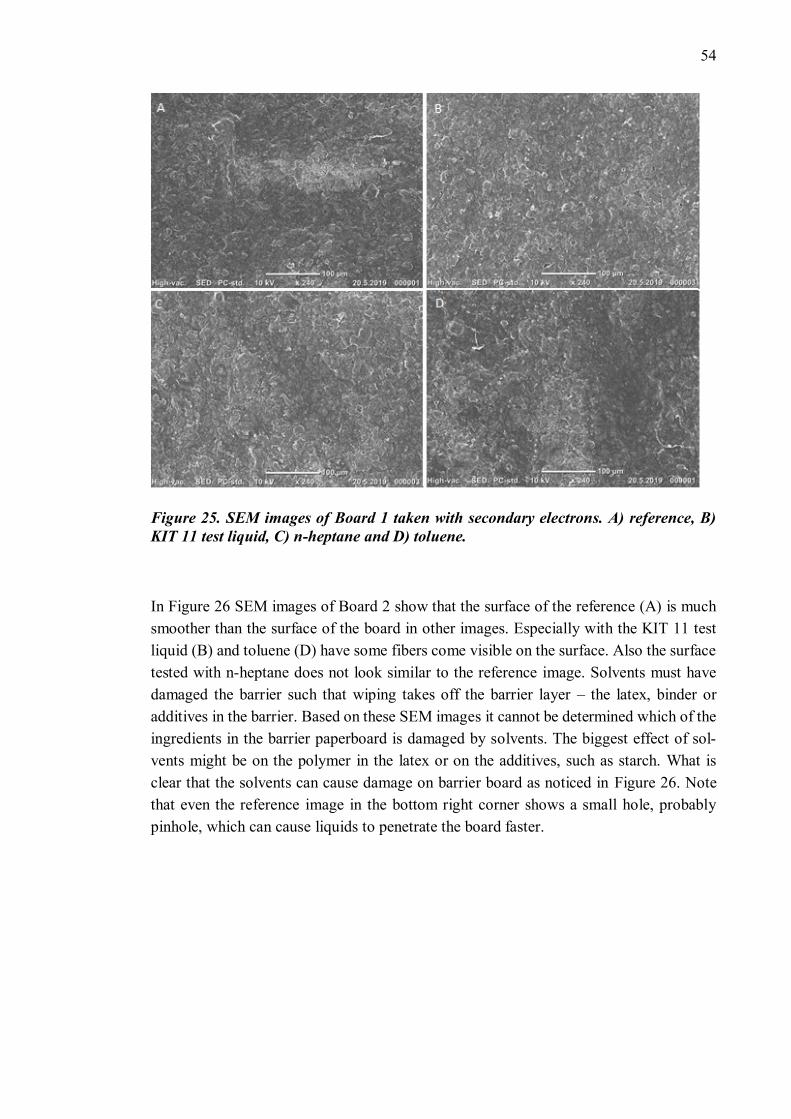
54
Figure 25. SEM images of Board 1 taken with secondary electrons. A) reference, B)
KIT 11 test liquid, C) n-heptane and D) toluene.
In Figure 26 SEM images of Board 2 show that the surface of the reference (A) is much
smoother than the surface of the board in other images. Especially with the KIT 11 test
liquid (B) and toluene (D) have some fibers come visible on the surface. Also the surface
tested with n-heptane does not look similar to the reference image. Solvents must have
damaged the barrier such that wiping takes off the barrier layer – the latex, binder or
additives in the barrier. Based on these SEM images it cannot be determined which of the
ingredients in the barrier paperboard is damaged by solvents. The biggest effect of sol-
vents might be on the polymer in the latex or on the additives, such as starch. What is
clear that the solvents can cause damage on barrier board as noticed in Figure 26. Note
that even the reference image in the bottom right corner shows a small hole, probably
pinhole, which can cause liquids to penetrate the board faster.

55
Figure 26. SEM images of Board 2 taken with secondary electrons. A) reference, B)
KIT 11, C) n-heptane and D) toluene. Note that there are dirt or dust particles in the
images, which are not defects caused by the solvents.
In Figure 27 is a closeup of a damaged area caused by toluene for Board 2. The test has
clearly dissolved something from the surface, it can the latex or one of the additives.
Figure 27. Close-up of defect caused by toluene on Board 2. Image taken with backscat-
tered electrons.
Solvents seemed to dissolve Board 2 and further studies were performed with OptiTopo,
which gives numerical information about the surface topography. From the data gradient

56
and height files did not give information about changes between reference and tested
board. There might have been small changes but from the gradient and height images the
difference was not clearly noticed.
From OptiTopo results the surface roughness between wavelengths 0.03 and 1 mm was
studied since this should show if the solvents change the surface roughness of the board.
Results and presented in Figure 28, where the surface roughness and standard deviation
values of reference and solvents are presented separately. The OptiTopo images were
taken from the same area before the test (reference spot) and after the solvent (“KIT test”).
Marked area was larger than the area from where OptiTopo takes images and thus the
images taken might be taken from slightly different areas.
From the results can be seen that the exact surface roughness values are quite similar and
even though the surface roughness values of the tested area are slightly smaller, the dif-
ference is not meaningful. The standard deviation of KIT test liquid (50/50 n-heptane and
toluene) and n-heptane is larger than the standard deviation of the reference. This could
mean that even though the surface roughness value does not change is there more variance
in surface roughness in the tested area exposed to solvent than in the reference area. For
toluene the standard deviation does not change, although the damage in SEM-images was
clear. OptiTopo test was performed on different test pieces than from where SEM-images
were taken which can explain why the damage, especially for toluene, is clearly seen in
SEM-images but not on the data from OptiTopo.
Figure 28. OptiTopo surface roughness of Board 2 with wavelength 0.03-1 mm.
Based on SEM images taken from Board 1 and Board 2 and OptiTopo images of Board 2
it can be noticed that KIT test liquids and solvents can cause damage to the board. In SEM
images the effect was not visible for Board 1 but Board 2 was damaged by the solvents.
The results from OptiTopo suggest that the roughness of Board 2 gets smaller, but the
0.0
1.0
2.0
3.0
KIT reference KIT N-heptanereference
N-heptane Toluenereference
Toluene

57
effect is not big. Thus, it seems KIT test does not only measure OGR but at least partially
how resistant the board is to n-heptane and toluene.
5.3.6 Hercules sizing tester
Hercules sizing tester results for Board 1 are show in Figure 29. As seen from the graph
the penetration time for olive oil does not get shorter with Solvent Green 3 dye. The mean
test time with dyed olive oil is longer than with olive oil, especially with 95.0 % reflec-
tance end point. It must be noted that the standard deviation for olive oil and dyed olive
oil is quite big. For oleic acid the test time is much shorter than for olive oil. The shorter
test time with oleic acid in comparison with olive oil correlates with ASTM F119 – test
results where oleic acid penetrated Board 1 faster than olive oil did.
Figure 29. Hercules sizing tester results of Board 1 tested with oleic acid, olive oil and
dyed olive oil.
With some of the test parameters, depending on the sample and the reflectance end point
it was noted that the timer resets itself after 3000 seconds. Since the tester automatically
stops the test when reaching the selected reflectance end point, tests were not usually
monitored. A couple of times it seemed like the timer had started from zero before 3000
seconds was reached. These results were discarded.
For Board 5 also lower reflectance values were used since it does not have as good barrier
against oil as Board 1 or Board 2. The effect of the dye was studied with all of these three
70.0
75.0
80.0
85.0
90.0
95.0
100.0
0 10 20 30 40 50 60 70 80 90 100
Ref
lect
ance
(%)
Time (min)
Olive oil Olive oil + Solvent Green 3 Oleic acid
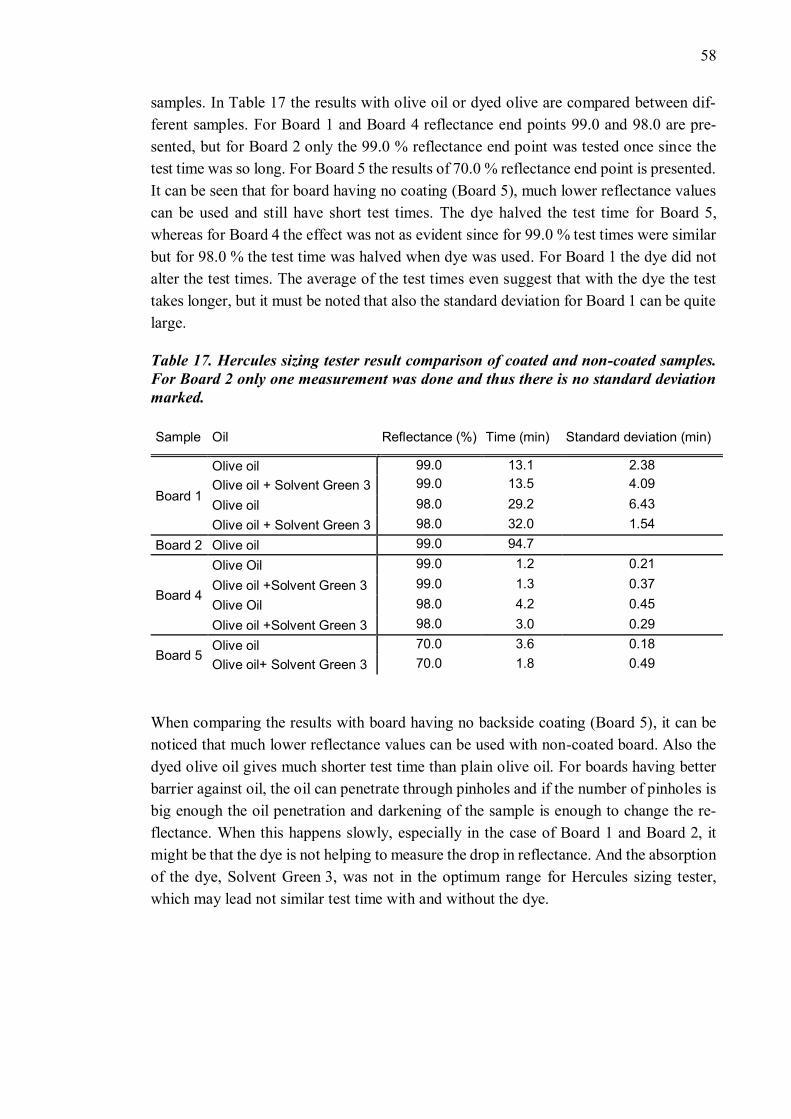
58
samples. In Table 17 the results with olive oil or dyed olive are compared between dif-
ferent samples. For Board 1 and Board 4 reflectance end points 99.0 and 98.0 are pre-
sented, but for Board 2 only the 99.0 % reflectance end point was tested once since the
test time was so long. For Board 5 the results of 70.0 % reflectance end point is presented.
It can be seen that for board having no coating (Board 5), much lower reflectance values
can be used and still have short test times. The dye halved the test time for Board 5,
whereas for Board 4 the effect was not as evident since for 99.0 % test times were similar
but for 98.0 % the test time was halved when dye was used. For Board 1 the dye did not
alter the test times. The average of the test times even suggest that with the dye the test
takes longer, but it must be noted that also the standard deviation for Board 1 can be quite
large.
Table 17. Hercules sizing tester result comparison of coated and non-coated samples.
For Board 2 only one measurement was done and thus there is no standard deviation
marked.
Sample Oil Reflectance (%) Time (min) Standard deviation (min)
Board 1
Olive oil 99.0 13.1 2.38
Olive oil + Solvent Green 3 99.0 13.5 4.09
Olive oil 98.0 29.2 6.43
Olive oil + Solvent Green 3 98.0 32.0 1.54
Board 2 Olive oil 99.0 94.7
Board 4
Olive Oil 99.0 1.2 0.21
Olive oil +Solvent Green 3 99.0 1.3 0.37
Olive Oil 98.0 4.2 0.45
Olive oil +Solvent Green 3 98.0 3.0 0.29
Board 5 Olive oil 70.0 3.6 0.18
Olive oil+ Solvent Green 3 70.0 1.8 0.49
When comparing the results with board having no backside coating (Board 5), it can be
noticed that much lower reflectance values can be used with non-coated board. Also the
dyed olive oil gives much shorter test time than plain olive oil. For boards having better
barrier against oil, the oil can penetrate through pinholes and if the number of pinholes is
big enough the oil penetration and darkening of the sample is enough to change the re-
flectance. When this happens slowly, especially in the case of Board 1 and Board 2, it
might be that the dye is not helping to measure the drop in reflectance. And the absorption
of the dye, Solvent Green 3, was not in the optimum range for Hercules sizing tester,
which may lead not similar test time with and without the dye.

59
5.3.7 Cobb-Unger
The results from Cobb-Unger test can be seen in Figure 30. During the test if was noticed
that uncoated Board 5 absorbed oil significantly even within 30 seconds and oil had pen-
etrated the board after the 60-second test. Board 4 also showed an increase in oil absor-
bency over time, but the test was not performed for 5 and 10 minutes. For Board 1,
Board 2 and Board 3 it cannot be said that oil absorbency increased over time. For
Board 1 it seems that during the 10-minute test more oil was absorbed into it than during
the 5-minute test, which then again has more oil absorbed than in the 3-minute test. How-
ever, a 30-second test and a 10-minute test gave the same oil absorbency values. For
Board 3 a small increase in oil absorbency is noticed, but for Board 2 the values are almost
the same. The small increase in oil absorbency for these three boards can be due to the
filling of the matrix or from wiping off the surplus oil poorly, not from actual absorbency
of the oil into the board.
Figure 30. Cobb-Unger results.
Only small changes can be seen in the results for Board 1, Board 2 and Board 3. The
difference between different boards cannot completely be explained by the surface rough-
ness since Board 2 had the highest surface roughness. Such small amount of oil was ab-
sorbed that probably the oil had just adhered to the barrier layer of paperboard and filled
the unevenness of the surface. Thus, surface roughness could explain the differences if a
surface having bigger roughness adsorbs more oil. On the other hand, Board 1 had the
highest surface energy, and this could partially explain why it absorbed more oil had
Board 2 or Board 3. Board 5, which has no coating on the tested side, absorbs oil signif-
icantly more than any of the coated boards. Therefore, the coating blocks the penetration
to some extent, Board 4 having the lowest barrier against oil from the coated boards.
81.7 ± 2.55 129.6 ± 2.90
0
1
2
3
4
5
30 s 60 s 3 min 5 min 10 min
Oil
abso
rben
cy (g
/m²)
Board 1 Board 2 Board 3 Board 4 Board 5

60
The amount of oil absorbed during the test for Board 1, Board 2 and Board 3 were so
small (maximum measured oil absorbency was 18 mg) that even the smallest changes
during the test can affect the results. The biggest effect is when wiping is done. If wiping
the surplus oil off is done differently, can there sometimes be left more oil on the board
surface than during another test. Thus, it is important that the test procedure is the same
and that same operator does the test. During these tests wiping was done in a similar
manner as much as possible.
5.3.8 Emco DPM ultrasound
Several tests were performed with Emco DPM with different samples. As different drop-
ping velocities were used, were air bubbles formed in the oil when higher velocities were
used, but it appeared not have an effect on the results. Similar conclusions have been
made in the laboratory earlier. The majority of the samples were tested with oleic acid.
Olive oil was tested with Board 1 and the results are seen in Figure 31. In Figure 32 the
penetrating liquid is oleic acid and it can be noticed that curve starts to descend after
~2 minutes whereas with olive oil the curve does not start to go downwards during the
20-minute test. The program calculates that the local maximum is reach after 13 minutes,
but the curve does not seem to descend. The S-value calculated by the program with oleic
acid is not practical since it comes from a small area, not from the whole descending part
of the curve. The slope of the curve (S-value) could be calculated by hand if needed. The
tB time, which should tell about wetting, is calculated by the program to be 788 seconds
to olive oil and 139 seconds to oleic acid. The different behavior of olive oil and oleic
acid can be explained at least partially by the lower surface tension and viscosity of oleic
acid. The lower S-value also correlates with ASTM F119 results where oleic acid pene-
trated the boards faster than olive oil.

61
Figure 31. Board 1 with olive oil as penetrating liquid. Test time 20 minutes.
Figure 32. Board 1 with oleic acid as penetrating liquid. Test time 20 minutes.
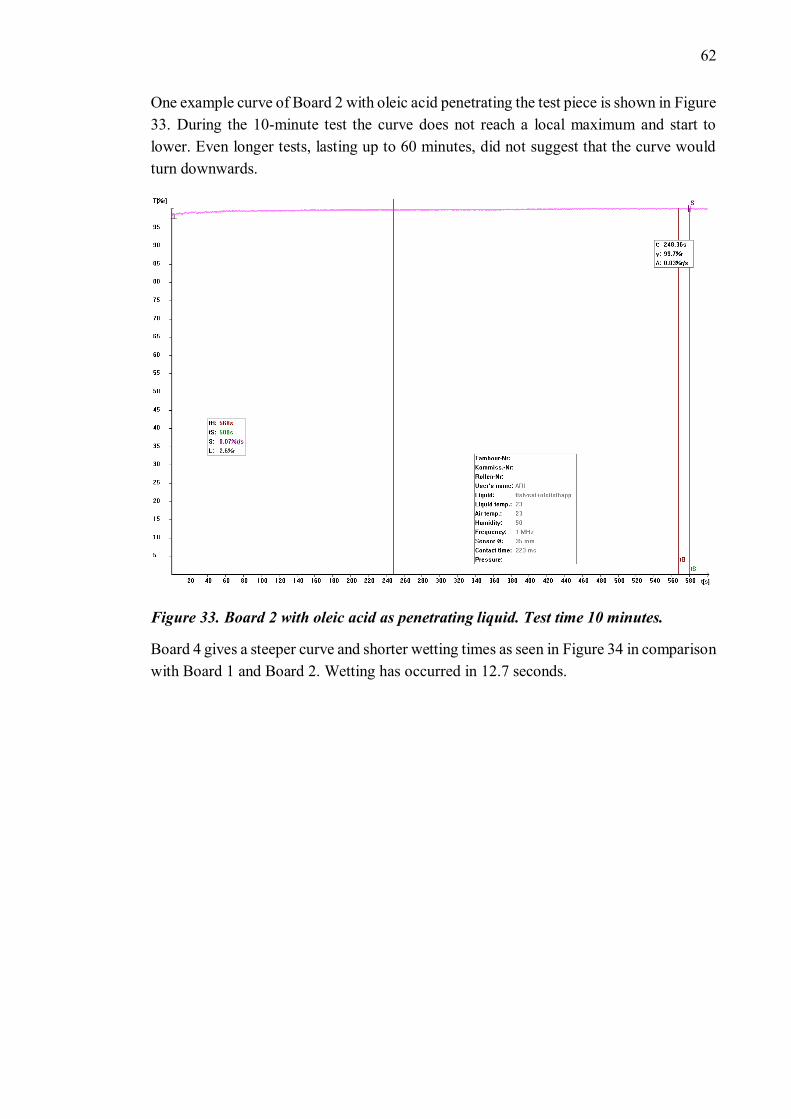
62
One example curve of Board 2 with oleic acid penetrating the test piece is shown in Figure
33. During the 10-minute test the curve does not reach a local maximum and start to
lower. Even longer tests, lasting up to 60 minutes, did not suggest that the curve would
turn downwards.
Figure 33. Board 2 with oleic acid as penetrating liquid. Test time 10 minutes.
Board 4 gives a steeper curve and shorter wetting times as seen in Figure 34 in comparison
with Board 1 and Board 2. Wetting has occurred in 12.7 seconds.

63
Figure 34. Board 4 with oleic acid as penetrating liquid. Test time 10 minutes.
Board 5 wets immediately after the beginning of the test as seen in Figure 35 and more
clearly in Figure 36, which shows the first 10 seconds of the test. The dropping velocity
has been too slow for the rising wetting curve to be seen in the graph. Based on the pa-
rameters calculated by the program, wetting occurred in 222 ms, whereas for Board 4
wetting occurred in ~13 second and for Board 1 after 2 minutes. No clear results for wet-
ting for Board 2 was obtained during this study.

64
Figure 35 Board 5 with oleic acid as penetrating liquid. Test time 10 minutes.
Figure 36 Board 5 with oleic acid as penetrating liquid. Graph show the first 10 seconds
of the 10-minute test.

65
For different samples artificial pinholes were made with a needle and samples were tested
with Emco DPM. But since it was impossible to produce similar pinholes were the results
incomparable. With a laser, pinholes could be made to be similar from sample to sample.
With small amount of artificial pinholes, the start of descending of the curve could be
studied. Increasing the amount of pinholes and getting different results could then be
compared with ASTM F119 or KIT test results with samples treated similarly to see how
pinholes affect OGR tests and how it is seen in the ultrasound measurements.
It must be noted that during the tests some of the tests did not give easily interpretable
curves. Occasionally there was a lot of noise in the curves, sometimes the curve started
to descend with a steep slope even if the previous or following test piece showed only
ascending evident (usually Board 2). This made the interpretation of Emco DPM results
difficult since the reason for the dissimilar curves was not clear. The theory behind the
measurement is based on the ultrasound and its change of ultrasound velocity in different
mediums. But since there can be simultaneous actions happening when oil is penetrating
the board, it was not comprehended what phenomenon was behind in every part of the
curve. In theory ultrasound could be utilized for studying barrier properties even if the
barrier properties are moderate or excellent since the penetrating medium does not have
to flow through the paperboard to get results. Further studies would still be needed to run
and heating the oil would give results faster. For quality test the curve does not need to
start descending. The quality of the barrier could be based on the time that it must last
before the curve can start to descend. But barrier paperboard with different oil and grease
rating should be studied to find out the correct limit for good and bad barrier in ultrasound
measurements. For example, for Board 1 in ASTM F119 test the penetration of oleic acid
and olive through the samples at 20 °C and 10 %RH had mean values over an hour for
oleic acid and over two hours for olive oil. Thus not surprisingly the curves for Emco
DPM do not start to descend steeply within 10 or 20 minutes since the barrier against the
oils is in good level. For Board 2 the ASTM F119 results were even better – several days
for oleic acid and olive oil at 20 °C and 10 %RH – and thus it is expected that the curve
does not start to descend in 10 minutes.
66
6. CONCLUSIONS
Based on the viscosity, surface tension and ASTM F119 results at different conditions the
temperature has a significant effect on the oil and grease resistance test results. The higher
the temperature the lower the viscosity and surface tension of the oils were. The surface
tension of corn oil and olive oil were measured, and they followed the literature values to
some extent (Sahasrabudhe et al. 2017). Also the viscosity of oils were measured at dif-
ferent temperatures and some of them were compared with the literature values (Brock et
al. 2008). Based on the measured and literature values it is clear that all of the oils have
descending surface tension and viscosity over rising temperature. The chemical structure
of the oils can have an effect on the penetrating. The higher the molecular weight is, the
higher can the penetration time be. The effect of this was not distinct in this study since
the theoretical molecular weight of olive oil and corn oil are almost the same but corn oil
penetrated the studied samples faster. Also, the level of saturation can have an effect on
the penetration and this can explain the difference between olive oil and corn oil. At high
temperatures oil can be oxidized and this can alter the penetration time. Polyunsaturated
oils are more prone to oxidization and thus for example corn oil could degrade more than
olive oil.
The effect of temperature on ASTM F119 -test was clear and the temperature affects the
paperboard and the barrier besides changing the properties of oils. Temperature can create
more free volume in the paperboard and barrier and thus the flow rate increases. During
the experimental part it was not possible to quantify how much the temperature effects
on oil, barrier or paperboard.
When studying how humidity affects the penetration some of the results were not unam-
biguous. In theory humidity can plasticize barrier and paperboard but has a negligible
effect on the oil when the penetration time is just days. Plasticization of barrier and pa-
perboard creates more free volume and penetrants, such as oil, can flow faster. It must be
noted that also the oil can plasticize barrier and paperboard. The penetration time did not
decrease as significantly with increasing humidity as it did with increasing temperature.
It can take more time than an hour or a few days for humidity to cause changes in the
barrier whereas temperature changes the viscosity and surface tension of the oils much
faster.
Besides considering the effect of different oils, the temperature or humidity on the OGR
should also the ageing of the paperboard be considered. Ageing can especially affect the
barrier.
Making the oil and grease resistance testing easier, should either the interpretation be
made unambiguous or with the help of image analysis. With the help of red dye was the

67
break-through of oil noticed easier in the tests. Even higher amount of dye dissolved into
oil than what were used in this study could make the interpretation even easier.
One target of the study was to find out how KIT-test works and if it causes damages to
the paperboard. It was clearly seen that KIT-solvents dissolve latexes whereas castor oil
or olive oil did not. From the SEM images the dissolution was not seen as clearly. For
Board 1 there was not any difference between the reference and board exposed to sol-
vents. For Board 2 some defects were visible on the surface and all in all the SEM images
showed that the surface of the reference was smoother than the surface of the exposed
board. Based on the theoretical solubility parameters many of the solvents should dissolve
latexes, but the parameters do not take into account the rate of dissolution. Also oils
should dissolve latexes based on the solubility parameters but such behavior was not no-
ticed during the studies.
The dissolution could be further investigated if latex film dissolution in the solvents was
studied gravimetrically. The boards could be exposed to the solvents for longer period of
time and then studied under SEM or OptiTopo to see bigger changes. This longer test
would not anymore mimic KIT test but would better show if the barrier will dissolve into
solvents. FTIR tests performed before and after the KIT test could also tell what kind of
changes happens in the barrier. FTIR could tell is it additives or latex that is dissolved
during the KIT test.
When considering the possibility of utilizing the studied test methods for quality testing
at the laboratory of the mill, none of the methods seem to be suitable as such. Different
factors restrict their usability. Hercules sizing tester has a lot of variance in the results,
the reflectance end point is too high, and the duration of the test is too long. Emco DPM
could in theory give information about the quality of the barrier since the penetrating oil
does not have to penetrate through the sample to get results as is the case with HST. Also
Emco DPM had some variation in the results. The duration of the test might be too long
for quality testing, although heating the oil might give shorter test times. Cobb-Unger test
duration can be shorter than with HST and Emco DPM, but Board 1, Board 2 and Board 3
did not absorb oil even if the test time was lengthened up to 10 minutes. Board 1 absorbed
slightly more oil than Board 2 or Board 3, so Cobb-Unger might be used for separating
boards having coating of different kind but perhaps not to test the quality of production
as such. The standard deviation of the test was quite small, which is good. Oil having
lower viscosity and surface tension could be absorbed more into the board and give dif-
ferent results, especially in Cobb-Unger since castor oil has higher viscosity and surface
tension compared with olive oil or oleic acid (Melo-Espinosa et al. 2014). During the
studies and tests it seemed that a direct method probably is not suitable since the barrier
levels are so high that the oil does not penetrate the barrier fast enough. Thus an indirect
method might be better for fast quality testing, but it has its disadvantages as in the case

68
of KIT-test and the dissolution of the barrier. If any test method is to be taken into oper-
ation should different operators do the tests to see if there are variance between the results
from different operators.
Air permeance have been used in studying oil and grease resistance compared with KIT-
test, Cobb-Unger and Tappi T454-test. Olsson et al. (2014) noticed that Bendtsen method
ISO 5636-3 did not give difference between the results of their samples coated with starch
or latex, air permeance was zero or close to zero. Instead Scan-P 76 found differences
between the samples and correlated to some extent to the mentioned oil and grease re-
sistance test. Samples with zero air permeance achieved the maximum time (1800 s) in
Tappi T454 -test, but maximum time was also reached even if the air permeance differed
from zero. Cobb-Unger results did not vary significantly. But for some samples with
higher air permeance the test lasted a shorter time than samples having lower air perme-
ance. This can be explained by the different coating and thus the air permeance might not
be suitable for all kind of boards and to the comparison of board with different kind of
coating.
Besides the air permeability tests, further studies could involve the comparison of the
results with fluorochemical treated paperboard, especially the KIT-test and ASTM F119
-test. KIT-test is originally designed for paperboard with fluorochemical treatment and
similar KIT-test results might result in ASTM F119 results of a different kind or vice
versa in comparison with dispersion or extrusion coated paperboard. Besides the temper-
ature and humidity, could also ageing of the paperboard be one of the factors affecting oil
and grease resistance and this could be one of the aspects of further studies. Also, different
kind of converting operations of the packaging and their effect on OGR could be tested.
For example, creasing in 45 ° or in other angles could be performed besides MD and CD
creasing. The effect of gluing or heat sealing might locally weaken the oil and grease
resistance and the consequence of other operations is worth studying.

69
REFERENCES
Abdelraziq, I. R., Nierat, T. H. (2015). Rheology Properties of Castor Oil: Temperature
and Shear Rate-dependence of Castor Oil Shear Stress. Journal of Material Science En-
gineerging, Vol. 5(1). Available (Accessed on 13.1.2019): https://doi.org/10.4172/2169-
0022.1000220.
Abulencia, J. P., Theodore, L. (2010). Fluid Flow for the Practicing Chemical Engineer.
John Wiley & Sons, Inc. 582 p.
Alén, R. (2007). Papermaking science and technology: Book 4, Papermaking chemistry.
Helsinki: Finnish Paper Engineers' Association: Paperi ja puu. 255 p.
Andersson, C. , Ernstsson, M. and Järnström, L. (2002), Barrier properties and heat seal-
ability/failure mechanisms of dispersion‐coated paperboard. Packaging Technology and
Science, Vol. 15(4), pp. 209-224 Available (Accessed on 31.1.2019):
https://doi.org/10.1002/pts.590.
Applied Paper Technology Inc. Hercules Size Test (HST). Available (Accessed on
4.6.2019): http://appliedpapertech.com/test-methods/hercules-size-test-hst/.
ASTM F 119-82, Standard Test Method for Rate of Grease Penetration of Flexible Bar-
rier Materials (Rapid Method). ASTM International, West Conshohocken, PA, 2015,
www.astm.org.
Batista, M.M., Guirardello, R. & Krähenbühl, M.A. (2015). Determination of the Hansen
Solubility Parameters of Vegetable Oils, Biodiesel, Diesel, and Biodiesel–Diesel Blends.
Journal of the American Oil Chemists' Society. Vol. 92(1)., pp. 95-109. Available (Ac-
cessed on 13.1.2019): https://link.springer.com/article/10.1007/s11746-014-2575-2.
Bormashenko, Edward Yu. (2013). Wetting of Real Surfaces. De Gruyter. 170 p.
Brock, J., Nogueira, M. R., Zakrzevski, C., de Castilhos Corazza, F., Corazza, M. L., de
Oliveira, J. V. (2008). Determinação experimental da viscosidade e condutividade
térmica de óleos vegetais. Food Science and Technology, Vol .28(3), pp. 564-570. Avail-
able (Accessed on 13.1.2019): https://doi.org/10.1590/S0101-20612008000300010.
Casey, J. P. (1961). Pulp and paper chemistry and chemical technology: 3, Paper testing
and converting (2. ed.). New York: Interscience. 1003 p.
CEPI: Key Statistics 2017. Available (Accessed on 28.1.2019): http://www.cepi.org/sys-
tem/files/public/documents/publications/statistics/2018/210X140_CEPI_Bro-
chure_KeyStatistics2017_WEB.pdf.

70
Deisenroth, E., Jho, C., Haniff, M. (1998) The designing of a new grease repellent fluo-
rochemical for the paper industry. Surface Coatings International, Vol. 81(440), pp. 440-
447. Available (Accessed on 31.1.2019): https://doi.org/10.1007/BF02692974.
Emco DPM 66, Universal Ultrasonic Transmission Measurement. Emco Leipzig. Avail-
able (Accessed on 11.2.2019): https://www.emco-leipzig.com/viomatrix/imgs/em-
codpm_e.pdf.
Emtec, PDA.C 02 MST - Module Standard. Available (Accessed on 4.6.2019):
https://www.emtec-electronic.de/en/pda-c-02-mst-module-standard.html.
Gietl, M. L., Schmidt, H-W., Giesa, R., Terrenoire, A., Balk, R. (2009). Semiquantitative
method for the evaluation of grease barrier coatings, Progress in Organic Coatings, Vol.
66(2), pp. 107-112. Available (Accessed on 28.1.2019):
https://doi.org/10.1016/j.porgcoat.2009.06.009.
Gigac, J., Stankovska, M., Fiserova, M. (2018). Improvement of oil and grease resistance
of cellulosic materials. Wood Research. Vol. 63(5), pp. 871-886. Available (Accessed on
28.1.2019): http://www.woodresearch.sk/wr/201805/12.pdf.
Ham-Pichavant, F., Sèbe, G., Pardon, P., Coma, V. (2005). Fat resistance properties of
chitosan-based paper packaging for food applications. Carbohydrate Polymers. Vol.
61(3), pp. 259-265. Available (Accessed on 31.1.2019): https://doi.org/10.1016/j.car-
bpol.2005.01.020.
Hercules sizing tester. TAF300 series instruction manual. (2015). The Aderhold firm,
Available at (accessed on 11.2.2019): http://aderholdfirm.com/ader-
hold_firm_files/HST_Documents/TAF-300-Series-Instruction-Manual-web.pdf.
Hildebrand, H. J. (1980). An improvement in the theory of regular solutions. Proceedings
of the National Academy of Sciences of the United States of America. Vol. 76(12),
pp. 6040-6041. Available (Accessed on 23.5.2019): https://pdfs.seman-
ticscholar.org/8bae/595cc93f4b05fb38c809eb3e6d2790983df1.pdf.
Holik, H. (2006). Handbook of paper and board. Weinheim: Wiley-VCH Verlag. 505 p.
Hyväluoma, J., Raiskinmäki, P., Jäsberg, A., Koponen, A. Kataja, M., Timonen, J.
(2006). Simulation of liquid penetration in paper. Physical review. E, Statistical, nonlin-
ear, and soft matter physics. Vol. 73(3 Pt. 2).
Häggblom-Ahnger, U., Komulainen, P. (2001). Paperin ja kartongin valmistus (2. tark.
p.). Helsinki: Opetushallitus. 290 s.
ISO 16532-1:2008 Paper and board – Determination of grease resistance – Part 1: Per-
meability test. International Organization for Standardization, Geneva, Switzerland.

71
ISO 16532-1:2007 Paper and board — Determination of grease resistance – Part 2: Sur-
face repellency test. International Organization for Standardization, Geneva, Switzerland.
ISO 534:2011 Paper and board — Determination of thickness, density and specific vol-
ume. International Organization for Standardization, Geneva, Switzerland.
ISO 536:2012 Paper and board — Determination of grammage. International Organiza-
tion for Standardization, Geneva, Switzerland.
ISO 5636:2013 Paper and board — Determination of air permeance (medium range). In-
ternational Organization for Standardization, Geneva, Switzerland.
ISO 4046-4:2016 Paper, board, pulps and related terms — Vocabulary — Part 4: Paper
and board grades and converted products. International Organization for Standardization,
Geneva, Switzerland.
Jung, J. , Gim, S. Y., Lee, C. , Kim, M. and Lee, J. (2017), Stability of tocopherol homo-
logs in soybean, corn, canola, and olive oils under different moisture contents at 25°C.
Eur. J. Lipid Sci. Technol., Vol. 119(6). Available (Accessed on 13.6.2019):
https://doi.org/10.1002/ejlt.201600157.
Kahl, H, Wadewitz, T., Winkelmann, J. (2003). Surface Tension of Pure Liquids and
Binary Liquid Mixtures. Journal of Chemical & Engineering Data. Vol. 48(3), pp. 580–
586. Available (Accessed on 31.1.2019): https://doi.org/10.1021/je0201323.
Kirwan, M. J. (2012). Handbook of Paper and Paperboard Packaging Technology, John
Wiley & Sons, Incorporated, Hoboken. 409 p.
Krainer, S., Hirn U. (2018). Short timescale wetting and penetration on porous sheets
measured with ultrasound, direct absorption and contact angle. RSC Advances, Vol.
8(23), pp. 12861-12869. Available (Accessed on 12.2.2019):
https://doi.org/10.1039/c8ra01434e.
KRÜSS GmbH, Hamburg, www.kruss-scientific.com.
Kuusipalo, J. (2008). Papermaking science and technology: Book 18, Paper and paper-
board converting. Helsinki: Fapet. 346 p.
Lawrence, G. D. (2010). The Fats of Life : Essential Fatty Acids in Health and Disease,
Rutgers University Press, ProQuest Ebook Central. 280 p. Available at (Accessed on
12.2.2019): https://ebookcentral.proquest.com/lib/tampere/detail.action?docID=870066.
Levlin, J., Söderhjelm, L. (1999). Papermaking science and technology: Book 17, Pulp
and paper testing. Helsinki: Fapet. 287 p.

72
Liang, C., & Schwarzer, K. (1998). Comparison of four accelerated stability methods for
lard and tallow with and without antioxidants. Journal of the American Oil Chemists’
Society (JAOCS), Vol. 75(10), pp. 1441–1443. Available (Accessed on 23.5.2019):
https://doi.org/10.1007/s11746-998-0196-3.
Marjański, W., Järvelä, P., Penttinen, T. (1996). Grease resistance test method for poly-
mer coated cartonboard packaging materials. Journal of Materials Science Letter, Vol..
15(24), pp. 2195–2199. Available (Accessed on 14.3.2019):
https://doi.org/10.1007/BF00241166.
Maszewska, M., Florowska, A., Dłużewska, E., Wroniak, M., Marciniak-Lukasiak, K., &
Żbikowska, A. (2018). Oxidative Stability of Selected Edible Oils. Molecules (Basel,
Switzerland), Vol.23(7), p. 1746. Available (Accessed on 23.5.2019):
https://doi.org/10.3390/molecules23071746.
Melo-Espinosa, E. A., Sánchez-Borroto, Y., Errasti, M., Piloto-Rodríguez, R., Sierens,
R., Roger-Riba, J., Christopher-Hansen, Al. (2014). Surface Tension Prediction of Veg-
etable Oils Using Artificial Neural Networks and Multiple Linear Regression, Energy
Procedia. Vol 57, pp. 886-895. Available at (accessed on 13.1.2019):
https://doi.org/10.1016/j.egypro.2014.10.298.
Metsä Board Internal (2009).
Metsä Board Products, MetsäBoard., website. Available (Accessed on 28.1.2019):
https://www.metsaboard.com/Customers/Pages/default.aspx.
Moody, V., Needles H. L.. (2004) Stain Blockers and Fluorochemicals, Tufted Carpet,
William Andrew Publishing, pp. 177-191, Available (Accessed on 28.4.2019):
https://doi.org/10.1016/B978-188420799-0.50017-8.
Niskanen, K. (2008). Papermaking science and technology: Book 16, Paper physics. Hel-
sinki: Fapet. 360 p.
Noureddini, H., Teoh, B C. Davis Clements, L. (1992) Viscosities of vegetable oils and
fatty acids. Papers in Biomaterials. Vol 69(12), pp. 1189-1191. Available (Accessed on
13.1.2019): https://doi.org/10.1007/BF02637678.
Olsson, E., Johansson, C., Larsson, J., Järnström, L. (2014) Montmorillonite for starch-
based barrier dispersion coating — Part 2: Pilot trials and PE-lamination. Applied Clay
Science. Vol. 97–98, pp. 167-173. Available (Accessed on 28.4.2019):
https://doi.org/10.1016/j.clay.2014.04.039.
Ovaska, S-S. (2016) Oil ang grease barrier properties of converted dispersion-coated pa-
perboards. Doctor’s thesis. Lappeenranta University of Technology. 101 p.

73
Paltakari, J. (2009). Papermaking science and technology: Book 11, Pigment coating and
surface sizing of paper. Helsinki: Finnish Paper Engineers' Association. 615 p.
Paulapuro, H. (2000). Papermaking science and technology: Book 18, Paper and board
grades. Helsinki: Fapet. 134 p.
Paulapuro, H. (2008). Papermaking science and technology: Book 8, Papermaking part
1, Stock preparation and wet end. Helsinki: Fapet. 516 p.
Rance, H. F. (1982). Handbook of paper science: The science and technology of pa-
permaking, paper properties and paper usage. Vol. 2, The structure and physical proper-
ties of paper. Amsterdam: Elsevier. 288 p.
Rance, H. F. (1988). Handbook of paper science: The science and technology of pa-
permaking, paper properties and paper usage. Vol. 1, The raw materials and processing
of papermaking. Amsterdam: Elsevier. 298 p.
Rasi, M. (2013). Permeability properties of paper materials. Dissertation. University of
Jyväskylä. 139 p.
Raymond, J. R. (2004) Liquid penetration into paper. Thesis. The Australian National
University. 330 p.
Roponen, H., Laboratory Manager, MetsäBoard Oyj. Personal interview on 12.3.2019.
Rousu, S., Lindström, M., Gane, P., Pfau A., Schädler, V., Wirth, T., Eklund, D., (2003).
Influence of latex – oil interactions on offset ink setting and component distribution on
coated paper. Journal of Graphic Technology 1.2. Pp. 45–56. Available (Accessed on
19.2.2019): https://www.omya.com/Documents/Publications/22%20Influence %20of
%20 Latex%20Oil%20Interaction.pdf.
Sahasrabudhe, S. N., Rodriguez-Martinez, V., O’Meara, M., Farkas, B. E. (2017) Den-
sity, viscosity, and surface tension of five vegetable oils at elevated temperatures: Meas-
urement and modeling, International Journal of Food Properties, Vol. 20(2), pp. 1965–
1981. Available (Accessed on 11.1.2019): https://doi.org/10.1080/10942912.2017.
1360905.
Scan-P 37:77 Oil Absorbency, Cobb-Unger Method. (1976) Scandinavian Pulp, Paper
and Board Testing Committee.
SFS-EN 14370. Surface active agents. Determination of surface tension. 2005 Finnish
Standards Association. Helsinki, Finland.
Sperling, L. H. (2006). Introduction to physical polymer science (4. ed.). Hoboken, N.J:
Wiley. 880 p.

74
Technical Association of the Pulp and Paper Industry. (1950) TAPPI T 559 pm-96,
Grease resistance test for paper and paperboard, Test Method T 559 pm-96. New York:
Technical Association of the Pulp and Paper Industry.
Velásquez, A. M., Hoyos, B. A. (2017). Viscosity of heptane-toluene mixtures. Compar-
ison of molecular dynamics and group contribution methods. Journal of Molecular Mod-
eling. Vol 23(58). Available (Accessed on 31.1.2019): https://doi.org/10.1007/s00894-
017-3223-1.
Wang, J., Gardner, D. J., Stark, N. M., Bousfield, D. W., Tajvidi, M., Cai, Z. (2018)
Moisture and Oxygen Barrier Properties of Cellulose Nanomaterial-Based Films. ACS
Sustainable Chemistry & Engineering. Vol. 6(1)., pp. 49-70. Available (Accessed on
23.5.2019): https://doi.org/10.1021/acssuschemeng.7b03523.
Yang, L., Pelton, R., Mclellan, F., Fairbank, M. (1999). Factors influencing the treatment
of paper with fluorochemicals for oil repellency. Tappi Journal. Vol 82(9), pp. 128–135.
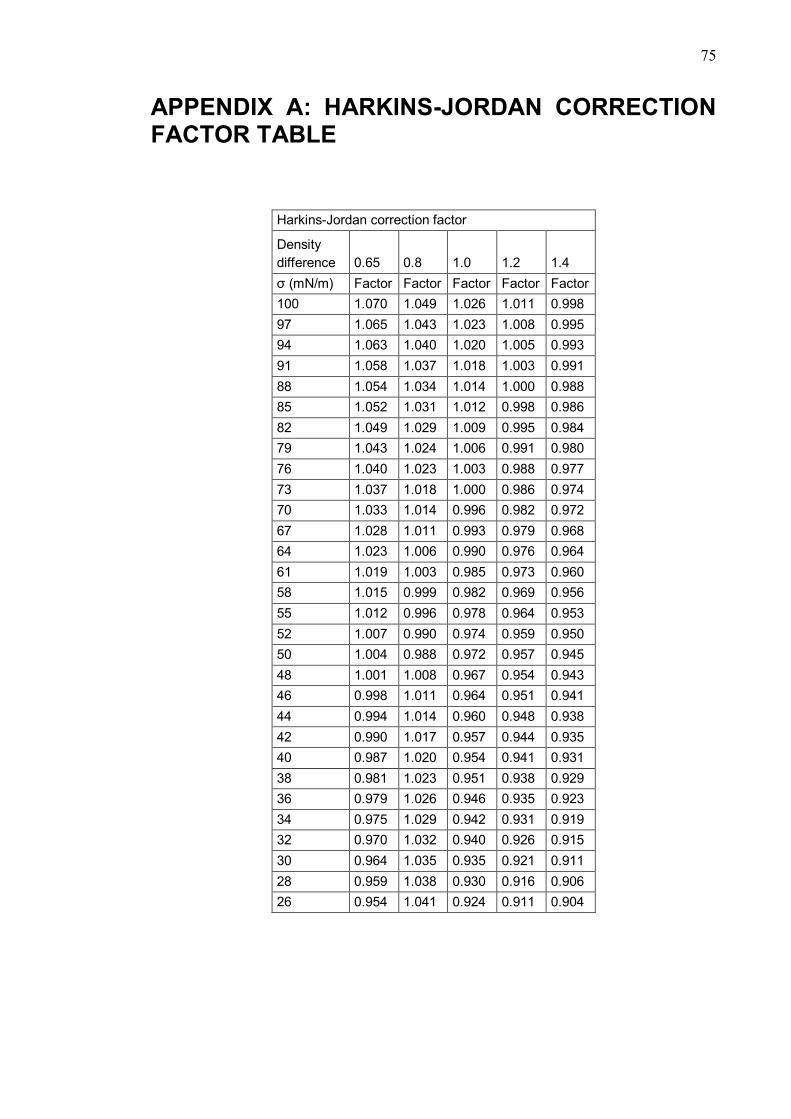
75
APPENDIX A: HARKINS-JORDAN CORRECTION FACTOR TABLE
Harkins-Jordan correction factor
Density
difference 0.65 0.8 1.0 1.2 1.4
σ (mN/m) Factor Factor Factor Factor Factor
100 1.070 1.049 1.026 1.011 0.998
97 1.065 1.043 1.023 1.008 0.995
94 1.063 1.040 1.020 1.005 0.993
91 1.058 1.037 1.018 1.003 0.991
88 1.054 1.034 1.014 1.000 0.988
85 1.052 1.031 1.012 0.998 0.986
82 1.049 1.029 1.009 0.995 0.984
79 1.043 1.024 1.006 0.991 0.980
76 1.040 1.023 1.003 0.988 0.977
73 1.037 1.018 1.000 0.986 0.974
70 1.033 1.014 0.996 0.982 0.972
67 1.028 1.011 0.993 0.979 0.968
64 1.023 1.006 0.990 0.976 0.964
61 1.019 1.003 0.985 0.973 0.960
58 1.015 0.999 0.982 0.969 0.956
55 1.012 0.996 0.978 0.964 0.953
52 1.007 0.990 0.974 0.959 0.950
50 1.004 0.988 0.972 0.957 0.945
48 1.001 1.008 0.967 0.954 0.943
46 0.998 1.011 0.964 0.951 0.941
44 0.994 1.014 0.960 0.948 0.938
42 0.990 1.017 0.957 0.944 0.935
40 0.987 1.020 0.954 0.941 0.931
38 0.981 1.023 0.951 0.938 0.929
36 0.979 1.026 0.946 0.935 0.923
34 0.975 1.029 0.942 0.931 0.919
32 0.970 1.032 0.940 0.926 0.915
30 0.964 1.035 0.935 0.921 0.911
28 0.959 1.038 0.930 0.916 0.906
26 0.954 1.041 0.924 0.911 0.904

76
APPENDIX B: ASTM F119 RESULTS FOR BOARD 2 WITH DYED OLIVE OIL
Marked time tells how many hours before the photo was taken did the penetration
occur.
47,5 h 25-41 h 25-41 h
25-41 h 25-41 h
45 h
18 h
17 h
22 h
25-41 h
21 h
25-41 h
47 h 17 h
25-41 h 17 h
23 h 17 h

77
APPENDIX C: ASTM F119 RESULTS FOR BOARD 3 WITH DYED OLIVE OIL
Marked time tells how many hours before the photo was taken did the penetration
occur.
25-41 h
25-41 h 25-41 h
25-41 h
25-41 h 25-41 h
25-41 h 25-41 h
25-41 h 25-41 h 25-41 h
46.5 h
22 h
47.5 h
47.5 h
45.5 h 45.5 h 45.5 h