oil crops outlook: prices in the soybean complex
TRANSCRIPT

The U.S. Department of Agriculture (USDA) raised its 2007/08 forecast of U.S. soybean exports this month by 20 million bushels to 995 million. Along with a 5-million-bushel increase in the 2007/08 forecast of soybean crush to 1.825 billion bushels, the 2007/08 forecast of U.S. ending stocks shrank to 185 million bushels from 573 million in 2006/07. The forecast of the 2007/08 U.S. average farm price was raised from $8.50-$9.50 to $9.25-$10.25 per bushel. Even in the face of more costly soybeans, robust purchases from China led to an increase in the forecast of that country’s 2007/08 imports by 0.5 million metric tons to 34 million. For India, the estimate of domestic oilseed output was raised by 1.3 million tons to 33.2 million due to larger crops of soybeans, peanuts, and cottonseed. For India’s soybeans, the 2007 production estimate was increased by 1 million tons to 9.2 million.
Figure 1U.S. export commitments for soybean meal and soybean oil start briskly
0
1
2
3
4
5
6
7
8
Oct 25 Nov22
Dec20
Jan 17 Feb14
Mar13
Apr 10 May 8 Jun 5 Jul 3 Jul 31 Aug28
Sep26
Source: U.S. Export Sales , Foreign Agricultural Service, USDA.
Million metric tons
0
100
200
300
400
500
600
700
8001,000 Metric tons
Soybean meal--2006/07Soybean meal--2007/08Soybean oil--2006/07 (right axis)Soybean oil--2007/08 (right axis)
Oil Crops Outlook Mark Ash and Erik Dohlman Prices in the Soybean Complex Approaching Historic Highs
OCS-07k Dec. 12, 2007
Contents Domestic Outlook Intl. Outlook Contacts & Links Tables Soybean S&D Soybean Meal Soybean Oil Cottonseed Cottonseed Meal Cottonseed Oil Peanuts Oilseed Prices Veg. Oil Prices Oilseed Meal Prices Web Sites WASDE Oilseed Circular Soybean Briefing Room ------------- The next release is Jan. 14, 2008 -------------- Approved by the World Agricultural Outlook Board.

Domestic Outlook
2 Oil Crops Outlook/OCS-07k/December 12, 2007
Economic Research Service, USDA
Robust Export Sales Commitments Signal a Smaller Soybean Carryout As of December 6, U.S. export inspections of soybeans totaled 345 million bushels, lagging last year’s pace by 69 million bushels. However, by early 2008, the shipments will likely catch up due to a spate of sales to China over the past month. The soybean export commitments (including outstanding sales) currently total 668 million bushels--up 7.5 percent from a year ago. Although the early tempo of export sales has been brisk, it should weaken by next spring when cheaper new-crop supplies from South America become available. But, that transition could take longer than usual because of a delay in sowing soybeans in Brazil, which stalled into mid-October due to an abnormally late arrival of the rainy season. Increasing dryness in Argentina is also interrupting the advancement of soybean planting there. Thus, even with extraordinarily high U.S. prices, an extended period of low soybean exports from South America could provide a steady momentum for U.S. shipments through March or April 2008. USDA recognized this possibility by raising its 2007/08 forecast of U.S. soybean exports this month by 20 million bushels to 995 million. Domestic crush margins are very attractive right now and are encouraging U.S. soybean processors to operate near capacity. For both soybean meal and soybean oil, stable growth in domestic consumption and good export markets are providing a sound outlook for domestic processors. For September-October 2007, the domestic soybean crush totaled 311.3 million bushels—a 2.3-percent gain over the record 2006/07 pace. By next spring, however, the circumstances for domestic processors will look much different. Soybean stocks will become increasingly difficult to acquire and domestic users may start to balk at paying yet higher prices for soybean meal and soybean oil. USDA edged up its forecast of 2007/08 soybean crush this month to 1.83 billion bushels from 1.825 billion. Now, with higher expected soybean demand, U.S. ending stocks in 2007/08 could shrink to 185 million bushels (down 25 million from last month). If realized, this would be the lowest stock carryout since 2003/04. The outlook for low year-end supplies is leading a strong upward trend in soybean prices. In November 2007, the monthly U.S. average farm price spiked to $9.48 per bushel from $8.36 in October and appears headed even higher. Throughout the country, cash prices in early December ranged from $10.50-$11.00 per bushel. On this basis, the forecast of the 2007/08 U.S. average farm price was raised from $8.50-$9.50 to $9.25-$10.25 per bushel. Also contributing to the market’s rally are concerns that farmers may plant too little soybean acreage in 2008 to remedy a narrowing gap with consumption. High Prices Not Yet Deterring U.S. Export Sales of Soybean Oil and Soybean Meal The world could have to rely more on U.S. supplies of soybean meal and soybean oil next spring, a factor that is buoying current export sales. Despite an expected record South American output of soybean oil, 2007/08 exports from the region could be curtailed by expanding domestic use for biodiesel. Beginning in January,

3 Oil Crops Outlook/OCS-07k/December 12, 2007
Economic Research Service, USDA
Brazil implements a requirement that biodiesel account for 2 percent of the country’s diesel fuel consumption. Likewise, Argentine biodiesel production may nearly triple in 2007/08 (to 550,000 tons), but its demand is derived mainly from the export market. Argentina’s preferential export tax for biodiesel (5 percent) will favor its production domestically over the sale of soybean oil in the export market, which incurs a newly raised export tax of 32 percent. Consequently, soybean oil importers may have to depend on more purchases from the United States. Although unlikely to continue at the brisk current pace, U.S. export sales commitments are up 48 percent from a year ago. Sales to North African countries are providing most of the early boost in export demand. USDA raised its 2007/08 forecast of U.S. soybean oil exports this month by 100 million pounds to 1.65 billion, but less than the 2006/07 shipments at 1.89 billion pounds. The willingness of foreign importers and domestic users to absorb higher costs for soybean oil in their food products is being reflected in current market values. Soybean oil prices climbed sharply in November, rising 4.6 cents from the October average to 42.7 cents per pound. This is just below the highest-ever monthly average price in August 1974, which topped at 43.3 cents per pound. The forecast of the 2007/08 average price was increased this month to 41.0-45.0 cents per pound from 37.5-41.5 cents. Likewise, the prices for other vegetable oils have surged. The strong price competition for soybean oil has serious consequences for the U.S. biodiesel industry, which employs it as a primary input. Due to the cost increases and seasonal factors, consumption of soybean oil for biodiesel has fallen since August 2007. Planned openings for new biodiesel plants are being deferred and capacity use at existing facilities is low. This month, USDA lowered its 2007/08 forecast of soybean oil use for methyl esters from 4.2 billion pounds to 3.8 billion. As a result, the decline in soybean oil stocks may be less steep than previously indicated. The current ending stocks projection is 2.169 billion pounds, up from last month’s forecast of 2.017 billion. U.S. export commitments of soybean meal have also established a quick pace. As of November 29, 2007/08 export sales totaled 3.6 million short tons, nearly 9 percent ahead of last year’s commitments. While strong sales for soybean meal may not last as long as a year ago, they have prompted USDA to boost its 2007/08 export forecast from 8.3 million to 8.4 million short tons. Although domestic prices for soybean meal are well below the all-time highs of 1973, they are above average. Last month, soybean meal prices rose by $20 per short ton to $281. The forecast of the 2007/08 average price was raised to $265-$295 per short ton from last month’s range of $235-$265.

International Outlook
4 Oil Crops Outlook/OCS-07k/December 12, 2007
Economic Research Service, USDA
Figure 2Record India soybean harvest a result of high area and favorable weather
0123456789
10
1998
/99
1999
/00
2000
/01
2001
/02
2002
/03
2003
/04
2004
/05
2005
/06
2006
/07
2007
/08F
Million metric tons
Source: Oilseeds: World Markets and Trade, Foreign Agricultural Service, USDA
China’s Soybean Imports Off to Fast Start Soybean shipments to China this fall were already setting a swift pace, and a flurry of new purchases in November will accelerate arrivals over the coming weeks. Domestic production is down this year, while use is recovering well with a restocking of swine herds. Even in the face of more costly soybean prices, the 10-12 percent annual growth in China’s consumer income is leading demand ever higher. Currently, China’s soybean imports are about evenly divided between shipments from the United States and South America, but they will gradually become dominated by U.S. exports. The forecast of China’s 2007/08 soybean imports was raised this month from 33.5 million to 34 million metric tons. The anticipated increase in imports is seen enabling a rise in China’s 2007/08 domestic soybean crush to 38.1 million metric tons (compared to 35.5 million in 2006/07). Higher Area, Good Weather Raised 2007/08 Indian Oilseed Production This month, USDA raised its estimate of domestic oilseed output in India by 1.3 million metric tons to 33.2 million. For soybeans, the 2007 production estimate was increased by 1 million tons to 9.2 million—well exceeding last year’s previous record of 7.7 million. The estimate for the Indian peanut harvest was raised by 350,000 metric tons from the November estimate to 6 million. Both oilseed crops benefited from a good distribution of rainfall by the summer monsoon. In addition, excellent yields for cotton this year have pushed the estimate of Indian cottonseed production to a record high 10.2 million metric tons. India’s 2007 cottonseed harvest is twice as large as the crop from only 6 years earlier. In contrast to the gains in other oilseeds production, rapeseed planting has continued to fall further behind last year’s area as India’s farmers respond to better incentives for growing wheat. Government reports of sowing progress indicated that, through early December, the rapeseed area sown in India was 750,000 hectares
5 Oil Crops Outlook/OCS-07k/December 12, 2007
Economic Research Service, USDA
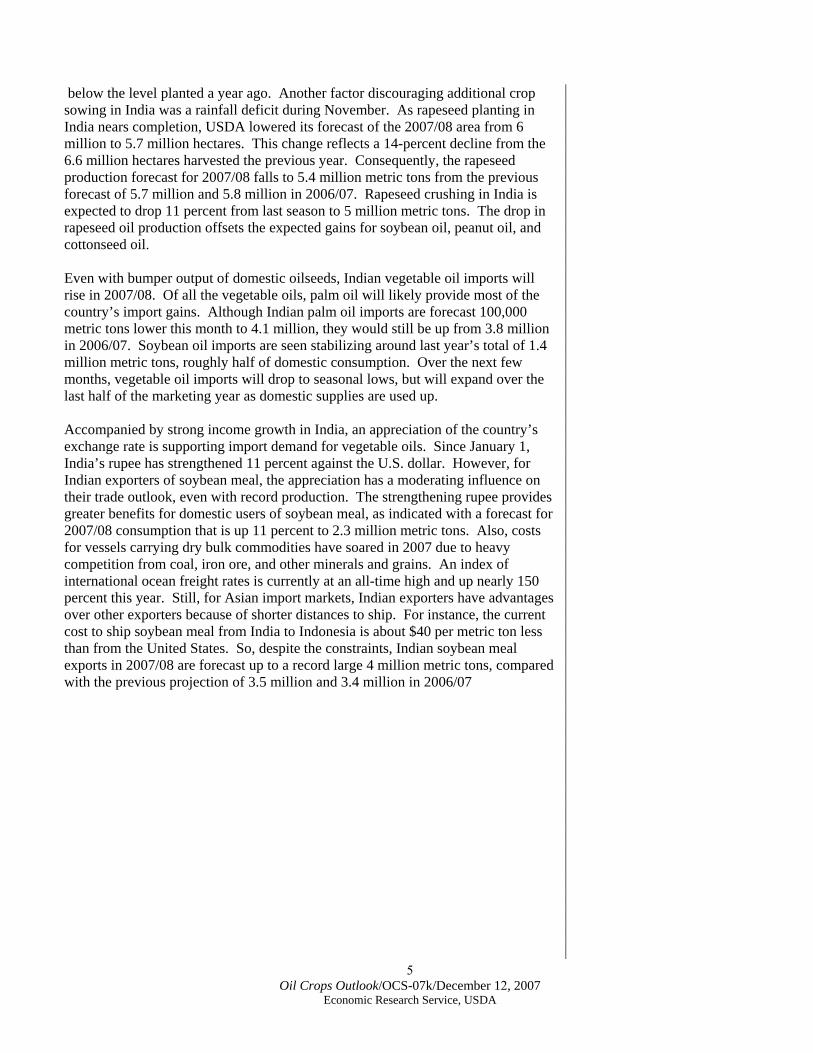
below the level planted a year ago. Another factor discouraging additional crop sowing in India was a rainfall deficit during November. As rapeseed planting in India nears completion, USDA lowered its forecast of the 2007/08 area from 6 million to 5.7 million hectares. This change reflects a 14-percent decline from the 6.6 million hectares harvested the previous year. Consequently, the rapeseed production forecast for 2007/08 falls to 5.4 million metric tons from the previous forecast of 5.7 million and 5.8 million in 2006/07. Rapeseed crushing in India is expected to drop 11 percent from last season to 5 million metric tons. The drop in rapeseed oil production offsets the expected gains for soybean oil, peanut oil, and cottonseed oil. Even with bumper output of domestic oilseeds, Indian vegetable oil imports will rise in 2007/08. Of all the vegetable oils, palm oil will likely provide most of the country’s import gains. Although Indian palm oil imports are forecast 100,000 metric tons lower this month to 4.1 million, they would still be up from 3.8 million in 2006/07. Soybean oil imports are seen stabilizing around last year’s total of 1.4 million metric tons, roughly half of domestic consumption. Over the next few months, vegetable oil imports will drop to seasonal lows, but will expand over the last half of the marketing year as domestic supplies are used up. Accompanied by strong income growth in India, an appreciation of the country’s exchange rate is supporting import demand for vegetable oils. Since January 1, India’s rupee has strengthened 11 percent against the U.S. dollar. However, for Indian exporters of soybean meal, the appreciation has a moderating influence on their trade outlook, even with record production. The strengthening rupee provides greater benefits for domestic users of soybean meal, as indicated with a forecast for 2007/08 consumption that is up 11 percent to 2.3 million metric tons. Also, costs for vessels carrying dry bulk commodities have soared in 2007 due to heavy competition from coal, iron ore, and other minerals and grains. An index of international ocean freight rates is currently at an all-time high and up nearly 150 percent this year. Still, for Asian import markets, Indian exporters have advantages over other exporters because of shorter distances to ship. For instance, the current cost to ship soybean meal from India to Indonesia is about $40 per metric ton less than from the United States. So, despite the constraints, Indian soybean meal exports in 2007/08 are forecast up to a record large 4 million metric tons, compared with the previous projection of 3.5 million and 3.4 million in 2006/07

For registration and other details:www.usda.gov/oce/forum/
EnergizingRural Americain the Global MarketplaceFebruary 21-22, 2008
Crystal Gateway Marriott HotelArlington, Virginia
USDA’s
Forecasts · Trends · Policies8
6 Oil Crops Outlook/OCS-07k/December 12, 2007 Economic Research Service, USDA
Contacts and Links
7 Oil Crops Outlook/OCS-07k/December 12, 2007
Economic Research Service, USDA
Data Monthly tables from Oil Crops Outlook are available in Excel (.xls) spreadsheets at http://www.ers.usda.gov/briefing/soybeansoilcrops/Data/data.htm. These tables contain the latest data on the production, use, imports, exports, prices, and textile trade of cotton and other fibers. Recent Reports Economic Analysis of Base Acre and Payment Yield Designations Under the 2002 U.S. Farm Act evaluates farmers' decisions to designate base acres under the 2002 Farm Act. Findings suggest that decision makers responded to economic incentives in their designations of base acres by selecting those options that resulted in the greatest expected flow of program payments (http://www.ers.usda.gov/publications/ERR12/). See also Farm Program Acres for the county-level farm program and planted acreage data used in the report, which can be downloaded and mapped (http://www.ers.usda.gov/data/baseacres/). Related Websites WASDE, http://usda.mannlib.cornell.edu/MannUsda/viewDocumentInfo.do?documentID=1194 Oilseed Circular, http://www.fas.usda.gov/oilseeds_arc.asp Soybeans and Oil Crops Briefing Room, http://www.ers.usda.gov/briefing/soybeansoilcrops/
Contact Information Mark Ash (soybeans, minor oilseeds), (202) 694-5289, [email protected] Erik Dohlman (peanuts), (202) 694-5308, [email protected] Subscription Information Oil Crops Outlook is issued 11 times per year by the Economic Research Service, U.S. Department of Agriculture, Washington, DC 20036-5831. Electronic release only; no published copies are available. Subscribe to ERS’ e-mail notification service at http://www.ers.usda.gov/updates/ to receive timely notification of newsletter availability. To order printed copies of the five field crops newsletters—cotton and wool, feed, rice, oil crops, and wheat—as a series, specify series SUB-COR-4043.
The U.S. Department of Agriculture (USDA) prohibits discrimination in all its programs and activities on the basis of race, color, national origin, age, disability, and, where applicable, sex, marital status, familial status, parental status, religion, sexual orientation, genetic information, political beliefs, reprisal, or because all or a part of an individual's income is derived from any public assistance program. (Not all prohibited bases apply to all programs.) Persons with disabilities who require alternative means for communication of program information (Braille, large print, audiotape, etc.) should contact USDA's TARGET Center at (202) 720-2600 (voice and TDD). To file a complaint of discrimination write to USDA, Director, Office of Civil Rights, 1400 Independence Avenue, S.W., Washington, D.C. 20250-9410 or call (800) 795-3272 (voice) or (202) 720-6382 (TDD). USDA is an equal opportunity provider and employer.
E-mail Notification Readers of ERS outlook reports have two ways they can receive an e-mail notice about release of reports and associated data. • Receive timely notification (soon after the report is posted on the web) via USDA’s Economics, Statistics and Market Information System (which is housed at Cornell University’s Mann Library). Go to http://usda.mannlib.cornell.edu/MannUsda/aboutEmailService.do and follow the instructions to receive e-mail notices about ERS, Agricultural Marketing Service, National Agricultural Statistics Service, and World Agricultural Outlook Board products. • Receive weekly notification (on Friday afternoon) via the ERS website. Go to http://www.ers.usda.gov/Updates/ and follow the instructions to receive notices about ERS outlook reports, Amber Waves magazine, and other reports and data products on specific topics. ERS also offers RSS (really simple syndication) feeds for all ERS products. Go to http://www.ers.usda.gov/rss/ to get started.

8 Oil Crops Outlook/OCS-07k/December 12, 2007
Economic Research Service, USDA
Table 1--Soybeans: U.S. supply and disappearance
Area Yield Supply DisappearanceYear beg. Planted Harvested Beginning Seed, feed, EndingSept. 1 stocks Production Imports Total Crush Exports & residual Total stocks
Million acres Bu/acre ------------ ------------ ------------ Million bushels ------------ ------------ ------------ ------------2005/06 72.0 71.3 43.0 256 3,063 3 3,322 1,739 940 194 2,873 449 2006/071 75.5 74.6 42.7 449 3,188 9 3,647 1,806 1,118 149 3,074 573 2007/082 63.7 62.8 41.3 573 2,594 6 3,173 1,830 995 163 2,988 185
2006/07September 0.4 142.4 64.9 October 0.5 161.7 182.6 November 0.6 155.1 126.4 Sep-Nov 449.3 3,188.2 1.5 3,639.1 459.2 373.8 104.7 937.7 2,701.4 December 0.6 157.4 122.7 January 0.5 155.3 135.1 February 0.8 136.8 129.2 Dec-Feb 2,701.4 --- 1.9 2,703.3 449.5 387.0 80.0 916.4 1,786.9 March 0.9 155.7 85.0 April 0.8 144.9 83.0 May 0.8 151.9 51.4 Mar-May 1,786.9 --- 2.6 1,789.5 452.6 219.5 25.1 697.3 1,092.2 June 1.1 148.7 50.3 July 0.9 150.2 35.5 August 1.0 146.2 51.9 Jun-Aug 1,092.2 --- 3.0 1,095.2 445.1 137.7 (60.4) 522.4 572.8 Total 3,188.2 9.0 3,646.6 1,806.4 1,118.0 149.4 3,073.8
2007/08September 0.4 147.7 60.9 October1 0.6 163.5 138.9 Total to date 1.0 311.3 199.8 1 Estimated. 2 Forecast. Sources: Crop Production and Grain Stocks, National Agricultural Statistics Service, U.S. Department of Agriculture; and Oilseed Crushings, Census Bureau, U.S. Department of Commerce.

9 Oil Crops Outlook/OCS-07k/December 12, 2007
Economic Research Service, USDA
Table 2--Soybean meal: U.S. supply and disappearance
Supply DisappearanceYear begin. Beginning Ending Oct. 1 stocks Production Imports Total Domestic Exports Total stocks
1,000 short tons2005/06 172 41,244 141 41,557 33,195 8,048 41,243 314 2006/071 314 43,027 156 43,497 34,360 8,786 43,146 351 2007/082 351 43,484 165 44,000 35,300 8,400 43,700 300
2006/07 October 313.8 3,823.2 12.8 4,149.7 3,084.4 677.0 3,761.3 388.4 November 388.4 3,671.9 13.6 4,073.9 2,858.3 842.0 3,700.4 373.6 December 373.6 3,733.0 13.7 4,120.2 2,864.1 787.2 3,651.3 468.9 January 468.9 3,693.3 13.6 4,175.8 3,049.9 753.2 3,803.1 372.7 February 372.7 3,252.6 13.4 3,638.7 2,592.8 756.3 3,349.0 289.6 March 289.6 3,712.3 15.2 4,017.1 2,771.8 916.8 3,688.6 328.5 April 328.5 3,442.9 12.6 3,783.9 2,826.2 629.2 3,455.3 328.6 May 328.6 3,623.0 13.9 3,965.5 3,022.2 664.1 3,686.3 279.2 June 279.2 3,528.2 11.2 3,818.6 2,769.8 731.8 3,501.6 317.1 July 317.1 3,568.0 11.2 3,896.3 2,967.3 613.8 3,581.1 315.2 August 315.2 3,473.9 13.4 3,802.5 2,799.9 765.7 3,565.6 236.9 September 236.9 3,504.4 11.8 3,753.1 2,753.2 649.0 3,402.2 350.9 Total 43,026.7 156.3 43,496.8 34,359.9 8,786.0 43,145.8
2007/08 October1 350.9 3,872.8 12.4 4,236.1 3,279.9 673.3 3,953.2 282.9 1 Estimated. 2 Forecast.Source: Oilseed Crushings, Census Bureau, U.S. Department of Commerce.

10 Oil Crops Outlook/OCS-07k/December 12, 2007
Economic Research Service, USDA
Table 3--Soybean oil: U.S. supply and disappearance Supply Disappearance
Year begin. Beginning Production Imports Total Domestic Exports Total Ending Oct. 1 stocks Total Methyl ester stocks
Million pounds
2005/06 1,699 20,387 35 22,122 17,959 1,555 1,153 19,112 3,010 2006/071 3,010 20,487 37 23,535 18,743 2,796 1,888 20,630 2,904 2007/082 2,904 20,775 40 23,719 19,900 3,800 1,650 21,550 2,169
2006/07October 3,009.8 1,829.5 1.0 4,840.3 1,660.9 166.1 167.1 1,828.0 3,012.3 November 3,012.3 1,725.0 1.0 4,738.3 1,536.1 157.6 120.3 1,656.3 3,081.9 December 3,081.9 1,771.0 1.3 4,854.2 1,486.9 178.7 276.7 1,763.6 3,090.6 January 3,090.6 1,746.3 2.5 4,839.4 1,482.7 167.8 174.9 1,657.6 3,181.7 February 3,181.7 1,547.2 1.1 4,730.1 1,324.2 157.8 125.2 1,449.4 3,280.7 March 3,280.7 1,764.3 1.4 5,046.3 1,603.8 218.8 81.2 1,685.0 3,361.4 April 3,361.4 1,626.5 2.0 4,989.9 1,585.7 215.4 102.7 1,688.4 3,301.5 May 3,301.5 1,728.9 3.1 5,033.5 1,601.2 271.9 121.3 1,722.5 3,311.0 June 3,311.0 1,692.5 9.7 5,013.1 1,529.4 256.5 123.5 1,652.9 3,360.2 July 3,360.2 1,709.7 5.4 5,075.3 1,648.7 347.6 202.1 1,850.8 3,224.5 August 3,224.5 1,662.9 6.8 4,894.3 1,646.0 376.2 201.9 1,847.9 3,046.4 September 3,046.4 1,683.6 2.2 4,732.2 1,637.1 281.3 190.8 1,828.0 2,904.2 Total 20,487.3 37.5 23,534.6 18,742.7 2,795.7 1,887.7 20,630.4
2007/08October1 2,904.2 1,867.5 4.1 4,775.8 1,598.7 236.3 132.9 1,731.6 3,044.3 1 Estimated. 2 Forecast. Sources: Oilseed Crushings and Production, Consumption, and Stocks, Census Bureau, U.S. Department of Commerce.

11 Oil Crops Outlook/OCS-07k/December 12, 2007
Economic Research Service, USDA
Table 4--Cottonseed: U.S. supply and disappearance Supply Disappearance
Year beg. Beginning Ending Aug. 1 stocks Production Imports Total Crush Exports Other Total stocks
1,000 short tons
2005/06 592 8,172 0 8,764 3,010 523 4,630 8,163 602 2006/07 602 7,348 0 7,950 2,680 616 4,165 7,461 489 2007/082 489 6,581 0 7,070 2,400 300 3,970 6,670 400 1 Estimated. 2 Forecast.Sources: Crop Production , National Agricultural Statistics Service, U.S. Department of Agriculture; nd Oilseed Crushings, Census Bureau, U.S. Department of Commerce.

12 Oil Crops Outlook/OCS-07k/December 12, 2007
Economic Research Service, USDA
Table 5--Cottonseed meal: U.S. supply and disappearance Supply Disappearance
Year beg. Beginning Ending Oct. 1 stocks Imports Production Total Domestic Exports Total stocks
1,000 short tons
2005/06 53 0 1,372 1,425 1,225 141 1,366 59 2006/071 59 0 1,241 1,301 1,133 105 1,238 63 2007/082 63 0 1,090 1,153 1,018 85 1,103 50 1 Estimated. 2 Forecast.Source: Oilseed Crushings, Census Bureau, U.S. Department of Commerce.

13 Oil Crops Outlook/OCS-07k/December 12, 2007
Economic Research Service, USDA
Table 6--Cottonseed oil: U.S. supply and disappearance Supply Disappearance
Year beg. Beginning Ending Oct. 1 stocks Imports Production Total Domestic Exports Total stocks
Million pounds
2005/06 76 1 951 1,028 860 67 927 101 2006/071 101 1 849 951 708 138 845 106 2007/082 106 1 755 862 654 118 772 90 1 Estimated. 2 Forecast.Sources: Oilseed Crushings and Production, Consumption, and Stocks , Census Bureau, U.S. Department of Commerce.
14 Oil Crops Outlook/OCS-07k/December 12, 2007
Economic Research Service, USDA
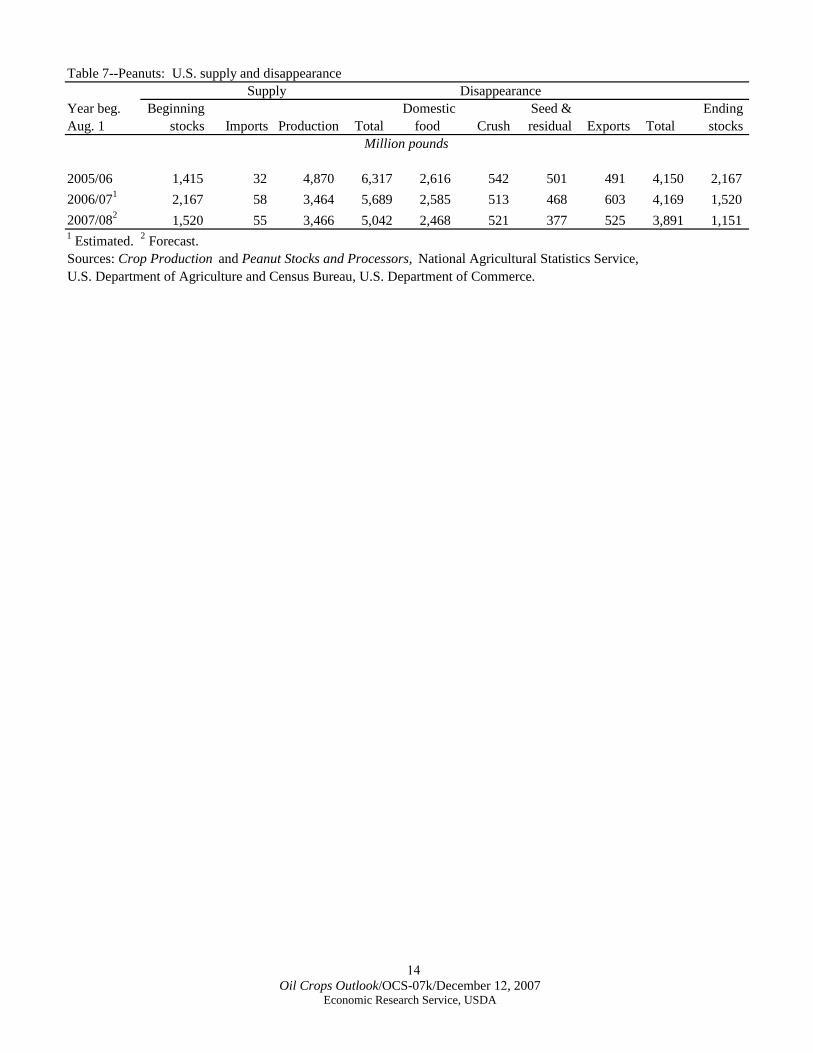
Table 7--Peanuts: U.S. supply and disappearance Supply Disappearance
Year beg. Beginning Domestic Seed & Ending Aug. 1 stocks Imports Production Total food Crush residual Exports Total stocks
Million pounds
2005/06 1,415 32 4,870 6,317 2,616 542 501 491 4,150 2,167 2006/071 2,167 58 3,464 5,689 2,585 513 468 603 4,169 1,520 2007/082 1,520 55 3,466 5,042 2,468 521 377 525 3,891 1,151 1 Estimated. 2 Forecast.Sources: Crop Production and Peanut Stocks and Processors, National Agricultural Statistics Service, U.S. Department of Agriculture and Census Bureau, U.S. Department of Commerce.

15 Oil Crops Outlook/OCS-07k/December 12, 2007
Economic Research Service, USDA
Table 8--Oilseed prices received by U.S. farmersMarketingyear Soybeans Cottonseed Sunflower Canola Peanuts Flaxseed
$/bu. $/ton $/cwt. $/cwt. Cents/lb. $/bu.
1997/98 6.47 121.00 11.60 11.30 28.30 5.81 1998/99 4.93 129.00 10.60 10.30 28.40 5.05 1999/00 4.63 89.00 7.53 7.82 25.40 3.79 2000/01 4.54 105.00 6.89 6.71 27.40 3.30 2001/02 4.38 90.50 9.62 8.77 23.40 4.29 2002/03 5.53 101.00 12.10 10.60 18.20 5.77 2003/04 7.34 117.00 12.10 10.60 19.30 5.88 2004/05 5.74 107.00 13.70 10.70 18.90 8.07 2005/06 5.66 96.00 12.10 9.62 17.30 5.94 2006/07 6.43 111.00 14.50 11.90 17.70 5.80 2007/081 9.25-10.25 190-220 19.00-20.60 17.30-18.90 20.2-21.8 10.60-11.60
2006/07September 5.23 97.00 11.60 NA 17.30 5.46 October 5.52 98.00 12.10 NA 17.20 5.41 November 6.08 113.00 12.50 NA 17.20 5.38 December 6.18 120.00 13.60 NA 17.60 5.73 January 6.37 121.00 13.80 NA 17.80 6.03 February 6.87 130.00 14.90 NA 17.80 6.39 March 6.95 NA 15.60 NA 17.80 6.79 April 6.88 NA 15.90 NA 18.30 6.72 May 7.12 NA 16.60 NA 17.90 7.08 June 7.51 NA 17.00 NA 18.10 7.81 July 7.56 NA 18.40 14.50 18.70 8.14 August 7.72 NA 18.40 14.60 18.00 8.64
2007/08September 8.18 137.00 17.70 15.00 18.60 9.55 October 8.36 153.00 17.80 16.30 21.40 11.60 November1 9.48 160.00 18.90 19.10 21.80 13.20 1 Preliminary. NA = Not available.Source: Agricultural Prices, National Agricultural Statistics Service, U.S. Department of Agriculture.

16 Oil Crops Outlook/OCS-07k/December 12, 2007
Economic Research Service, USDA
Table 9--U.S. vegetable oil and fats pricesMarketing Soybean Cottonseed Sunflower Canola Peanut Corn Lard 6 Edible
year oil 2 oil 3 oil 4 oil 4 oil 5 oil 6 tallow 6
Cents/lb.
1997/98 25.80 28.85 27.00 28.83 49.21 28.94 19.46 20.69 1998/99 19.90 27.32 20.10 22.48 40.72 25.30 14.66 15.14 1999/00 15.60 21.52 16.68 17.11 35.96 17.81 13.64 13.21 2000/01 14.15 15.98 15.89 17.56 34.97 13.54 14.61 13.43 2001/02 16.46 17.98 23.25 23.45 32.23 19.14 13.55 13.87 2002/03 22.04 37.75 33.11 29.75 46.70 28.17 18.13 17.80 2003/04 29.97 31.21 33.41 33.76 60.84 28.43 26.13 22.37 2004/05 23.01 28.01 43.71 30.78 53.63 27.86 21.80 18.48 2005/06 23.41 29.47 40.64 31.00 44.48 25.18 21.74 18.16 2006/07 31.02 35.70 58.03 40.57 52.99 31.80 28.43 27.32 2007/081 41.0-45.0 57.0-61.0 78.5-82.5 54.0-58.0 83.0-87.0 55.0-59.0 35.0-39.0 36.0-40.0
2006/07October 24.80 27.44 52.94 34.50 52.67 24.70 23.55 19.86 November 27.64 30.25 56.00 37.63 52.50 26.47 20.78 21.78 December 27.63 30.75 56.33 38.42 50.00 28.05 22.58 23.23 January 28.00 31.00 55.56 38.56 49.25 28.05 23.00 23.91 February 28.94 32.69 54.50 40.06 46.25 28.66 23.82 23.25 March 29.74 33.00 53.25 38.95 48.20 29.08 30.75 24.34 April 31.06 34.38 52.69 38.44 52.63 29.93 27.71 26.22 May 32.90 37.75 53.44 40.44 55.63 31.56 28.60 30.19 June 34.01 40.00 57.31 42.56 62.56 34.71 32.64 34.50 July 35.74 42.44 65.00 45.00 69.63 37.25 36.00 35.00 August 34.87 42.15 68.80 44.25 70.00 39.61 35.77 32.85 September 36.89 46.56 70.50 48.00 73.00 43.61 36.00 32.69
2007/08October 38.10 52.20 73.50 50.38 76.75 52.50 35.09 33.98 November1 42.68 63.60 84.80 57.30 93.20 56.32 33.78 36.88 1 Preliminary. 2 Decatur, IL. 3 PBSY Greenwood, MS. 4 Midwest. 5 Southeast mills. 6 Chicago.NA= Not available.Sources: Monthly Feedstuff Prices and Peanut Report, Agricultural Marketing Service, U.S. Department of Agriculture.

17 Oil Crops Outlook/OCS-07k/December 12, 2007
Economic Research Service, USDA
Table 10--U.S. oilseed meal prices Marketing Soybean Cottonseed Sunflower Peanut Canola Linseed year meal 2 meal 3 meal 4 meal 5 meal 6 meal 4
$/Short ton
1997/98 185.30 144.00 84.20 210.25 131.15 117.54 1998/99 138.50 109.55 64.20 122.02 112.28 84.49 1999/00 167.62 127.43 75.00 108.15 117.07 103.42 2000/01 173.62 142.93 90.50 119.75 139.20 121.92 2001/02 167.72 136.16 87.27 112.32 143.33 121.29 2002/03 181.58 146.12 105.00 128.35 144.06 122.91 2003/04 256.05 183.47 111.14 177.56 188.45 159.25 2004/05 182.90 124.04 85.50 118.34 139.75 115.55 2005/06 174.17 144.27 77.46 106.98 140.52 115.53 2006/07 205.44 150.36 104.88 100.00 173.38 133.01 2007/081 265-295 175-205 130-160 190-220 175-205 170-200
2005/06October 166.22 133.13 73.25 105.50 130.13 100.38 November 170.32 132.50 64.80 102.50 139.55 113.60 December 193.17 175.00 70.00 100.88 158.06 118.00 January 183.64 172.50 NA NA 150.05 127.25 February 176.73 152.50 NA 114.50 143.94 130.17 March 175.07 148.75 98.00 113.50 134.74 129.00 April 174.64 144.38 90.33 113.17 136.04 126.63 May 175.77 131.50 72.60 113.33 136.59 119.10 June 176.83 135.00 66.50 107.13 139.63 116.88 July 168.97 132.50 76.50 107.50 137.83 111.50 August 159.76 134.50 79.33 100.00 143.28 101.10 September 168.87 139.00 83.33 98.75 136.38 92.75
2006/07October 177.71 132.40 87.00 98.50 149.77 100.75 November 190.67 131.88 98.50 98.50 166.80 118.13 December 180.63 152.50 109.00 98.00 163.17 123.33 January 190.36 161.00 114.67 98.50 173.30 134.20 February 208.81 174.75 152.50 98.50 198.37 156.38 March 205.26 185.50 132.50 NA 195.37 156.25 April 189.37 148.25 118.75 NA 169.01 149.00 May 198.66 137.00 99.80 NA 168.19 135.10 June 229.70 131.25 85.13 NA 189.11 132.00 July 222.05 137.50 83.13 NA 171.14 135.75 August 217.63 144.75 74.63 NA 159.33 123.88 September 254.41 167.50 103.00 NA 176.98 131.38
2007/08October 260.55 183.40 138.40 NA 167.24 170.20 November1 280.76 176.25 133.75 NA 192.28 184.631 Preliminary. 2 Hi-pro Decatur, IL. 3 41% Memphis. 4 28% Minneapolis.5 50% Southeast mills. 6 36% Pacific Northwest. NA= Not available.Source: Monthly Feedstuff Prices, Agricultural Marketing Service, U.S. Department of Agriculture.