oil, gas, and ngl market overview - latest energy, metals
TRANSCRIPT

© 2013 Platts, McGraw Hill Financial. All rights reserved.
Oil, Gas, and NGL Market Overview Charles Nevle, Manager Energy Analysis September 18, 2013

Premier Energy Data and Analytics
Who We Are • Ground-up approach to Energy Data
and Analytics
• 400+ Customers
• Division of Platts (McGraw-Hill) 40%
22%
33%
5%
Majors, Producers, Mktrs, Industrials
Pipelines, Utilities, Midstream
Financial and Hedge
Government, Associations, Consultants
What We Do • Reports and Consulting Services
• Collect, Analyze, Interpret and
Distribute Data, Information and
Knowledge to the Energy Industry

10/+3
181/+14
45/+4
53/+4
14/+0
2/-5
33/+2
22/+5
25/-2
115/+17
3/+0
2/-3
218/+0
30/+4
5/+0
49/+13
16/-4
4/-1
Active rig count: July 12, 2013 / Change in rig count from January 4, 2013
Rig Increases Dry Gas Focused Areas Rig Increases Liquids-Rich/Oil Focused Areas Rig Declines Source: BENTEK, July 2013
3/-1
98/+1
66/+9
41/+8
62/+5
15/+0 207/+2
459/+16
32/-9
15/+3 PICEANCE
CALIFORNIA
MICHIGAN
POWDER RIVER
GREEN RIVER
WIND RIVER
OTHER ROCKIES WILLISTON
SAN JUAN
UINTA OTHER
APPALACHIAN
D-J
MARCELLUS WET
MARCELLUS DRY
UTICA
ILLINOIS
ARK FAYETTEVILLE
ARK WOODFORD
OFFSHORE
TX GULF EAGLE FORD
PERMIAN
ANADARKO
FT WORTH
AL-MS-FL
LA GULF
EAST TX
ARKLA
OTHER MIDCONTINENT
TX GULF
30/+4
RATON 0/+0
Crude and Gas Prices Higher Since Beginning of Year Continuing to Prompt Drilling Investment Across Country
TOTAL
1857
CHANGE
+89
HH ($/MMBtu) WTI ($/Barrel) Mt. Belvieu ($/Gal)
Jan. 2013 $3.34 $94.57 $0.95
Jul. 2013 $3.62 $104.78 $0.88

Rig Count Does Not Reflect Improving Drilling Efficiencies
-
0.2
0.4
0.6
0.8
1.0
1.2
1.4
1.6
1.8
2.0
-
50
100
150
200
250
300
350
400
Wel
l per
Rig
per
Mon
th
No.
Wel
ls D
rille
d/Ac
tive
Rigs
Eagle Ford Wells Drilled vs. Active Rigs
Wells per Month per Rig Horizontal Rigs Horizontal Wells DrilledSource: Bentek, RIGDATA

U.S. Oil Plays Generate Very Attractive Returns Even at $80 Crude, at $100 Crude Producers Should Continue to Accelerate Development
0%
10%
20%
30%
40%
50%
60%
IRR
$80 $60Note: NG at $3/MMbtu and NGLs 30% of Crude, No Basis Differentials
5

Gas, Oil and NGL Price Comparison: MMBTU Equivalent
6
$0.00
$5.00
$10.00
$15.00
$20.00
$25.00
$30.00
$0.00
$5.00
$10.00
$15.00
$20.00
$25.00
$30.00
$/M
MB
tu E
quiv
alen
t
CAPP WTI HH MB NGL Brent
Value Gap

Crude Oil

• North American Production Growth Continues to Shape Market; Breaking Traditional Flow Patterns and Pricing Relationships
• Pipeline, Rail, and Waterborne Options Critical to Balancing Regional Markets and Bringing Light Crude to Coastal Markets
• U.S. Light Crudes Will Be Discounted to World Prices Until the Development of New Refining and Export Options Occur
• Growing Supply Will Lead to Downward Pressure on North American Oil Prices
8
Market Conclusions
0
2
4
6
8
10
12
14
16
18
20
MM
b/d
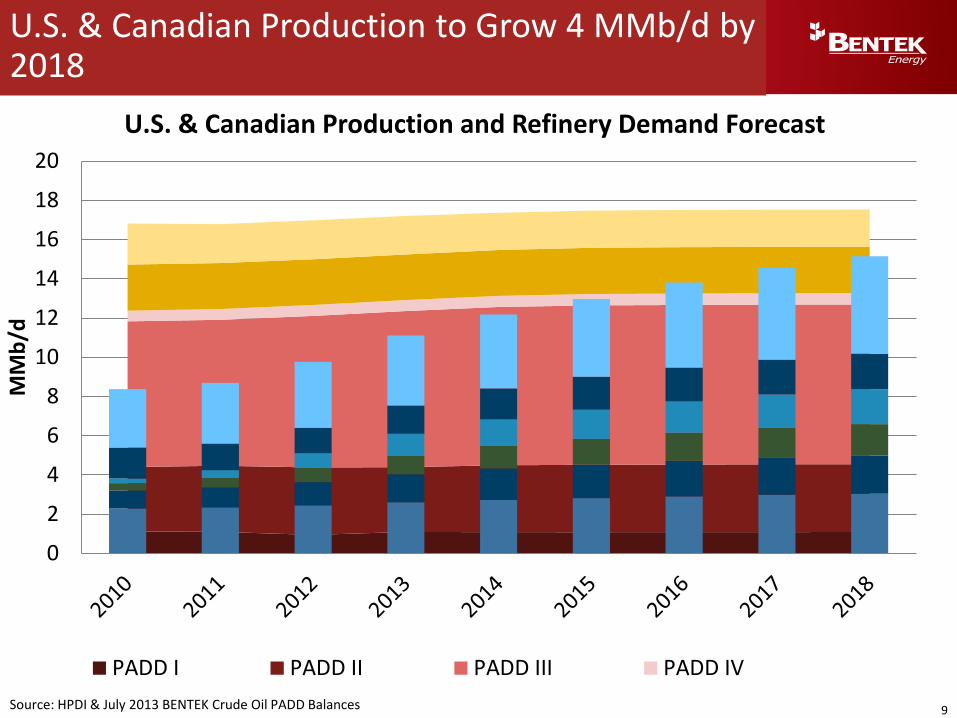
U.S. & Canadian Production and Refinery Demand Forecast
PADD I PADD II PADD III PADD IV
U.S. & Canadian Production to Grow 4 MMb/d by 2018
Source: HPDI & July 2013 BENTEK Crude Oil PADD Balances 9

5 10 15 20 25 30 35 40 45 50 55 60 65
Eagle FordBarnett Combo
Cana woodford / SCOOPUtica
DuvernayAvalon / Bone Spring
BakkenCline
Marmaton / HogshooterWolfcampMiss Lime
Alberta BakkenNiobraraCardium
Uinta Black WaxViking
SpearfishAlaska North Slope
Offshore/MarsSyncrude
ShaunavonHeavy Diluted Bitumen
Non-Upgraded Bitumen
API Gravity
U.S. Onshore Plays Predominantly Light Sweet Crude & Condensate, While Canadian Crudes Heavy
Canadian Play U.S. Play
Light Crude
10
Condensate
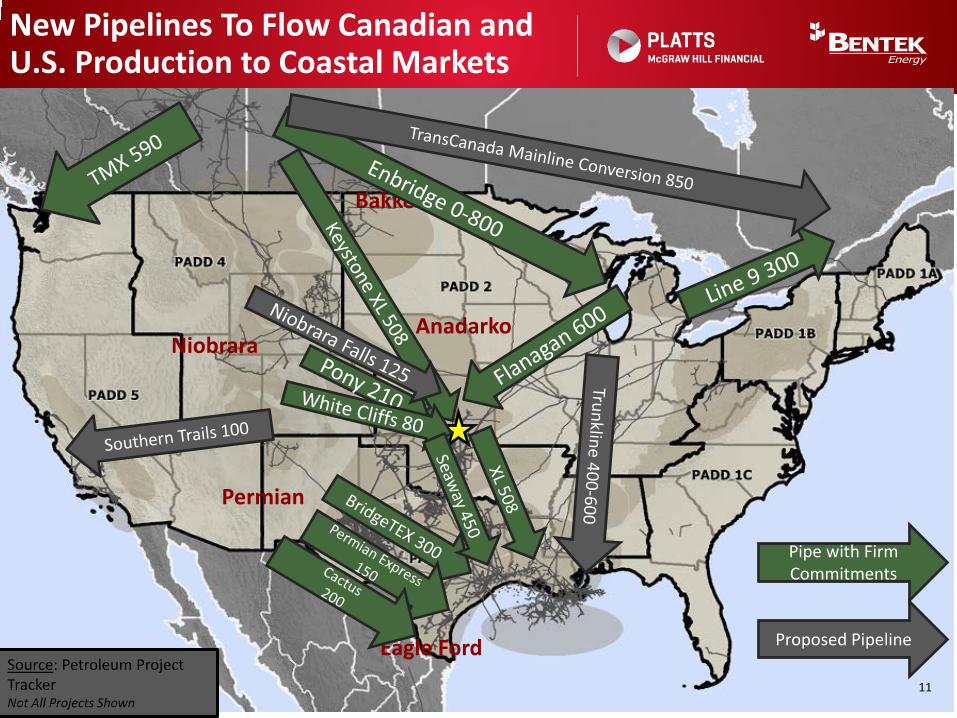
Bakken
Niobrara Anadarko
Permian
Eagle Ford Source: Petroleum Project Tracker Not All Projects Shown
New Pipelines To Flow Canadian and U.S. Production to Coastal Markets
Pipe with Firm Commitments
Proposed Pipeline
11
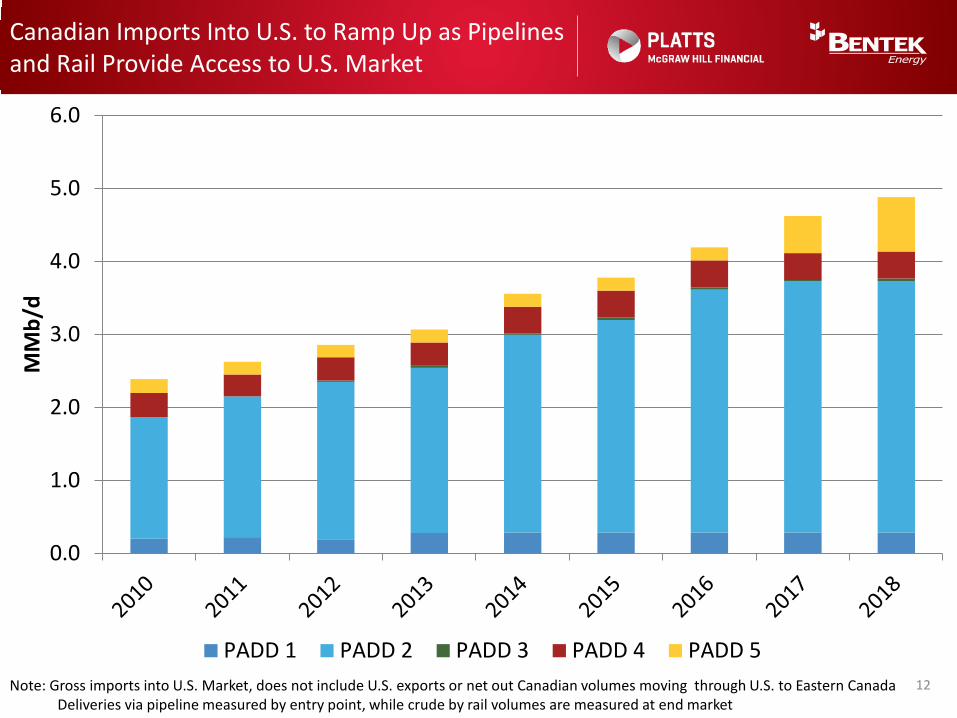
Canadian Imports Into U.S. to Ramp Up as Pipelines and Rail Provide Access to U.S. Market
0.0
1.0
2.0
3.0
4.0
5.0
6.0
MM
b/d
PADD 1 PADD 2 PADD 3 PADD 4 PADD 512 Note: Gross imports into U.S. Market, does not include U.S. exports or net out Canadian volumes moving through U.S. to Eastern Canada
Deliveries via pipeline measured by entry point, while crude by rail volumes are measured at end market

Crude by Rail Volumes Exceeding 1 MMb/d in 2013 as New CBR Loading and Unloading Stations Pop Up Everywhere Relieving Constraints
Bakken to East Can – 15 Mb/d
PADD IV to PADD I – 11 Mb/d
13

Long Haul Crude by Rail Volumes Expected to Continue to Grow Exceeding 1 MMb/d in 2014
-
200
400
600
800
1,000
1,200
1,400
2010 2011 2012 2013 2014 2015 2016 2017 2018
Mb/
d
PADD 1 PADD 2 PADD 3 PADD 5 EC
14
Note: Does Not Include Intra PADD Rail Shipments such as movements from Permian or Eagle to PADD 3 Unloading Terminals

0
1,000
2,000
3,000
4,000
5,000
6,000
7,000
8,000
9,000
2010 2011 2012 2013 2014 2015 2016 2017 2018
Mb/
d
PADD I PADD III PADD V Eastern Canada
Eastern Canada, U.S. East Coast and West Coast Light Imports to Be Fully Displaced by 2018 Due Increased Access to North American Crude Slates from Rail, Pipeline, and Water
Waterborne Imports
Source: BENTEK May 2013 Crude Oil PADD Balances 15

North American Production Putting Downward Pressure on Prices
16
($0)
($9)
$18
$18
Avg. 2012
Avg. 2018
($9)
$8
$3
($7)
Brent Premium
$17 $5
$94 $80
Source: BENTEK July 2013 Market Call: North American Crude Oil
$11 $17
($15) ($16)
16

Natural Gas

Net Change in Lower 48 U.S. Natural Gas Fundamentals from 2007 to 2012
18
7.4
12.5
(3.3) (1.7)
6.5
(1.7)
0.8 0.8 0.2
6.6
-6.0-4.0-2.00.02.04.06.08.0
10.012.014.0
Tota
l Sup
ply
Prod
uctio
n
Impo
rts f
rom
Can
ada
LNG
Dem
and
from
Pow
er
ResC
omm
Dem
and
Indu
stria
l Dem
and
Expo
rts t
o M
exic
o
Pipe
Los
s
Tota
l Dem
and
Bcf/
d
2007-2012 Fundamentals (Henry Hub Avg. - $5.14)
Net Long 0.8 Bcf/d
Source: BENTEK Cell Model

Net Change in Lower 48 U.S. Natural Gas Fundamentals from 2013 to 2018
19
12.3
14.3
(1.9) (0.0)
5.1
0.7 2.3 1.9 2.8
0.2
13.0
-4.0-2.00.02.04.06.08.0
10.012.014.016.0
Tota
l Sup
ply
Prod
uctio
n
Impo
rts f
rom
Can
ada
LNG
Dem
and
from
Pow
er
ResC
omm
Dem
and
Indu
stria
l Dem
and
Expo
rts t
o M
exic
o
LNG
Exp
orts
Pipe
Los
s
Tota
l Dem
and
Bcf/
d
Source: BENTEK Cell Model

North American Production Growth Focused in Northeast and Texas
+0.7 Bcf/d
2.6 Bcf/d
-0.2 Bcf/d
+5.6 Bcf/d +2.0
Bcf/d
+3.3 Bcf/d
-0.1 Bcf/d
+0.2 Bcf/d
Note: Forecasts Compare 2013 to 2018 (Bcf/d)
+0.2 Bcf/d
Total Increase: 14.2 Bcf/d
20 Source: Bentek Cell Model

Northeast Adds 5.2 Bcf/d by 2018
0.02.04.06.08.0
10.012.014.016.018.020.0
Bcf/
d
Total Northeast Production Forecast
N. PA Dry Marcellus SW Wet & WV Marcellus and LegacySW PA Dry Ohio Utica and Legacy
21
12.5 Bcf/d
17.7 Bcf/d

45
50
55
60
65
70
75
80
85
90
95
Bcf/
d
U.S. Supply/Demand Balance
Dry Production US Production ForecastUS Domestic Demand US Domestic Demand Forecast
Growth in Demand Not Enough: Exports Needed
9.3 Bcf/d
10.2 Bcf/d
24.7 Bcf/d
17.1 Bcf/d
22 Source: BENTEK Cell Model
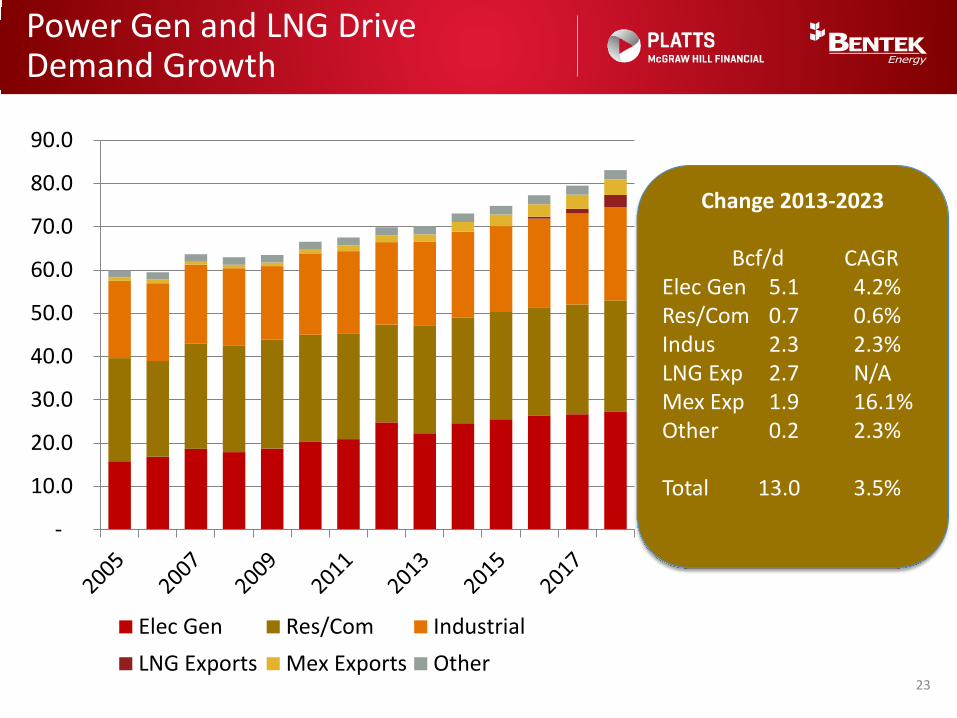
Power Gen and LNG Drive Demand Growth
-
10.0
20.0
30.0
40.0
50.0
60.0
70.0
80.0
90.0
Elec Gen Res/Com IndustrialLNG Exports Mex Exports Other
23
Change 2013-2023
Bcf/d CAGR Elec Gen 5.1 4.2% Res/Com 0.7 0.6% Indus 2.3 2.3% LNG Exp 2.7 N/A Mex Exp 1.9 16.1% Other 0.2 2.3% Total 13.0 3.5%
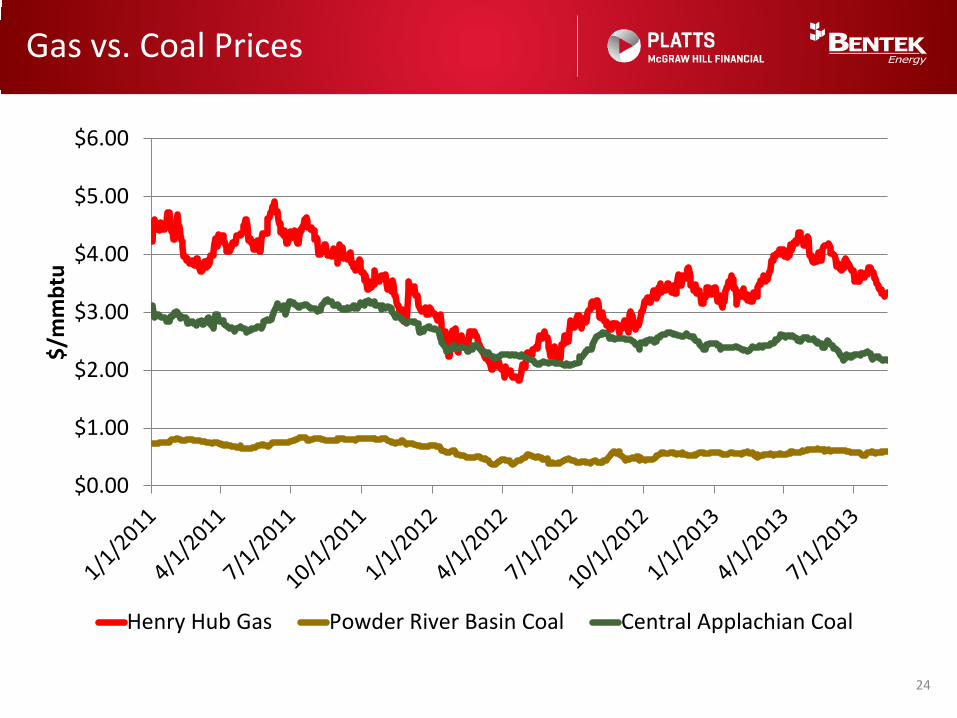
Gas vs. Coal Prices
24
$0.00
$1.00
$2.00
$3.00
$4.00
$5.00
$6.00
$/m
mbt
u
Henry Hub Gas Powder River Basin Coal Central Applachian Coal

Southeast and Texas Dominate Industrial Demand Growth
0
5
10
15
20
25
NE SE TX MCP MCM ROX SW NW25
Change 2013-2023
Bcf/d CAGR NE 0.3 2.1% SE 1.0 3.7% TX 0.3 1.4% MCP 0.0 0.9% MCM 0.6 2.8% ROX 0.1 2.8% SW 0.1 0.8% NW 0.0 0.1% Total 2.3 2.3%

Black Hole of Demand Appears
0.0
10.0
20.0
30.0 Southeast Demand Poised to Explode
LNG EXPORTS POWER RES/COM INDUSTRIAL PIPE LOSS
Southeast and Southeast Texas demand cause a demand pull attracting supply from Texas, Midcontinent and Northeast to supply new demand
Source: BENTEK Cell Model

North American LNG Export Facilities
Sabine Pass
Freeport
Lake Charles
Cameron
Cove Pt.
Existing Import + Proposed Export
Source: BENTEK
North East Exports: Cove Point – 0.75 Bcf/d (5.6 mtpa)
Gulf Coast Export Terminals: Freeport LNG– 1.76 Bcf/d (13.2 mtpa) Lake Charles – 2 Bcf/d (15 mtpa) Sabine Pass – 2.4 Bcf/d (18 mtpa) Cameron – 1.6 Bcf/d (12 mtpa)
Kitimat LNG HN DC LNG
LNG Canada
Proposed Export
Canadian Exports: DC LNG – 0.25 Bcf/d (1.8 mtpa) Kitimat LNG – 1.4 Bcf/d (10 mtpa) LNG Canada (Phase 1 ) - 1.6 Bcf/d (12 mpta)
South East Exports: Elba Island FLNG – 0.5 Bcf/d ( 4mtpa)
Elba Island
27

New Demand Projects Double Exports
28
Project Name Capacity City StateIn-Service
Date
El Paso Willcox Lateral 2013 Expansion 185 Douglas Arizona 4/1/2013El Paso Norte Crossing* 366 Clint Texas 8/1/2013El Paso Samalayuca Lateral* 237 Clint Texas 8/1/2013Kinder Morgan Mier Monterrey Expansion 275 Salineno Texas 4/1/2014TETCO South Texas Expansion 300 Reynosa Texas 6/1/2014El Paso Sierrita Pipeline** 812 Sasbe Arizona 10/1/2014Net Midstream/PEMEX -- Agua Dulce - Frontera 2,100 Reynosa Texas 11/1/2014Total Export Capacity Additions 4,275 Total U.S. Export Capacity with Expansions 9,648 * Samalayuca and Norte Crossing exports are limited to a total of 545 MMcf/d by current Samalayuca lateral capacity. **Sierrita is expected to have an initial capacity of 0.2 Bcf/d, expanding to 0.8 Bcf/d by 2016. Samalayuca presidential permit for exports is 545
Mexican Border Crossing Expansions
0.00.51.01.52.02.53.03.54.04.5
Bcf/
d
US Exports to Mexico
SW TO MEX SW TO MEX Forecast TX TO MEX TX TO MEX Forecast

East Gets Long/West Gets Short
-15-10
-505
Northeast Balance (Bcf/d)
-10
-5
0
5 Southeast Balance (Bcf/d)
02468 MCP Balance (Bcf/d)
0
5
10
15 Texas Balance (Bcf/d)
-8-6-4-20 Southwest Balance (Bcf/d)
0
5
10
15 W. Canada Balance (Bcf/d)

Natural Gas Price Forecast
30
$0.00
$1.00
$2.00
$3.00
$4.00
$5.00
$6.00
$7.00
$8.00
$9.00
$10.00
$/M
mbt
u (R
eal)
NYMEX BentekNote: Price forecast as of Aug 12, 2013
Vast increases in gas supply potential combined with ‘subsidizing’ impact of NGL production keeps gas prices low
throughout the forecast period.
Natural Gas Liquids

NGL Conclusions
• U.S. NGL production capacity to increase by 1.5 MMb/d (52%) 2013 – 2018
• Ethane will remain long 2013-2017 until new steam crackers are built with length increasing again after this period.
• Ethane production from the Williston Basin is a wild card due to demand, transportation constraints, and costs.
• U.S. demand insufficient to absorb C3+ growth and market will rely on exports to balance the market
32

NGL Supply Growth
33 Source: Bentek
-
0.5
1.0
1.5
2.0
2.5
3.0
3.5
4.0
4.5
5.0MMb/d US NGL Production from Gas Plants
PADD 1 PADD 2 PADD 3 PADD 4 PADD 5
US supply growth from gas plants expected to reach 4.9 MMb/d by 2023
PADD 1 PADD 2 PADD 3 PADD 4 PADD 5 TotalGrowth 429 492 495 32 2 1,450
% 345% 94% 29% 8% 10% 52%
Growth 2013 - 2018

Nearly 80% of U.S. NGL Production Coming from 6 Regions by 2018
Marcellus/Utica, 124
Eagle Ford, 464
Permian, 381
Anadarko, 356
Rockies, 411
Bakken, 84
Other, 1,031
2013 Production
Total Production 2.85 MMb/d
Marcellus/Utica, 552
Eagle Ford, 875
Permian, 453
Anadarko, 485
Rockies, 444
Bakken, 468
Other, 1,026
2018 Production
Total Production 4.3 MMb/d 34

Processing Plant Capacity
35
0.95
1.40
2013 2015
Bakken
SW Marcellus/Utica
Eagle Ford/Gulf Coast TX
9.94
11.8
2013 2015
3.80
8.56
2013 2015Current US gas processing capacity
~ 74 Bcf/d and set to potentially increase by 16 Bcf/d to 90 Bcf/d by end-2015
Source: Bentek NGL Facilities Databank

Fractionation Plant Capacity
36
0.03
0.06
2013 2015
Bakken
SW Marcellus/Utica
Eagle Ford/Gulf Coast TX
1.85 2.58
2013 2015
0.21
0.77
2013 2015Current US fractionation capacity
~ 2.7 MMb/d and set to nearly double to 5.3 MMb/d by end-2015
Source: Bentek NGL Facilities Databank

NGL Pipelines on the Horizon
37
By the end of 2015, could be as much as 1,178 MB/d of incremental NGL pipeline capacity into Mont Belvieu
Conway
Mont Belvieu

NGL Pipelines on the Horizon
38
Project Name Owner Capacity (MB/d)
In-Service Date
Region
Texas Express Anadarko / DCP / Enbridge / Enterprise 280 9/1/2013 Skellytown, TX to
Mont Belvieu, TX
TBD Kinder Morgan / MarkWest 200 9/1/2015 Ohio to Mont Belvieu
Bluegrass Williams & Boardwalk Joint Venture 200 9/1/2015 OH, PA to
Gulf Coast
Mariner South Lone Star NGL / Sunoco 200 3/1/2015 Mont Belvieu, TX to Nederland, TX
Sterling III ONEOK Partners 193 12/1/2013 Medford, OK to Mont Belvieu, TX
Front Range Anadarko / DCP / Enbridge 150 12/1/2013 DJ Basin, CO to Skellytown, TX
Eagle Ford Enterprise Products Partners 140 7/1/2013 La Salle County, TX to Yoakum Plant, TX
ATEX Express Enterprise Products Partners 125 3/31/2014 Houston, PA to Gulf Coast
Crosstex NGL Crosstex 77 TBA Permian, Eagle Ford, Barnett to Acadia/Ascension, LA
Mariner East MarkWest / Sunoco 70 9/1/2014 Houston, PA to Markus Hook, PA
MAPL - Rockies Segment Enterprise Products Partners 75 3/1/2014 Rockies to
Gaines County, TX
Bakken ONEOK Partners 75 9/1/2014 Williston, ND to Weld County, CO
Vantage Mistral Energy 40 12/1/2013 Williston, ND to AB, Canada
Arbuckle ONEOK Partners 15 12/1/2013 Velma, OK to Mont Belvieu, TX
Panola Expansion Enterprise Products Partners 15 11/1/2013 Cartage, TX to Mont Belvieu, TX
Source: Bentek research, company reports

NGL Demand Projects
39
Project Name/Location
Owner Ethane Capacity (MB/d)
In-Service Date
Status Region
Baytown, TX ExxonMobil 89 2017 Planned Gulf Coast Baytown, TX CP Chem 89 2017 Planned Gulf Coast Ingleside, TX OxyChem/Mexichem 36 2017 Planned Gulf Coast Westlake, LA Sasol 89 2017 Planned Gulf Coast Freeport, TX Dow Chemical 89 2018 Under Construction Gulf Coast
Point Comfort, TX Formosa 48 2018 Planned Gulf Coast Total Base Case 440
Various Others ? Speculative
Ethylene Facilities
Owner Capacity (MB/d) In-Service Date Status Region
C3 Petrochemicals 25 4Q2015 New Build TX Dow Chemical 32 2Q2015 New Build TX Enterprise Products 32 3Q2015 New Build TX Formosa Plastics 26 2Q2016 New Build TX Williams 21 2Q2016 New Build AB
PDH Facilities

NGL Demand Projects
40
Project Name Owner Capacity (MB/d)
In-Service Date
Status Region
N/A Enterprise Products 225 N/A Current TX
N/A Targa 40 N/A Current TX Galena Park Targa 60 3Q2013 Expansion TX
Galena Park II Targa 67 3Q2014 Expansion TX Patriot Targa 40 3Q 2015 Expansion TX
N/A Coastal Caverns/Vitol 90 1Q2015 New Build TX
Ingleside Occidental Chemical 150 2Q2015 New Build TX N/A Enterprise 75 2Q 2015 Expansion TX N/A Crosstex 40 3Q 2015 New Build LA
Total Export Capacity 787
Mariner South Sunoco Logistics 200? 1Q 2015 New Build TX Mariner East Sunoco Logistics 70 (E/P mix) 2H 2014 New Build PA
LPG Export Facilities

Ethane Supply/Demand
41 Source: Bentek
Ethane demand will struggle to keep pace with supply growth
*Due to lack of demand **Due to lack of infrastructure
0.0
0.5
1.0
1.5
2.0
2011 2012 2013 2014 2015 2016 2017 2018
Mb/
d
Petchem Exports Rejection Total Supply

US Ethane Rejection
42 Source: Bentek
0
50
100
150
200
250
300
350
400
2011 2012 2013 2014 2015 2016 2017 2018
MMb/d US Ethane Rejection by Region
PADD 2 PADD 1 PADD 4
Ethane rejection will be primarily in Williston and Appalachia

US Ethane Rejection - 2018
43 Source: Bentek
Ethane Rejection by Region in 2018 (Mb/d)
Vantage 40 Mb/d
Bakken 66 Mb/d 81 rejected
187 Mb/d Supply
248 Mb/d Supply
ATEX 125 Mb/d
Mariner West 50 Mb/d
Mariner East 47 Mb/d
Bluegrass 90 Mb/d
Ethane rejected due to lack of pipeline takeaway capacity
Conway
Mont Belvieu
14 cpg
6.2 cpg
Region Total Ethane
Rejection (Mb/d)
Williston 147
SW Marc/Utica 21
PADD IV 50
Total US 218
Bakken
SW Marcellus/Utica
West Rockies
East Rockies
0 rejected
50 rejected
8.9 cpg
13.8 cpg
14.5 cpg

Propane Supply/Demand
44 Source: Bentek
Propane likely oversupplied in 2014, however, assuming sufficient demand from global markets, propane exports will help rebalance the market.
0.0
0.2
0.4
0.6
0.8
1.0
1.2
1.4
1.6
1.8Mb/d US Propane Supply/Demand Balance
Res/Comm Petchem Mariner East Exports Gulf Coast Exports Total Supply

Normal Butane Supply/Demand
45 Source: Bentek
Normal butane likely oversupplied in 2014, however, assuming sufficient demand from global markets, exports will help rebalance the market.
0
100
200
300
400
500
600
700Mb/d US Normal Butane Supply/Demand Balance
Petchem Refinery Inputs Isomerization Product Supplied Exports Total Supply

Iso Butane Supply/Demand
46 Source: Bentek
Iso butane growth from gas plants to be offset by reduction in merchant isomerization supply
0
50
100
150
200
250
300
350
400
2011 2012 2013 2014 2015 2016 2017 2018
Mb/d US Iso Butane Supply/Demand Balance
Product Supplied
Octane Enhancement
Refinery Inputs
Petchem
Total Supply*
* Includes iso butane from merchant isomerization

Natural Gasoline Supply/Demand
47 Source: Bentek
Natural gasoline prices should remain strong as long as diluent demand remains healthy
-100
0
100
200
300
400
500
600
2011 2012 2013 2014 2015 2016 2017 2018
Mb/d US Natural Gasoline Supply/Demand Balance
Exports to Canada byRailExports to Canada byPipelineProduct Supplied
Refinery Inputs
Total Supply

NGL Price Forecast
48 Source: Bentek, ICE
$-
$0.50
$1.00
$1.50
$2.00
$2.50
2011 2012 2013 2014 2015 2016 2017 2018
$/gal Mont Belvieu Price Forecast
Ethane (Base Case) Propane Normal Butane Iso Butane Natural Gasoline

Q&A